
Simple and Fast Assay for Apolipoprotein E Phenotyping and Glycotyping: Discovering Isoform-Specific Glycosylation in Plasma and Cerebrospinal Fluid
Abstract
Background:
The mechanisms of how APOE ɛ4 allele (APOE4) increases the risk of Alzheimer’s disease (AD) pathology have not been fully elucidated. In cerebrospinal fluid (CSF), apoE is heavily glycosylated.
Objective:
To determine the impact of APOE genotype on the relative abundance of apoE protein isoforms and their specific glycosylation patterns in CSF and plasma via a newly developed mass spectrometric immunoassay (MSIA) assay.
Methods:
Total glycosylation and isoform-specific glycosylation were analyzed in plasma and CSF from a group of non-demented older individuals (n = 22), consisting of homozygous ɛ3 and ɛ4 or heterozygous ɛ3/ɛ4, ɛ2/ɛ3, or ɛ2/ɛ4 carriers. The glycan structures were further confirmed after treatment with sialidase.
Results:
In heterozygous individuals, the apoE3/E2, E4/E2, and E4/E3 isoform ratios were all significantly lower in plasma compared to CSF. For all individuals, a single O-linked glycan was observed in plasma, while two glycans (of the same type) per apoE were observed in CSF. The ratio of glycosylated to total apoE was greater in CSF compared to plasma for all apoE isoforms. In plasma and CSF, a trend of decreasing glycosylation was observed from apoE2 > apoE3 > apoE4. The difference in the percentage of secondary glycosylation in CSF was significantly greater in apoE4 compared to the other isoforms.
Conclusion:
The new MSIA apoE assay robustly distinguishes among apoE isoforms and glycoforms in plasma and CSF. ApoE4 is the predominant isoform and least glycosylated in CSF. Assessing apoE isoform-specific glycosylation by MSIA may help clarify brain apoE metabolism and AD risk.
INTRODUCTION
Late-onset Alzheimer’s disease (AD) is characterized by cerebral accumulation of amyloid plaques and neurofibrillary tangles consisting of insoluble protein aggregates. The major constituents of these plaques are neurotoxic amyloid-β (Aβ) protein 40 and 42 produced by amyloid-β precursor protein (AβPP) proteolysis [1, 2]. The apolipoprotein E (APOE) gene is the most important genetic factor in developing late-onset AD [3–7] depending on which of the three APOE alleles (ɛ2,ɛ3, and ɛ4) are inherited. Brain Aβ levels and Aβ plaque loads are apoE-isoform dependent [8, 9]. As such, having one copy of the ɛ4 allele increases the risk for late-onset AD by approximately three-fold, whereas two copies of ɛ4 increases the risk eight- to twelve-fold; however, there is no consensus on how the apoE4 isoform affects the pathway in AD pathogenesis [10, 11]. One possibility is by acceleration of Aβ deposition [12], or through a reduced ability to remove Aβ plaques [13, 14].
Glycosylation of a protein enzymatically adds a glycan sugar, which affects protein folding, trafficking, and cell signaling. Glycosylation has been implicated in AD pathology: the AβPP is glycosylated with an O-linked N-Acetylglucosamine-Galactose disaccharide (-GlcNAc-Gal) [15], and this glycosylation may inhibit Aβ production [16]. The tau protein, which is hyperphosphorylated in AD and forms the tangles [17], contains both N-linked and O-linked glycans: the N-glycosylation may be needed to induce hyperphosphorylation [18], while the O-linked glycosylation may act as a protective mechanism against hyperphosphorylation [19]. ApoE is also glycosylated with an O-linked N-acetylgalactosamine-Galactose disaccharide (-GalNAc-Gal), which is further modified with one or two sialic acids (Sia) [20]. The first apoE glycosylation site identified was Thr194, which is on the hinge region of apoE [21]. Subsequently, Ser290 was also identified as a glycan attachment site [22]. Additional possible glycan attachment sites have since been identified through the use of mass spectrometry (MS)-based approaches, and they include Thr8, Thr18, Ser197, Ser263, Thr289, and Ser296 [23–26]. A larger proportion of apoE is glycosylated and sialylated in cerebrospinal fluid (CSF) than in plasma [22, 27–29]. This is of interest because apoE does not cross the blood-brain barrier (BBB) [30], and its concentration in CSF (3–5 μg/mL) is lower than that in plasma (40–80 μg/mL) [31].
Very little information exists on apoE isoform glycosylation patterns and their effect on Aβ plaque brain accumulation. In only one related study using a Niemann-Pick Type C disease animal model, it was discovered that specific changes in apoE glycosylation correlate with increased Aβ42 prior to appearance of neurological abnormalities [32]. The lack of apoE glycosylation data and correlations are not surprising given the complex approaches for analyzing glycoproteins, which involved either glycan release or protein digestion. This is followed by LC-MS analysis of the resulting glycans or glycopeptides, respectively. As an example, in a recent study of apoE glycoforms by Flowers et al. [25], the approach included 16 hours of immunocapture, gel separation, 16-hours of digestion with trypsin, and LC-MS separation and detection of glycan-containing peptides. Consequently, only 4 plasma and 4 CSF unmatched samples from healthy individuals were analyzed. Similarly, Zhu et al. employed a lengthy apoE glycoprofiling method with multiple centrifugations for HDL isolation, 18 hours of trypsin digestion, and LC-MS analysis of the glycopeptides on plasma samples from 10 healthy individuals [26]. Not only are these LC-MS-based approaches complex, but they also delivered limited information: only the glycosylation sites and the carbohydrate glycan composition can be revealed from the tryptic glycopeptides, but not the total number of glycans attached per apoE molecule. More importantly, the glycosylation differences among the apoE isoforms could not be delineated. This information was lost upon protein digestion, when the tryptic peptides containing the apoE isoform-determinants (residues 112 and 158) and the tryptic peptides containing the glycans were jumbled post-digestion, while analyzing heterozygous individuals (ɛ2/ɛ3, ɛ2/ɛ4, ɛ3/ɛ4). Analysis of homozygous individuals (ɛ2/ɛ2, ɛ3/ɛ3, ɛ4/ɛ4) could yield such isoform-specific glycosylation information, but such studies have not been performed thus far. In the first two apoE glycosylation sites-identification studies, only ɛ3/ɛ3 individuals were analyzed [21, 22]; in the latest glycosylation studies, the apoE phenotypes could not be determined [25, 26], because they were undifferentiable after tryptic digestion. Hence, there is a knowledge gap in the apoE isoform-specific glycosylation and its role in AD.
Demonstrated here is a new assay that can simultaneously detect apoE isoforms and glycoforms via matrix-assisted laser desorption/ionization time-of-flight mass spectrometry (MALDI-TOF MS), following immunoaffinity enrichment of intact apoE. The new assay was also applied to a small cohort of matched plasma and CSF samples from cognitively healthy individuals at risk of AD to delineate and compare individual apoE2, apoE3, and apoE4 isoform glycosylation patterns.
MATERIALS AND METHODS
Reagents
Polyclonal goat anti-human antibody to apoE (Cat. No. 50A-G1) was obtained from Academy Biomedical (Houston, TX). Acetone (UN1090) was from JT Baker (Radnor, PA). Hydrochloric acid (HCl; AB06037), trifluoroacetic acid (TFA; AB02010), and acetonitrile (ACN; AB00120) were from AmericanBio (Natick, MA). N-methylpyrrolidinone (NMP; BP1172-4), 1,1’ Carbonyldiimidazole (97%) (CDI; 115533), phosphate buffered saline buffer (PBS; 28372), 2-(N-Morpholino)ethanesulfonic acid (MES) saline buffer (28390), and Mass Spectrometric Immunoassay (MSIA)-Tips (991CUS01) were acquired from Thermo Fisher Scientific (Waltham, MA). Tween 20 (Cat. No. P7949), sinapic acid (85429), ethanolamine (ETA; 398136), and sialidase (Neuraminidase from Clostridium perfringens, N2876-6UN) were obtained from Sigma Aldrich (St. Louis, MO).
Human samples
EDTA plasma and CSF samples from 5 individuals were used for the method development and validation, while a larger set of 22 matched human EDTA plasma and CSF samples were analyzed for the apoE isoform-specific glycosylation determination (Supplementary Table 1). Recruitment methods were directed at persons enrolled in the University of Southern California (USC) Alzheimer Disease Research Center (ADRC) ages 60 years and older. Inclusion criteria included a Clinical Dementia Rating Scale (CDR) score of 0 or 0.5. The study and procedures were approved by the Institutional Review Board of USC. All participants provided informed consent prior to enrollment in the study (USC IRB: HS-16-00888).
ApoE MSIA tips preparation
Activation and derivatization of the microcolumns inside the MSIA Tips were performed on a Multimek 96 automated 96-channels pipettor (Beckman Coulter, Brea, CA). The MSIA Tips were first rinsed with 200 mM HCl (10 aspiration/dispense cycles, 100 μL each), followed by water (10 cycles) and acetone (10 cycles). Then, the microcolumns inside the tips were activated through CDI rinses (100 mg/mL in NMP, 1000 cycles, 50 μL each), followed by two rinses with NMP (10 cycles each, 100 μL). The tips were immediately immersed into the wells of a 96-microwell microplate containing 5 μg apoE antibody/well (in 100 μL of 10 mM MES buffer), and 1000 cycles (50 μL each) were performed, allowing for antibody attachment to the activated microcolumns. This was followed by one rinse with ETA and two rinses with PBS (50 cycles each, 100 μL). Total time taken for activation and derivatization of 96 MSIA Tips was 1.5 h. The antibody-derivatized tips were stored at 4°C.
Sample preparation
Immediately prior to the apoE assay, 40 μL of plasma were mixed with 110 μL of PBS, 0.1% Tween (PBST); 200 μL of CSF were mixed with 200 μL PBST. Higher volumes of CSF were needed because apoE concentrations in CSF are approximately ten-times lower compared to plasma. For the reproducibility studies, EDTA plasma from two individuals was separated into several 40 μL aliquots and then frozen at –80°C. For the glycan structures confirmation, plasma and CSF samples were treated with sialidase: 100 μL of sialidase in PBS (1 unit) were added to 200 μL of plasma or CSF and incubated for 2 h at 37°C. Analytical samples for the apoE assay were prepared by mixing 60 μL of the sialidase-treated plasma with 90 μL PBST, and 300 μL of the sialidase-treated CSF with 100 μL PBST.
ApoE assay
The antibody-derivatized tips were mounted onto the head of the Multimek 96 pipettor and first rinsed with PBST (10 cycles, 100 μL). The tips were then immersed into the wells of a microplate containing the analytical samples (150 μL of plasma mixture and 400 μL of CSF mixture, per well), and 500 cycles (100 μL each) were performed, allowing for affinity capture of apoE from the samples. Then, one rinse with PBST (100 cycles, 100 μL) and two rinses with water (10 cycles each, 100 μL) followed, to wash off the non-specifically bound proteins from the microcolumns. To elute the captured apoE, 5 μL of MALDI matrix (20 g/L sinapic acid in 33% (v/v) ACN and 0.4% (v/v) TFA) were aspirated into each tip, pushed up and down three times, and then dispensed directly onto a 96-well formatted MALDI target. Sample spots were dried on a hot plate at 50°C.
MALDI-TOF MS detection
Bruker’s Autoflex III MALDI-TOF instrument (Bruker, Billerica, MA) was utilized to acquire linear mass spectra. The instrument was operated in positive ion mode, and mass spectra were acquired in the mass range from 7 to 70 kDa, with a 700 ns delay, 20.00 kV and 18.45 kV ion source voltages, with signal suppression of up to 7,000 Da. A total of 10,000 laser-shots were acquired and summed for each mass spectrum.
Data analysis
The mass spectra were externally calibrated using human hemoglobin peaks ([M+2H]2 +, [M+H]+, and [2M+H]+). The spectra were baseline subtracted (Convex Hull algorithm, 0.8 flatness) and smoothed (Savizky Golay algorithm, 5 m/z width, and 1 cycle) using Flex Analysis software (Bruker Daltonics). The peak intensities of all isoforms and glycoforms were measured using Zebra 1.0 software (Intrinsic Bioprobes Inc.) and tabulated in a spreadsheet. For samples from heterozygous individuals, peak intensities were measured separately for the two isoforms and their corresponding glycoforms in each mass spectrum. The intensities of all apoE peaks (unglycosylated protein and all glycoforms) were separately summed for each isoform. To obtain the percent abundance, the peak intensity of each apoE isoform-specific signal was divided by the summed intensity of all peaks for that isoform. To compare the expression levels of the three different isoforms in heterozygous individuals (ɛ2/ɛ3, ɛ2/ɛ4, ɛ3/ɛ4), the percent abundances of the unglycosylated and glycosylated apoE were summed for each isoform, and then compared by dividing one with another (e.g., apoE4 divided by apoE2 for the ɛ2/ɛ4 phenotype). To get the total glycosylation level of each isoform, the percent abundance of all glycoforms for a specific isoform was summed and then divided by the total percent abundance for that isoform. Similarly, to obtain the secondary glycosylation abundance of each isoform in CSF, percent abundances of the secondary glycosylation glycoforms were summed and divided by the total percent abundance for that isoform.
GraphPad Prism 7 was utilized for statistical analysis. Data normality was assessed by the Shapiro-Wilk test. To identify differences between plasma and CSF, paired t-test was performed at a 5% false discovery rate. To identify differences among the apoE2, apoE3, apoE4 isoforms, one-way ANOVA with post-hoc Tukey HSD (honestly significant difference) test was performed at a 5% false discovery rate.
RESULTS AND DISCUSSION
New assay for simultaneous ApoE phenotyping and glycotyping
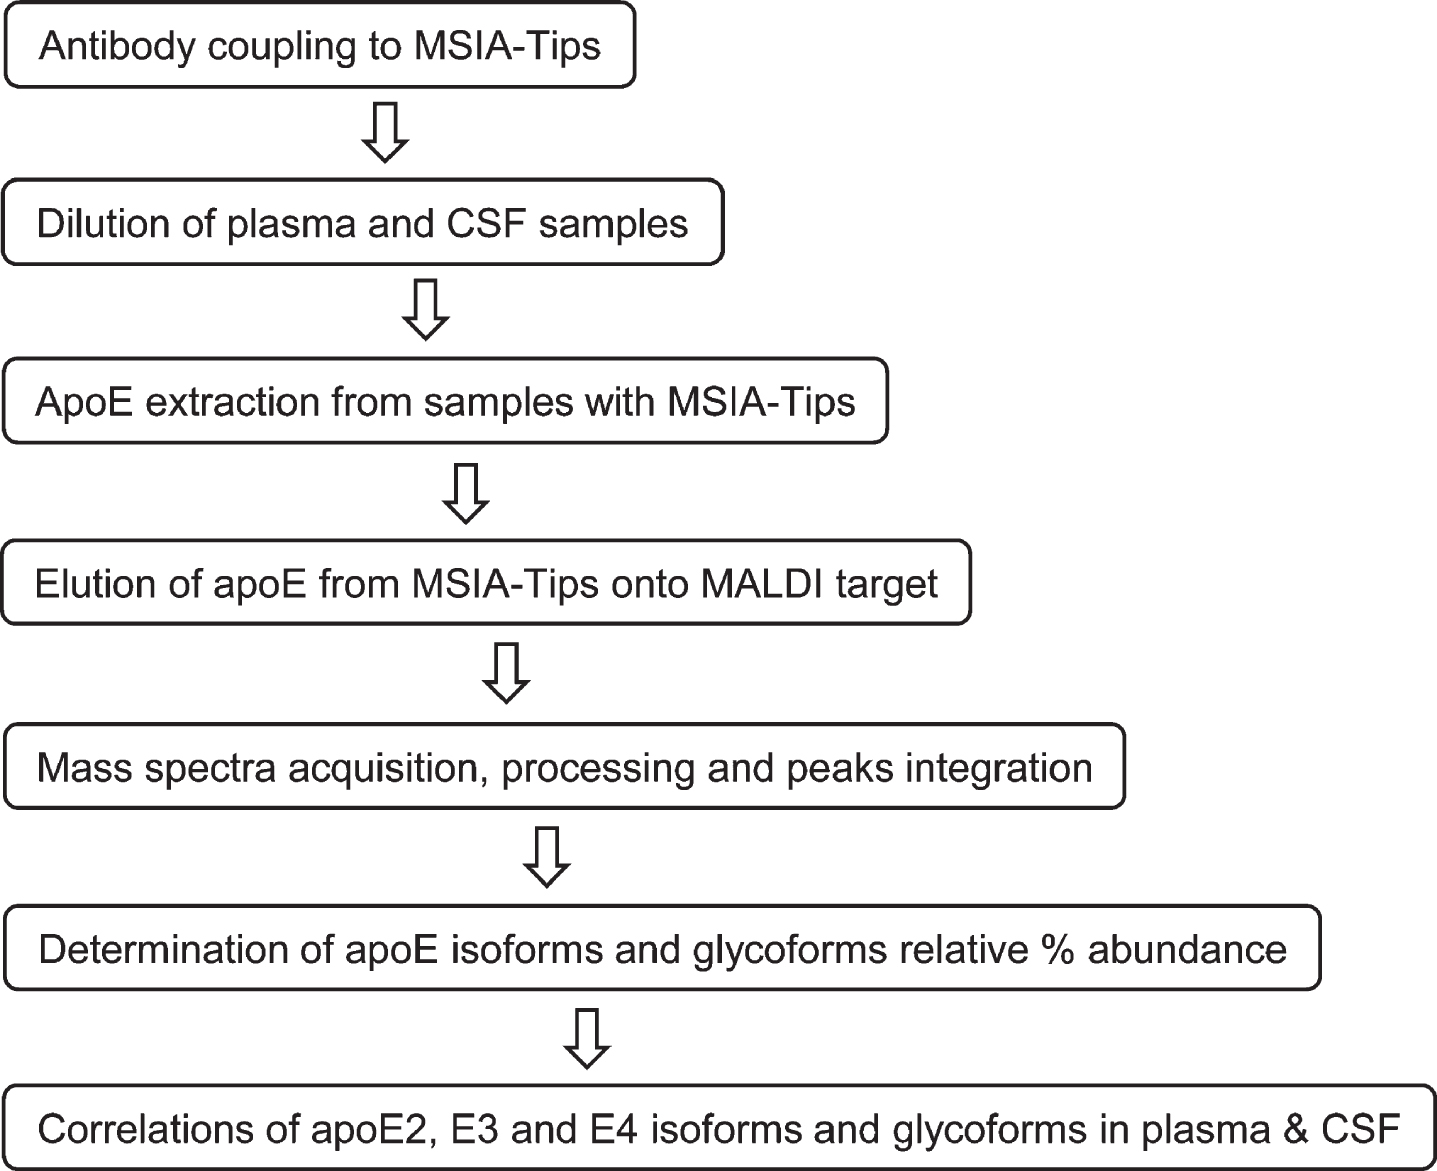
The three major apoE alleles give rise to three isoforms differing in amino acids at positions 112 and 158: E2 (Cys112, Cys158), E3 (Cys112, Arg158), and E4 (Arg112, Arg158). The three isoforms thus differ in mass by only 53 Daltons, making it challenging to differentiate them at the intact level with MALDI-TOF MS in the higher mass range (> 30 kDa). Glycosylation of apoE also adds additional complexity to glycoforms that register at slightly higher masses than unglycosylated apoE. Nevertheless, an assay was successfully developed for intact apoE analysis capable of detecting the three apoE isoforms and their glycoforms in a single mass spectrum. The assay was comprised of two steps: 1) immunocapture of apoE from samples using anti-apoE antibody immobilized within a porous microcolumn inside a pipettor tip, and 2) elution and detection of the captured intact apoE with MALDI-TOF MS. This method has been utilized for the analysis of several other proteins [33, 34]. The workflow for the assay is shown in Fig. 1.
Fig. 1
Workflow for the new apoE assay.
ApoE mass spectra resulting from the analysis of matched plasma and CSF samples obtained from two healthy individuals are shown in Fig. 2. Two major, closely spaced peaks were observed in the apoE region in the plasma sample mass spectrum from the first individual (Fig. 2a). Even though the signals were not baseline resolved, they were accurately assigned based on their measured masses as apoE3 (m/z = 34,236.6) and apoE4 (m/z = 34,289.7), indicating that the first individual is heterozygous ɛ3/ɛ4. A single major peak that corresponds to apoE4 was observed in the second individual’s plasma mass spectrum (Fig. 2c), indicative of homozygous ɛ4/ɛ4. A higher m/z signal in the mass spectrum was assigned as a single O-linked GalNAc-Gal-Sia glycan attached to apoE4 (m/z = 34946.3, labeled “a1”). This signal appeared for the ɛ3/ɛ4 individual as a doublet (Fig. 2a), because both apoE3 and the apoE4 contain the same glycan.
Fig. 2
Mass spectra resulting from the analysis of the matched plasma and CSF from a heterozygous ɛ3/ɛ4 individual (a, b) and a homozygous ɛ4/ɛ4 individual (c, d). Mass spectra after sialidase treatment of plasma and CSF samples from the ɛ4/ɛ4 individual (e, f). Matrix adduct peaks are labeled with *. For the glycan peak labeling, structure, and predicted masses, see Table 1.
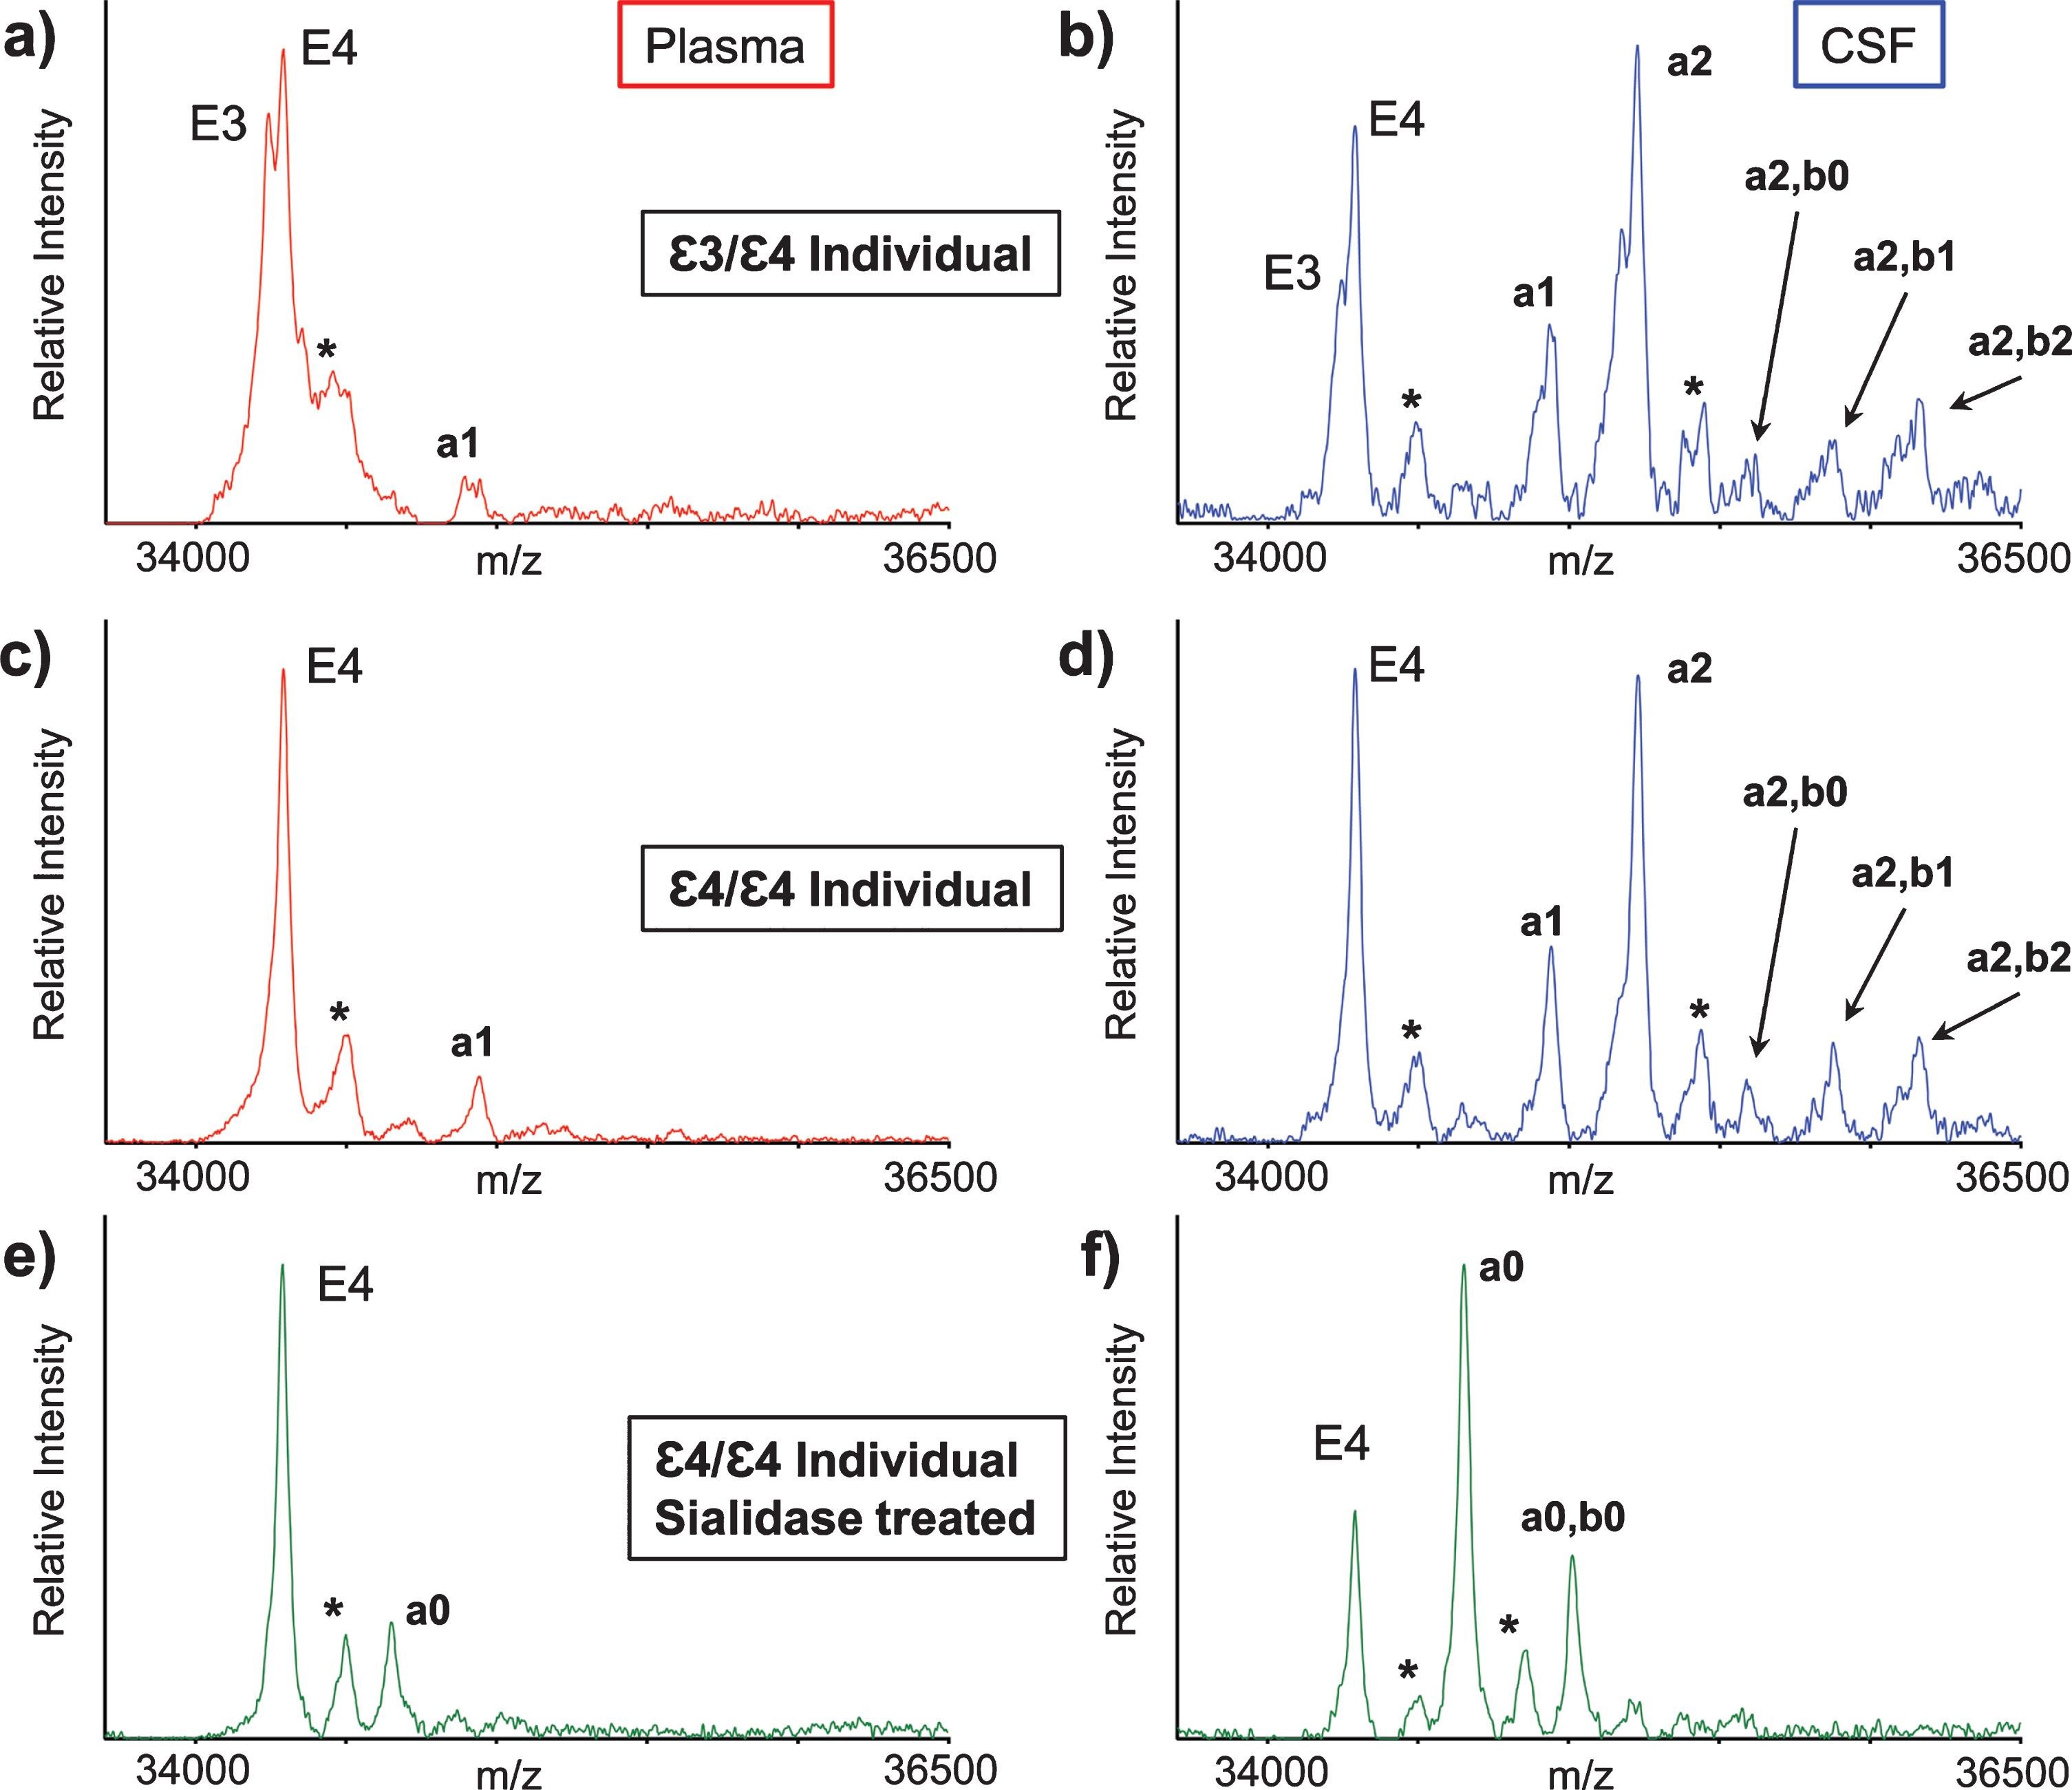
Major apoE signals were also observed in the mass spectra obtained from the CSF samples of the ɛ3/ɛ4 individual (Fig. 2b) and ɛ4/ɛ4 individual (Fig. 2d). As in plasma, the apoE4 signal was higher than the apoE3 signal, but, more importantly, there were additional signals at higher values in both CSF mass spectra that corresponded to various apoE glycoforms. The glycoforms’ signals were labeled and assigned, as shown in Table 1, based on their accurate mass determination. As with the plasma sample, the CSF glycoforms’ signals for the ɛ3/ɛ4 individual (Fig. 2b) appeared as doublets because both the apoE3 and apoE4 isoforms contained the same glycans. The larger number of high-intensity glycoforms’ signals indicated more excessive glycosylation in CSF than in plasma, as was observed previously [22, 27–29].
Table 1
A list of determined glycan structures and their masses based on MALDI-TOF MS. In the mass spectra, an observed apoE glycoform signal is the sum of the apoE isoform mass and the glycan structure mass. For the data analysis, intensities of all apoE peaks for a single isoform (unglycosylated protein and all glycoforms for that isoform) were summed for each mass spectrum. The ratios of the apoE isoforms in heterozygous samples were obtained by dividing these summed isoform peak intensities. Percent glycosylation per apoE isoform was obtained by dividing the peak intensities of all glycoforms for a specific apoE isoform by the total summed peak intensities for that isoform
| Name | Glycan Structure | Mass | Fig. Label |
| ApoE2 | N/A | 34183.6 | E2 |
| ApoE3 | N/A | 34236.6 | E3 |
| ApoE4 | N/A | 34289.7 | E4 |
| GalNAc-Gal |  | 365.34 | a0 |
| GalNAc-Gal-Sia |  | 656.60 | a1 |
| GalNAc(-Sia)-Gal-Sia | 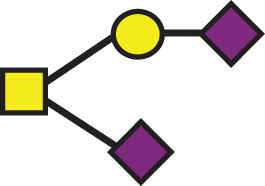 | 947.85 | a2 |
| GalNAc-Gal, GalNAc-Gal |  | 730.68 | a0, b0 |
| GalNAc(-Sia)-Gal-Sia, GalNAc-Gal | 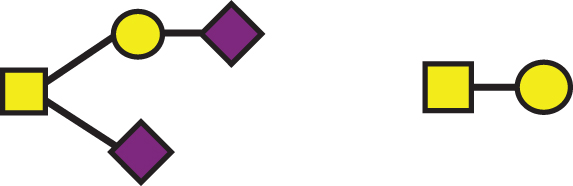 | 1313.19 | a2, b0 |
| GalNAc(-Sia)-Gal-Sia, GalNAc-Gal-Sia | 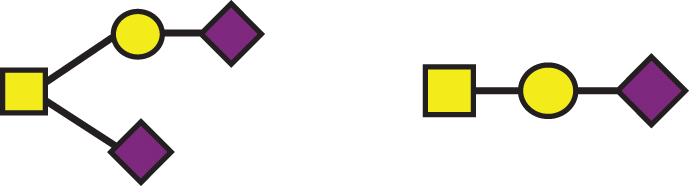 | 1604.45 | a2, b1 |
| GalNAc(-Sia)-Gal-Sia, GalNAc(-Sia)-Gal-Sia | 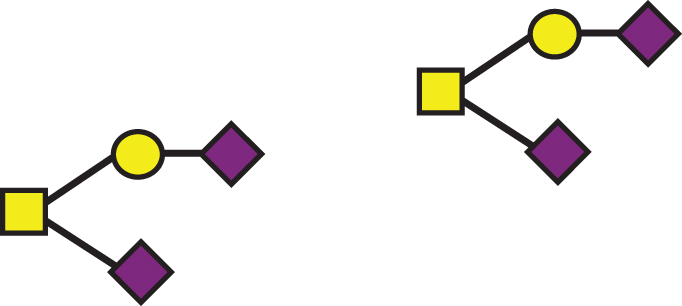 | 1895.7 | a2, b2 |
Interestingly, the glycosylated apoE peaks in CSF indicated, for the first time, the presence of two glycans per one molecule of apoE in CSF (Table 1). It is quite possible that apoE can be glycosylated at two sites at the same time since several glycosylation sites for apoE have been identified so far [23–26]. Indeed, Lee et al. have detected two glycans per one molecule of cellular and secreted apoE from primary human macrophages using two-dimensional gel electrophoresis (2DE) and MS analysis of in-gel generated tryptic glycopeptides [22]. However, 2DE-MS methods are cumbersome and lengthy (lasting over a day), and certainly not high-throughput. The presented new assay had analyzed intact apoE without the need for tryptic peptide generation, thus increasing the speed (∼1 hour) and throughput (96 samples at a time) of the analysis.
The glycan structures were confirmed by treating plasma and CSF samples with sialidase, which removes terminal sialic acid residues that are linked to other sugars in glycoproteins. The resultant mass spectra (Fig. 2e, f) revealed two new glycosylated apoE peaks corresponding to apoE4 that contained one (a0) or two (a0, b0) GalNAc-Gal disaccharides, which are not present in the original spectra (Fig. 2c, d), and only appear after the removal of the sialic acids with sialidase.
The reproducibility of the new assay was tested by analyzing plasma samples from two individuals (ɛ3/ɛ4 and ɛ4/ɛ4) on three different days (n = 3 for each individual on each day). Analyses of those samples yielded good reproducible results, with intra- and inter-assay CVs for the ɛ3/ɛ4 ratios of 1–3% and 6%, respectively. The intra- and inter-assay CVs for the glycosylation percentage were 2–12% and 6–10%, respectively (Supplementary Table 2).
Analysis of a cohort of matched plasma and CSF samples
A small cohort (n = 22) of matched plasma and CSF samples was analyzed with the new assay. The samples were obtained from non-demented older individuals, with various apoE genotypes. Based on the presence of the apoE isoform peaks in the mass spectra of both plasma and CSF, five allelic apoE combinations were confirmed in the cohort, with the following frequency: 5 ɛ2/ɛ3, 2 ɛ2/ɛ4, 5 ɛ3/ɛ3, 5 ɛ3/ɛ4, and 5 ɛ4/ɛ4. Mass spectra resulting from the analysis of matched plasma and CSF from heterozygous ɛ2/ɛ3 and ɛ2/ɛ4 individuals are shown in Supplementary Figure 1. The peak intensities for all apoE signals were measured in each mass spectrum (unglycosylated protein and glycosylated, for each apoE isoform), and the apoE isoforms’ relative ratios in heterozygous samples were determined. The glycosylation percentage of each apoE isoform for both plasma and CSF was measured and determined as well.
Relative ratios of ApoE isoforms in plasma and CSF
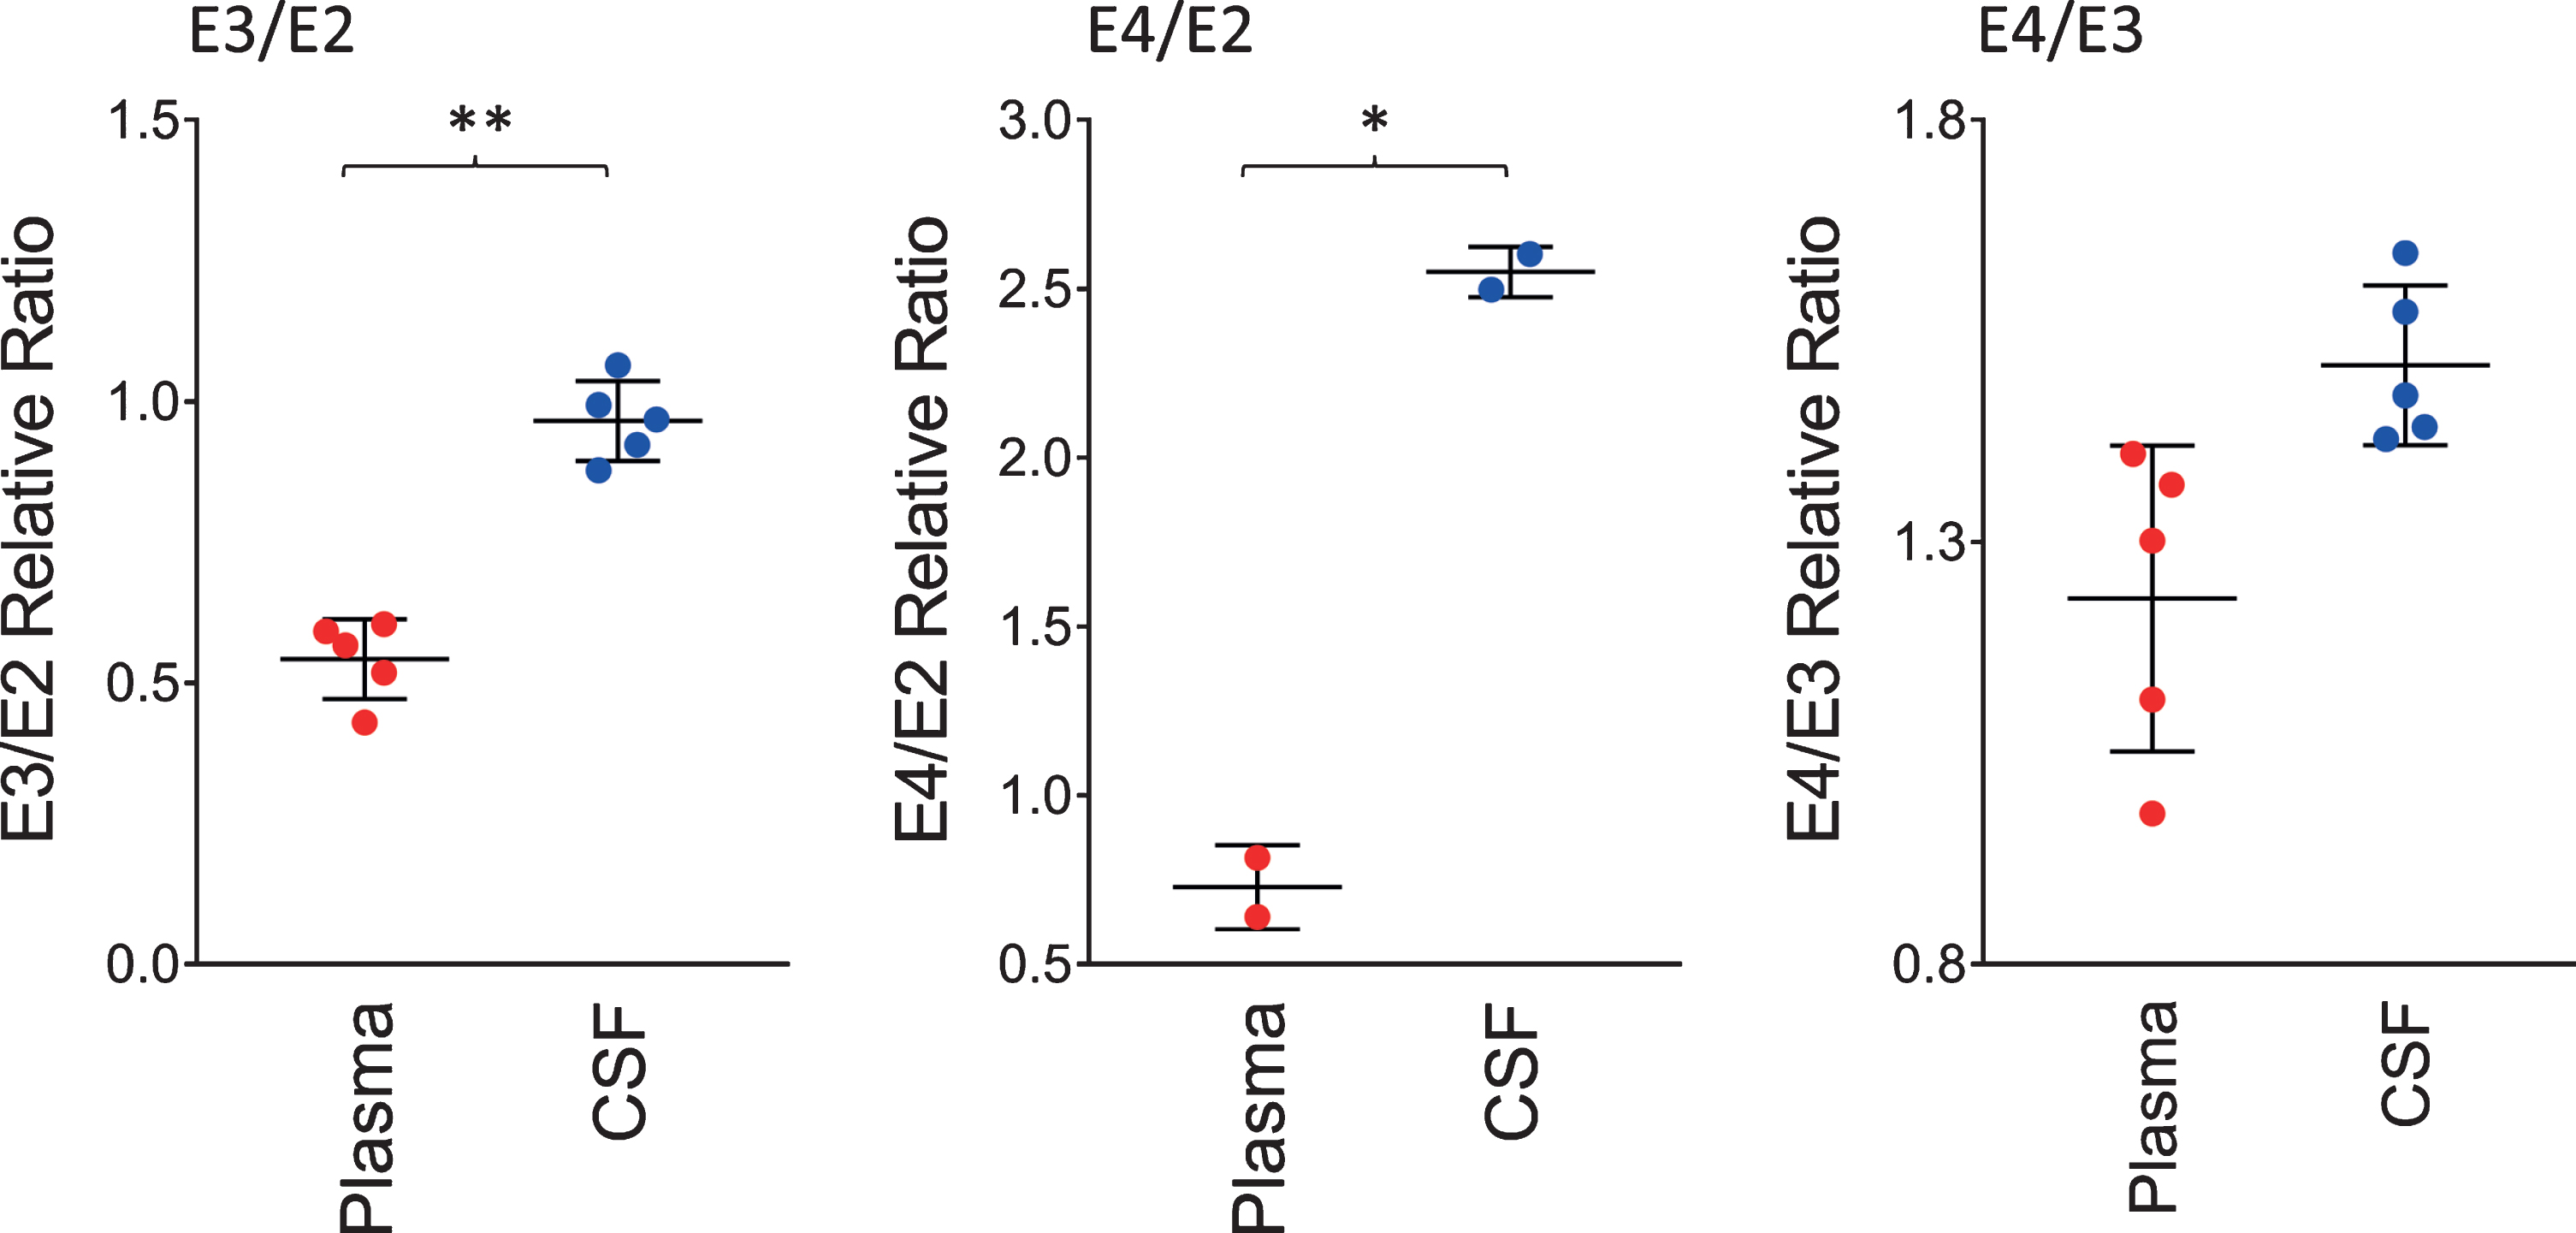
The ratios of the apoE isoforms in plasma and CSF from the heterozygous individuals in the cohort (12 out of the 22 were heterozygous) are shown in Fig. 3. These ratios were computed from the peak intensities of the apoE isoform in the mass spectra. The ratio of the E3/E2 isoforms was increased significantly in CSF with a mean±SD of 0.96±0.07 compared to plasma, 0.54±0.07 (p < 0.01). The ratios of E4/E2 and E4/E3 were also increased: for E4/E2 2.55±0.07 in CSF and 0.73±0.12 in plasma (p < 0.05); while for E4/E3, 1.51±0.09 in CSF and 1.23±0.18 in plasma (p = 0.06). These tissue-specific isoform ratios differences are consistent with previous studies [35–37]. They reflect the distinct metabolism of the apoE isoforms in the central nervous system and the periphery, as apoE does not cross the BBB [30], and its concentration in CSF is approximately ten-times lower than that in plasma [31].
Fig. 3
Relative ratios of the apoE isoforms in heterozygous individuals. The ratios were computed by dividing the total peak intensity of the isoforms; paired t-tests were performed to identify differences between plasma and CSF samples: E3/E2, p < 0.01 (**); E4/E2, p < 0.05 (*); E4/E3, p = 0.06.
Total glycosylation levels of ApoE in plasma and CSF
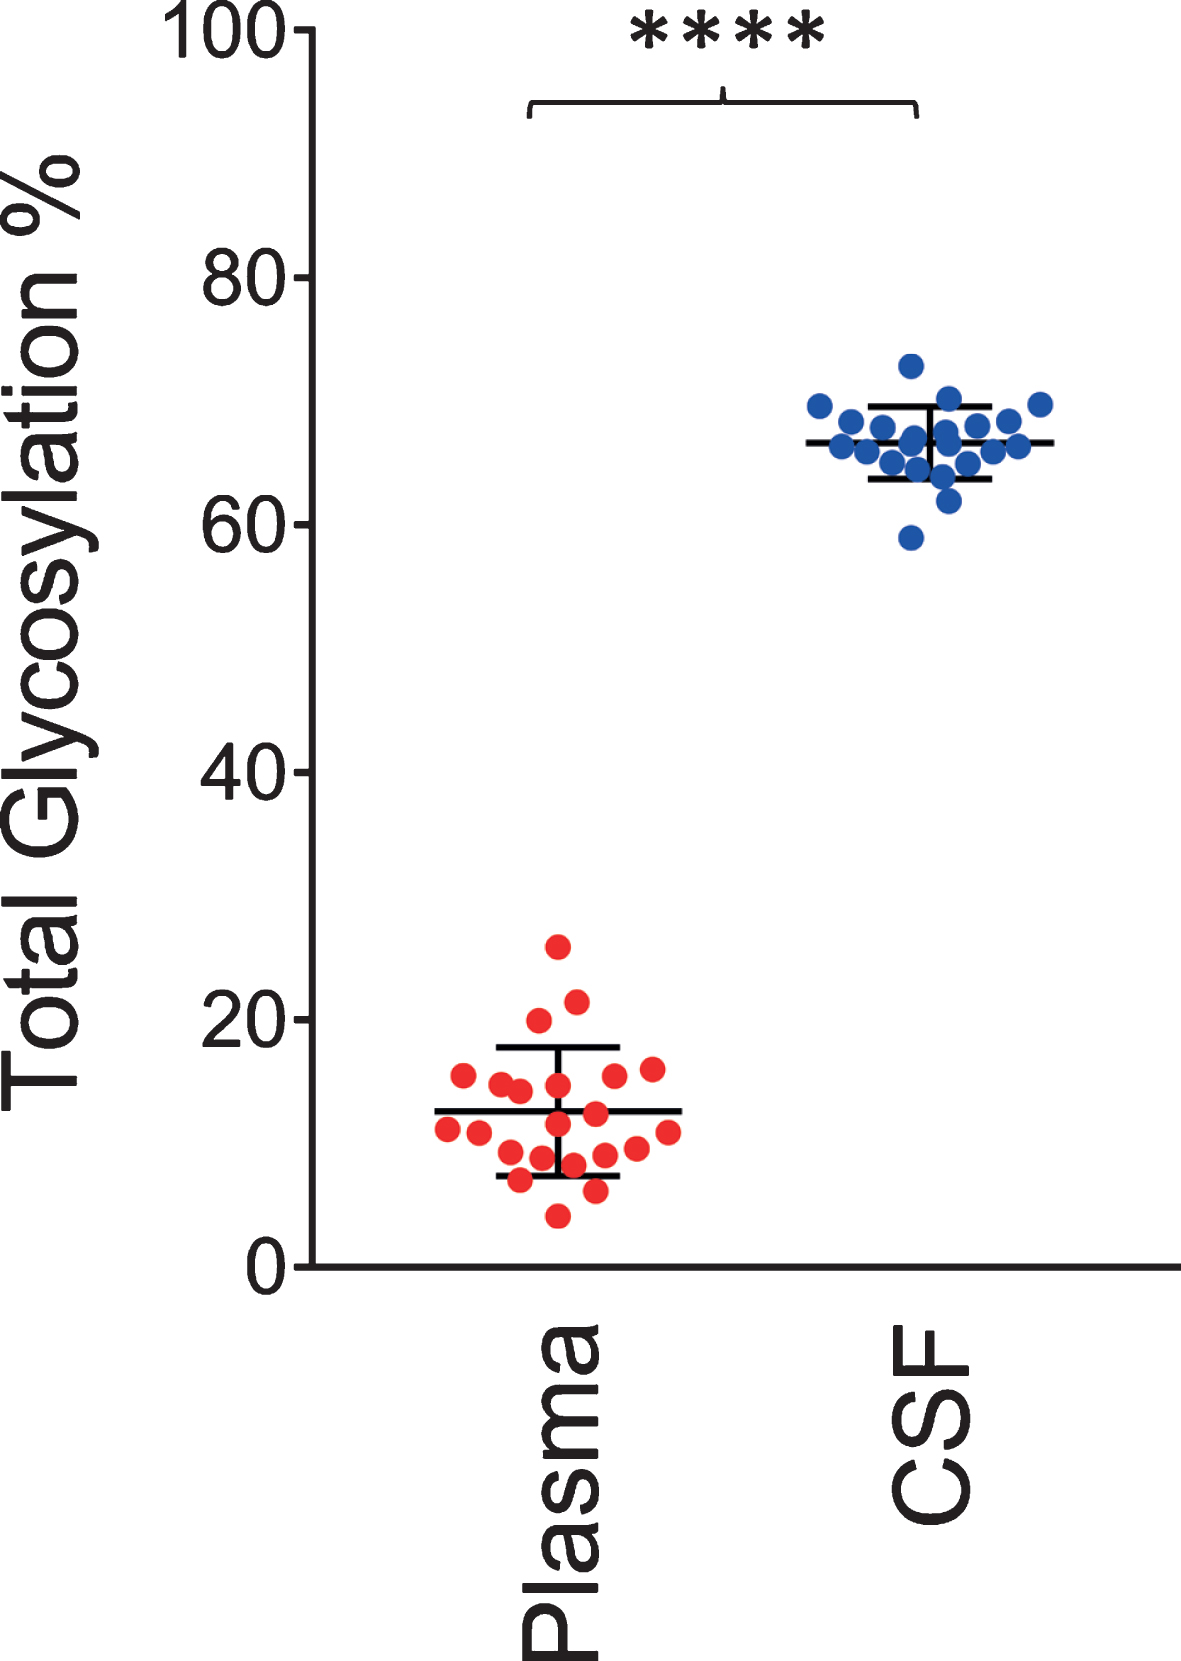
Similar to the data shown in Fig. 2, a single O-linked GalNAc-Sia-Sia apoE glycosylation was observed in plasma for all 22 individuals. In contrast, multiple glycoforms were detected in CSF, including peaks indicating simultaneous glycosylation of apoE at two sites (primary and secondary glycosylation). The total apoE glycosylation percentage was determined by summing up all the glycosylated apoE signals and dividing them by the total apoE signals (unglycosylated + glycosylated) in each spectrum for the individual plasma and CSF samples. Shown in Fig. 4 is the glycosylation percentage for all apoE isoforms in plasma and CSF. Glycosylation was much greater in CSF at 66.5±2.9%, compared to only 12.5±5.2% in plasma (p < 0.0001). Significantly higher apoE glycosylation in CSF compared to plasma has been observed in previous studies [22, 27–29], and it can be explained by the important role the terminal sialic acids have in the overall apoE function in the central nervous system, including recognition and binding to its receptors, formation of lipoproteins, and regulation of lipid delivery in neuronal tissue [38]. For example, reducing apoE sialylation reduces its binding to HDL [39].
Fig. 4
Total apoE glycosylation in plasma versus CSF. Total apoE glycosylation was computed by dividing the peak intensity of the glycosylated forms with the total apoE peak intensity; paired t-test was performed, p < 0.0001 (****).
ApoE isoform-specific glycosylation levels in plasma and CSF
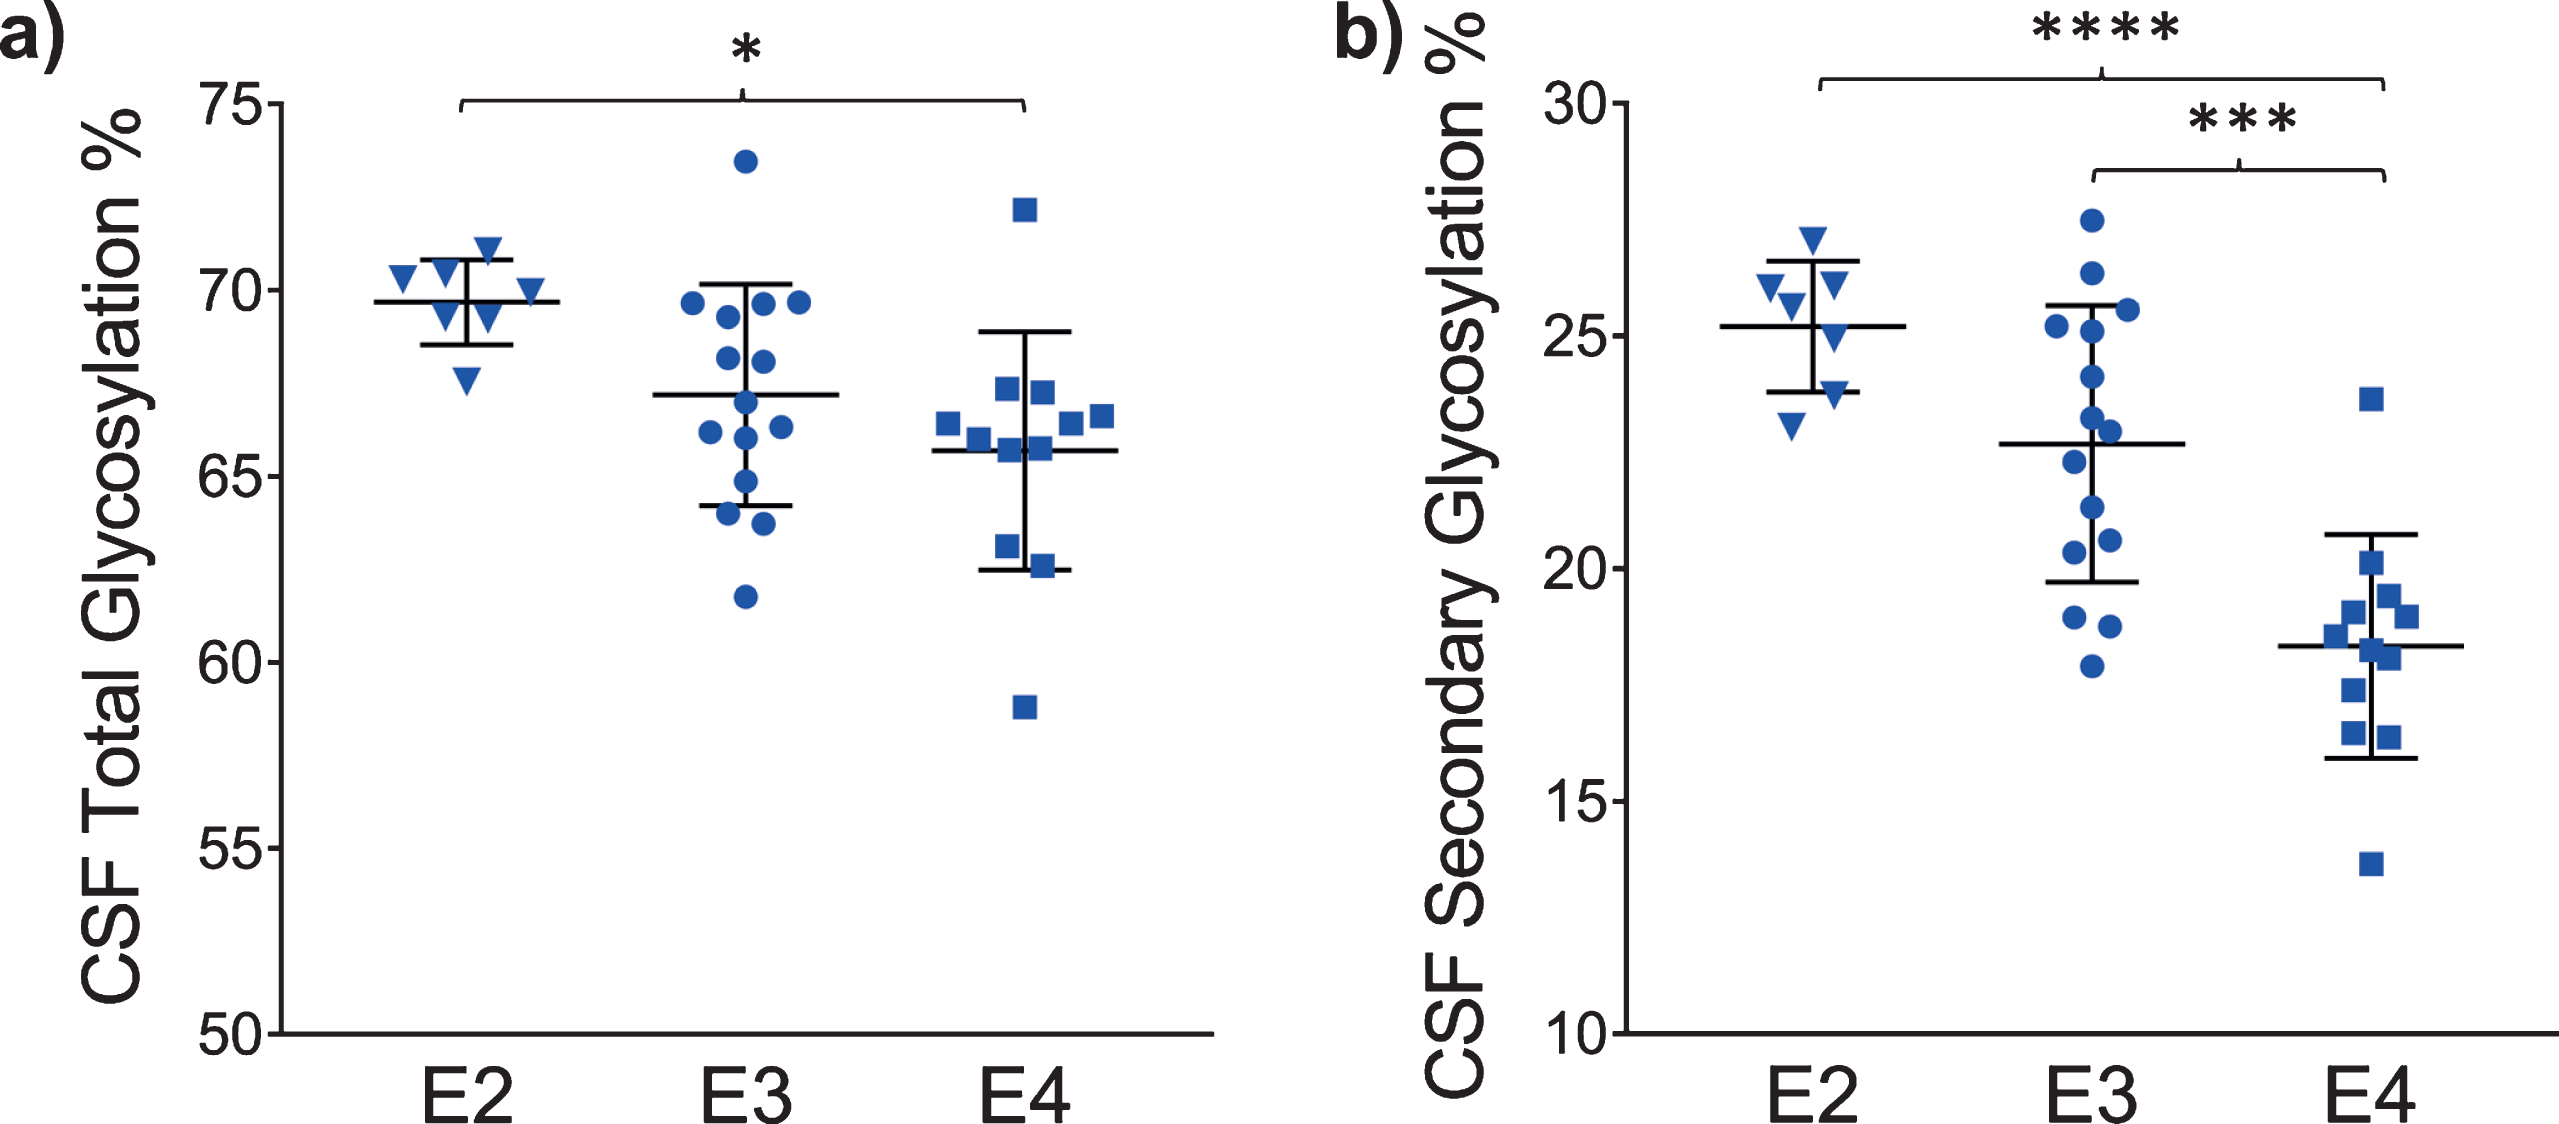
The glycosylation percentage for each apoE isoform was determined separately, which is the most innovative aspect of the new assay. Even in samples from heterozygous individuals, which present with doublet peaks in the mass spectra, peak intensities can be measured separately for each of the two isoforms present in the sample. Hence, for each sample and mass spectrum, all signal intensities coming from a single isoform (apoE2, or apoE3, or apoE4) were summed, and then the summed glycoforms’ signals were divided by the total signals for that isoform to determine the isoform-specific glycosylation percentage. The data was then grouped by isoforms (7 apoE2, 15 apoE3, and 12 apoE4), and plotted as percent glycosylation of each apoE isoform in plasma and CSF. Key differences among the three isoforms were observed: in plasma, a small trend of decreasing glycosylation was observed from apoE2 > apoE3 > apoE4 isoforms (13.7±3.5% glycosylated apoE2, 12.7±5.9% apoE3, and 9.96±4.2% apoE4) (Fig. 5). The same trend was observed in CSF when the total glycosylation was considered (both glycans counted: 69.7±1.1% glycosylated apoE2, 67.2±2.9% apoE3, and 65.7±3.2% apoE4), and it was statistically significant for apoE4 versus apoE2 (p < 0.05) (Fig. 6a). The statistical relevance increased significantly for apoE4 only when secondary glycosylation was considered (calculated from MS peaks corresponding to the “b” glycans attached): 25.2±1.4% secondary glycosylated apoE2, 22.7±2.9% apoE3, and 18.3±2.4% apoE4, with p < 0.0001 for E2 versus E4, and p < 0.001 for E3 versus E4 (Fig. 6b).
Fig. 5
Percent glycosylation by individual isoforms in plasma. ApoE isoform-specific glycosylation was computed by dividing the peak intensity of the glycosylated forms with the total apoE peak intensity for each isoform; one-way ANOVA followed by Tukey’s multiple comparison test was performed to compare different isoforms. E2 versus E3, p = 0.89; E2 versus E4, p = 0.27; E3 versus E4, p = 0.35.
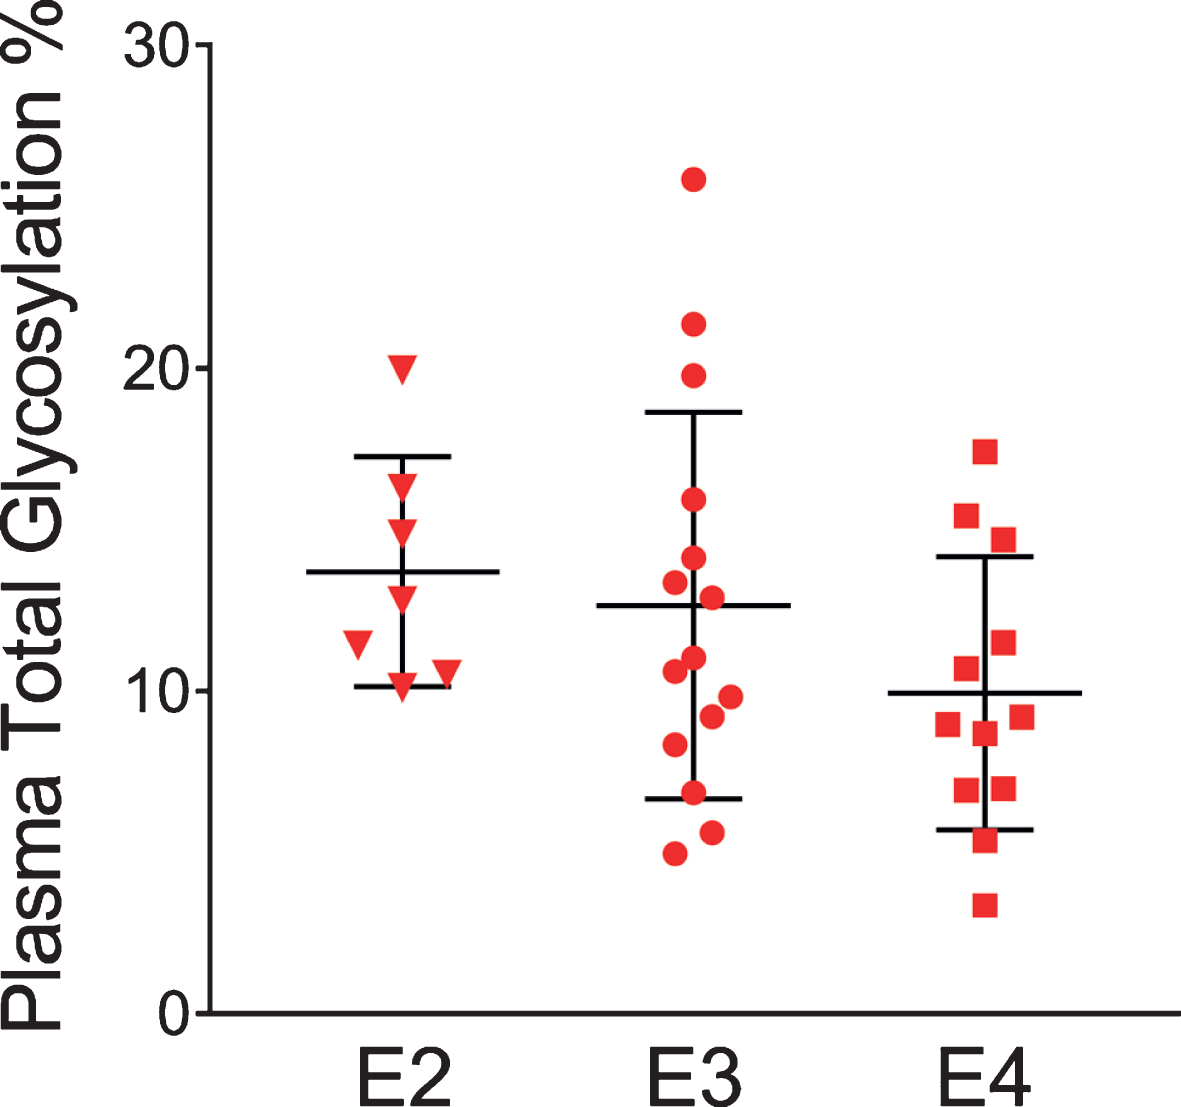
Fig. 6
Percent glycosylation by individual isoforms in CSF. ApoE isoform-specific glycosylation was computed by dividing the peak intensity of the glycosylated forms with the total apoE peak intensity for each isoform; one-way ANOVA followed by Tukey’s multiple comparison tests were performed to compare different isoforms. (a) Total glycosylation: E2 versus E3, p = 0.14; E2 versus E4, p < 0.05 (*); E3 versus E4, p = 0.36 (b) Secondary glycosylation (calculated from MS peaks corresponding to the “b” glycans attached): E2 versus E3, p = 0.09; E2 versus E4, p < 0.0001 (****); E3 versus E4, p < 0.001 (***).
Although this preliminary data is derived from a small set of samples, the observed differences in glycosylation for the three apoE isoforms are very intriguing. Structurally, the isoforms have distinct three-dimensional conformations, and these differences may influence the probability of glycan binding to apoE glycosylation residues. To understand apoE4’s role in the progression of AD, it is important to determine where the secondary site of glycosylation is and how it affects apoE4’s functions. Two arginines, one located at residue 112 and the other at 158, distinguish apoE4 from the other two isoforms. In apoE4, Arg112 interacts with Glu109 by forming a salt bridge. This orientates Arg61 towards domain interaction with Glu255, pulling the C-terminal domain (244–299) closer to the N-terminal domain in stark juxtaposition with apoE3’s open conformation [31]. It has been demonstrated that the C-terminus mediates apoE’s stability, wherein it is rich in Ser and Thr glycosylation sites that may play a key role in protection against self-association and spontaneous aggregation [22]. The NETOGlyc 4.0 Server predicts several sites for O-glycosylation in the C-terminus, including Thr289 and Ser290, and there is experimental evidence for glycosylation at these sites, plus Ser296 [22, 25, 26]. Thus, the second glycan may be attached to the C-terminus of apoE in CSF. The first (primary) glycosylation site (and the only one in plasma) is most likely at Thr194 [21]. This site is located on the hinge region of apoE, which is easily accessible to glycan attachment. It has been proposed that glycosylation at Thr194 occurs first, which is then followed in a stepwise pathway by glycosylation at the C-terminus [22, 40].
The presence of negatively charged sialic acid residues at the C-terminus may mediate/stabilize intermolecular interactions between apoE and the polar phospholipid heads of micelle [22], which would explain apoE4’s preference for VLDL particles over HDL particles, as it is unlikely to be sialylated at the C-terminus in plasma. The removal of the sialic acids decreased the binding of apoE to HDL, leading to impaired reverse cholesterol transport [39]. In another in-vitro study with fully glycosylated apoE3 and mutated apoE3 (Thr194→Ala, which had removed the glycan attachment site), the mutant apoE3 exhibited reduced binding to Aβ42 [41]. Furthermore, treatment of the fully glycosylated apoE with sialidase completely eliminated its binding avidity for Aβ42 [41]. It has been postulated that the sialic acids in apoE affect its binding to lipids, and may be involved in the formation of apoE-containing lipoprotein particles [38]. This may also be relevant to the binding of apoE to Aβ as it may contribute to the pathogenesis of AD. When apoE4 residues 166–299 were removed, the ability of apoE4 to remove Aβ was significantly decreased, resulting in intracellular Aβ42 accumulation [42]. Studies of Aβ have shown that the binding to sialic acids reduces Aβ cell toxicity [43–45]. Taken together with the current findings that apoE4 is the least glycosylated isoform, especially in CSF, it is speculated that reduced glycosylation/sialylation of apoE4 could result in reduced binding to Aβ, which in turn could lead to a reduced ability to remove the deposited Aβ plaques.
Conclusion
A new simple and fast assay was developed for intact apoE analysis using immunoaffinity enrichment and MALDI-TOF MS detection. The assay simultaneously detected the three apoE isoforms and their glycoforms in a manner that preserved isoform-specific glycosylation. The assay was employed in a study of a small cohort of individuals with matched plasma and CSF samples. There were two major findings in this study. First, the ratios of apoE isoforms differed in CSF from plasma, reflecting two distinct pools (brain and systemic) of apoE with different metabolic fates. In plasma, apoE2 had a larger relative abundance compared to apoE3; these findings are consistent with a lower fractional catabolic rate of apoE2 compared to apoE3 or apoE4 in plasma [37]. These isoform differences were not evident in CSF. Second, apoE was more glycosylated in CSF than in plasma, and glycosylation decreased from apoE2 > apoE3 > apoE4, more so in CSF than plasma. A second glycosylation site in CSF seemed to play a more prominent role in the differentiation of the three isoforms. ApoE4 is the least glycosylated isoform. We hypothesize that apoE4’s lower glycosylation status may contribute to its greater CSF abundance or altered binding to Aβ, thus providing one mechanism for its role in AD pathogenesis. Future studies should therefore evaluate if and how apoE glycosylation affects binding to surface heparin glycan, N-terminus LDL receptors, and C-terminus ABCA1 receptors. Studying the glycobiology of the apoE isoforms by MSIA may have important implications to understanding how APOE4 increases the risk of AD pathology.
ACKNOWLEDGMENTS
HY was supported by R01AG055770, R01AG067063 and R01AG054434 from the National Institute of Aging. This work was also supported by P50AG05142 (USC ADRC) from the National Institutes of Health.
Authors’ disclosures available online (https://www.j-alz.com/manuscript-disclosures/20-0203r1).
SUPPLEMENTARY MATERIAL
[1] The supplementary material is available in the electronic version of this article: https://dx.doi.org/10.3233/JAD-200203.
REFERENCES
[1] | Hardy J , Selkoe DJ ((2002) ) The amyloid hypothesis of Alzheimer’s disease: Progress and problems on the road to therapeutics, Science 297: , 353–356. |
[2] | Blennow K , de Leon MJ , Zetterberg H ((2006) ) Alzheimer’s disease, Lancet 368: , 387–403. |
[3] | Corder EH , Saunders AM , Strittmatter WJ , Schmechel DE , Gaskell PC , Small GW , Roses AD , Haines JL , Pericak-Vance MA ((1993) ) Gene dose of apolipoprotein E type 4 allele and the risk of Alzheimer’s disease in late onset families, Science 261: , 921–923. |
[4] | Strittmatter WJ , Saunders AM , Schmechel D , Pericak-Vance M , Enghild J , Salvesen GS , Roses AD ((1993) ) Apolipoprotein E: Kigh-avidity binding to beta-amyloid and increased frequency of type 4 allele in late-onset familial Alzheimer disease, Proc Natl Acad Sci U S A 90: , 1977–1981. |
[5] | Corder EH , Saunders AM , Risch NJ , Strittmatter WJ , Schmechel DE , Gaskell PC , Rimmler JB , Locke PA , Conneally PM , Schmader KE ((1994) ) Protective effect of apolipoprotein E type 2 allele for late onset Alzheimer disease, Nat Genet 7: , 180–184. |
[6] | Farrer LA , Cupples LA , Haines JL , Hyman B , Kukull WA , Mayeux R , Myers RH , Pericak-Vance MA , Risch N , van Duijn CM ((1997) ) Effects of age, sex, and ethnicity on the association between apolipoprotein E genotype and Alzheimer disease. A meta-analysis. APOE and Alzheimer Disease Meta Analysis Consortium, JAMA 278: , 1349–1356. |
[7] | Verghese PB , Castellano JM , Holtzman DM ((2011) ) Apolipoprotein E in Alzheimer’s disease and other neurological disorders, Lancet Neurol 10: , 241–252. |
[8] | Tokuda T , Calero M , Matsubara E , Vidal R , Kumar A , Permanne B , Zlokovic B , Smith JD , Ladu MJ , Rostagno A , Frangione B , Ghiso J ((2000) ) Lipidation of apolipoprotein E influences its isoform-specific interaction with Alzheimer’s amyloid beta peptides, Biochem J 348: , 359–365. |
[9] | Bales KR , Liu F , Wu S , Lin S , Koger D , DeLong C , Hansen JC , Sullivan PM , Paul SM ((2009) ) Human APOE isoform-dependent effects on brain beta-amyloid levels in PDAPP transgenic mice, J Neurosci 29: , 6771–6779. |
[10] | Kim J , Basak JM , Holtzman DM ((2009) ) The role of apolipoprotein E in Alzheimer’s disease, Neuron 63: , 287–303. |
[11] | Zhao N , Liu CC , Qiao W , Bu G ((2018) ) Apolipoprotein E, receptors, and modulation of Alzheimer’s disease, Biol Psychiatry 83: , 347–357. |
[12] | Wisniewski T , Castaño EM , Golabek A , Vogel T , Frangione B ((1994) ) Acceleration of Alzheimer’s fibril formation by apolipoprotein E in vitro, Am J Pathol 145: , 1030–1035. |
[13] | La Du MJ , Falduto MT , Manelli AM , Reardon CA , Getz GS , Frail DE ((1994) ) Isoform-specific binding of apolipoprotein E to beta-amyloid, J BiolChem 269: , 23403–23406. |
[14] | Castellano JM , Kim J , Stewart FR , Jiang H , DeMattos RB , Patterson BW , Fagan AM , Morris JC , Mawuenyega KG , Cruchaga C , Goate AM , Bales KR , Paul SM , Bateman RJ , Holtzman DM ((2011) ) Human apoE isoforms differentially regulate brain amyloid- β peptide clearance, Sci Transl Med 3: , 89ra57. |
[15] | Chun YS , Kwon OH , Chung S ((2017) ) O-GlcNAcylation of amyloid-β precursor protein at threonine 576 residue regulates trafficking and processing, Biochem Biophys Res Commun 490: , 486–491. |
[16] | Akasaka-Manya K , Kawamura M , Tsumoto H , Saito Y , Tachida Y , Kitazume S , Hatsuta H , Miura Y , Hisanaga SI , Murayama S , Hashimoto Y , Manya H , Endo T ((2017) ) Excess APP O-glycosylation by GalNAc-T6 decreases Aβ production, J Biochem 161: , 99–111. |
[17] | Šimić G , BabićLeko M , Wray S , Harrington C , Delalle I , Jovanov-Milošević N , Bažadona D , Buée L , de Silva R , Di Giovanni G , Wischik C , Hof PR ((2016) ) Tau protein hyperphosphorylation and aggregation in Alzheimer’s disease and other tauopathies, and possible neuroprotective strategies, Biomolecules 6: , 6. |
[18] | Liu F , Zaidi T , Iqbal K , Grundke-Iqbal I , Merkle RK , Gong CX ((2002) ) Role of glycosylation in hyperphosphorylation of tau in Alzheimer’s disease, FEBS Lett 512: , 101–106. |
[19] | Liu F , Iqbal K , Grundke-Iqbal I , Hart GW , Gong CX ((2004) ) O-GlcNAcylation regulates phosphorylation of tau: A mechanism involved in Alzheimer’s disease, Proc Natl Acad Sci U S A 101: , 10804–10809. |
[20] | Kockx M , Traini M , Kritharides L ((2018) ) Cell-specific production, secretion, and function of apolipoprotein, E. J Mol Med (Berl) 96: , 361–371. |
[21] | Wernette-Hammond ME , Lauer SJ , Corsini A , Walker D , Taylor JM , Rall SC ((1989) ) Glycosylation of human apolipoprotein E. The carbohydrate attachment site is threonine 194, J Biol Chem 264: , 9094–9101. |
[22] | Lee Y , Kockx M , Raftery MJ , Jessup W , Griffith R , Kritharides L ((2010) ) Glycosylation and sialylation of macrophage-derived human apolipoprotein E analyzed by SDS-PAGE and mass spectrometry: Evidence for a novel site of glycosylation on Ser290, Mol Cell Proteomics 9: , 1968–1981. |
[23] | Nilsson J , Rüetschi U , Halim A , Hesse C , Carlsohn E , Brinkmalm G , Larson G ((2009) ) Enrichment of glycopeptides for glycan structure and attachment site identification, Nat Methods 6: , 809–811. |
[24] | Halim A , Rüetschi U , Larson G , Nilsson J ((2013) ) LC-MS/MS characterization of O-glycosylation sites and glycan structures of human cerebrospinal fluid glycoproteins, J Proteome Res 12: , 573–584. |
[25] | Flowers SA , Grant OC , Woods RJ , Rebeck GW ((2020) ) O-glycosylation on cerebrospinal fluid and plasma apolipoprotein E differs in the lipid-binding domain, Glycobiology 30: , 74–85. |
[26] | Zhu C , Wong M , Li Q , Sawrey-Kubicek L , Beals E , Rhodes CH , Sacchi R , Lebrilla CB , Zivkovic AM ((2019) ) Site-specific glycoprofiles of HDL-associated ApoE are correlated with HDL functional capacity and unaffected by short-term diet, J Proteome Res 18: , 3977–3984. |
[27] | Zannis VI , vanderSpek J , Silverman D ((1986) ) Intracellular modifications of human apolipoprotein E, J Biol Chem 261: , 13415–13421. |
[28] | Pitas RE , Boyles JK , Lee SH , Foss D , Mahley RW ((1987) ) Astrocytes synthesize apolipoprotein E and metabolize apolipoprotein E-containing lipoproteins, Biochim Biophys Acta 917: , 148–161. |
[29] | Yamauchi K , Tozuka M , Hidaka H , Hidaka E , Kondo Y , Katsuyama T ((1999) ) Characterization of apolipoprotein E-containing lipoproteins in cerebrospinal fluid: Effect of phenotype on the distribution of apolipoprotein E, Clin Chem 45: , 1431–1438. |
[30] | Liu M , Kuhel DG , Shen L , Hui DY , Woods SC ((2012) ) Apolipoprotein E does not cross the blood-cerebrospinal fluid barrier, as revealed by an improved technique for sampling CSF from mice, Am J Physiol Regul Integr Comp Physiol 303: , R903–908. |
[31] | Mahley RW , Weisgraber KH , Huang Y ((2009) ) Apolipoprotein E: Structure determines function, from atherosclerosis to Alzheimer’s disease to AIDS, J Lipid Res 50: , Suppl:S183–188. |
[32] | Chua CC , Lim ML , Wong BS ((2010) ) Altered apolipoprotein E glycosylation is associated with Abeta(42) accumulation in an animal model of Niemann-Pick Type C disease, J Neurochem 112: , 1619–1626. |
[33] | Trenchevska O , Nelson RW , Nedelkov D ((2016) ) Mass spectrometric immunoassays for discovery, screening and quantification of clinically relevant proteoforms, Bioanalysis 8: , 1623–1633. |
[34] | Nedelkov D ((2017) ) Mass spectrometric studies of apolipoprotein proteoforms and their role in lipid metabolism and type 2 diabetes, Proteomes 5: , 27. |
[35] | Fukumoto H , Ingelsson M , Gårevik N , Wahlund LO , Nukina N , Yaguchi Y , Shibata M , Hyman BT , Rebeck GW , Irizarry MC ((2003) ) APOE epsilon 3/ epsilon 4 heterozygotes have an elevated proportion of apolipoprotein E4 in cerebrospinal fluid relative to plasma, independent of Alzheimer’s disease diagnosis, Exp Neurol 183: , 249–253. |
[36] | Baker-Nigh AT , Mawuenyega KG , Bollinger JG , Ovod V , Kasten T , Franklin EE , Liao F , Jiang H , Holtzman D , Cairns NJ , Morris JC , Bateman RJ ((2016) ) Human central nervous system (CNS) ApoE isoforms are increased by age, differentially altered by amyloidosis, and relative amounts reversed in the CNS compared with plasma, J Biol Chem 291: , 27204–27218. |
[37] | Blanchard V , Ramin-Mangata S , Billon-Crossouard S , Aguesse A , Durand M , Chemello K , Nativel B , Flet L , Chétiveaux M , Jacobi D , Bard JM , Ouguerram K , Lambert G , Krempf M , Croyal M ((2018) ) Kinetics of plasma apolipoprotein E isoforms by LC-MS/MS: A pilot study, J Lipid Res 59: , 892–900. |
[38] | Kawasaki K , Ogiwara N , Sugano M , Okumura N , Yamauchi K ((2009) ) Sialic acid moiety of apolipoprotein E and its impact on the formation of lipoprotein particles in human cerebrospinal fluid, Clin Chim Acta 402: , 61–66. |
[39] | Marmillot P , Rao MN , Liu QH , Lakshman MR ((1999) ) Desialylation of human apolipoprotein E decreases its binding to human high-density lipoprotein and its ability to deliver esterified cholesterol to the liver, Metabolism 48: , 1184–1192. |
[40] | Sihlbom C , van Dijk Härd I , Lidell ME , Noll T , Hansson GC , Bäckström M ((2009) ) Localization of O-glycans in MUC1 glycoproteins using electron-capture dissociation fragmentation mass spectrometry, Glycobiology 19: , 375–381. |
[41] | Sugano M , Yamauchi K , Kawasaki K , Tozuka M , Fujita K , Okumura N , Ota H ((2008) ) Sialic acid moiety of apolipoprotein E3 at Thr(194) affects its interaction with beta-amyloid(1-42) peptides, Clin Chim Acta 388: , 123–129. |
[42] | Dafnis I , Stratikos E , Tzinia A , Tsilibary EC , Zannis VI , Chroni A ((2010) ) An apolipoprotein E4 fragment can promote intracellular accumulation of amyloid peptide beta 42, J Neurochem 115: , 873–884. |
[43] | Patel D , Henry J , Good T ((2006) ) Attenuation of beta-amyloid induced toxicity by sialic acid-conjugated dendrimeric polymers, Biochim Biophys Acta 1760: , 1802–1809. |
[44] | Dhavale D , Henry JE ((2012) ) Evaluation of sialic acid-analogs for the attenuation of amyloid-beta toxicity, Biochim Biophys Acta 1820: , 1475–1480. |
[45] | Nolan W , McHale-Owen H , Bate C ((2017) ) Sialylated glycosylphosphatidylinositols suppress the production of toxic amyloid-β oligomers, Biochem J 474: , 3045–3058. |


