
KALPANA: Advanced Spectroscopic Signal Processing Platform for Improved Accuracy to Aid in Early Diagnosis of Brain Disorders in Clinical Setting
Abstract
Magnetic resonance spectroscopy (MRS) plays a substantial role in the non-invasive detection of brain neurochemicals, antioxidants, and neurotransmitters. Quantitative monitoring of these neurochemicals and neurotransmitters in the brain has a profound application for the understanding of brain disorders. Significant progress in the MR scanner as well as MR pulse sequence development to detect in vivo neurochemicals has been accomplished. The processing of MR signal from these low abundant neurochemicals/neurotransmitters should be very robust and sensitive in order to provide distinctive observations of disease-related neurochemical alterations and their absolute quantitation to aid in early clinical diagnosis. We highlight the diversity in currently available MRS processing tools, and recently introduced, KALPANA, a promising package integrating the end-to-end processing as well as robust quantitation of neurochemicals in a user-friendly approach through a graphical user interface. This further necessitates the futuristic need for advanced MRS processing pipeline and the respective readout that can help in early diagnosis and prognosis of diseases in the clinical environment.
INTRODUCTION
Dementia is the fifth leading cause of global death and according to a recent survey, the number of individuals living with dementia has doubled from 1990 to 2016 [1]. In absolute terms, about 35.6 million people are living with dementia worldwide with 7.7 million new cases added every year, with the highest estimated projections in south Asian nations such as India and China [2]. Moreover, the number of people with dementia worldwide is projected to double by 2030 and increase more than three times by 2050, with the majority in developing countries like India [3].
The average life expectancy of the Indian population has increased to 68.3 years. Hence, with the increasing elderly population, a proportionate rise in the prevalence of dementia among the elderly has reached up to 7% [4]. The World Health Organization (WHO) recognizes dementia as a public health priority and, in May 2017, WHO endorsed an 8-year global action plan emphasizing diagnosis and information for dementia, including research and innovation as one of its highlighted areas [1].
The number of elderly population is increasing rapidly, and reports of aging associated disorders are multiplying specifically due to dementia, such as Alzheimer’s disease (AD), Parkinson’s disease, frontotemporal dementia, dementia with Lewy body disease, etc. The causal process of these neurodegenerative disorders is not known yet. However, oxidative stress has been considered as one of the possible key factors [5–7]. On the other hand, the number of brain disorders with neurodevelopmental deficits such as autism spectrum disorders [8], epilepsy [3], attention deficit hyperactivity disorder [9], and psychiatric disorders such as schizophrenia [10] is increasing rapidly with increasing complexity of lifestyle. The exact cause of all these disorders is still unknown and no cure has been found yet. Neuroimaging techniques such as positron emission tomography and magnetic resonance imaging (MRI) are used on a regular basis to help in clinical diagnosis, while other modalities such as diffusion tensor imaging and functional MRI are still being investigated to identify the respective disease specific biomarkers for early diagnosis [11].
Brain metabolic changes including alterations in antioxidant levels as well as receptor modulation being the primary focus areas for brain disorders, magnetic resonance spectroscopy (MRS) is the only available non-invasive investigative tool to monitor this critical neurochemical information at an early stage. Neurodegenerative and neurodevelopmental disorders representing the two major health issues in elderly as well as young age groups, need urgent attention to identify the causal molecular processes, and MRS can help immensely in the investigation of disease specific early diagnostic markers [12]. Despite the special capabilities of MRS, it has faced limitations due to its large scan time, issues with availability of hardware, and lack of trained manpower in a multidisciplinary setting. Research to cope with these limitations requires focused innovations, development of new pulse sequences with multiple metabolite acquisition in a single shot, specific transmit/receive coil development, and expertise in the aforementioned areas. This specific domain of imaging modality needs the involvement of scientists from physical sciences, electrical and electronics as well as biomedical engineering. There are still a limited number of specialized MRS centers and sincere efforts are required to put this highly promising technology upfront, so the outcome of this technique can find applications in clinical environments like other widely used MRI techniques.
MOLECULAR DETAILS USING NON-INVASIVE MRS
MRS is extremely useful to extract information about various molecular processes using 1H MRS [13], 31P MRS [14, 15], and 13C MRS [16]. The neurochemical information from MRS is correlated with clinical condition and their quantitation to help in the generation of the receiver operating curve (ROC). ROC signifies specificity and sensitivity, an important indicator for the disease accuracy in clinical settings.
MRS PROCESSING PIPELINE: EFFECT ON QUANTITATIVE NEUROCHEMICAL MEASUREMENT
Multi-nuclear (1H, 31P, 13C, 19F, etc.) MRS from N-acetyl aspartate, choline, creatine, myo-inositol, adenosine-tri-phosphate, adenosine-di-phosphate, glucose, receptors (gamma-aminobutyric acid (GABA), glutamate, glutamine, etc.) and antioxidants (glutathione (GSH), ascorbic acid, etc.) can provide a wealth of information relating to various neurological, psychiatric, and developmental disorders [17]. There is a profound improvement of pulse sequence (e.g., DQ-Filter [18], L-COSY [19], MEGA-PRESS [20], etc.) for in vivo detection of neurochemical signals. Consequently, signal processing of a very small amplitude signal arising from these receptors due to low abundance needs utmost care while extracting information with a focused approach. The metabolic quantitation from MRS signals from the low abundance neurotransmitters is highly influenced by the choice of processing parameters, basis sets, and signal processing software. Moreover, the locally chosen processing parameters in individual software have also shown variability in the assessed metabolic outcomes.
MR signal processing packages such as GANNET [21], jMRUI [22], KALPANA [5], LCModel [23], TARQUIN [24], and MIDAS [25] are mostly being used to process MRS data at clinical centers. Among these, individual packages other than KALPANA have their dedicated data processing pipelines and restrictive application in research areas, where the comparison of individual processing schemes is also desirable. Initial efforts to check the variability of MRS data processing using various existing packages involving GANNET, jMRUI, KALPANA, LCMODEL, and TARQUIN on the selected GABA data (blinded) were reported in a recent ISMRM meeting [26]. This study also shows the variability in estimated outcomes generated from the same data.
KALPANA: MRS PROCESSING PACKAGE AND PLATFORM FOR COMPARATIVE PROCESSING ANALYSIS
The initial framework of the KALPANA package was developed in the NINS laboratory with the objective of easy handling and multi-nuclei (1 H, 31P, 19F, etc.) data processing across various types of scanners (Philips, General Electric (GE), and Siemens), KALPANA works in an unified-platform based upgradation bringing additional features later on (such as, calibration choices, relaxation time correction, and partial volume correction) for absolute quantitation. KALPANA works in the MATLAB environment (compatible with all versions after MATLAB 2014b) and uses built-in MATLAB functions that include signal/image processing toolbox for MRS signals, as well as optimization toolbox for minimizing non-linear least square functions and peak area fitting.
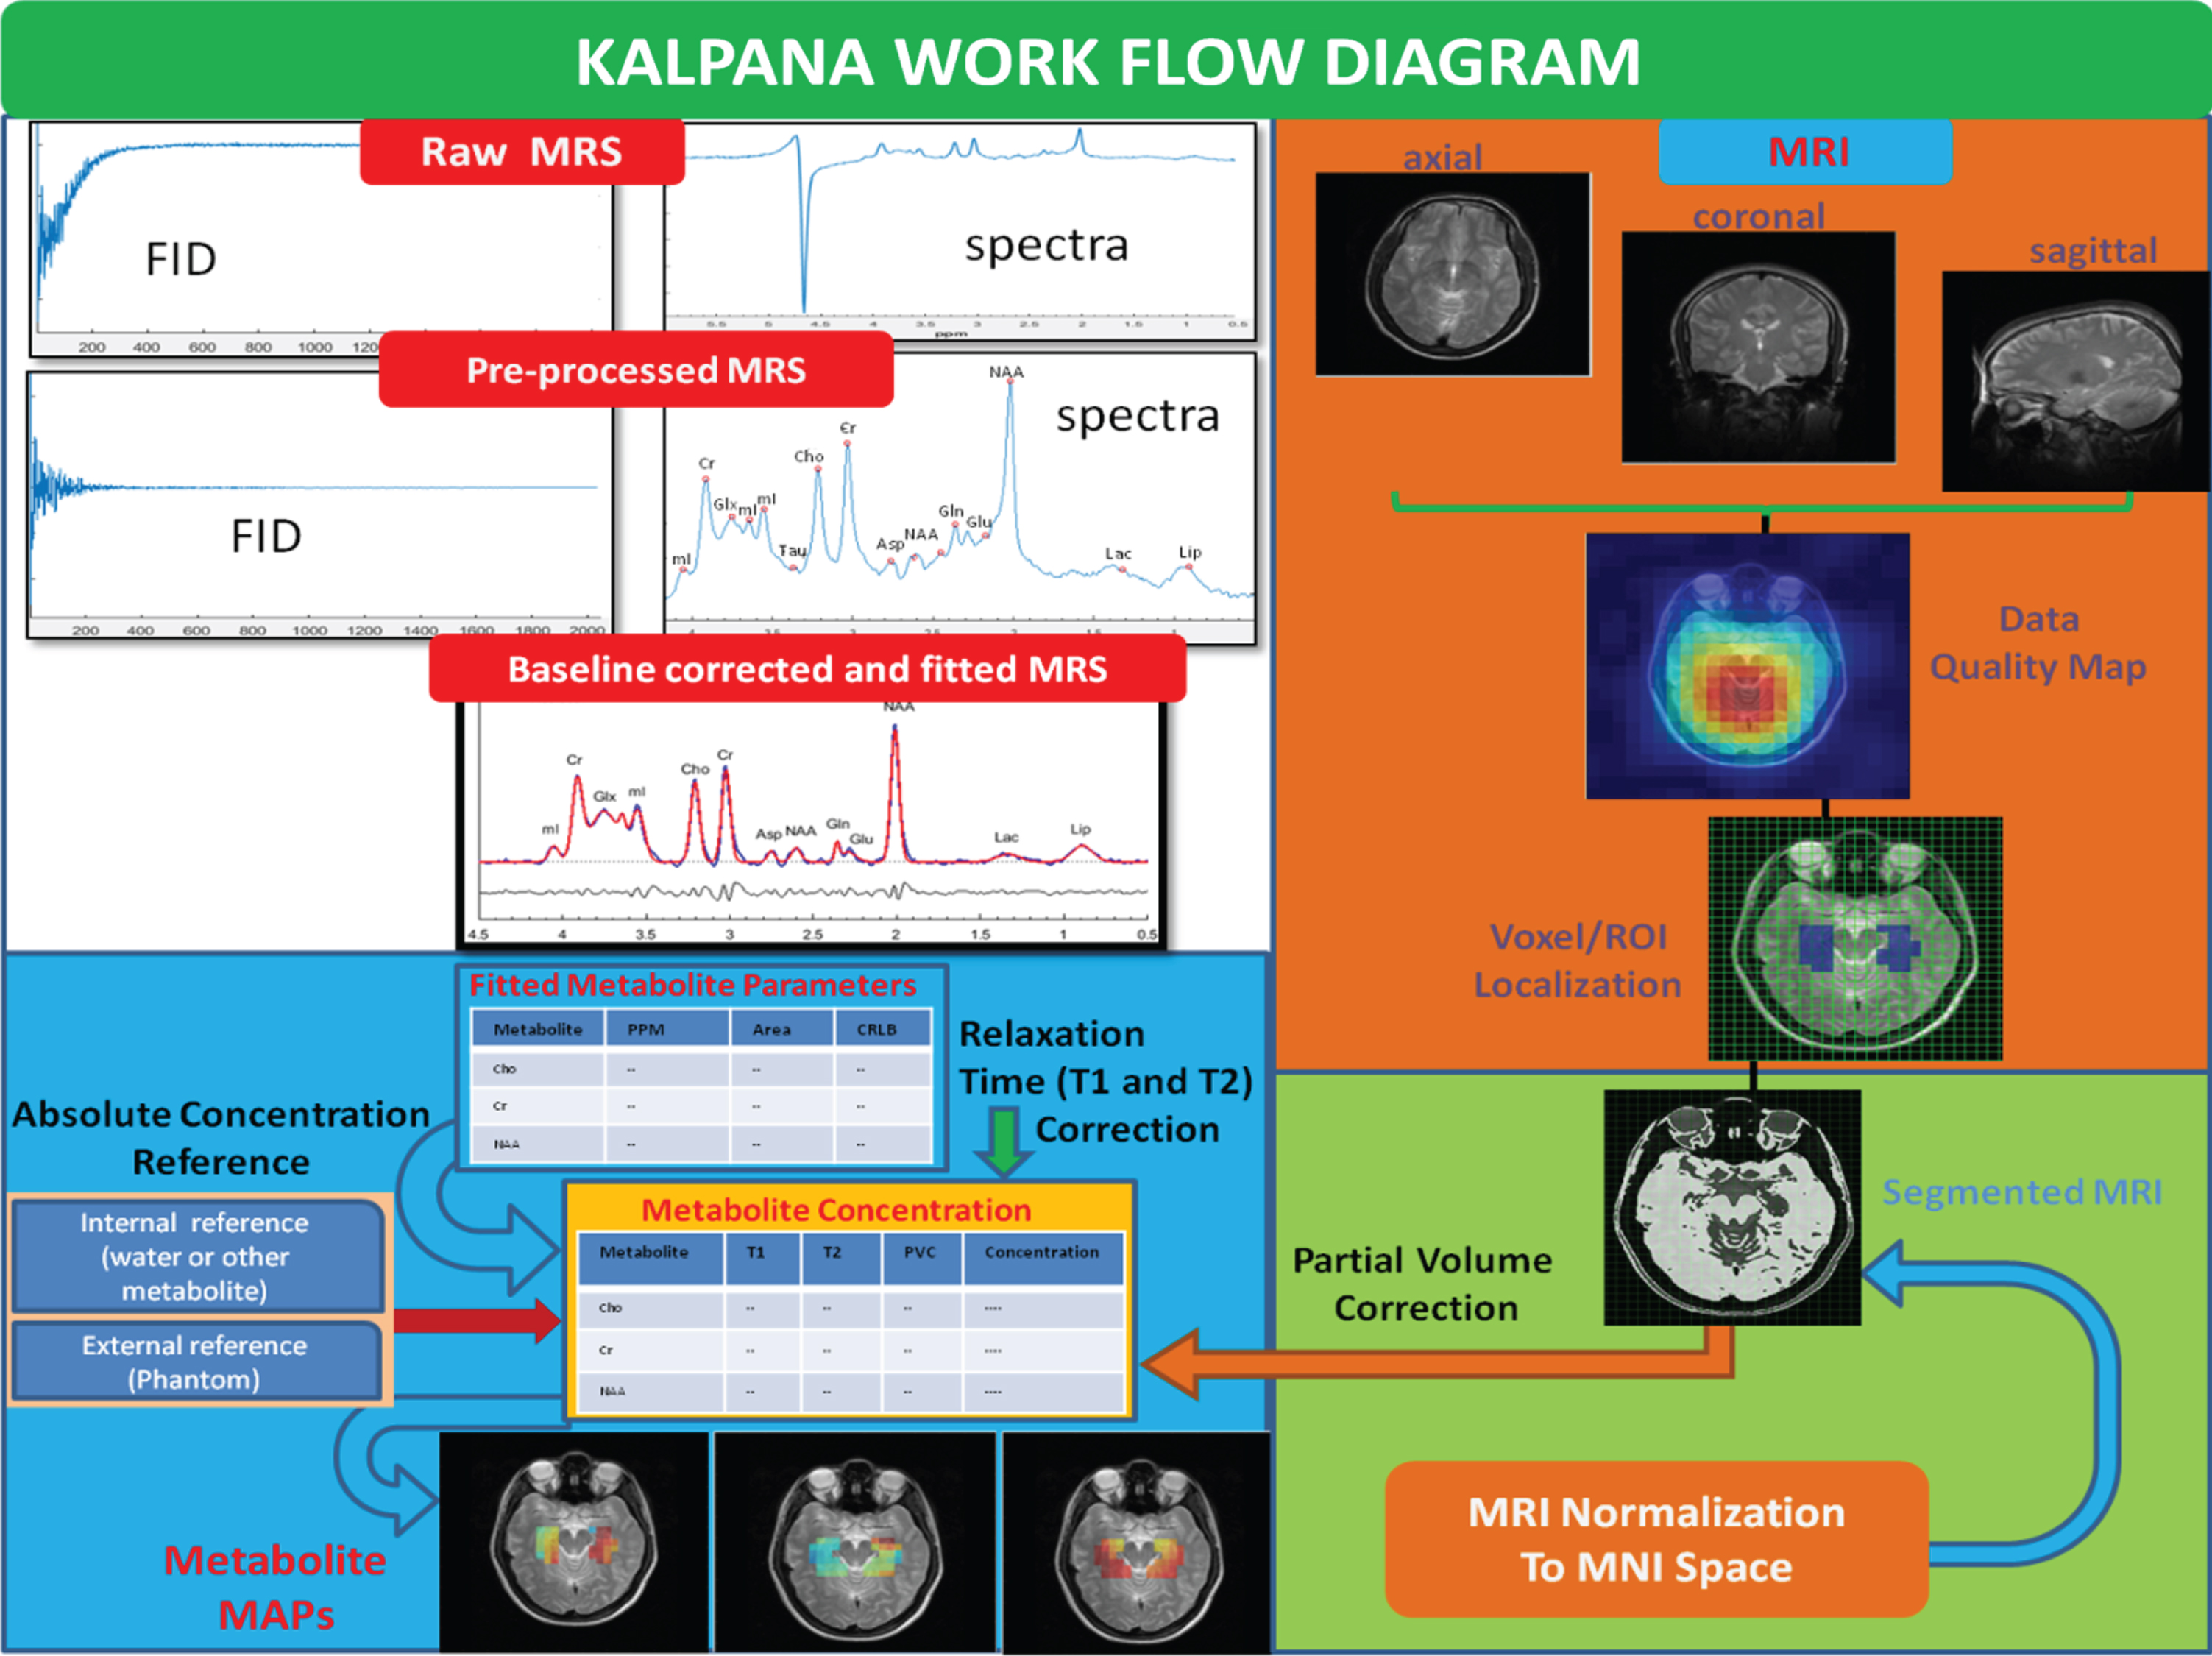
The KALPANA package is user friendly and provides a variety of processing choices to the users for the MRS signal such as eddy current compensation, initial point correction, filtering (exponential, Gaussian, Mixed), zero-filling, auto/manual peak labelling, interest peak/water/lipid suppression (HSVD, HLSVD), baseline correction (SSA, spline, wavelet), and peak fitting (TD, FD, TDFD, VARPRO) for accurate quantitation of metabolites. KALPANA implements an iterative baseline estimation and fitting approach [27] to maximize quantitation accuracy, wherein baseline estimation alternates with peak fitting until optimal peak fitting is achieved and the quality of peak fitting in terms of Cramer-Rao lower bound values is also reported. The availability of a various processing choices provides an additional advantage of comparison of the processing schematics on a single platform making KALPANA unique from the other MRS processing packages. It also has numerous post-processing features including segmentation, partial volume correction, group normalization, and absolute quantitation of the neurochemicals. An illustrative picture for the processing features of KALPANA is shown in Fig. 1. This package integrates the processing pipeline in manual and automated mode for group analysis of PRESS and edited sequence, i.e., MEGA-PRESS data obtained from Philips, Siemens, and GE scanners. It can be used to process single- and multi-voxel MRS data (1H, 31P, 19F) for a variety of purposes such as GABA quantitation, pH mapping, and antioxidant GSH quantitation [28, 29].
Fig.1
An illustrative representation of the multi-nuclei data processing, metabolic quantitation, and outputs generated using the KALPANA package.
Recently, it was discovered that the brain microenvironment has a role in modulating the conformations of GSH, a master antioxidant involved in the neutralization of the harmful radicals in the brain. GSH exists in two conformational states (extended and closed) in the brain [30, 31]. It is therefore paramount to identify novel imaging based disease biomarkers [32] involving antioxidants, neurotransmitters, and physiological parameters that can aid in identifying the causal processes of these brain disorders. Further, it can be translated into clinical practices for simplified diagnostic tests and advocating appropriate lifestyle changes to delay the onset of symptoms.
EARLY DIAGNOSIS MARKER FOR THE CONVERSION OF HEALTHY TO MILD COGNITIVE IMPAIRMENT AND PROGNOSIS OF AD USING MRS: AN URGENT NEED
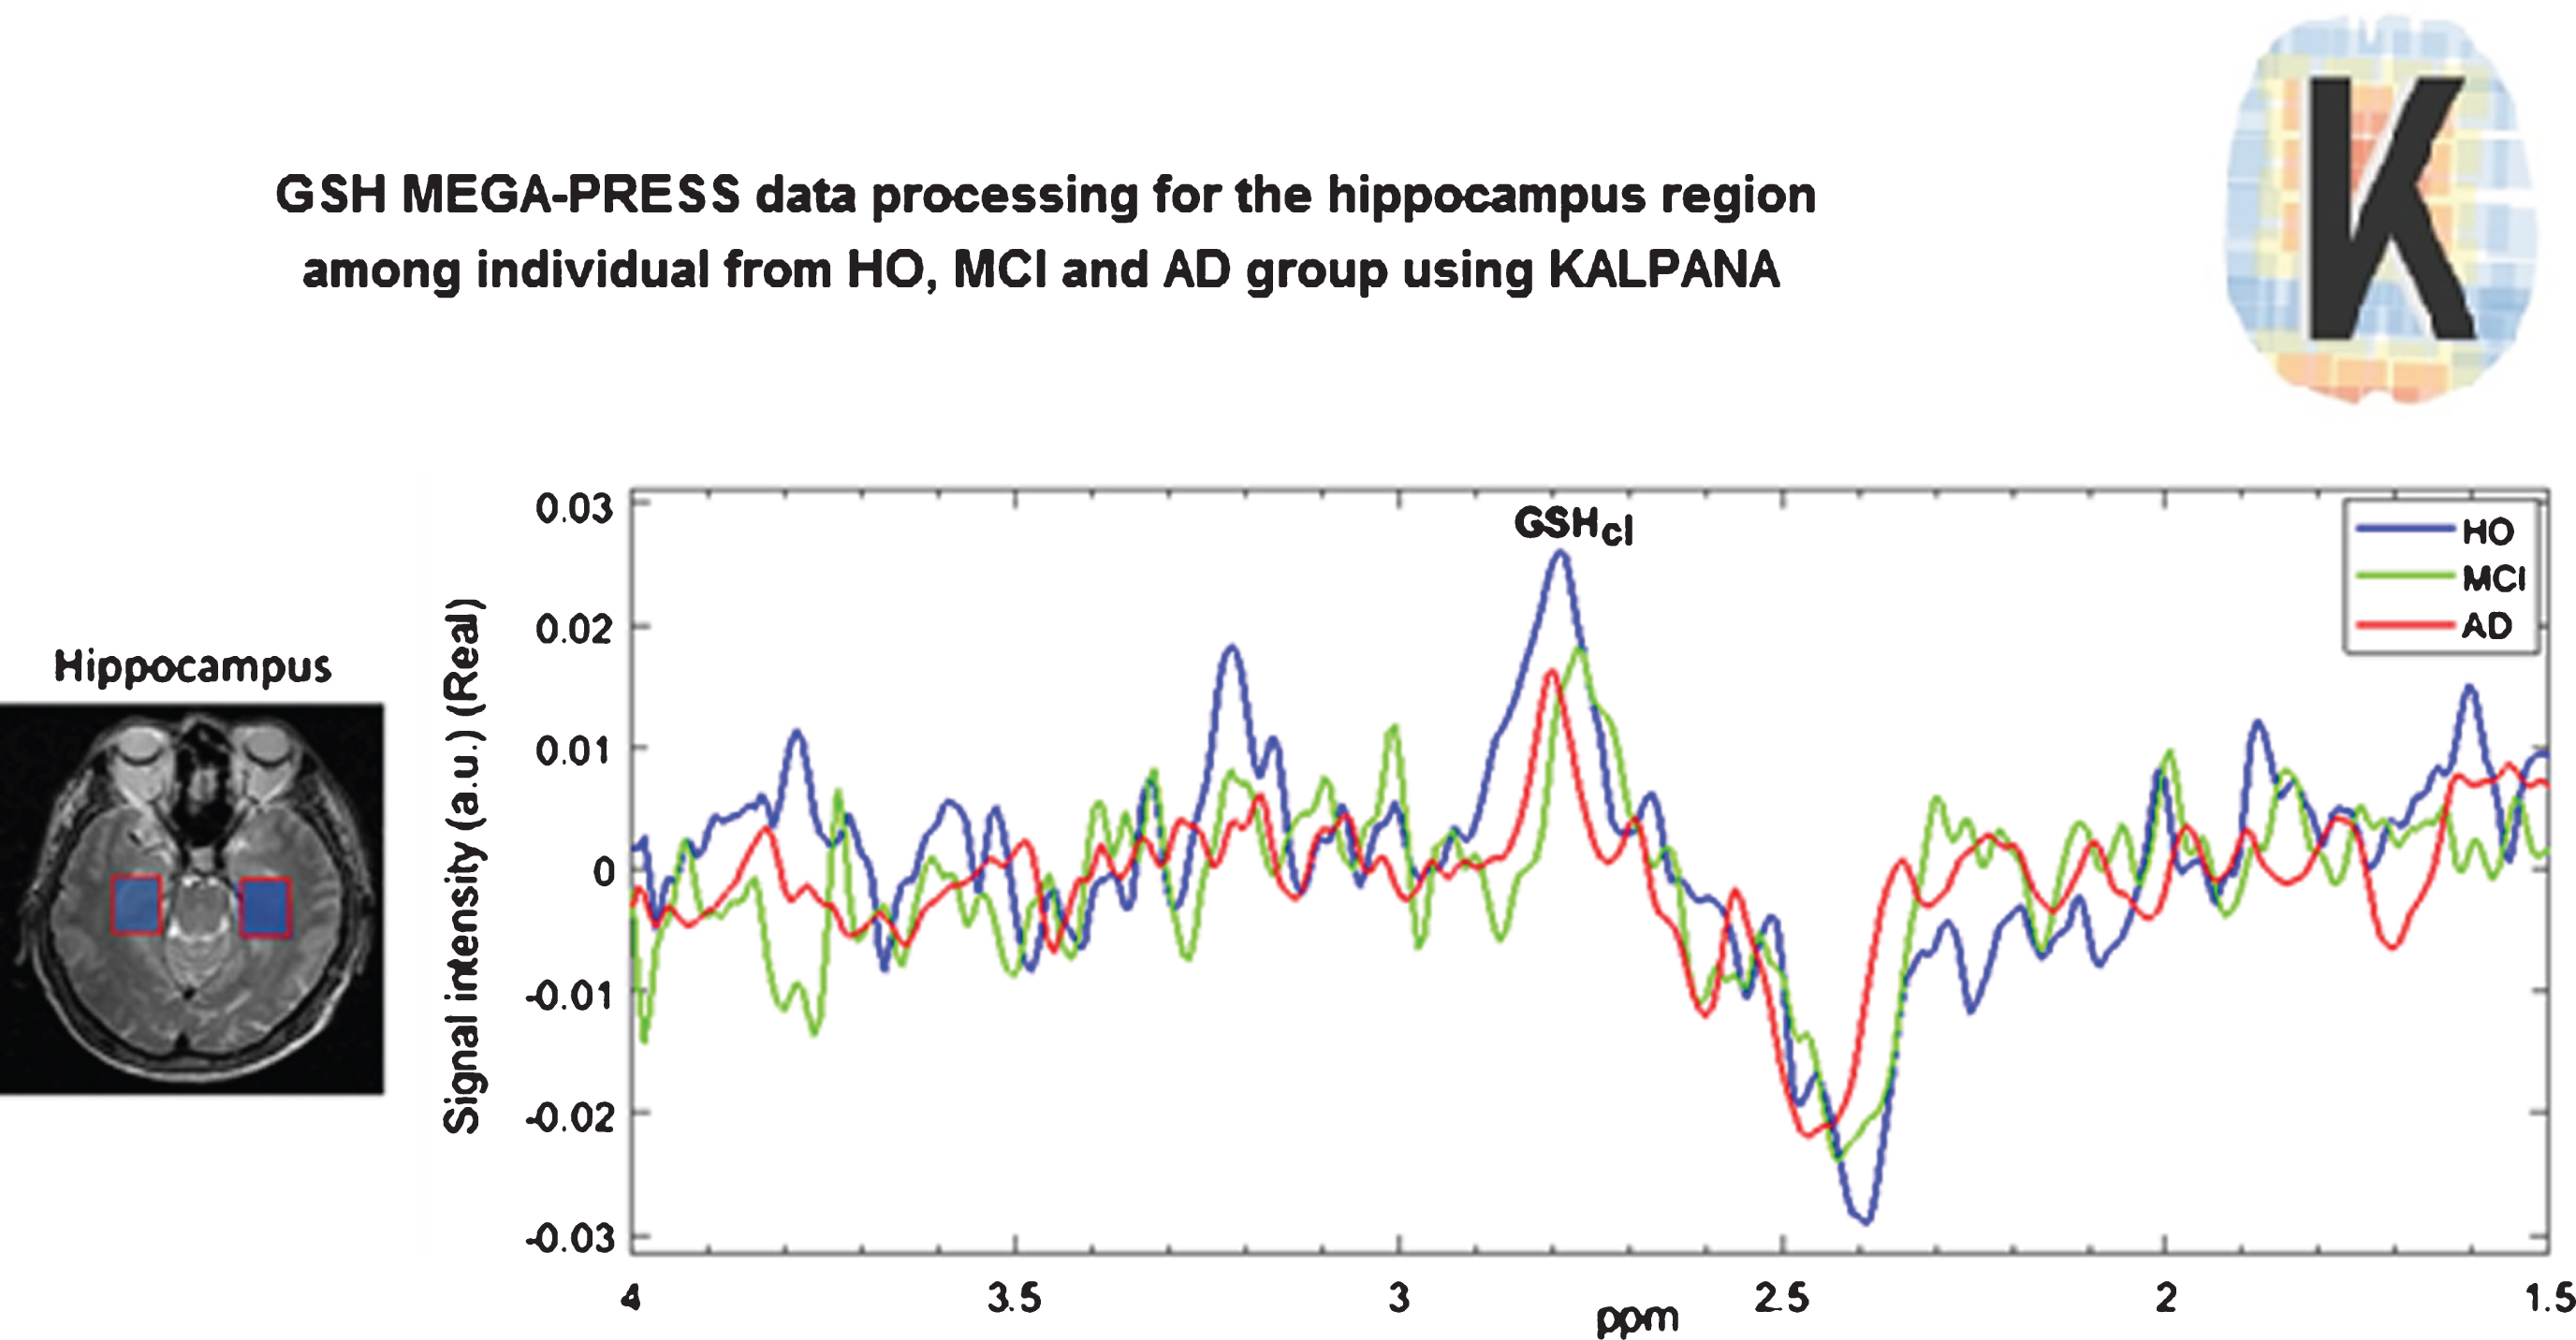
A healthy old person converts to mild cognitive impairment (MCI) when the closed form of GSH level (GSHcl) in the hippocampus is depleted significantly as reported in our earlier work [5]. When the GSHcl levelzs of the frontal cortices deplete significantly, the MCI patient converts to AD [5]. Here, we show that the transition of a normal elderly person to MCI and then AD is correlated with the depletion of GSHcl level in the hippocampus (Fig. 2). This is validated by measuring GSHcl in the frontal cortices and quantified using KALPANA. Based on the assessment of GSHcl non-invasively in the healthy old and MCI patients, the progression of disease and transition as well as prognosis can be monitored by measuring the MCI patients longitudinally. This scheme can also be extended to investigate the efficacy of the drugs on patients currently prescribed with respective medications.
Fig.2
The depletion of the closed form of GSH (GSHcl) from the hippocampal area of healthy old (marked in Blue color), MCI (marked in Green color), and AD (marked in Red color) patients. GSH data was collected using the MEGA-PRESS pulse sequence (3T Philips Scanner) at NBRC and processed using the KALPANA package.
This editorial emphasizes the critical need of an advanced signal processing tool for the standardization of metabolic quantitation and its application in identifying the diagnostic biomarkers for disease so that MRS can be utilized in a clinical setting. We are hopeful that MRS will be used as a routine tool for patient care in a few years’ time.
Web-link: Information related to the KALPANA package is available for academic use at http://www.nbrc.ac.in/newweb/research/groups/PM.
ACKNOWLEDGMENTS
Prof. Pravat K Mandal (Principal Investigator) thanks for financial support (Tata Innovation Fellowship, No.BT/HRD/01/05/2015) from the ministry of Science and Technology, Government of India, and Indo-Australian Biotechnology Fund (Grant no BT/Indo-Aus/10/31/2016) and partial support from Ministry of Electronic and Information Technology (4(5)/2019-ITEA). We dedicate this editorial in the fond memory of Mr. Bhadreswar Mandal. We are thankful to NINS members for support and NBRC for giving conducive environment for growth.
Authors’ disclosures available online (https://www.j-alz.com/manuscript-disclosures/19-1351r1).
REFERENCES
[1] | World Health Organization ((2019) ) Global action plan on the public health response to dementia 2017–2025. In Risk Reduction of Cognitive Decline and Dementia: WHO Guidelines, Geneva, World Health Organization. |
[2] | Kalaria RN , Maestre GE , Arizaga R , Friedland RP , Galasko D , Hall K , Luchsinger JA , Ogunniyi A , Perry EK , Potocnik F , Prince M , Stewart R , Wimo A , Zhang ZX , Antuono P , World Federation of Neurology Dementia Research Group ((2008) ) Alzheimer’s disease and vascular dementia in developing countries: Prevalence, management, and risk factors. Lancet Neurol 7: , 812–826. |
[3] | Bozzi Y , Casarosa S , Caleo M ((2012) ) Epilepsy as a neurodevelopmental disorder. Front Psychiatry 3: , 19. |
[4] | Ferri CP , Prince M , Brayne C , Brodaty H , Fratiglioni L , Ganguli M , Hall K , Hasegawa K , Hendrie H , Huang Y , Jorm A , Mathers C , Menezes PR , Rimmer E , Scazufca M , Alzheimer’s Disease International ((2005) ) Global prevalence of dementia: a Delphi consensus study. Lancet 366: , 2112–2117. |
[5] | Mandal PK , Saharan S , Tripathi M , Murari G ((2015) ) Brain glutathione levels–a novel biomarker for mild cognitive impairment and Alzheimer’s disease. Biol Psychiatry 78: , 702–710. |
[6] | Mandal PK ((2012) ) In vivo proton magnetic resonance spectroscopic signal processing for the absolute quantitation of brain metabolites. Eur J Radiol 81: , e653–e664. |
[7] | Markesbery WR ((1997) ) Oxidative stress hypothesis in Alzheimer’s disease. Free Radic Biol Med 23: , 134–147. |
[8] | Mikhail AG , King BH ((2001) ) Autism spectrum disorders: update of evaluation and treatment. Curr Psychiatry Rep 3: , 361–365. |
[9] | Vaidya CJ ((2012) ) Neurodevelopmental abnormalities in ADHD. Curr Top Behav Neurosci 9: , 49–66. |
[10] | Ohrmann P , Siegmund A , Suslow T , Spitzberg K , Kersting A , Arolt V , Heindel W , Pfleiderer B ((2005) ) Evidence for glutamatergic neuronal dysfunction in the prefrontal cortex in chronic but not in first-episode patients with schizophrenia: a proton magnetic resonance spectroscopy study. Schizophr Res 73: , 153–157. |
[11] | Staffaroni AM , Elahi FM , McDermott D , Marton K , Karageorgiou E , Sacco S , Paoletti M , Caverzasi E , Hess CP , Rosen HJ , Geschwind MD ((2017) ) Neuroimaging in dementia. Semin Neurol 37: , 510–537. |
[12] | Mandal PK , Tripathi M , Sugunan S ((2012) ) Brain oxidative stress: detection and mapping of anti-oxidant marker ‘Glutathione’ in different brain regions of healthy male/female, MCI and Alzheimer patients using non-invasive magnetic resonance spectroscopy. Biochem Biophys Res Commun 417: , 43–48. |
[13] | Pettegrew JW , Panchalingam K , Hamilton RL , McClure RJ ((2001) ) Brain membrane phospholipid alterations in Alzheimer’s disease. Neurochem Res 26: , 771–782. |
[14] | Petroff OA , Prichard JW , Behar KL , Alger JR , den Hollander JA , Shulman RG ((1985) ) Cerebral intracellular pH by 31P nuclear magnetic resonance spectroscopy. Neurology 35: , 781–788. |
[15] | Mandal PK , Akolkar H , Tripathi M ((2012) ) Mapping of hippocampal pH and neurochemicals from in vivo multi-voxel 31P study in healthy normal young male/female, mild cognitive impairment, and Alzheimer’s disease. J Alzheimers Dis 31: (Suppl 3), S75–S86. |
[16] | Sailasuta N , Robertson LW , Harris KC , Gropman AL , Allen PS , Ross BD ((2008) ) Clinical NOE 13C MRS for neuropsychiatric disorders of the frontal lobe. J Magn Reson 195: , 219–225. |
[17] | Mandal PK ((2007) ) Magnetic resonance spectroscopy (MRS) and its application in Alzheimer’s disease. Concepts Magn Reson Part A Bridg Educ Res 30: , 40–64. |
[18] | Trabesinger AH , Weber OM , Duc CO , Boesiger P ((1999) ) Detection of glutathione in the human brain in vivo by means of double quantum coherence filtering. Magn Reson Med 42: , 283–289. |
[19] | Thomas MA , Yue K , Binesh N , Davanzo P , Kumar A , Siegel B , Frye M , Curran J , Lufkin R , Martin P , Guze B ((2001) ) Localized two-dimensional shift correlated MR spectroscopy of human brain. Magn Reson Med 46: , 58–67. |
[20] | Terpstra M , Tkac I , Rao R , Gruetter R ((2006) ) Quantification of vitamin C in the rat brain in vivo using short echo-time 1H MRS. Magn Reson Med 55: , 979–983. |
[21] | Edden RA , Puts NA , Harris AD , Barker PB , Evans CJ ((2014) ) Gannet: A batch-processing tool for the quantitative analysis of gamma-aminobutyric acid-edited MR spectroscopy spectra. J Magn Reson Imaging 40: , 1445–1452. |
[22] | Naressi A , Couturier C , Castang I , de Beer R , Graveron-Demilly D ((2001) ) Java-based graphical user interface for MRUI, a software package for quantitation of in vivo/medical magnetic resonance spectroscopy signals. Comput Biol Med 31: , 269–286. |
[23] | Provencher SW ((1993) ) Estimation of metabolite concentrations from localized in vivo proton NMR spectra. Magn Reson Med 30: , 672–679. |
[24] | Wilson M , Reynolds G , Kauppinen RA , Arvanitis TN , Peet AC ((2011) ) A constrained least-squares approach to the automated quantitation of in vivo (1)H magnetic resonance spectroscopy data. Magn Reson Med 65: , 1–12. |
[25] | Maudsley AA , Darkazanli A , Alger JR , Hall LO , Schuff N , Studholme C , Yu Y , Ebel A , Frew A , Goldgof D , Gu Y , Pagare R , Rousseau F , Sivasankaran K , Soher BJ , Weber P , Young K , Zhu X ((2006) ) Comprehensive processing, display and analysis for in vivo MR spectroscopic imaging. NMR Biomed 19: , 492–503. |
[26] | Mikkelsen M , Bhattacharya PK , Mandal PK , Shukla D , Wang AM , Wilson M , Dydak U , Murdoch JB , Near J , Oeltzschne G , Edden RAE ((2018) ) Analyzing big GABA: comon of five software packages for GABA-edited MRS. ISMRM 27th Annual Meeting & Exhibition, 11–16 May 2019, Montréal, QC, Canada. Abstract #2225. |
[27] | Young K , Soher BJ , Maudsley AA ((1998) ) Automated spectral analysis II: application of wavelet shrinkage for characterization of non-parameterized signals. Magn Reson Med 40: , 816–821. |
[28] | Shukla D , Mandal PK , Tripathi M , Vishwakarma G , Mishra R , Sandal K ((2020) ) Quantitation of in vivo brain glutathione conformers in cingulate cortex among age-matched control, MCI, and AD patients using MEGA-PRESS. Hum Brain Mapp 41: , 194–217. |
[29] | Grewal M , Dabas A , Saharan S , Barker PB , Edden RA , Mandal PK ((2016) ) GABA quantitation using MEGA-PRESS: Regional and hemispheric differences. J Magn Reson Imaging 44: , 1619–1623. |
[30] | Mandal PK , Shukla D , Govind V , Boulard Y , Ersland L ((2017) ) Glutathione conformations and its implications for in vivo magnetic resonance spectroscopy. J Alzheimers Dis 59: , 537–541. |
[31] | Shukla D , Mandal PK , Ersland L , Gruner ER , Tripathi M , Raghunathan P , Sharma A , Chaithya GR , Punjabi K , Splaine C ((2018) ) A multi-center study on human brain glutathione conformation using magnetic resonance spectroscopy. J Alzheimers Dis 66: , 517–532. |
[32] | Mandal PK , Ersland L ((2019) ) Editorial: Predictive imagable biomarkers for neurodegenerative and neurodevelopmental diseases. Front Neurol 10: , 583. |


