
Metabolic Profiles Help Discriminate Mild Cognitive Impairment from Dementia Stage in Alzheimer’s Disease
Abstract
Accurate differentiation between neurodegenerative diseases is developing quickly and has reached an effective level in disease recognition. However, there has been less focus on effectively distinguishing the prodromal state from later dementia stages due to a lack of suitable biomarkers. We utilized the Disease State Index (DSI) machine learning classifier to see how well quantified metabolomics data compares to clinically used cerebrospinal fluid (CSF) biomarkers of Alzheimer’s disease (AD). The metabolic profiles were quantified for 498 serum and CSF samples using proton nuclear magnetic resonance spectroscopy. The patient cohorts in this study were dementia (with a clinical AD diagnosis) (N = 359), mild cognitive impairment (MCI) (N = 96), and control patients with subjective memory complaints (N = 43). DSI classification was conducted for MCI (N = 51) and dementia (N = 214) patients with low CSF amyloid-β levels indicating AD pathology and controls without such amyloid pathology (N = 36). We saw that the conventional CSF markers of AD were better at classifying controls from both dementia and MCI patients. However, quantified metabolic subclasses were more effective in classifying MCI from dementia. Our results show the consistent effectiveness of traditional CSF biomarkers in AD diagnostics. However, these markers are relatively ineffective in differentiating between MCI and the dementia stage, where the quantified metabolomics data provided significant benefit.
INTRODUCTION
Alzheimer’s disease (AD) is a progressive neurodegenerative disease characterized by extracellular amyloid-β plaques and axonal tau neurofibrillary tangles. Symptoms of AD include loss of memory and other cognitive features, which are usually the first noticeable hallmarks of the disease. Current consensus on the AD symptom profile indicates that pathologic features in the brain are present before cognitive impairments arise [1]. Changes in patient cognition are routinely tested and the results are used in diagnostics. Patients who suffer from cognitive deficits, but do not meet the AD criteria [2–4], are classified as having mild cognitive impairment (MCI). By definition, MCI is considered a transitory phase between normal cognition and dementia; however, non-progressive forms of stable MCI also exist [5, 6]. A definite diagnosis in AD is determined by combining histopathological evidence (autopsy or brain biopsy) with clinical and genetic evidence [3, 4]. The challenges in early diagnosis have led to the discovery of biomarkers that can assist in ascertaining a proper diagnosis. The most widely used biomarkers for AD are the cerebrospinal fluid (CSF) concentrations of amyloid-β 42 (Aβ42), phosphorylated tau protein (pTau), and total tau (tTau), and findings from imaging setups. CSF biomarkers correlate with brain pathological findings [7, 8] and are included in the current diagnostic criteria [2].
The diagnostic profiles of neurodegenerative diseases are often overlapping due to mixed pathologies and similar symptoms among different dementias. Similarities produce challenges in diagnostics, thus making differentiation between diagnostic groups more difficult. CSF markers of AD have been shown to provide limited aid in differentiating AD from other neurodegenerative diseases [9], despite the fact that AD-type pathology can be frequent in other dementias [10]. However, a still prevalent issue in AD diagnostics is the recognition of the disease states between healthy cognition and AD. While current biomarkers enable the distinction of AD from other neurodegenerative diseases with enough accuracy, relevant measures for assessing AD state and progression are sparse. The use of non-clinical data, such as quantified metabolic profiles, could benefit the differentiation models in diagnostics disease stage recognition.
Metabolomics can provide a viewpoint to assess metabolism during neurodegeneration and in the presence of certain pathological features. Most of the metabolomics research is cardiovascular driven, but metabolomics approaches have gained popularity in neurology. There is existing information regarding cross-sectional metabolic changes in AD versus controls [11–13] and findings are also reported from studies distinguishing AD dementia from preclinical AD or MCI [14–17]. To highlight, lower plasma serotonin, phenylalanine, proline, lysine, phosphatidylcholine, taurine, and acylcarnitine were associated with conversion from MCI to AD [14]. Several phospholipids were also seen altered in dementia and MCI [14, 15]. Conversion to AD can also be assessed in the perspective of affected metabolic routes. For example, a study illustrates connections between MCI to AD conversion and polyamine and arginine metabolism [16].
The aim of this study was to examine the efficacy of serum and CSF metabolic profiles when discriminating between amyloid-positive dementia, MCI, and amyloid-negative controls with normal cognition and compare it to the performance of traditional CSF AD-biomarkers of Aβ42, tTau, and pTau. To combine the large set of metabolomics data, we use a supervised machine learning model, the Disease State Index (DSI), as the classifier. This model was originally introduced for early diagnosis of AD and has proven to be effective in predicting MCI progression [18, 19] and the differential diagnostics of neurodegenerative diseases [20, 21].
MATERIALS AND METHODS
Cohort and clinical evaluation
The study group was formed by 498 individuals who were examined for neurodegenerative diseases at the Department of Neurology, Kuopio University Hospital (Table 1). The cohort was divided by diagnosis into three groups: AD-type dementia (n = 359), MCI (n = 96), and healthy controls (n = 43). Dementia and MCI patients were diagnosed by a neurologist using the current criteria at that time [3, 5]. Diagnosis for AD involved histopathological and clinical verification of the disease, or the presence of clinical features with positive genetic background [3]. Patients with MCI showed cognitive decline that is not accountable to normal aging but does not show features of full dementia or impaired normal functional activities [5]. Controls refer to patients who were examined due to transient neurologic symptoms. This group consists of cases who were examined in the outpatient service due to headache, depression-induced cognitive deficits, unspecified temporary cognitive decline, or other subjective memory complaints.
Table 1
Demographic data for all participants and the subgroup of dementia and MCI with amyloid pathology (CSF Aβ42 < 500 pg/ml) and controls without amyloid pathology (CSF Aβ42 > 500 pg/ml)
| All cases | Amyloid subgroups | |||||
| Dementia | MCI | Controls | Dementia Aβ42 + | MCI Aβ42 + | Controls Aβ42 – | |
| Cases | 359 (72%) | 96 (19%) | 43 (9%) | 214 (71%) | 51 (17%) | 36 (12%) |
| Age, y | 72.8 (7.7) | 70.3 (9.2) | 58.5 (10.9) | 72.0 (8.0) | 71.1 (8.8) | 56.6 (9.9) |
| Sex, female/male | 241/118 (67/33%) | 39/57 (41/59%) | 18/25 (42/58%) | 137/76 (64/36%) | 25/26 (49/51%) | 14/22 (39/61%) |
| MMSE score | 19.3 (4.7) | 24.3 (2.8) | 26.3 (4.8) | 19.1 (4.5) | 24.1 (2.6) | 26.9 (3.7) |
| APOE ɛ4 prevalence | 241 (72%) | 48 (67%) | 7 (23%) | 161 (80%) | 31 (73%) | 5 (19%) |
| CSF markers, pg/ml | ||||||
| Aβ42 | 502 (179) | 530 (248) | 767 (266) | 391 (71) | 346 (88) | 836 (220) |
| tTau | 507 (290) | 417 (225) | 223 (111) | 526 (289) | 435 (224) | 211 (93) |
| pTau | 77 (34) | 71 (29) | 51 (19) | 79 (34) | 73 (29) | 52 (19) |
Aβ42, amyloid-β 42; APOE ɛ4, Apolipoprotein E epsilon 4; CSF, cerebrospinal fluid; MCI, mild cognitive impairment; MMSE, Mini-Mental State Examination; pTau, phosphorylated tau; tTau, total tau. Values are displayed as means (standard deviation) or number (percentage). Missing values: 1 for tTau, 68 for MMSE and 59 for APOE.
The current National Institute on Aging and Alzheimer’s Association (NIA-AA) research criteria for AD at the MCI and dementia stages recommend biomarker supported diagnosis for amyloid-β (A) and tau (T) pathology along with neurodegeneration (N) [22]. Of the dementia patients, 107 (30%) had a fully positive AD CSF marker profile (Aβ42 <500 pg/ml, tTau >400 pg/ml, and pTau >70 pg/ml), while 21 (22%) of MCI and only one (2%) control were seen having fully positive AD type CSF findings. AD type CSF amyloid findings were seen in 213 (60%) dementia patients, 51 (53%) MCI patients, and in seven controls (16%). Five (12%) control subjects had positive CSF tau profile (either tTau >400 pg/ml or pTau >70 pg/ml), while 215 (60%) dementia patients and 46 (51%) MCI patients had positive CSF tau findings. The full biomarker profiles by diagnostic group are shown in Table 1. The selection of patients for the classification used CSF Aβ42 < 500 pg/ml as an inclusion criterion for MCI and Dementia with AD related pathology and as an exclusion criterion for Controls. The distribution of amyloid and tau pathology, as well as positive neurodegeneration status in the study cohort according to the NIA-AA research criteria for AD is shown in Supplementary Table 1.
All patients underwent medical examination. During this visit, serum and CSF samples were drawn, the medical history was mapped, structural MRI and CT imaging and laboratory analyses were conducted, and patient cognition was evaluated with the Mini-Mental State Examination (MMSE) [23]. CSF was drawn using lumbar puncture from the space between L3-L4 or L4-L5 and frozen (–80°C) for storage. This study was approved by the local ethical committee (permit numbers 5//2002 & 42//2013). Written informed consent was obtained from all subjects. Examination, treatment, and diagnosis of patients were not affected by this study.
Clinical AD markers
Quantification procedures using the enzyme-linked immunosorbent assay for Aβ42, pTau, and tTau, and thresholds for their use in the diagnostic criteria were described in 2005 by Herukka et al. [24].
Serum and CSF nuclear magnetic resonance spectroscopy metabolomics
Metabolic profiles from serum and CSF were measured with separate but similar platforms using one-dimensional proton NMR spectroscopy. These platforms were chosen due to their ability to measure absolute metabolite concentrations, instead of relative. Furthermore, both platforms provided a large and good quality variable set in a high-throughput manner. Metabolite concentrations were quantified from serum samples as previously displayed by Soininen et al. [25, 26]. The serum metabolomics platform was recently featured in a large scale AD metabolic profiling study [13].
The frozen (–80°C) CSF samples were thawed in room temperature, centrifuged (3,000 g, 10 min, +4°C), and mixed with a monopotassium phosphate buffer (495μl CSF + 55μl 400 mM KH2PO4, 0.5 mM, trimethylsilyl propanoic acid, 12.4 mM NaN3, pH 7.0). The NMR spectra (Bruker noesygppr1d pulse sequence, 96 k data points, 64 transients, 10 ms mixing time, 25 Hz irradiation field for water suppression, 2.7 s acquisition time, and 5.0 s relaxation delay) were recorded with a Bruker AVANCE III HD 600 MHz NMR spectrometer equipped with a Prodigy TCI cryoprobe. The individual CSF metabolites were quantified from the NMR spectra using Total-Line-Shape fitting [27].
Disease state index
The DSI [18] measures the similarity of the data of a subject to a set of controls and positive cases. The DSI value is a scalar number from zero to one. This value denotes the similarity to the state of the disease, MCI or dementia in this case, in the given data when compared to data in the training set, which in this case is randomly chosen from the study data via 10-fold cross validation. To simplify, values near one indicate that cases in the study set closely resemble dementia or MCI cases in the training data. Conversely, values near zero would mean that the cases in the study data display strong similarities with healthy control or non-demented cases in the training data.
Using a fitness function, an index value is computed for a single measurement, such as the CSF tTau concentration of a subject, by comparing it to the distribution of the training data by diagnosis. The fitness function is the share of false negative errors divided by the sum of false negative and positive errors, using the measurement value x as a threshold for classification. It assigns a value of zero to measurement values unique to controls and a value of one to values unique to disease cases. Relevance, which is the Youden index of the distribution, displays how robustly a variable can in general discriminate between the two diagnoses— it captures the overlap between the distributions (control versus disease) of the variable in the database. If the distributions completely overlap, the relevance is zero, and if they are separate, the relevance is one. A composite index value is calculated by combining the index and relevance as a weighted arithmetic mean. These steps are iterated, and previous index values from each iteration serve as evaluators for relevance and fitness. The final composite value of the iteration is the overall DSI value of the classifier [18].
The Disease State Fingerprint (DSF) is a visualization of the DSI classifier. It shows the index values at each level and illustrates them as colored boxes. Blue color is given to values near zero (similar to a negative case) and red to values near one (similar to a positive case). White denotes values near 0.5, which is neither more similar to a negative or a positive diagnosis. Box size is determined by relevance, meaning larger boxes indicate a better ability to distinguish between negative and positive cases. The advantages of the DSI and DSF approach as compared to other machine learning methods are: a robust way of dealing with missing data, which is very common in medical set-ups; possibility to include a variety of measures, which can be both scalar and categorical; a graded classification instead of a binary ‘yes/no’ classification; and an intuitive way of visualizing the results which improves confidence in decision making.
Data analysis
We utilized a variable set totaling 109 variables from all data sources. Of these variables, 34 were CSF low-molecular-weight metabolites (LMWM) and 57 were serum lipoproteins, fatty acids, and related measures. Eighteen measures were serum LMWM. Three measures were clinical CSF markers of AD (Aβ42, tTau, and pTau).
The DSI classifier models were tested with 100*10-fold cross-validation using the area under receiver-operator curve (AUC) for obtained index values with 95% confidence intervals. Metabolomics data was grouped into Serum lipids, Serum LMWM, and CSF LMWM. Serum lipids were further grouped into lipoproteins, cholesterols, glycerides and phospholipids, and fatty acids. Serum LMWM were divided into energy and ketone bodies, and amino acids. CSF LMWM data was distributed into the following subclasses: energy and ketone bodies, amino acids, organic nitrous compounds, and organosulfurs. We show the AUCs for the composite index values for all the subclasses and the overall DSI score, which is the composite of metabolomics and CSF markers.
The statistical significance of differences in mean values between diagnostic groups was tested by fitting an ANOVA model with the LSD post-hoc test. Significant differences of frequencies in categorical variables were tested with the chi-squared test. The threshold for a statistically significant difference in post-hoc LSD and the chi-squared test was p < 0.05.
We used the paired t-test to see if adding either metabolomic profiles or CSF markers would improve the AUCs of the overall DSI compared to the classifier with only CSF markers or metabolomic profiles.
RESULTS
The demographics of the study population can be found in Table 1. Healthy controls were younger than patients with dementia and MCI. Dementia patients were slightly older when compared to MCI patients. The dementia cohort had a significantly higher ratio of women (67%) when compared to controls (42%) and patients with MCI (41%). Controls less frequently (23%) carried one or more APOE ɛ4 alleles when compared to dementia (72%) and MCI (67%) cohorts. Controls had significantly higher MMSE scores than dementia and MCI patients. Patients with dementia had lower MMSE scores than MCI patients. CSF Aβ42 concentrations in healthy controls were higher when compared to dementia and MCI patients respectively. However, the concentration of CSF pTau was lower in controls when compared to dementia and MCI. The concentration of CSF tTau was higher in dementia than in MCI and higher against healthy controls. Also, healthy controls had lower concentrations of CSF tTau than patients with MCI. Additionally, the table shows demographics for the subpopulation with amyloid pathology (CSF Aβ42 levels <500 pg/ml) for MCI and dementia and controls without amyloid pathology. Overall, the population used in the classification of amyloid positive dementia and MCI, and amyloid negative healthy cognition is similar with the main population of clinically characterized patients, except for the CSF amyloid levels, which were used as the inclusion criteria.
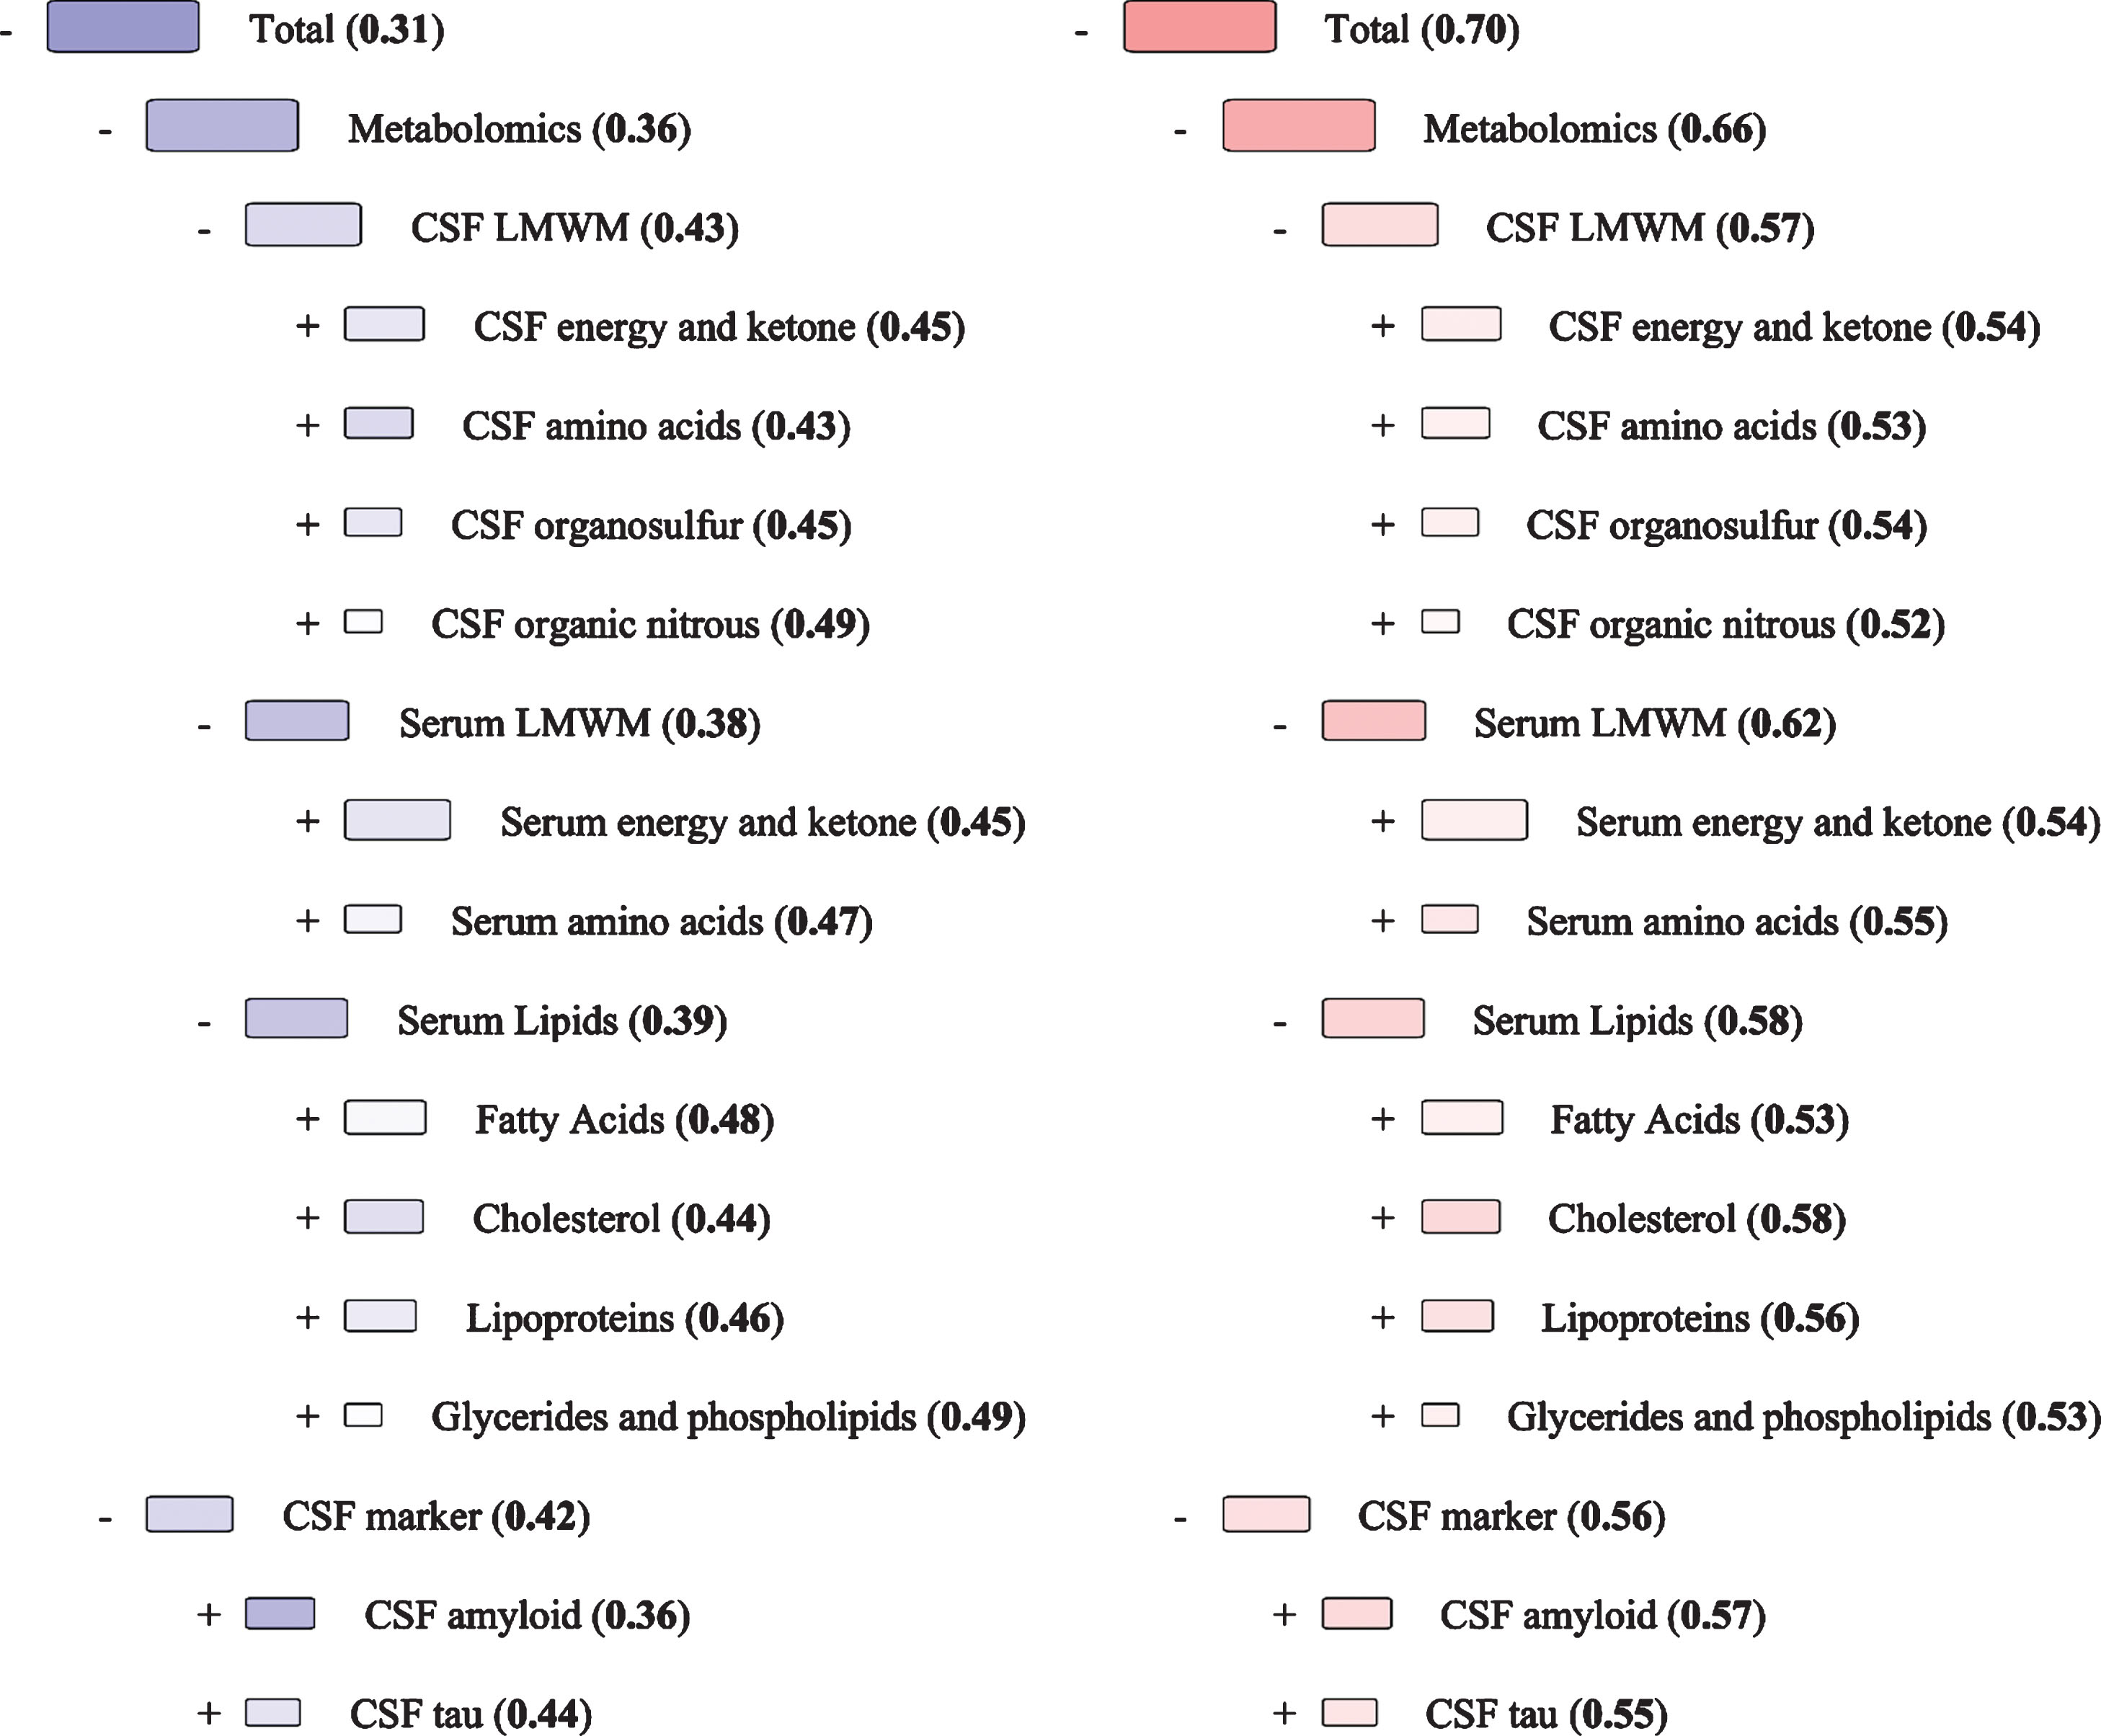
The findings from the DSI classifier discriminating amyloid positive dementia and MCI, and amyloid negative control subjects from each other are shown in Table 2. Outcomes of the classification performed with the whole dataset, including the clinically characterized dementia and MCI patients, and healthy controls, are provided in the Supplementary Material and Supplementary Table 2. The data used in the discrimination contains the metabolic profiles quantified from CSF and serum. The results for the DSI classifier performance in 10-fold cross-validation are given as AUC using index values from zero to one as the classification threshold. Visualization of the MCI versus dementia with amyloid pathology comparison using median values is shown in Fig. 1. Group means for metabolite concentrations are given in Supplementary Table 3. DSI sensitivities, specificities, and positive and negative predictive values at the classification threshold of 0.5 are presented in Supplementary Tables 4A-F.
Table 2
AUCs from Disease state index classifiers differentiating between healthy controls without amyloid pathology, mild cognitive impairment with amyloid pathology and dementia patients with amyloid pathology. 95% confidence intervals are given with the mean AUC
| AUC [95% CI] | Control versus Dementia | Control versus MCI | MCI versus Dementia |
| Total CSF + Metabolomics | 0.89 [0.87–0.90] | 0.84 [0.81–0.87] | 0.70 [0.68–0.73] |
| Total CSF markers | 0.87 [0.85–0.89] | 0.80 [0.77–0.84] | 0.64 [0.61–0.67] |
| Aβ42 | Not included | Not included | 0.65 [0.62–0.67] |
| tTau | 0.90 [0.88–0.91] | 0.82 [0.79–0.85] | 0.58 [0.55–0.60] |
| PTau | 0.78 [0.75–0.80] | 0.75 [0.72–0.79] | 0.49 [0.47–0.52] |
| Total Metabolic markers | 0.73 [0.71–0.76] | 0.75 [0.72–0.78] | 0.68 [0.65–0.70] |
| Total Serum Lipids | 0.71 [0.68–0.74] | 0.69 [0.65–0.72] | 0.61 [0.59–0.64] |
| Lipoproteins | 0.74 [0.72–0.77] | 0.72 [0.68–0.76] | 0.62 [0.59–0.65] |
| Cholesterols | 0.66 [0.63–0.69] | 0.67 [0.63–0.71] | 0.62 [0.59–0.65] |
| Glycerides and phospholipids | 0.69 [0.66–0.72] | 0.62 [0.58–0.66] | 0.51 [0.48–0.53] |
| Fatty acids | 0.66 [0.63–0.69] | 0.66 [0.62–0.70] | 0.54 [0.51–0.56] |
| Total Serum LMWM | 0.72 [0.69–0.75] | 0.64 [0.60–0.68] | 0.61 [0.59–0.64] |
| Energy and ketone bodies | 0.62 [0.59–0.65] | 0.53 [0.49–0.57] | 0.61 [0.58–0.63] |
| Amino acids | 0.70 [0.67–0.73] | 0.66 [0.62–0.70] | 0.54 [0.51–0.57] |
| Total CSF LMWM | 0.63 [0.60–0.66] | 0.73 [0.69–0.77] | 0.64 [0.62–0.67] |
| Energy and ketone bodies | 0.55 [0.51–0.58] | 0.67 [0.63–0.71] | 0.62 [0.59–0.64] |
| Amino acids | 0.65 [0.61–0.68] | 0.65 [0.61–0.69] | 0.58 [0.55–0.60] |
| Organic nitrous | 0.55 [0.53–0.58] | 0.69 [0.66–0.73] | 0.52 [0.50–0.55] |
| Organosulfurs | 0.61 [0.58–0.64] | 0.53 [0.49–0.56] | 0.53 [0.50–0.56] |
Aβ42, amyloid-β 42; AD, Alzheimer’s disease; AUC, area under curve; CSF, cerebrospinal fluid; LMWM, low-molecular-weight metabolites; MCI, mild cognitive impairment; pTau, phosphorylated tau; tTau, total tau.
Fig.1
Disease State Fingerprint for MCI with amyloid pathology versus Dementia with amyloid pathology. These figures illustrate a hypothetical case where all measurement values are equal to the median value for the diagnostic group. The numbers are the Disease State Index values for each comparison and range between 0 and 1 and are also reflected in the color scale of the nodes from blue to red. Blue color indicates more similarity MCI, while red indicates a higher similarity to Dementia, and white is equally typical for both diagnoses. The size of a node corresponds to the relevance (Youden index), which is the ability to distinguish the two diagnoses from each other. CSF, cerebrospinal fluid; LMWM, low-molecular-weight metabolites; MCI, mild cognitive impairment.
CSF Aβ42 levels were not included in the comparisons between controls and MCI or dementia as they were used for selecting the subgroups and, as such, would separate the groups with an AUC of 1. In the control versus dementia model (AUC 0.89), adding CSF markers (AUC 0.87) to the model with metabolic profiles (AUC 0.73) improved the overall classification significantly (p < 0.001), while adding the metabolic profiles had very little effect (p = 0.052). Similarly, in the control versus MCI model (AUC 0.84), adding CSF markers (AUC 0.80) to the classifier containing the metabolic profiles (AUC 0.75) improved the overall discrimination significantly (p < 0.001), while adding the metabolic profiles did not have a significant effect (p = 0.06). Finally, in the MCI versus dementia model (AUC 0.70), both adding CSF markers (AUC 0.64) to the metabolic profile classifier (AUC 0.68) and vice versa improved the classification (p < 0.001).
For amyloid negative control versus amyloid positive dementia comparison serum lipids (AUC 0.71) and serum LMWM (AUC 0.72) were more effective than CSF LMWM (AUC 0.63) in the classification analysis. For control versus MCI, CSF LMWM (AUC 0.73) was the most effective metabolic group. For MCI versus dementia, all metabolic groups had similar classification ability. When classifying amyloid negative controls from amyloid positive dementia, lipoproteins were the best performing classifier of the metabolic subclasses (AUC 0.74). Otherwise, the subclasses performed in a similar fashion (AUC range 0.61 to 0.70), excluding CSF energy and ketone bodies and organic nitrous compounds (AUC 0.55). Lipoproteins were also the best metabolic subclass when comparing amyloid positive MCI to amyloid negative controls (AUC 0.72). The lowest classification strength was retained by serum energy and ketone bodies and CSF organosulphurs (AUC 0.53). Otherwise, there were no clear separation among metabolic subclasses (AUC range 0.62 – 0.69). When classifying amyloid positive MCI from amyloid dementia, it was not possible to discern a clearly best metabolic subclass (AUC range 0.51 – 0.62). Reminiscent of the findings using larger subclasses, the smaller metabolic subclasses had similar AUCs when compared to the AD CSF markers individually; however, CSF pTau had the lowest classification strength, being the only classifier with an AUC under 0.5. Uniformly, the serum lipid subclasses were better at classifying amyloid positive states from amyloid negative controls than they were at classifying amyloid positive MCI and dementia from each other.
Sex-related differences in discrimination strength
In order to illustrate sex-related differences in discrimination strength of the diagnostic groups, the data from males and females were analyzed separately [28] for the overall groups. In men, the CSF biomarkers of AD were better at discriminating controls from dementia and MCI (AUCs 0.87 and 0.82, respectively) when compared to the metabolic profiles (AUCs 0.72 and 0.67). Likewise, in women, the discrimination of controls from dementia and MCI was more robust when using the CSF markers of AD instead of metabolic profiles (AUCs 0.84 and 0.80 versus 0.74 and 0.73). The discrimination of dementia from MCI still follows the same pattern in both sexes when compared to conjoined data: Metabolic profiles better discriminates dementia from MCI when compared to the CSF markers of AD (AUCs in men: 0.64 versus 0.55 and in women: 0.70 versus 0.60).
DISCUSSION
This study showed that set of metabolic profiles were slightly better at discriminating amyloid positive MCI from amyloid positive dementia than traditional CSF biomarkers of AD. Conversely, the classification of amyloid negative controls from amyloid positive MCI or dementia benefitted more from CSF markers of AD than metabolic data from any source. Overall, the total classification performance was similar in both all subjects and the group selected using the CSF Aβ42 inclusion criteria and results showed similar patterns in the relative power of metabolic profiles and CSF markers during classification. Analyzing the data separately for men and women had no relevant effect in terms of the outcome of the DSI.
The CSF markers of AD seem to classify the onset and presence of neurodegeneration better than metabolic profiles. On the other hand, larger metabolic profiles separated MCI from dementia with at least equal performance. To reiterate findings from previous research, the effect of phospholipids were emphasized in study by Mapstone et al. in 2014, where progression from MCI to AD dementia was examined in a metabolomics perspective [14]. The reported associations seem consistent with what is currently known about cellular structure of neurons. More specifically, phospholipids are structural molecules of cellular membranes and are responsible for several cellular processes such as protein processing and transport. Interestingly, phospholipids had low performance in our classifications, but are associated to neurodegeneration and neuroinflammation in literature [29–31].
Current findings on metabolomics also notes that amino acids [13, 16] and lipid bodies [12, 13] such as cholesterols and lipoproteins are associated with AD or with the progression from its prodromal states. Some of these molecules or their close analogues were included in our metabolic subclasses, which were able to classify MCI from dementia consistently. Furthermore, cholesterols and other lipid bodies have connections to AD pathophysiology (see, for example, a review by Wong et al. [32]). All these considered, there seem to be both pathophysiological and population-based evidence of AD and MCI related metabolic changes that is in line with our findings.
Additionally, when comparing the amyloid positive MCI and dementia to amyloid negative controls, lipoproteins were the best metabolic classifiers in both classifications. This might be indicative of supposed amyloidogenic processes that are modulated by lipoproteins, cholesterol, and other lipids on and in the close vicinity of the lipid rafts [32, 33]. The fact that lipoproteins were not particularly effective in discriminating disease states with already existing amyloid load, i.e., classifying amyloid positive dementia and MCI from each other, could also point toward the amyloidogenic properties of these lipid rafts and their components. Evidence also suggests that the amyloidogenic processing on the lipid rafts is already active in early stages of AD [34]. Furthermore, cholesterols, and glycerides and phospholipids were also effective when classifying amyloid positive dementia and MCI from controls. This effect was also lesser when classifying amyloid positive dementia and MCI from each other, supporting the mentioned connections between amyloidogenic processing and lipid rafts.
When comparing amyloid negative controls to amyloid positive dementia, the inclusion of metabolic profiles with CSF markers of AD provided additional leverage in discrimination. In this case, the increase in efficacy was relatively modest, but showed that the addition of metabolic profiles did not diminish discrimination and would benefit the classification in general. It also became evident that, in this case, the metabolic profiles were most useful when they were added to the classifier with the clinical CSF AD markers. This outcome was also consistent in the classification of amyloid positive MCI and amyloid negative controls. However, when discriminating clinically characterized MCI from a healthy cognition, we noted that the classifier was more efficient in terms of discrimination when the CSF markers of AD were included without any components from the metabolomics data in the overall cohort.
The CSF markers of AD were less efficient in describing the disease state than we originally postulated. It seems feasible to supplement these markers with non-clinical data, e.g., metabolic profiles to form a better model for the disease progression and state. While the markers of AD, and especially CSF Aβ42, have relatively good diagnostic performance, they seem to lack the power to efficiently discriminate different stages of the disease. The global effort to connect AD pathophysiology to metabolic changes is still ongoing. There seem to be relevant connections between these pathways, some of which are also visible in our findings. Despite this, blood lipids and metabolic profiles are not yet viable candidates for biomarkers of neurodegeneration but serve well in studying pathophysiology, associated risks, and comorbidities, especially in the perspective of lifestyle. Furthermore, it is inconclusive whether the metabolites are directly affecting disease course or if their abnormal levels are simply a secondary effect stemming from neurodegeneration such as aberrant membrane lipids in biofluids or related symptoms like dietary changes or weight loss.
Strengths and limitations
This study features a substantial number of study participants and is large in the scope of AD metabolomics. A weakness in study design is the heterogeneous dementia population; we cannot fully exclude the presence of mixed pathologies from other neurodegenerative diseases among clinically diagnosed AD dementia patients. There were some dementia patients who did not have a typical AD CSF peptide profile but were diagnosed with clinical AD regardless. Similarly, the patients with MCI might also portray pathological features from other neurodegenerative diseases besides AD. This was mitigated by excluding those clinically diagnosed AD and MCI cases which did not show signs of amyloid pathology. Due to the size of the study population, tau pathology was not considered as an additional inclusion or exclusion criteria and as such our results do not fully describe a biomarker defined AD or MCI due to prodromal AD.
Unfortunately, there is a significant age difference between the control and MCI/dementia groups, which makes it difficult to ascertain if the found differences in metabolic concentrations are affected by diagnostic grouping only or if age also plays a part. There is no effective way to correct for this in a population this size, as a linear fit for age in the control group would likely give unreliable results in the notably older MCI/dementia groups due to errors in extrapolation. The MCI versus dementia comparison is not affected by age differences and is more reliable in this sense.
One strong feature in the study is a well-defined control population, albeit small, and containing individuals with subjective memory complaints. The controls did not include patients with alcohol consumption related loss of cognition. The reported complaints regarding cognitive decline among controls were all to be of transient origin. Furthermore, we did subgroup analysis with the controls that did not have positive amyloid CSF findings. Another strong aspect of the study are the metabolomics platforms. Both are based upon thoroughly used and validated methodology and provide good quality data points in absolute metabolite concentrations instead of relative ones.
Conclusions
We conclude that the clinical CSF markers of AD are better at discriminating controls from both AD-type dementia and MCI patients. However, MCI and dementia patients were better discriminated by grouped metabolic profiles than the CSF markers of AD. Similar findings were also seen when analyzing the whole clinically characterized population of dementia and MCI patients, and healthy controls.
ACKNOWLEDGMENTS
Technical assistance was provided by Päivi Räsänen, Tarja Kauppinen, and Anne Kaikko. Proofreading of the manuscript was conducted by Elsa language solutions (Kuopio, Finland).
Olli Jääskeläinen has received a personal grant from Emil Aaltonen Foundation. Olli Jääskeläinen and Sanna-Kaisa Herukka have also attended SynaNet trainings and events within the framework of European Union’s Horizon 2020 research and innovation program (#692340). Mika Ala-Korpela is supported by a Senior Research Fellowship from the National Health and Medical Research Council (NHMRC) of Australia (APP1158958). He also works in a unit that is supported by the University of Bristol and UK Medical Research Council (MC_UU_12013/1). The Baker Institute is supported in part by the Victorian Government’s Operational Infrastructure Support Program.
Authors’ disclosures available online (https://www.j-alz.com/manuscript-disclosures/19-1226r1).
SUPPLEMENTARY MATERIAL
[1] The supplementary material is available in the electronic version of this article: https://dx.doi.org/10.3233/JAD-191226.
REFERENCES
[1] | Bateman RJ , Xiong C , Benzinger TLS , Fagan AM , Goate A , Fox NC , Marcus DS , Cairns NJ , Xie X , Blazey TM , Holtzman DM , Santacruz A , Buckles V , Oliver A , Moulder K , Aisen PS , Ghetti B , Klunk WE , McDade E , Martins RN , Masters CL , Mayeux R , Ringman JM , Rossor MN , Schofield PR , Sperling RA , Salloway S , Morris JC ((2012) ) Clinical and biomarker changes in dominantly inherited Alzheimer’s disease. N Engl J Med 367: , 795–804. |
[2] | Simonsen AH , Herukka S-K , Andreasen N , Baldeiras I , Bjerke M , Blennow K , Engelborghs S , Frisoni GB , Gabryelewicz T , Galluzzi S , Handels R , Kramberger MG , Kulczynska A , Molinuevo JL , Mroczko B , Nordberg A , Oliveira CR , Otto M , Rinne JO , Rot U , Saka E , Soininen H , Struyfs H , Suardi S , Visser PJ , Winblad B , Zetterberg H , Waldemar G ((2017) ) Recommendations for CSF AD biomarkers in the diagnostic evaluation of dementia. Alzheimers Dement 13: , 274–284. |
[3] | Dubois B , Feldman HH , Jacova C , DeKosky ST , Barberger-Gateau P , Cummings J , Delacourte A , Galasko D , Gauthier S , Jicha G , Meguro K , O’Brien J , Pasquier F , Robert P , Rossor M , Salloway S , Stern Y , Visser PJ , Scheltens P ((2007) ) Research criteria for the diagnosis of Alzheimer’s disease: Revising the NINCDS-ADRDA criteria. Lancet Neurol 6: , 734–746. |
[4] | Dubois B , Feldman HH , Jacova C , Hampel H , Molinuevo JL , Blennow K , DeKosky ST , Gauthier S , Selkoe D , Bateman R , Cappa S , Crutch S , Engelborghs S , Frisoni GB , Fox NC , Galasko D , Habert M-O , Jicha GA , Nordberg A , Pasquier F , Rabinovici G , Robert P , Rowe C , Salloway S , Sarazin M , Epelbaum S , de Souza LC , Vellas B , Visser PJ , Schneider L , Stern Y , Scheltens P , Cummings JL ((2014) ) Advancing research diagnostic criteria for Alzheimer’s disease: The IWG-2 criteria. Lancet Neurol 13: , 614–629. |
[5] | Petersen RC ((2004) ) Mild cognitive impairment as a diagnostic entity. J Intern Med 256: , 183–194. |
[6] | Petersen RC , Caracciolo B , Brayne C , Gauthier S , Jelic V , Fratiglioni L ((2014) ) Mild cognitive impairment: A concept in evolution. J Intern Med 275: , 214–228. |
[7] | Seppala TT , Nerg O , Koivisto AM , Rummukainen J , Puli L , Zetterberg H , Pyykko OT , Helisalmi S , Alafuzoff I , Hiltunen M , Jaaskelainen JE , Rinne J , Soininen H , Leinonen V , Herukka SK ((2012) ) CSF biomarkers for Alzheimer disease correlate with cortical brain biopsy findings. Neurology 78: , 1568–1575. |
[8] | Tapiola T , Alafuzoff I , Herukka S-K , Parkkinen L , Hartikainen P , Soininen H , Pirttila T ((2009) ) Cerebrospinal fluid beta-amyloid 42 and tau proteins as biomarkers of Alzheimer-type pathologic changes in the brain. Arch Neurol 66: , 382–389. |
[9] | de Souza LC , Lamari F , Belliard S , Jardel C , Houillier C , De Paz R , Dubois B , Sarazin M ((2011) ) Cerebrospinal fluid biomarkers in the differential diagnosis of Alzheimer’s disease from other cortical dementias. J Neurol Neurosurg Psychiatry 82: , 240–246. |
[10] | Kramer PL , Xu H , Woltjer RL , Westaway SK , Clark D , Erten-Lyons D , Kaye JA , Welsh-Bohmer KA , Troncoso JC , Markesbery WR , Petersen RC , Turner RS , Kukull WA , Bennett DA , DouglasGalasko , Morris JC , Ott J ((2011) ) Alzheimer disease pathology in cognitively healthy elderly: A genome-wide study. Neurobiol Aging 32: , 2113–2122. |
[11] | Ellis B , Hye A , Snowden SG ((2015) ) Metabolic modifications in human biofluids suggest the involvement of sphingolipid, antioxidant, and glutamate metabolism in Alzheimer’s disease pathogenesis. J Alzheimers Dis 46: , 313–327. |
[12] | Proitsi P , Kim M , Whiley L , Simmons A , Sattlecker M , Velayudhan L , Lupton MK , Soininen H , Kloszewska I , Mecocci P , Tsolaki M , Vellas B , Lovestone S , Powell JF , Dobson RJB , Legido-Quigley C ((2017) ) Association of blood lipids with Alzheimer’s disease: A comprehensive lipidomics analysis. Alzheimers Dement 13: , 140–151. |
[13] | Tynkkynen J , Chouraki V , Lee SJ van der , Hernesniemi J , Yang Q , Li S , Beiser A , Larson MG , Sääksjärvi K , Shipley MJ , Singh-Manoux A , Gerszten RE , Wang TJ , Havulinna AS , Würtz P , Fischer K , Demirkan A , Ikram MA , Amin N , Lehtimäki T , Kähönen M , Perola M , Metspalu A , Kangas AJ , Soininen P , Ala-Korpela M , Vasan RS , Kivimäki M , Duijn CM van , Seshadri S , Salomaa V ((2018) ) Association of branched-chain amino acids and other circulating metabolites with risk of incident dementia and Alzheimer’s disease: A prospective study in eight cohorts. Alzheimers Dement 14: , 723–733. |
[14] | Mapstone M , Cheema AK , Fiandaca MS , Zhong X , Mhyre TR , MacArthur LH , Hall WJ , Fisher SG , Peterson DR , Haley JM , Nazar MD , Rich SA , Berlau DJ , Peltz CB , Tan MT , Kawas CH , Federoff HJ ((2014) ) Plasma phospholipids identify antecedent memory impairment in older adults. Nat Med 20: , 415–418. |
[15] | Li D , Misialek JR , Boerwinkle E , Gottesman RF , Sharrett AR , Mosley TH , Coresh J , Wruck LM , Knopman DS , Alonso A ((2016) ) Plasma phospholipids and prevalence of mild cognitive impairment and/or dementia in the ARIC Neurocognitive Study (ARIC-NCS). Alzheimers Dement (Amst) 3: , 73–82. |
[16] | Graham SF , Chevallier OP , Elliott CT , Hölscher C , Johnston J , McGuinness B , Kehoe PG , Passmore AP , Green BD ((2015) ) Untargeted metabolomic analysis of human plasma indicates differentially affected polyamine and L-arginine metabolism in mild cognitive impairment subjects converting to Alzheimer’s disease. PLoS One 10: , e0119452. |
[17] | Casanova R , Varma S , Simpson B , Kim M , An Y , Saldana S , Riveros C , Moscato P , Griswold M , Sonntag D , Wahrheit J , Klavins K , Jonsson PV , Eiriksdottir G , Aspelund T , Launer LJ , Gudnason V , Legido Quigley C , Thambisetty M ((2016) ) Blood metabolite markers of preclinical Alzheimer’s disease in two longitudinally followed cohorts of older individuals. Alzheimers Dement 12: , 815–22. |
[18] | Mattila J , Koikkalainen J , Virkki A , Simonsen A , van Gils M , Waldemar G , Soininen H , Lötjönen J , Alzheimer’s Disease Neuroimaging Initiative ((2011) ) A disease state fingerprint for evaluation of Alzheimer’s disease. J Alzheimers Dis 27: , 163–176. |
[19] | Hall A , Muñoz-Ruiz M , Mattila J , Koikkalainen J , Tsolaki M , Mecocci P , Kloszewska I , Vellas B , Lovestone S , Visser PJ , Lötjonen J , Soininen H , Alzheimer Disease Neuroimaging Initiative, AddNeuroMed consortium, DESCRIPA and Kuopio L-MCI ((2015) ) Generalizability of the disease state index prediction model for identifying patients progressing from mild cognitive impairment to Alzheimer’s disease. J Alzheimers Dis 44: , 79–92. |
[20] | Koikkalainen J , Rhodius-Meester H , Tolonen A , Barkhof F , Tijms B , Lemstra AW , Tong T , Guerrero R , Schuh A , Ledig C , Rueckert D , Soininen H , Remes AM , Waldemar G , Hasselbalch S , Mecocci P , van der Flier W , Lötjönen J ((2016) ) Differential diagnosis of neurodegenerative diseases using structural MRI data. Neuroimage Clin 11: , 435–449. |
[21] | Muñoz-Ruiz MÁ , Hall A , Mattila J , Koikkalainen J , Herukka S-K , Husso M , Hänninen T , Vanninen R , Liu Y , Hallikainen M , Lötjönen J , Remes AM , Alafuzoff I , Soininen H , Hartikainen P ((2016) ) Using the disease state fingerprint tool for differential diagnosis of frontotemporal dementia and Alzheimer’s disease. Dement Geriatr Cogn Dis Extra 6: , 313–329. |
[22] | Jack CR , Bennett DA , Blennow K , Carrillo MC , Dunn B , Haeberlein SB , Holtzman DM , Jagust W , Jessen F , Karlawish J , Liu E , Molinuevo JL , Montine T , Phelps C , Rankin KP , Rowe CC , Scheltens P , Siemers E , Snyder HM , Sperling R , Contributors R ((2018) ) NIA-AA Research Framework: Toward a biological definition of Alzheimer’s disease. Alzheimers Dement 14: , 535–562. |
[23] | Folstein MF , Folstein SE , McHugh PR ((1975) ) Mini-mental state. A practical method for grading the cognitive state of patients for the clinician. J Psychiatr Res 12: , 189–198. |
[24] | Herukka S-K , Hallikainen M , Soininen H , Pirttila T ((2005) ) CSF Abeta42 and tau or phosphorylated tau and prediction of progressive mild cognitive impairment. Neurology 64: , 1294–1297. |
[25] | Soininen P , Kangas AJ , Wurtz P , Suna T , Ala-Korpela M ((2015) ) Quantitative serum nuclear magnetic resonance metabolomics in cardiovascular epidemiology and genetics. Circ Cardiovasc Genet 8: , 192–206. |
[26] | Soininen P , Kangas AJ , Wurtz P , Tukiainen T , Tynkkynen T , Laatikainen R , Jarvelin M-R , Kahonen M , Lehtimaki T , Viikari J , Raitakari OT , Savolainen MJ , Ala-Korpela M ((2009) ) High-throughput serum NMR metabonomics for cost-effective holistic studies on systemic metabolism. Analyst 134: , 1781–1785. |
[27] | Soininen P , Haarala J , Vepsäläinen J , Niemitz M , Laatikainen R ((2005) ) Strategies for organic impurity quantification by 1H NMR spectroscopy: Constrained total-line-shape fitting. Anal Chim Acta 542: , 178–185. |
[28] | Koikkalainen J , Pölönen H , Mattila J , van Gils M , Soininen H , Lötjönen J , Alzheimer’s Disease Neuroimaging Initiative ((2012) ) Improved classification of Alzheimer’s disease data via removal of nuisance variability. PLoS One 7: , e31112. |
[29] | Bennett SAL , Valenzuela N , Xu H , Franko B , Fai S , Figeys D ((2013) ) Using neurolipidomics to identify phospholipid mediators of synaptic (dys)function in Alzheimer’s disease. Front Physiol 4: , 168. |
[30] | Rao JS , Rapoport SI , Kim H-W ((2011) ) Altered neuroinflammatory, arachidonic acid cascade and synaptic markers in postmortem Alzheimer’s disease brain. Transl Psychiatry 1: , e31-e31. |
[31] | Han X , Holtzman DM , McKeel DW ((2001) ) Plasmalogen deficiency in early Alzheimer’s disease subjects and in animal models: Molecular characterization using electrospray ionization mass spectrometry. J Neurochem 77: , 1168–80. |
[32] | Wong MW , Braidy N , Poljak A , Pickford R , Thambisetty M , Sachdev PS ((2017) ) Dysregulation of lipids in Alzheimer’s disease and their role as potential biomarkers. Alzheimers Dement 13: , 810–827. |
[33] | Ehehalt R , Keller P , Haass C , Thiele C , Simons K ((2003) ) Amyloidogenic processing of the Alzheimer β-amyloid precursor protein depends on lipid rafts. J Cell Biol 160: , 113–123. |
[34] | Fabelo N , Martín V , Marín R , Moreno D , Ferrer I , Díaz M ((2014) ) Altered lipid composition in cortical lipid rafts occurs at early stages of sporadic Alzheimer’s disease and facilitates APP/BACE1 interactions. Neurobiol Aging 35: , 1801–1812. |


