
Sex-Specific Association of Lifetime Body Mass Index with Alzheimer’s Disease Neuroimaging Biomarkers
Abstract
Background:
Although recent studies indicate that the relationship between body mass index (BMI) and Alzheimer’s disease (AD) may differ by both sex and age of BMI measurement, little information is available on sex- or age-specific associations between BMI and AD neuropathologies.
Objective:
To examined whether sex-specific BMIs measured at different life-stages (in early adulthood, midlife, and late life) were associated with cerebral amyloid-β (Aβ) deposition and AD-signature region cortical thickness (AD-CT) in cognitively normal (CN) older adults.
Methods:
A total of 212 CN subjects aged 60–90 years (females 108, males 104), who participated in the Korean Brain Aging Study for Early Diagnosis and Prediction of Alzheimer’s Disease (KBASE), an ongoing prospective cohort study, were included. All participants underwent comprehensive clinical and neuropsychological assessments, [11C] Pittsburgh Compound B positron emission tomography, and brain magnetic resonance imaging. BMIs at different life stages were calculated. Multiple regression analyses were performed separately for either sex.
Results:
In males, lower early adulthood or midlife BMI was associated with greater cerebral Aβ deposition, but late life BMI was not. Lower midlife BMI was associated with reduced AD-CT, but the BMI in early adulthood and late life was not. In females, no significant association was observed between any lifetime BMI and Aβ deposition or AD-CT.
Conclusion:
Our results support a male-specific association between BMI prior to late life, and in vivo AD pathologies. Avoiding underweight status early in life may be important to prevent AD dementia in males, but not females.
INTRODUCTION
While a high midlife body mass index (BMI) has been associated with an increased incidence of Alzheimer’s disease (AD) dementia [1–4], a recent large epidemiological study revealed that underweight status in midlife increased the risk of AD dementia [5]. In terms of late-life BMI, some studies reported that a higher BMI was associated with an increased dementia risk [6, 7], whereas others showed that a low BMI or underweight status increased the risk [2, 8]. In regard of earlier adult BMI, two previous studies found that a low BMI at ages of 20 or 30 years significantly increased the risk of AD dementia [1, 9].
In addition, two prospective studies described prominent sex differences for the relationship between BMI and AD dementia risk [1, 10].
Several postmortem or in vivo AD biomarker studies have sought to discover neuropathological links between BMI and AD, but the efforts yielded inconsistent findings. One study found that a higher midlife BMI was associated with a greater cerebral amyloid-β (Aβ) burden [11], and others reported relationships between a lower late-life BMI and increased Aβ deposition [12–14].
Although evidence indicates that the relationship exists between BMI and AD that differ by both sex and age when BMI is measured, very little information is yet available on sex- or age-specific associations between BMI and AD neuropathological changes. In this context, we examined sex-specific associations between the BMI at different life stages (early adulthood, midlife, and late-life) and in vivo cerebral Aβ deposition and AD-signature region cortical thickness in cognitively normal (CN) older adults.
METHODS
Participants
This study is a part of the Korean Brain Aging Study for Early Diagnosis and Prediction of Alzheimer’s Disease (KBASE), an ongoing prospective cohort study established in 2014 [15]. We included 108 female and 104 male CN individuals enrolled in the KBASE between April 2014 and March 2016. All were at least 60 years of age and underwent comprehensive clinical, neuropsychological, brain imaging examinations, and clinical laboratory assessments including apolipoprotein E (APOE) genotyping. The inclusion criteria were: (a) age 60–90 years, (b) Clinical Dementia Rating score 0; and (c) no diagnosis of mild cognitive impairment or dementia. The exclusion criteria were: (a) any serious medical, psychiatric, or neurological disorder that could affect mental functioning; (b) any severe communication problem that would render clinical examination or brain scanning difficult; (c) contraindications to magnetic resonance imaging (MRI); (d) absence of a reliable informant; (e) illiteracy; and (f) participation in another clinical trial or treatment with an investigational product. The Institutional Review Board of the Seoul National University Hospital and SNU-SMG Boramae Medical Center, South Korea, approved the study, and all subjects gave written informed consent.
Clinical assessment
All participants underwent standardized clinical assessments by trained psychiatrists based on the KBASE protocol that incorporated the Korean version of the Consortium to Establish a Registry for Alzheimer‘s Disease Assessment Packet (CERAD-K) [16]. The KBASE neuropsychological assessment protocol incorporating the CERAD neuropsychological battery [17] was also administered to all participants by trained neuropsychologists. Vascular risk factors (VRFs), including diabetes, hypertension, dyslipidemia, coronary heart disease, transient ischemic attack, and stroke were assessed via systematic interviews with participants and their informants by trained nurses. The VRF score (VRS) was calculated as the number of the VRFs present and reported as a percentage [18]. The VRS was treated as a continuous variable for analysis. The Geriatric Depression Scale (GDS) [19] was used to measure the severity of depressive symptoms. Smoking status (never/former/smoker), alcohol intake status (never/former/drinker), and lifetime physical activity was evaluated through nurse interview. Lifetime Total physical Activity Questionnaire [20] was used to assess lifetime physical activity. A metabolic equivalent (MET) value was assigned to the intensity of activity based on the Compendium of physical activities [21].
BMI measure
BMI was the weight in kilograms divided by the square of the height in meters. Research nurses measured the height and body weight of all participants and calculated the current or late-life BMI (BMIlate). All participants were asked to recall their body weights at 20, 30, 40, and 50 years of age. If a participant reported a range, the median was used in calculation. Self-recall of past body weight in older adult was well-validated in a previous, large, long-term prospective study [22, 23]: When older adults [mean(SD) = 70(10.5) years of age] recalled their weights at age 30, 40, and 50 years, the correlation coefficiencts between the real and recalled values were 0.87, 0.89, and 0.90 (all p < 0.0001) in the cited study [22].
The BMI at each lifetime point was calculated using the self-recalled body weight and the current height. Height at 20 years of age was also recalled and used in place of the current height when sensitivity analyses were performed. We considered the average of BMIs at 20 and 30 years to be the early adulthood BMI (BMIearly) and the average BMIs at 40 and 50 years to be the midlife BMI (BMImid).
Measurement of Aβ biomarker
All participants underwent simultaneous three-dimensional (3D) [11C] Pittsburg compound B (PiB)-positron emission tomography (PET) and 3D T1-weighted MRI using a 3.0T Biograph mMR (PET-MR) scanner (Siemens, Washington DC, USA) according to the manufacturer’s protocols. We have described the details of PiB-PET image acquisition and preprocessing previously [24]. The automatic anatomic labeling algorithm and the region combination method [25] were used to determine regions of interest (ROIs) and to characterize PiB retention in the frontal, lateral parietal, posterior cingulate-precuneus, and lateral temporal regions. A global cortical ROI (consisting of the four smaller ROIs) was also defined. A global Aβ retention value, the standardized uptake value ratio (SUVR) for the global cortical ROI, was calculated by dividing the mean values for all voxels of the global cortical ROI by the mean cerebellar uptake value evident in the same images [26]. A participant was classified as Aβ positive if the SUVR of the global ROI was >1.21 [27].
Measurement of neurodegeneration biomarker
All T1-weighted images were acquired in the sagittal orientation using the abovementioned 3.0T PET-MR machine. MRI imaging acquisition and preprocessing were earlier described by our group [24]. All MR images were automatically segmented using FreeSurfer version 6.0 (http://surfer.nmr.mgh.harvard.edu/) with manual correction of minor segmentation errors on all scans. AD-signature region cortical thickness (AD-CT) was defined as a mean cortical thickness of AD signature regions, including the entorhinal, inferior temporal, middle temporal, and fusiform gyrus based on the Deskkan-Killiany atlas [28]; all are known to be sensitive to AD-associated changes [29].
Statistical analyses
We performed sex-specific analyses. Multiple linear regression was used to test the association between BMI (the independent variable) and current global Aβ retention (dependent variable) after controlling for age, apolipoprotein E ɛ4 (APOE4) status, and VRS (covariates). In order to test the association between BMI and AD-CT, the same analysis was performed while controlling the effect of global Aβ retention, as well as age, APOE4 status and VRS. We performed separate regressions analyses for each life period (thus using BMIearly, BMImid, and BMIlate). We applied the Bonferroni correction for multiple testing; the threshold for statistical significance was thus p < 0.017 (i.e., = 0.05/3). To define BMI ranges that significantly affects AD biomarkers, we divided the BMIs exhibiting significant relationships with global Aβ retention (or AD-CT) into three strata: <21 (underweight), 21–25 (healthy weight), and >25 mg/kg2 (overweight) by reference to a previous report [5]. We slightly modified the BMI definitions of underweight used in that report (underweight <20, healthy weight 20.0–24.9, overweight 25.0–29.9, and obese ≥30 mg/kg2) to improve statistical stability because, in our sample, the proportions of underweight and obese individuals were small when the definition of cited report were used. We performed general linear model (GLM) analysis using the stratified BMIs as independent variables. The model included age, APOE4 status, and the VRS as covariates. When the GLM indicated significance, post-hoc tests were performed using the least significant difference (LSD) method. As the GLM analysis was performed for exploratory purpose, p < 0.05 served as the statistical threshold. All analyses were performed with the aid of IBM SPSS Statistics version 22.
RESULTS
Participant characteristics
The demographic and clinical characteristics of all subjects are presented in Table 1. There were significant differences of BMIearly, education, smoking status, alcohol drinking status, and lifetime physical activity between male and female, while no significant sex-difference was found for other variables.
Table 1
Demographic, clinical, and biological characteristics by sex
| Characteristics | Men (n = 104) | Women (n = 108) | p |
| Age | 71.3 (7.1) | 70.9 (6.4) | 0.659 |
| Education | 13.1 (4.1) | 9.79 (4.76) | <0.001 |
| APOE ɛ4 carriers (%) | 20 (19.2) | 18 (16.8) | 0.649 |
| BMI measures | |||
| Current BMI (late life) | 23.9 (2.9) | 24.4 (2.9) | 0.303 |
| BMI in mid-life | 23.7 (2.6) | 23.4 (2.6) | 0.466 |
| BMI in early adult | 22.4 (2.2) | 21.7 (2.6) | 0.047 |
| Vascular risks (%) | |||
| Diabetes mellitus | 24 (19.2) | 22 (16.4) | 0.480 |
| Hypertension | 46 (44.2) | 53 (49.1) | 0.133 |
| Hyperlipidemia | 27 (26) | 42 (38.9) | 0.132 |
| Coronary heart disease | 5 (4.8) | 7 (6.5) | 0.598 |
| Stroke | 0 (0) | 0 (0) | |
| TIA | 1 (1) | 0 (0) | 0.307 |
| VRS | 16.0 (15.39) | 18.8 (15.97) | 0.195 |
| GDS score | 4.58 (4.91) | 5.15 (4.62) | 0.384 |
| Smoking status (%) | <0.001 | ||
| Never | 35 (33.7) | 106 (98.2) | |
| Former | 60 (57.7) | 1 (0.9) | |
| Smoker | 9 (8.7) | 1 (0.9) | |
| Alcohol drink status (%) | <0.001 | ||
| Never | 22 (21.1) | 95 (88.0) | |
| Former | 29 (27.9) | 0 (0) | |
| Drinker | 53 (51.0) | 13 (12.0) | |
| Lifetime physical | 93.923 (64.621) | 72.252 (49.355) | 0.007 |
| activity | |||
| Global Aβ deposition | 1.21 (0.29) | 1.20 (0.23) | 0.817 |
| Aβ positivity (%) | 20 (19.2) | 25 (23.1) | 0.486 |
| AD-CT | 2.821 (0.181) | 2.865 (0.175) | 0.077 |
Data are presented as mean (SDs) or as n (%). APOE, apolipoprotein E; BMI, body mass index; TIA, transient ischemic attack; VRS, vascular risk score; GDS, Geriatric depression scale; Aβ, amyloid-β; AD-CT, Alzheimer’s disease signature cortical thickness.
Association between BMI at each life stage and cerebral Aβ deposition
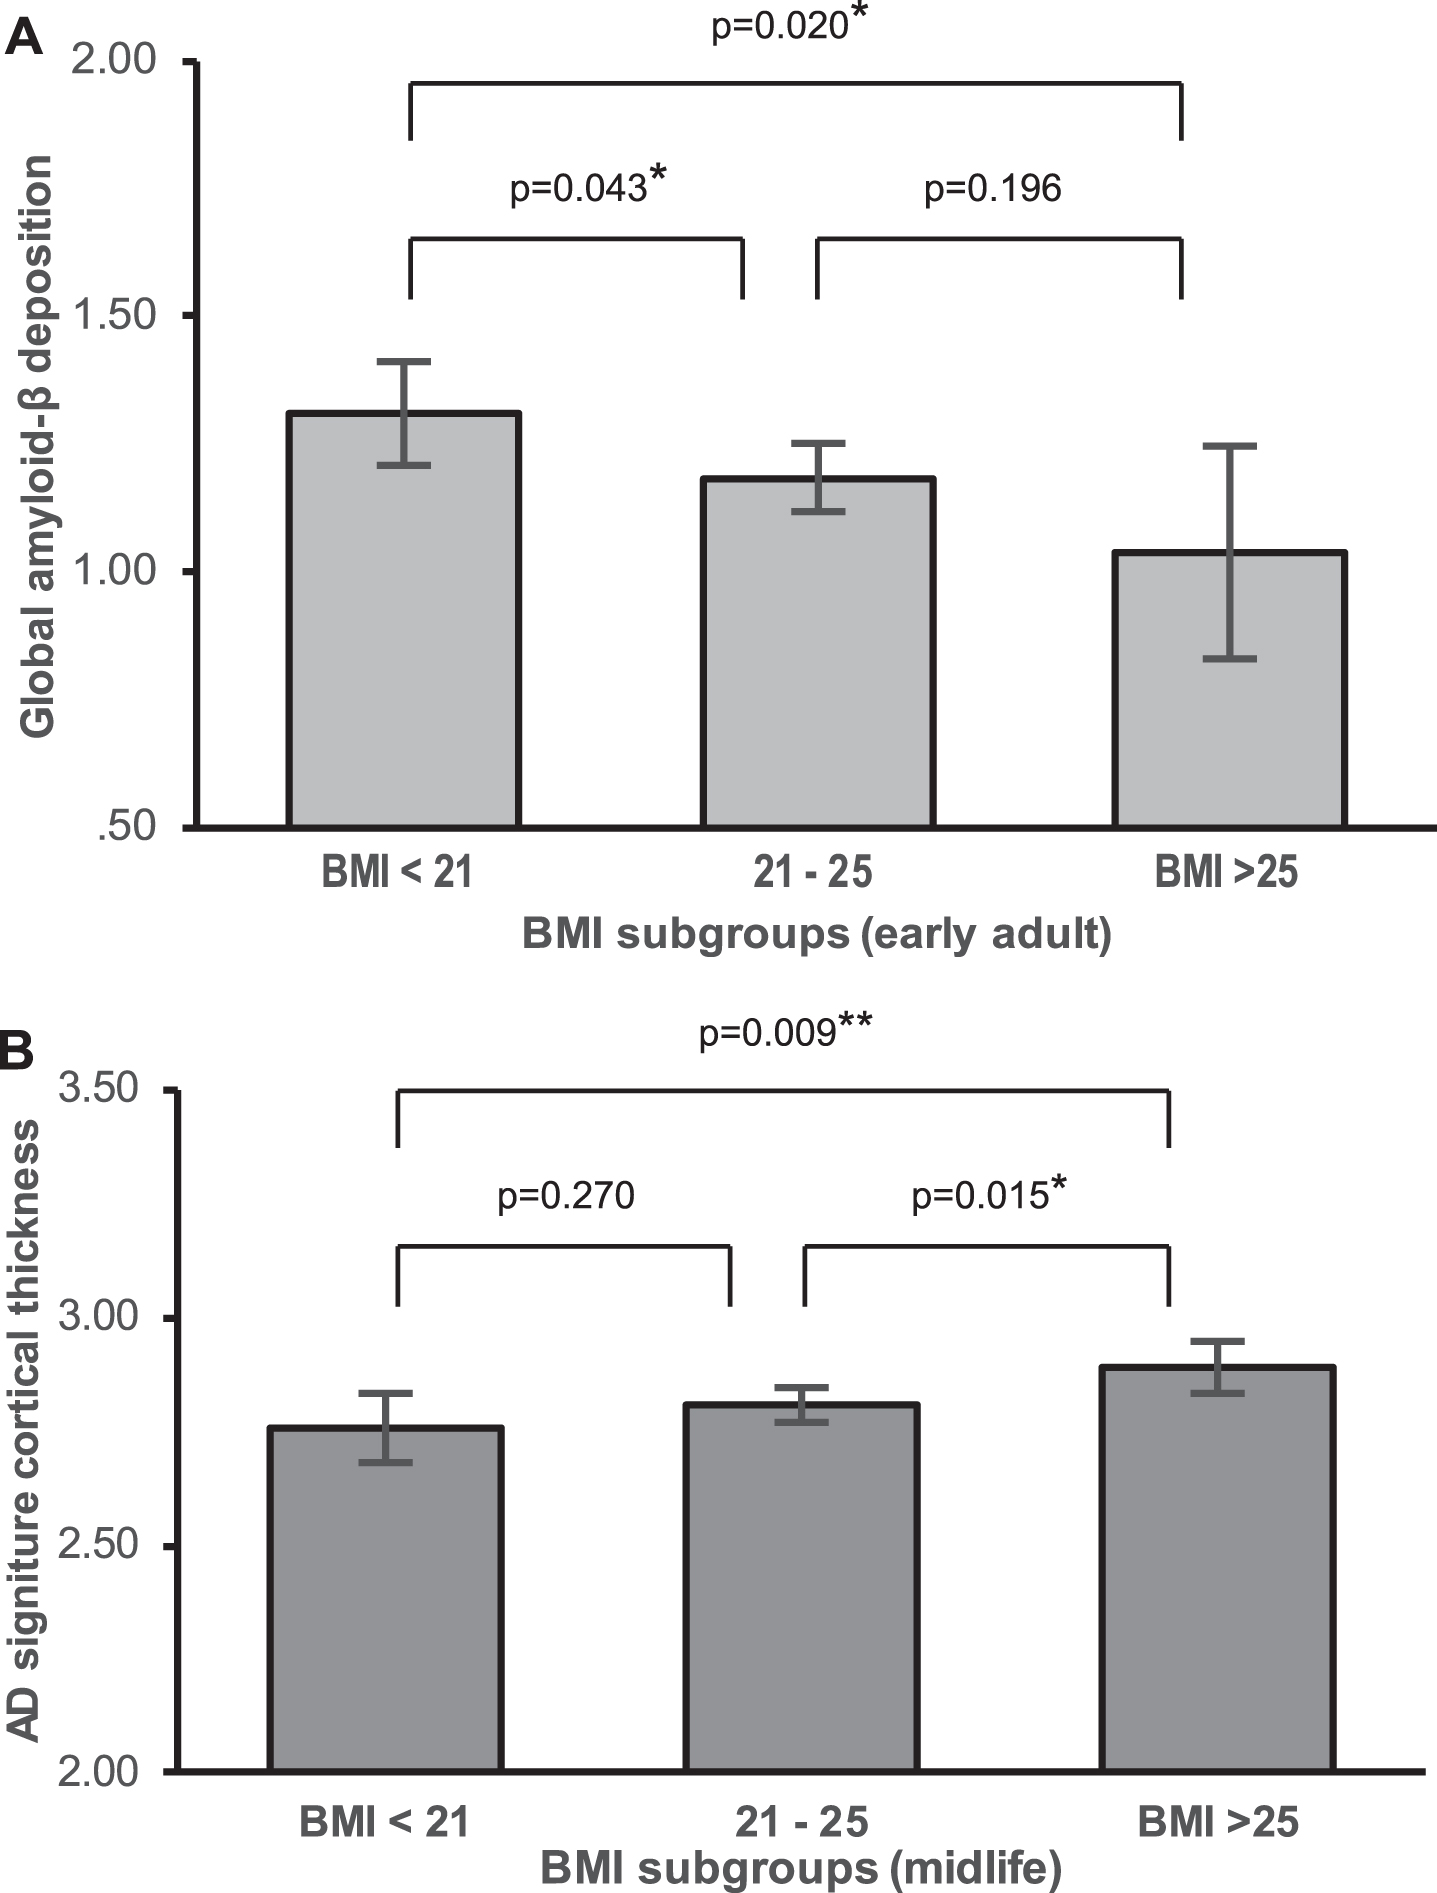
In males, multiple linear regression revealed that both BMIearly and BMImid were significantly negatively associated with global Aβ retention (Table 2 and Fig. 1A–C) whereas BMIlate was not. Additional exploratory GLM analysis showed that the BMIearly strata (BMI <21, 21–25, and BMI >25 mg/kg2) differed in terms of global Aβ retention levels; the lowest BMIearly stratum (BMI <21) was associated with higher Aβ retention than the other two BMIearly strata on post hoc analysis (Fig. 2A). The three BMImid strata did not differ significantly in terms of Aβ retention. In contrast to males, we observed no significant relationship between BMI at any life stage and Aβ retention in females (Table 2 and Fig. 1D–F).
Table 2
Association of BMI in each life period with global cerebral Aβ deposition
| Sex | B | SE | Beta | p | pB |
| Men | |||||
| BMI in early adult | –0.038 | 0.012 | –0.285 | 0.003 | 0.009 |
| BMI in mid-life | –0.028 | 0.011 | –0.258 | 0.009 | 0.027 |
| Late-life BMI | –0.021 | 0.010 | –0.212 | 0.042 | 0.126 |
| Women | |||||
| BMI in early adult | –0.002 | 0.008 | –0.026 | 0.786 | >0.99 |
| BMI in mid-life | 0.003 | 0.008 | 0.041 | 0.673 | >0.99 |
| Late-life BMI | 0.003 | 0.007 | 0.038 | 0.690 | >0.99 |
The results of multivariate linear regression models and the beta coefficients. Adjusted for age, apolipoprotein ɛ4 positivity, and vascular risk score. BMI, body mass index; Aβ, amyloid-β; pB, p-value corrected by Bonferroni’s method.
Fig.1
Body mass index and amyloid beta deposition. Partial regression plot showing relationships between past and current BMIs and amyloid-β deposition after adjusting for covariates in males (A, B, C), and female (D, E, F).
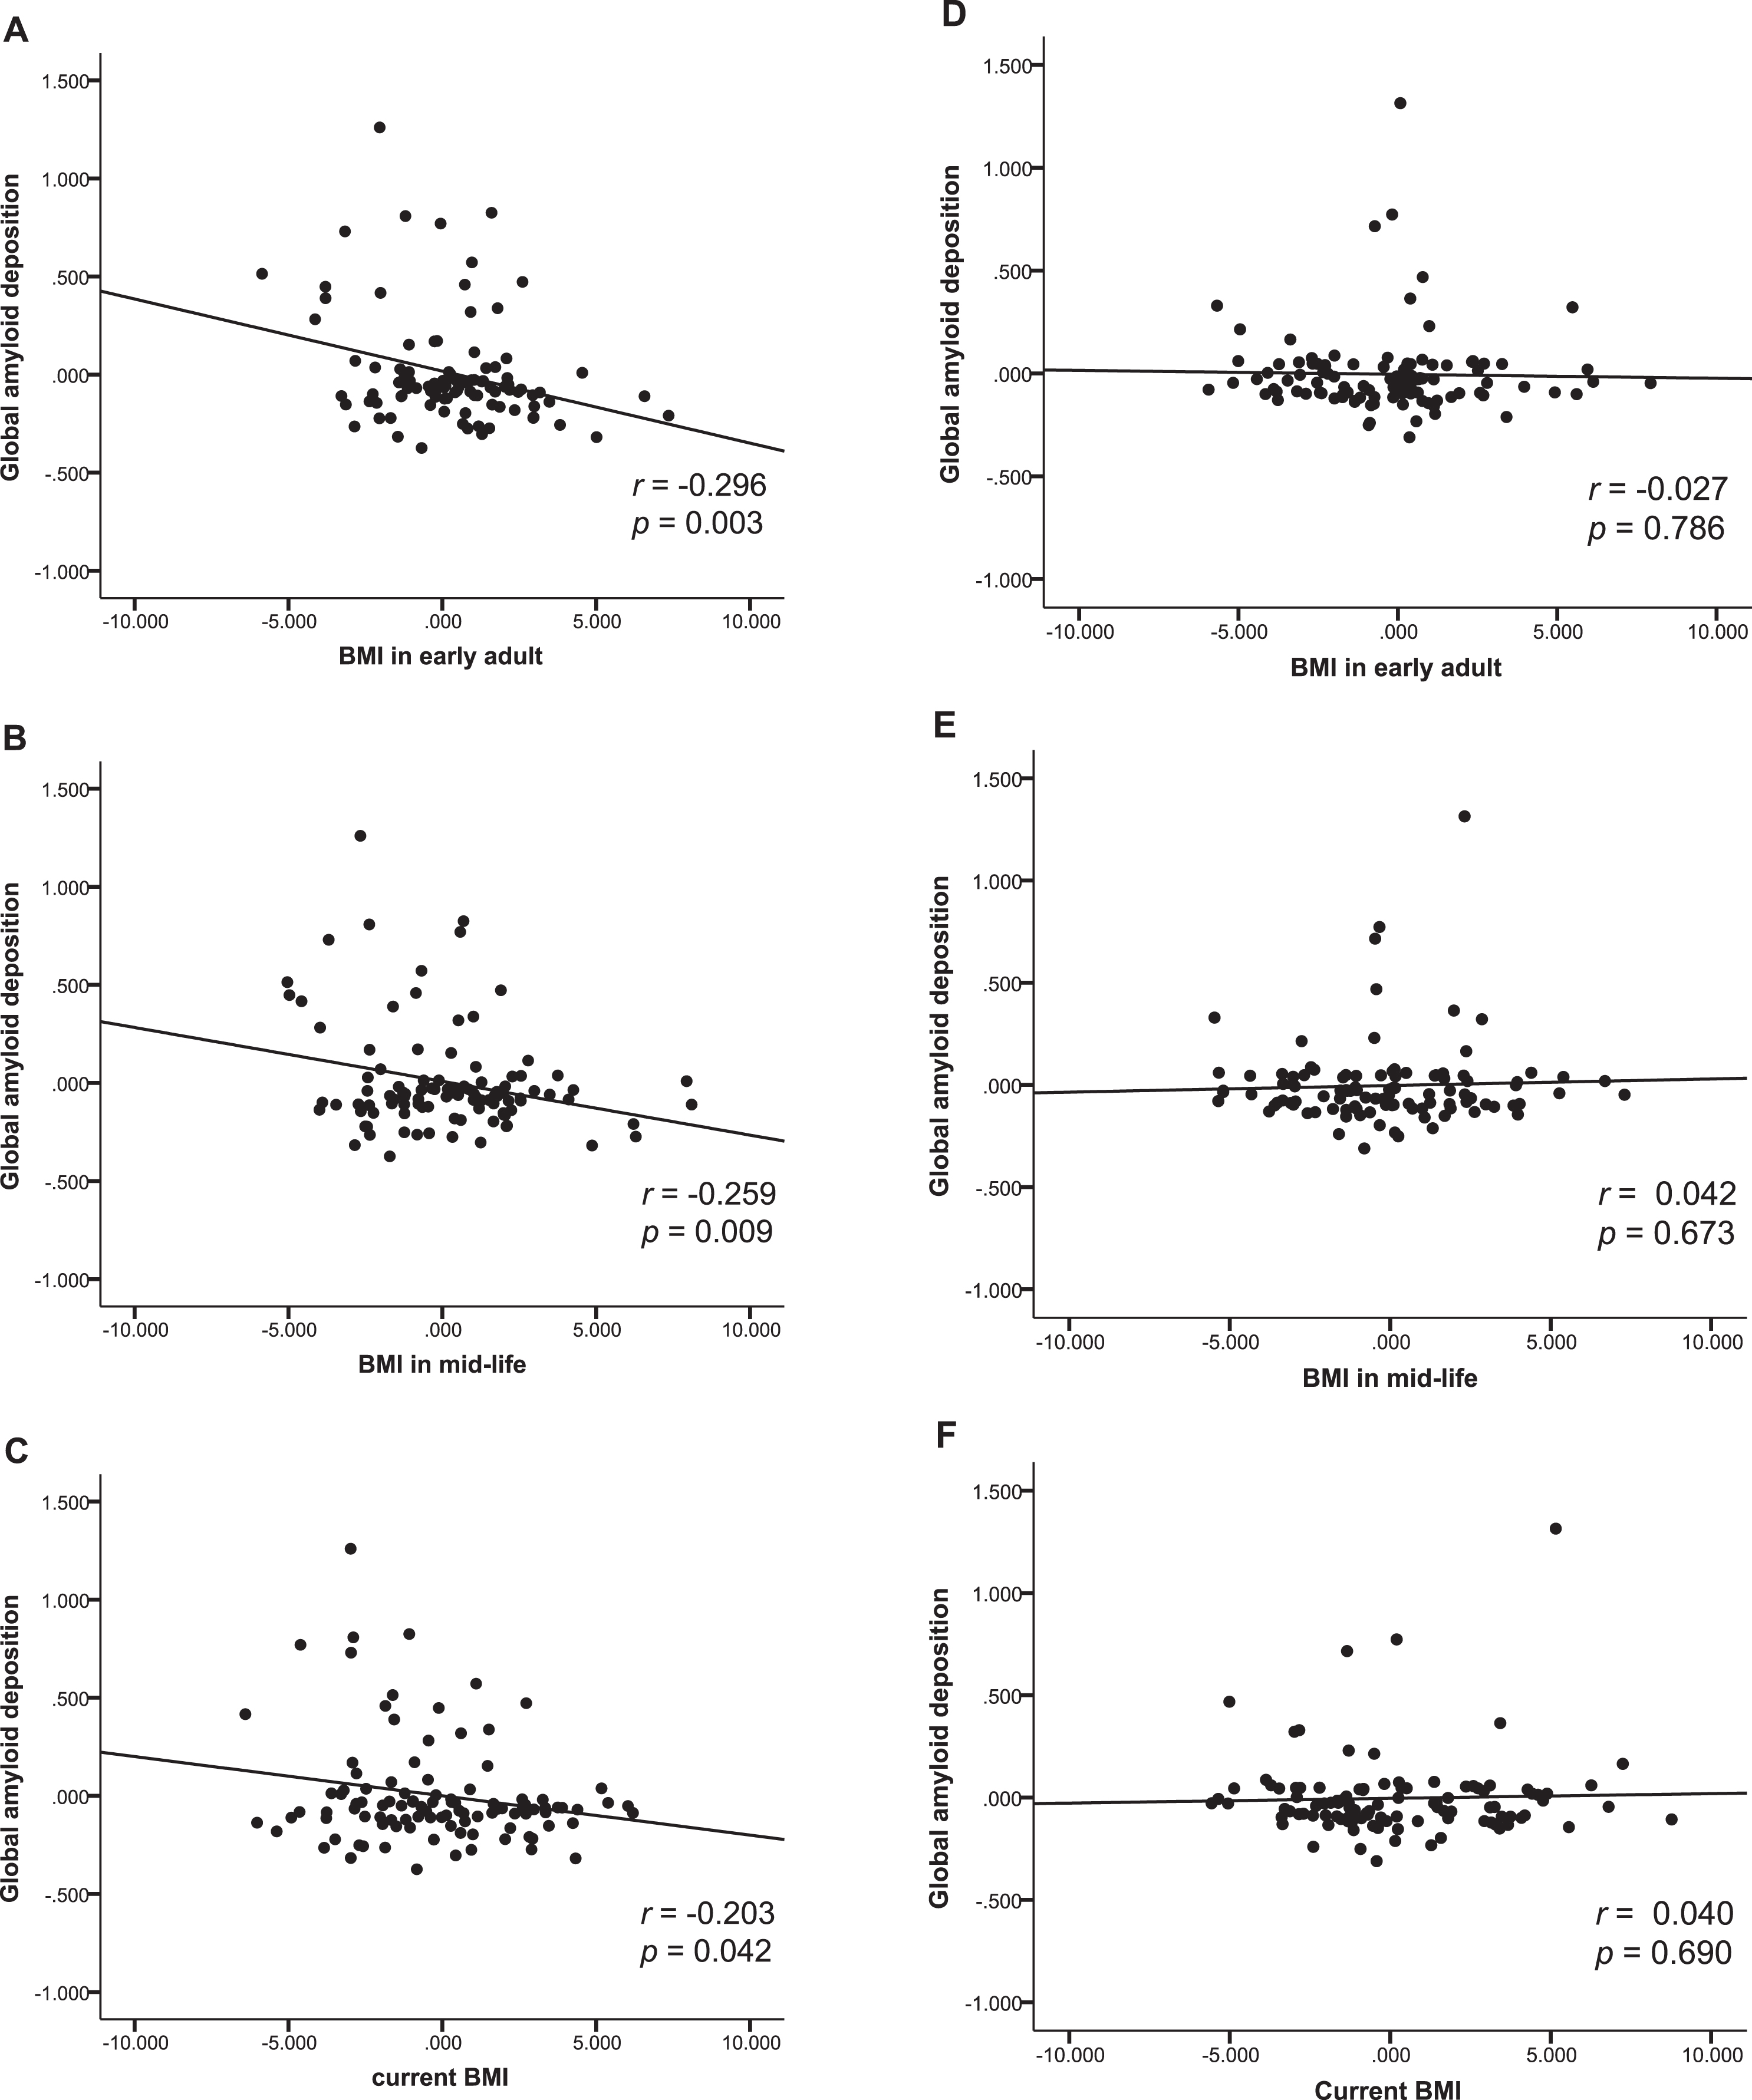
Fig.2
Differences in AD biomarker level by BMI stratum. Differences in adjusted means of global Aβ deposition between early adulthood BMI strata (A), and Adjusted means of AD signature region cortical thickness between midlife BMI strata in males (B).
Association between BMI in each life stage and AD signature cortical thickness
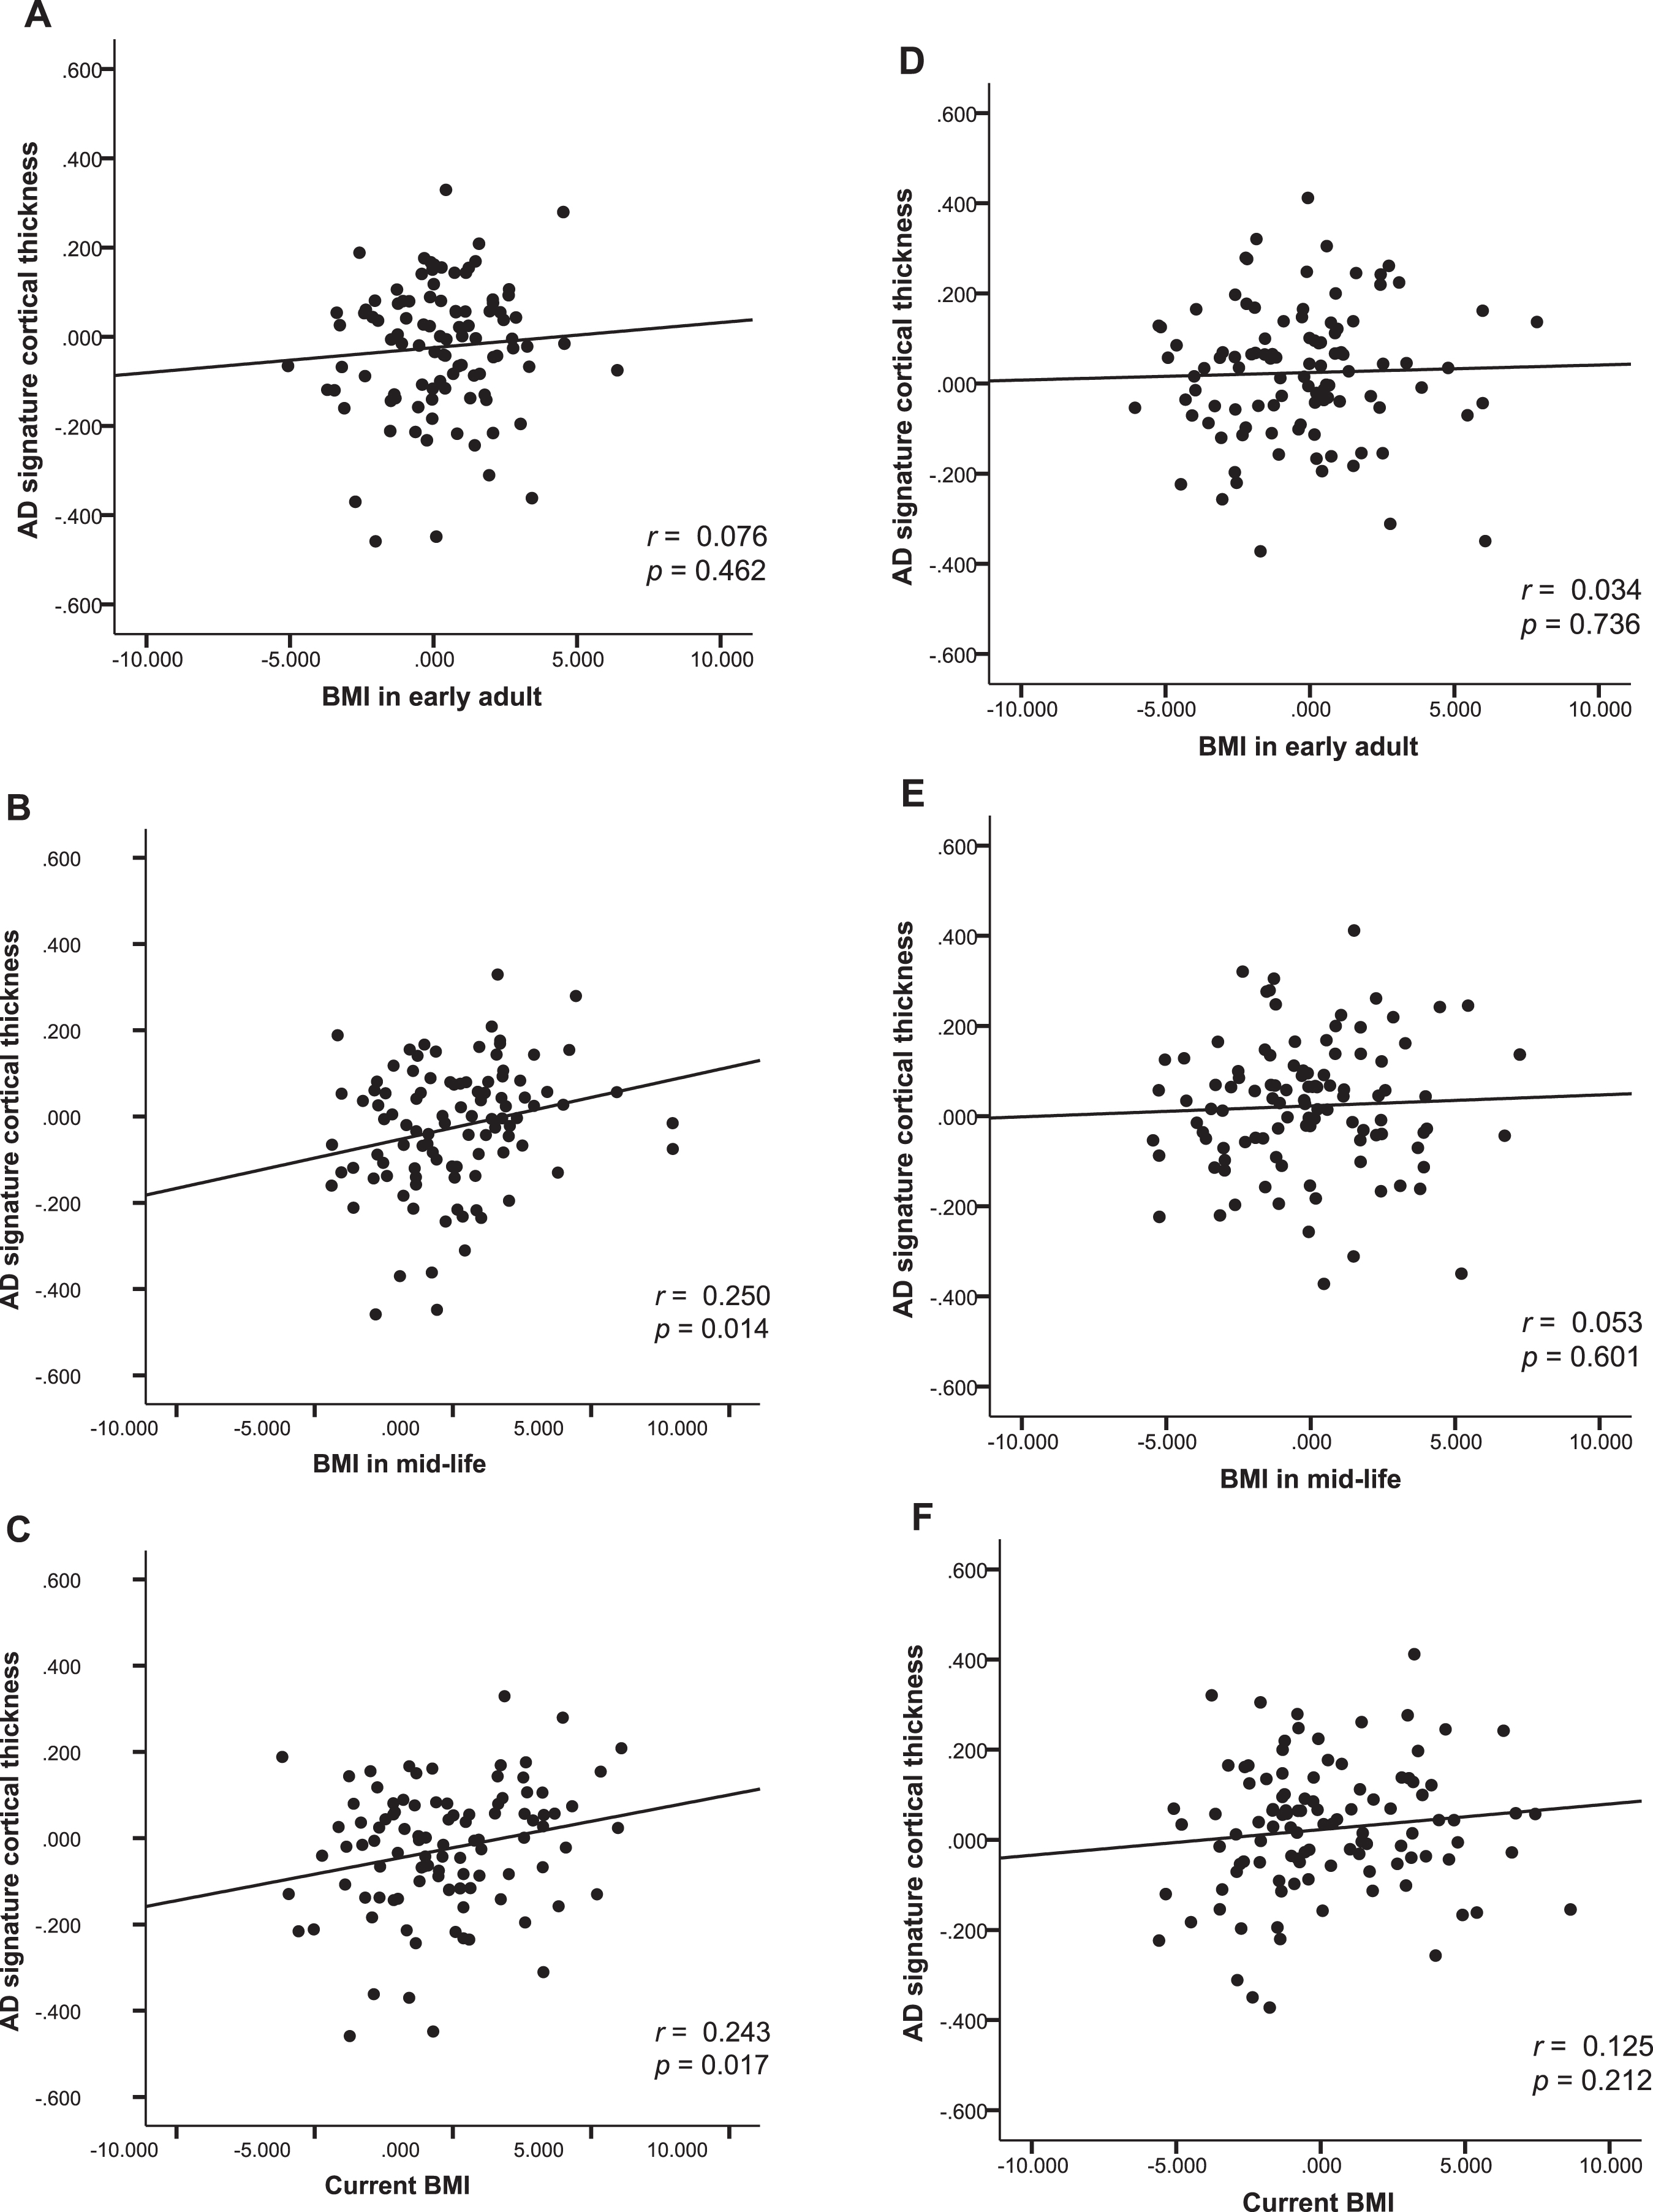
In males, BMImid was significantly positively associated with AD-CT. In contrast, BMIearly and BMIlate was not associated with AD-CT (Table 3 and Fig. 3A–C). Exploratory GLM analysis showed that, on post hoc analysis, the three BMImid strata differed significantly in terms of AD-CT; the highest BMImid (BMI >25 mg/kg2) was associated with a greater AD-CT than the other two strata (Fig. 2B). In females, none of the BMI strata at any life stages was significantly associated with AD-CT (Table 3 and Fig. 3D-E).
Table 3
Association between BMI in each life period and AD signature cortical thickness
| Sex | B | SE | Beta | p | pB |
| Men | |||||
| BMI in early adult | 0.006 | 0.008 | 0.064 | 0.462 | >0.99 |
| BMI in mid-life | 0.015 | 0.006 | 0.219 | 0.014 | 0.043 |
| Late-life BMI | 0.013 | 0.006 | 0.221 | 0.017 | 0.051 |
| Women | |||||
| BMI in early adult | 0.002 | 0.006 | 0.029 | 0.736 | >0.99 |
| BMI in mid-life | 0.003 | 0.006 | 0.044 | 0.601 | >0.99 |
| Late-life BMI | 0.006 | 0.005 | 0.103 | 0.212 | 0.636 |
The results of multivariate linear regression models are presented with the beta coefficient. Adjusted for age, apolipoprotein ɛ4 positivity, vascular risk score, and global cerebral Aβ retention. BMI, body mass index; AD, Alzheimer’s disease; pB, p-value corrected by Bonferroni’s method.
Fig.3
Body mass index and AD signature cortical thickness. Partial regression plot showing relationships between past and current BMIs and AD signature cortical thickness after adjusting for covariates in males (A, B, C), and females (D, E, F).
Sensitivity analyses
We performed the same multiple regression analyses using the BMIs based on the height at age 20 years instead of the current height. The results were consistent. We further conducted sensitivity analyses by changing the age points of BMI measurement to 20, 30, 40, and 50 years, and the current (late-life) age, instead of early adulthood (20–30 years), midlife (40–50 years), and current age; the finding were similar. The sensitivity analyses including GDS, smoking status, alcohol intake status, and lifetime physical activity as additional covariates produced similar results (Tables 4 and 5).
Table 4
Results from sensitivity analyses* for the association of BMI in each life period with global cerebral Aβ deposition
| Sex | B | SE | Beta | p | pB |
| Men | |||||
| BMI in early adult | –0.036 | 0.013 | –0.272 | 0.006 | 0.018 |
| BMI in mid-life | –0.028 | 0.011 | –0.254 | 0.012 | 0.037 |
| Late-life BMI | –0.023 | 0.011 | –0.240 | 0.028 | 0.084 |
| Women | |||||
| BMI in early adult | –0.001 | 0.008 | –0.018 | 0.854 | >0.99 |
| BMI in mid-life | 0.004 | 0.008 | 0.045 | 0.661 | >0.99 |
| Late-life BMI | 0.003 | 0.007 | 0.038 | 0.696 | >0.99 |
*Adjusted for GDS score, smoking status, alcohol intake status, and lifetime physical activity as well as age, apolipoprotein ɛ4 positivity, and vascular risk score. BMI, body mass index; Aβ, amyloid-β; GDS, geriatric depression scale; pB, p-value corrected by Bonferroni’s method.
Table 5
Results from sensitivity analyses* for the association between BMI in each life period and AD signature cortical thickness
| Sex | B | SE | Beta | p | pB |
| Men | |||||
| BMI in early adult | 0.005 | 0.008 | 0.059 | 0.520 | >0.99 |
| pBMI in mid-life | 0.014 | 0.006 | 0.205 | 0.027 | 0.080 |
| Late-life BMI | 0.013 | 0.006 | 0.220 | 0.027 | 0.081 |
| Women | |||||
| BMI in early adult | 0.001 | 0.006 | 0.020 | 0.973 | >0.99 |
| BMI in mid-life | 0.002 | 0.006 | 0.033 | 0.712 | >0.99 |
| Late-life BMI | 0.007 | 0.005 | 0.109 | 0.206 | 0.618 |
*Adjusted for GDS score, smoking status, alcohol intake status, and lifetime physical activity as well as age, apolipoprotein ɛ4 positivity, vascular risk score, and global cerebral Aβ retention. BMI, body mass index; AD, Alzheimer’s disease; GDS, geriatric depression scale; pB, p-value corrected by Bonferroni’s method.
DISCUSSION
We investigated the sex-specific association of BMI at each life stage with in vivo cerebral Aβ deposition and the AD-CT of cognitively healthy older adults. In males, lower BMI prior to late life was closely related to greater Aβ deposition. In addition, lower BMIs in midlife was associated with reduced AD-CT. In females, however, we found no significant relationship between past or current BMI and AD biomarkers. To the best of our knowledge, this is the first report on the age- and sex-specific influence of BMI on in vivo AD-related brain pathologies.
The male-specific association of lower BMIearly and BMImid with greater Aβ deposition is in line with the epidemiological report of the Baltimore Longitudinal Study of Aging (BLSA) [1]. Over about 23 years follow-up, the BLSA reported that being underweight at age 30, 40, or 45 years increased the risk of AD more than five-fold in males but not females. This sex-specific association may be explained by the different types of body fat. Even with the same BMI, males have less subcutaneous fat than females [30, 31]. Leptin, a hormone synthesized by fat to regulate appetite and energy expenditure [31–33], reduces Aβ levels both in vivo and in vitro. As leptin expression is greater in subcutaneous than visceral fat [31, 36], leptin is more likely to be low in thin males compared to thin females. This may explain male-specific inverse association between past BMI and Aβ deposition. Another possible explanation is that the difference in estrogen production between the sexes may play a part. Like leptin, estrogen reduces Aβ production and protects against Aβ deposition [37, 38]. In males, estrogen production mainly depends on peripheral aromatization of testosterone in fat [39], while estrogen is produced principally by the ovaries in females [40]. Therefore, a low BMI prior to late life may result in decrease of estrogen production from fat and subsequent increase of Aβ pathology in male, but not in female.
A recent study on non-demented elderly subjects showed that a lower late-life BMI was associated with increased the brain Aβ burden [13, 14]. We observed a similar relationship prior to correction for multiple comparisons (Table 2). However, this relationship may reflect the correlation between earlier and late life BMIs. When we controlled for BMIearly, the associations between BMIlate and Aβ disappeared, indicating that earlier BMI made a major contribution to Aβ deposition.
We found that a lower BMImid was significantly associated with decreased AD-CT in males, but not in females. Although statistical significance was not attained, there was a trend toward an significant association between lower late life BMI and a reduced AD-CT. Similarly, a cross-sectional MRI study on a population ranging very widely in age (including young to old adults) found a significant positive relationship between BMI and regional brain volume only in males [41]. Again, leptin and estrogen may be responsible for the relationship between a lower BMI and cortical atrophy of AD-related regions in males. Leptin stimulates neurogenesis [42], reduces neurodegeneration [43], and attenuates accumulation of phosphorylated tau [34]. Estrogen has diverse neuroprotective effects including reducing Aβ-associated neurotoxicity [44], improving synapse formation [45, 46], increasing cerebral blood flow and metabolism [47], and reducing mitochondrial damage [48]. As mentioned above in the context of amyloid deposition, a relative shortage of leptin or estrogen may render males with lower BMIs more vulnerable to various neurodegenerative processes. However, reverse causality must also be considered. AD-related neurodegenerative process may affect brain regions associated with energy metabolism or dietary habit, which results in BMI decrease [49, 50].
The relationships that we found between a lower BMI prior to late life and increased AD pathologies are in line with several previous studies reporting that being underweight in early adulthood or midlife increased the risk of AD dementia [1, 5]. However, other studies reported that being overweight or obese in midlife increased the incidence of AD dementia [2–4], the cerebral Aβ burden [11], or brain atrophy [51, 52]. The inconsistency may reflect differences in participants characteristics, such as the proportions of those with severe cerebrovascular burdens or those who were overweight/obese or underweight. Anstey et al. [4]. found a U-shaped relationship between BMI in midlife and the AD dementia risk, suggesting that both overweight and underweight status may elevate the risk. As the proportion of participants who are obese (BMI ≥30 mg/kg2) was very small in the current sample (0.5% in early adulthood, 1.9% in midlife, and 3.8% in late life), we were perhaps unable to find a significant association between midlife high BMI and in vivo AD pathologies. In addition, individuals with severe cerebrovascular disease, which might be associated with overweight status, were not included in our study under the strict inclusion and exclusion criteria.
Several potential limitations must be discussed. First, we used recalled body weight to measure the past BMI, which may result in recall bias. However, a previous study demonstrated that past weight recalled by elderly people with normal cognitive function was quite accurate [22], such that the correlations between the real and recalled values were very high (above 0.87∼0.90) and the difference between actual weights measured 26 years prior and recalled weight was only 0.67 kg. Although a difference between real and recalled weight was evident when the current BMI was >30 kg/m2 and the current age ≥90 years [22], we excluded those aged ≥90 years and only <3% of our participants had BMIs >30 kg/m2. Together, the data support the validity of our past BMI measurement. In addition, obese/overweight individuals tends to underestimate their past body weights, while slender individuals tend to overestimate [23]. Therefore, overall variation of self-recalled BMI would be smaller than that of actually measured BMI. This implies that the correlation between self-recalled BMI and AD biomarkers could be weaker than the correlation between actual BMI and AD biomarkers. Given such smaller effect size, we can expect that the direction of bias due to recall error is towards the null. Nevertheless, our study revealed the significant relationship between BMI and AD biomarkers, supporting the true relationship. Second, given the cross-sectional design, inferring causal relationships is difficult. However, as AD pathologies (Aβ deposition in particular) were significantly associated with early adulthood, but not current (late life) BMI, the pathologies appear to be the consequence of a low, past BMI rather than the cause of the BMI decrease. Third, various lifestyle factors and mood status may confound the association between BMI and AD biomarkers. In order to minimize the possibility, we conducted sensitivity analyses including smoking status, alcohol intake status, lifetime physical activity, and GDS as additional covariates and obtained similar results. Nevertheless, we could not control food intake or dietary quality due to lack of information. Further studies need to be conducted considering dietary quality or nutritional components of intake foods.
Conclusions
Our results support a male-specific association between BMI prior to late life, and in vivo AD pathologies. Avoiding underweight status early in life may be important to prevent AD dementia in males, but not females.
ACKNOWLEDGMENTS
This study was supported by a grant from Ministry of Science and ICT (Grant No: NRF-2014M3C7A1046042) and a grant of the Korea Health Technology R&D Project through the Korea Health Industry Development Institute (KHIDI), funded by the Ministry of Health & Welfare, Republic of Korea (grant number: HI18C0630 & HI19C0149).
Authors’ disclosures available online (https://www.j-alz.com/manuscript-disclosures/19-1216r2).
REFERENCES
[1] | Beydoun MA , Lhotsky A , Wang Y , Dal Forno G , An Y , Metter EJ , Ferrucci L , O’Brien R , Zonderman AB ((2008) ) Association of adiposity status and changes in early to mid-adulthood with incidence of Alzheimer’s disease. Am J Epidemiol 168: , 1179–1189. |
[2] | Fitzpatrick AL , Kuller LH , Lopez OL , Diehr P , O’Meara ES , Longstreth W , Luchsinger JA ((2009) ) Midlife and late-life obesity and the risk of dementia: Cardiovascular health study. Arch Neurol 66: , 336–342. |
[3] | Hassing LB , Dahl AK , Thorvaldsson V , Berg S , Gatz M , Pedersen NL , Johansson B ((2009) ) Overweight in midlife and risk of dementia: A 40-year follow-up study. Int J Obes (Lond) 33: , 893–898. |
[4] | Anstey K , Cherbuin N , Budge M , Young J ((2011) ) Body mass index in midlife and late-life as a risk factor for dementia: A meta-analysis of prospective studies. Obes Rev 12: , e426–e437. |
[5] | Qizilbash N , Gregson J , Johnson ME , Pearce N , Douglas I , Wing K , Evans SJ , Pocock SJ ((2015) ) BMI and risk of dementia in two million people over two decades: A retrospective cohort study. Lancet Diabetes Endocrinol 3: , 431–436. |
[6] | Gustafson D , Rothenberg E , Blennow K , Steen B , Skoog I ((2003) ) An 18-year follow-up of overweight and risk of Alzheimer disease. Arch Intern Med 163: , 1524–1528. |
[7] | Luchsinger JA , Patel B , Tang M-X , Schupf N , Mayeux R ((2007) ) Measures of adiposity and dementia risk in elderly persons. Arch Neurol 64: , 392–398. |
[8] | Tolppanen A-M , Ngandu T , Kåreholt I , Laatikainen T , Rusanen M , Soininen H , Kivipelto M ((2014) ) Midlife and late-life body mass index and late-life dementia: Results from a prospective population-based cohort. J Alzheimers Dis 38: , 201–209. |
[9] | Chen Y-C , Chen T-F , Yip P-K , Hu C-Y , Chu Y-M , Chen J-H ((2010) ) Body mass index (BMI) at an early age and the risk of dementia. Arch Gerontol Geriatr 50: , S48–S52. |
[10] | Dahl AK , Löppönen M , Isoaho R , Berg S , Kivelä SL ((2008) ) Overweight and obesity in old age are not associated with greater dementia risk. J Am Geriatr Soc 56: , 2261–2266. |
[11] | Chuang Y , An Y , Bilgel M , Wong D , Troncoso J , O’Brien RJ , Breitner J , Ferruci L , Resnick S , Thambisetty M ((2016) ) Midlife adiposity predicts earlier onset of Alzheimer’s dementia, neuropathology and presymptomatic cerebral amyloid accumulation. Mol Psychiatry 21: , 910–915. |
[12] | Ewers M , Schmitz S , Hansson O , Walsh C , Fitzpatrick A , Bennett D , Minthon L , Trojanowski JQ , Shaw LM , Faluyi YO , Vellas B , Dubois B , Blennow K , Buerger K , Teipel SJ , Weiner M , Hampel H , Alzheimer’s Disease Neuroimaging Initiative ((2012) ) Body mass index is associated with biological CSF markers of core brain pathology of Alzheimer’s disease. Neurobiol Aging 33: , 1599–1608. |
[13] | Vidoni E , Townley R , Honea R , Burns J , Alzheimer’s Disease Neuroimaging Initiative ((2011) ) Alzheimer disease biomarkers are associated with body mass index. Neurology 77: , 1913–1920. |
[14] | Hsu DC , Mormino EC , Schultz AP , Amariglio RE , Donovan NJ , Rentz DM , Johnson KA , Sperling RA , Marshall GA ((2016) ) Lower late-life body-mass index is associated with higher cortical amyloid burden in clinically normal elderly. J Alzheimers Dis 53: , 1097–1105. |
[15] | Byun MS , Yi D , Lee JH , Choe YM , Sohn BK , Lee JY , Choi HJ , Baek H , Kim YK , Lee YS , Sohn CH , Mook-Jung I , Choi M , Lee YJ , Lee DW , Ryu SH , Kim SG , Kim JW , Woo JI , Lee DY ((2017) ) Korean Brain Aging Study for the early diagnosis and prediction of Alzheimer’s disease: Methodology and baseline sample characteristics. Psychiatry Investig 14: , 851–863. |
[16] | Lee JH , Lee KU , Lee DY , Kim KW , Jhoo JH , Kim JH , Lee KH , Kim SY , Han SH , Woo JI ((2002) ) Development of the Korean Version of the Consortium to Establish a Registry for Alzheimer’s Disease Assessment Packet (CERAD-K) clinical and neuropsychological assessment batteries. J Gerontol B Psychol Sci Soc Sci 57: , P47–P53. |
[17] | Lee DY , Lee KU , Lee JH , Kim KW , Jhoo JH , Kim SY , Yoon JC , Woo SI , Ha J , Woo JI ((2004) ) A normative study of the CERAD neuropsychological assessment battery in the Korean elderly. J Int Neuropsychol Soc 10: , 72–81. |
[18] | DeCarli C , Mungas D , Harvey D , Reed B , Weiner M , Chui H , Jagust W ((2004) ) Memory impairment, but not cerebrovascular disease, predicts progression of MCI to dementia. Neurology 63: , 220–227. |
[19] | Kim JY , Park JH , Lee JJ , Huh Y , Lee SB , Han SK , Choi SW , Lee DY , Kim KW , Woo JI ((2008) ) Standardization of the Korean version of the geriatric depression scale: Reliability, validity, and factor structure. Psychiatry Investig 5: , 232. |
[20] | Friedenreich CM , Courneya KS , Bryant HE ((1998) ) The lifetime total physical activity questionnaire: Development and reliability. Med Sci Sports Exerc 30: , 266–274. |
[21] | Ainsworth BE , Haskell WL , Herrmann SD , Meckes N , Bassett DR Jr , Tudor-Locke C , Greer JL , Vezina J , Whitt-Glover MC , Leon AS ((2011) ) Compendium of Physical Activities: A second update of codes and MET values. Med Sci Sports Exerc 43: , 1575–1581. |
[22] | Kyulo NL , Knutsen SF , Tonstad S , Fraser GE , Singh PN ((2012) ) Validation of recall of body weight over a 26-year period in cohort members of the Adventist Health Study 2. Ann Epidemiol 22: , 744–746. |
[23] | Stevens J , Keil JE , Waid LR , Gazes PC ((1990) ) Accuracy of current, 4-year, and 28-year self-reported body weight in an elderly population. Am J Epidemiol 132: , 1156–1163. |
[24] | Park J-C , Han S-H , Yi D , Byun MS , Lee JH , Jang S , Ko K , Jeon SY , Lee Y-S , Kim YK ((2019) ) Plasma tau/amyloid-β1–42 ratio predicts brain tau deposition and neurodegeneration in Alzheimer’s disease. Brain 142: , 771–786. |
[25] | Reiman EM , Chen K , Liu X , Bandy D , Yu M , Lee W , Ayutyanont N , Keppler J , Reeder SA , Langbaum JB ((2009) ) Fibrillar amyloid-β burden in cognitively normal people at 3 levels of genetic risk for Alzheimer’s disease. Proc Natl Acad Sci U S A 106: , 6820–6825. |
[26] | Choe YM , Sohn BK , Choi HJ , Byun MS , Seo EH , Han JY , Kim YK , Yoon EJ , Lee J-M , Park J ((2014) ) Association of homocysteine with hippocampal volume independent of cerebral amyloid and vascular burden. Neurobiol Aging 35: , 1519–1525. |
[27] | Villeneuve S , Rabinovici GD , Cohn-Sheehy BI , Madison C , Ayakta N , Ghosh PM , La Joie R , Arthur-Bentil SK , Vogel JW , Marks SM ((2015) ) Existing Pittsburgh Compound-B positron emission tomography thresholds are too high: Statistical and pathological evaluation. Brain 138: , 2020–2033. |
[28] | Desikan RS , Ségonne F , Fischl B , Quinn BT , Dickerson BC , Blacker D , Buckner RL , Dale AM , Maguire RP , Hyman BT ((2006) ) An automated labeling system for subdividing the human cerebral cortex on MRI scans into gyral based regions of interest. Neuroimage 31: , 968–980. |
[29] | Jack CR , Wiste HJ , Weigand SD , Rocca WA , Knopman DS , Mielke MM , Lowe VJ , Senjem ML , Gunter JL , Preboske GM ((2014) ) Age-specific population frequencies of cerebral β-amyloidosis and neurodegeneration among people with normal cognitive function aged 50–89 years: A cross-sectional study. Lancet Neurol 13: , 997–1005. |
[30] | Pradhan AD ((2014) ) Sex differences in the metabolic syndrome: Implications for cardiovascular health in women. Clin Chem 60: , 44–52. |
[31] | Ahima RS , Flier JS ((2000) ) Adipose tissue as an endocrine organ. Trends Endocrinol Metab 11: , 327–332. |
[32] | Klein S , Coppack SW , Mohamed-Ali V , Landt M ((1996) ) Adipose tissue leptin production and plasma leptin kinetics in humans. Diabetes 45: , 984–987. |
[33] | Elmquist JK , Maratos-Flier E , Saper CB , Flier JS ((1998) ) Unraveling the central nervous system pathways underlying responses to leptin. Nat Nurosci 1: , 445–450. |
[34] | Greco SJ , Sarkar S , Johnston JM , Tezapsidis N ((2009) ) Leptin regulates tau phosphorylation and amyloid through AMPK in neuronal cells. Biochem Biophys Res Commun 380: , 98–104. |
[35] | Fewlass DC , Noboa K , Pi-Sunyer FX , Johnston JM , Yan SD , Tezapsidis N ((2004) ) Obesity-related leptin regulates Alzheimer’s Aβ. FASEB J 18: , 1870–1878. |
[36] | Van Harmelen V , Reynisdottir S , Eriksson P , Thörne A , Hoffstedt J , Lönnqvist F , Arner P ((1998) ) Leptin secretion from subcutaneous and visceral adipose tissue in women. Diabetes 47: , 913–917. |
[37] | Xu H , Gouras GK , Greenfield JP , Vincent B , Naslund J , Mazzarelli L , Fried G , Jovanovic J , Seeger M , Relkin N ((1998) ) Estrogen reduces neuronal generation of Alzheimer β-amyloid peptides. Nat Med 4: , 447–451. |
[38] | Goodman Y , Bruce AJ , Cheng B , Mattson MP ((1996) ) Estrogens attenuate and corticosterone exacerbates excitotoxicity, oxidative injury, and amyloid β-peptide toxicity in hippocampal neurons. J Neurochem 66: , 1836–1844. |
[39] | Vermeulen A , Kaufman J , Goemaere S , Van Pottelberg I ((2002) ) Estradiol in elderly men. Aging Male 5: , 98–102. |
[40] | Gruber CJ , Tschugguel W , Schneeberger C , Huber JC ((2002) ) Production and actions of estrogens. N Engl J Med 346: , 340–352. |
[41] | Taki Y , Kinomura S , Sato K , Inoue K , Goto R , Okada K , Uchida S , Kawashima R , Fukuda H ((2008) ) Relationship between body mass index and gray matter volume in 1,428 healthy individuals. Obesity 16: , 119–124. |
[42] | Garza JC , Guo M , Zhang W , Lu X-Y ((2008) ) Leptin increases adult hippocampal neurogenesis in vivo and in vitro. J Biol Chem 283: , 18238–18247. |
[43] | Perez-Gonzalez R , Antequera D , Vargas T , Spuch C , Bolós M , Carro E ((2011) ) Leptin induces proliferation of neuronal progenitors and neuroprotection in a mouse model of Alzheimer’s disease. J Alzheimers Dis 24: , 17–25. |
[44] | Nilsen J , Chen S , Irwin RW , Iwamoto S , Brinton RD ((2006) ) Estrogen protects neuronal cells from amyloid beta-induced apoptosis via regulation of mitochondrial proteins and function. BMC Neurosci 7: , 74. |
[45] | Murphy DD , Segal M ((1996) ) Regulation of dendritic spine density in cultured rat hippocampal neurons by steroid hormones. J Neurosci 16: , 4059–4068. |
[46] | Aenlle KK , Kumar A , Cui L , Jackson TC , Foster TC ((2009) ) Estrogen effects on cognition and hippocampal transcription in middle-aged mice. Neurobiol Aging 30: , 932–945. |
[47] | Wang Q , Santizo R , Baughman VL , Pelligrino DA , Iadecola C ((1999) ) Estrogen provides neuroprotection in transient forebrain ischemia through perfusion-independent mechanisms in rats. Stroke 30: , 630–635. |
[48] | Yao J , Brinton RD ((2012) ) Estrogen regulation of mitochondrial bioenergetics: Implications for prevention of Alzheimer’s disease. In Advances in Pharmacology. Elsevier, pp. 327–371. |
[49] | Grundman M , Corey-Bloom J , Jernigan T , Archibald S , Thal L ((1996) ) Low body weight in Alzheimer’s disease is associated with mesial temporal cortex atrophy. Neurology 46: , 1585–1591. |
[50] | Hu X , Okamura N , Arai H , Higuchi M , Maruyama M , Itoh M , Yamaguchi K , Sasaki H ((2002) ) Neuroanatomical correlates of low body weight in Alzheimer’s disease: A PET study. Prog Neuropsychopharmacol Biol Psychiatry 26: , 1285–1289. |
[51] | Gustafson D , Lissner L , Bengtsson C , Björkelund C , Skoog I ((2004) ) A 24-year follow-up of body mass index and cerebral atrophy. Neurology 63: , 1876–1881. |
[52] | Ward MA , Carlsson CM , Trivedi MA , Sager MA , Johnson SC ((2005) ) The effect of body mass index on global brain volume in middle-aged adults: A cross sectional study. BMC Neurol 5: , 23. |


