
Using Machine Learning to Predict Dementia from Neuropsychiatric Symptom and Neuroimaging Data
Abstract
Background:
Machine learning (ML) is a promising technique for patient-specific prediction of mild cognitive impairment (MCI) and dementia development. Neuropsychiatric symptoms (NPS) might improve the accuracy of ML models but have barely been used for this purpose.
Objectives:
To investigate if baseline mild behavioral impairment (MBI) status used for NPS quantification along with brain morphology features are predictive of follow-up diagnosis, median 40 months later in patients with normal cognition (NC) or MCI.
Method:
Baseline neuroimaging, neuropsychiatric, and clinical data from 102 individuals with NC and 239 with MCI were extracted from the Alzheimer’s Disease Neuroimaging Initiative database. Neuropsychiatric inventory questionnaire items were transformed to MBI domains using a published algorithm. Diagnosis at latest follow-up was used as the outcome variable and ground truth classification. A logistic model tree classifier combined with information gain feature selection was trained to predict follow-up diagnosis.
Results:
In the binary classification (NC versus MCI/AD), the optimal ML model required only two features from over 200, MBI total score and left hippocampal volume. These features correctly classified participants as remaining normal or developing cognitive impairment with 84.4% accuracy (area under the receiver operating characteristics curve [ROC-AUC] = 0.86). Seven features were selected for the three-class model (NC versus MCI versus dementia) achieving an accuracy of 58.8% (ROC-AUC=0.73).
Conclusion:
Baseline NPS, categorized for MBI domain and duration, have prognostic utility in addition to brain morphology measures for predicting diagnosis change using ML. MBI total score, followed by impulse dyscontrol and affective dysregulation were most predictive of future diagnosis.
INTRODUCTION
Machine learning (ML) identifies complex patterns in high-dimensional data, which are then used to make clinical predictions in new datasets. In dementia, the focus of ML models has been neuroimaging and cognition-centric [1]. Well-established imaging biomarkers of Alzheimer’s disease (AD) include hippocampal and entorhinal cortex volume reduction, and basal forebrain nuclei loss [2]. Additionally, patterns of atrophy in regions including the paralimbic areas, parietal association areas, lateral temporal, temporoparietal, and frontal cortices have been identified as imaging markers of AD-related neurodegeneration that can be observed in individuals prior to onset of clinical symptoms [2–4]. More specific to ML approaches, Salvatore et al. used ML to identify morphological abnormalities in the hippocampus, entorhinal cortex, basal ganglia, precuneus, and the cerebellum as important in pre-clinical phases of AD [5]. Increasingly, non-cognitive signs and symptoms are considered potential early indicators of neurodegenerative disease [6–8]. Recent evidence suggests that assessment of neuropsychiatric symptoms (NPS) may be promising to identify a high-risk population for dementia [8]. Mild behavioral impairment (MBI) is a validated neurobehavioral syndrome that describes later-life onset of sustained NPS as an at-risk state for incident cognitive decline and dementia [9]. MBI has been suggested to be the index manifestation of dementia, associated with biomarker positivity, genetic links to Alzheimer’s disease (AD), and may be a novel approach for early identification of neurocognitive disorders. Conventional NPS assessments have not shown predictive value in previous ML models. For example, Korolev et al. used more than 750 variables including clinical, MRI, and plasma biomarkers to predict progression to AD-dementia of individuals with mild cognitive impairment (MCI), identifying cognitive and functional parameters as most predictive [10]. In this case, NPS were measured conventionally with the neuropsychiatric inventory. We hypothesize that MBI scores, characterized by sustained NPS, will improve the prognostic accuracy of ML models. This novel approach to NPS characterization (e.g., emphasizing sustained symptoms), can complement the neuroimaging findings, which have been better explored for this purpose in the past. Developing better models can help in understanding the early manifestations of dementia, which can improve clinical care and assist with development of new interventions. Identifying the relative importance of NPS in predicting incident cognitive decline and dementia can guide clinicians to look for emergent and sustained NPS, supplementing clinical and imaging measures that are well known and routinely collected. Further, this approach to earlier detection of dementia risk can inform clinical trial methodology and screening [11]. Thus, the aims of this study were to: 1) identify the optimal feature subset required to predict follow-up diagnosis for a two-class experiment (normal cognition [NC] versus MCI/AD); and 2) identify the optimal feature subset required to predict follow-up diagnosis for a 3 class experiment (NC versus MCI versus AD).
MATERIAL AND METHODS
Alzheimer’s Disease Neuroimaging Initiative (ADNI)
Data were obtained from the ADNI database (http://adni.loni.usc.edu/). The goal of ADNI is to use clinical, neuropsychological, behavioral, genetic, and neuroimaging data to track the progression of AD dementia.
Participants
Participants were between 55–90 years of age, English or Spanish speakers, and accompanied by study partners who completed the Neuropsychiatric Inventory Questionnaire (NPI-Q) [12]. All participants provided informed consent to participate. Approval from an ethical standards committee to conduct this study was received at contributing ADNI sites.
For ADNI-1 participants with NC and MCI at baseline, we collected demographic, clinical, structural MRI, and NPI-Q data as well as final clinical diagnosis at the participant’s latest follow-up. All datasets were downloaded on or before December 10, 2018.
MBI diagnosis requires NPS to be emergent in later life and sustained for at least 6 months [9, 13]. The 6-month symptom duration was defined purposefully to exclude transient and reactive symptoms, to improve signal to noise ratio, and to increase diagnostic specificity of MBI compared to the conventional method of assessing NPS. However, ADNI uses the NPI-Q with a reference range of 1 month to capture NPS. The domains from NPI-Q were combined and categorized under MBI domains as follows: drive/motivation (NPI-Q apathy/indifference); emotion regulation (NPI-Q depression, anxiety, elation/euphoria); impulse control (NPI-Q agitation/aggression, irritability, aberrant motor behavior); social cognition (NPI-Q disinhibition); and thoughts/perception (NPI-Q delusions, hallucination) [14]. The MBI total score was calculated by combining the scores on the five MBI domains. To approximate MBI in the ADNI dataset, participants positive for NPS at two consecutive time points 6-months apart (i.e., MBI total score > 0) were classified as MBI-positive (MBI+). Those with no NPS were classified as MBI-negative (MBI-) for comparison. We further narrowed the sample into two non-dementia groups to include individuals with NC and those with MCI based on ADNI’s diagnostic eligibility criteria (For more information: http://adni.loni.usc.edu/wpcontent/uploads/2010/09/ADNI_GeneralProceduresManual.pdf).
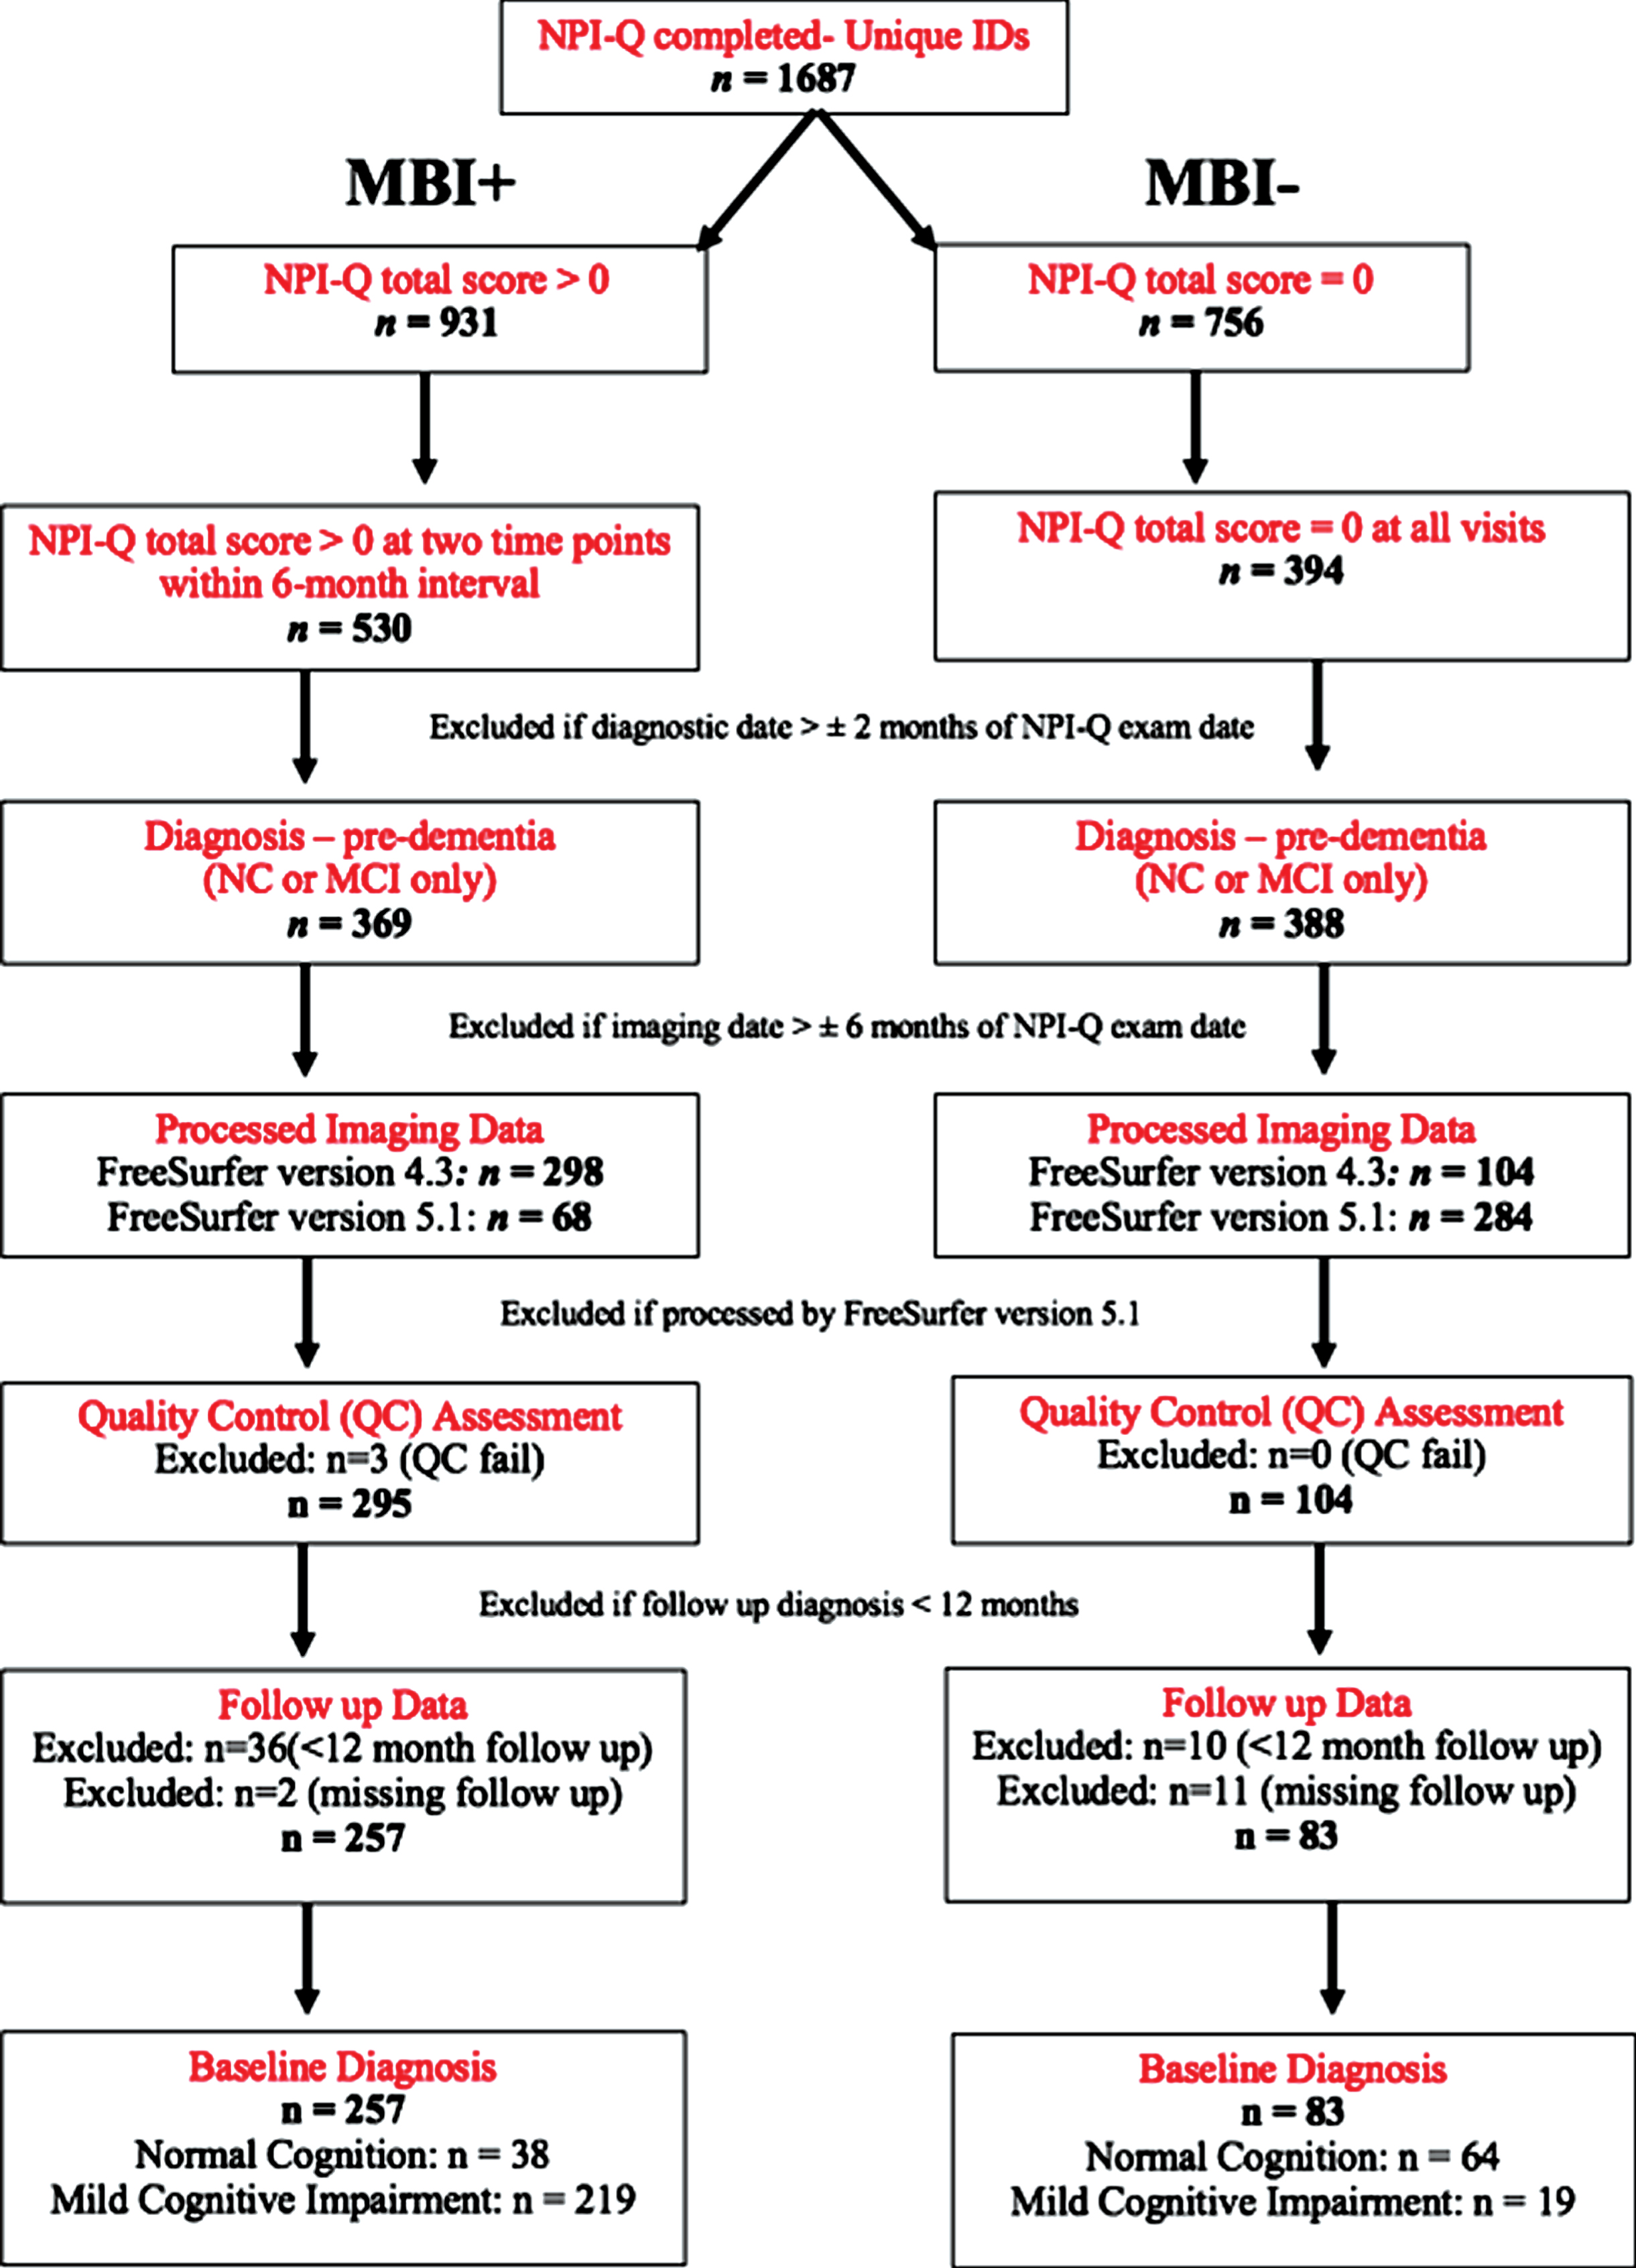
Participants were excluded if: 1) NPI-Q assessment < 6 month apart; 2) baseline demographic/clinical data were > 2 months from NPI-Q exam date; 3) baseline structural MRI data were > 6 months from NPI-Q exam date; 4) follow-up diagnostic status was < 12 months from baseline diagnosis; 5) brain volume data were not processed using FreeSurfer version 4.3, to ensure consistency of the data; 6) UCSF core laboratory’s visual quality control identified overall segmentation failure following processing using FreeSurfer version 4.3. Figure 1 shows the step-by-step process for inclusion/exclusion. Participants included for the analysis were 102 NC (38 with MBI and 64 without MBI) and 238 MCI (219 with MBI and 19 without MBI).
Fig. 1
Data extraction protocol of participants included in the ML analysis.
Clinical and structural MRI data
Combining the clinical and structural MRI data, a total of 235 variables were considered as potential features for predicting future diagnostic status, with 11 clinical and 224 structural MRI features.
Clinical features included baseline diagnostic status, age, sex, education, domain, and total scores from the NPI-Q [12]. In order to study the MBI domains, NPS data were transformed into MBI domains using an established algorithm (described above, [14, 15]). MBI scores were then generated as an average of the two NPI-Q scores over the 6-month interval to approximate the 6-month MBI reference range.
Quantitative MRI data were downloaded for this study. We focused on data collected in the ADNI-1 iteration, to keep imaging acquisition parameters similar and the processing pipeline used for extraction of quantitative parameters consistent, as these changed with later ADNI protocols. For the structural volumetric variables, UCSF core laboratory processed data were used. Additional information on UCSF FreeSurfer processing methods is available ([16]; http://adni.loni.usc.edu/methods/mri-tool/mri-analysis/).
Statistical analysis
The assumption of normality was not met and thus non-parametric tests, the Kruskal-Wallis H test, and Fischer’s Exact test for continuous and categorical variables, respectively, were performed to examine demographic factors and neuropsychiatric test scores.
Feature selection and classification
In the ML pipeline, we investigated several feature ranking algorithms (Pearson’s correlation, gain-ratio, information gain, and Relieff), as well as multiple classification models (logistic model tree, random forest, nearest neighbor, linear support vector machine, JRIP, and J48 [C4.5 decision tree]). We compared the best results of each model and selected the best performing setup (information gain feature ranking and logistic model tree classifier) considering the accuracy and number of features for further investigation.
Our ML algorithm consists of two steps: the feature ranking and selection, and the actual classification. Feature ranking sorts features according to their relevance to the outcome variable in the first step, which is then used for feature selection. Therefore, the information gain value was calculated for each feature with respect to the variable being predicted. The information gain value statistically determines the amount of information “gained” for the variable being predicted by each individual feature, such that the features are ranked according to their relative level of importance (i.e., the most important variable is ranked the highest, of all the variables included in the analysis). An iterative process was used to determine the optimal number of input features by removing the least relevant features as determined by the feature ranking method and using the reduced feature set for classifier evaluation. Reducing the feature number decreases the dimensionality problem, which often improves the model’s performance as correlated and non-informative features may negatively impact the prediction. A logistic model tree [17] employing CART-based pruning [18] was used for the classification based on the ranked and selected features. This decision tree approach employs logistic regression models for the decision on each tree leaf. It is a powerful and interpretable classification model that does not require any hyperparameters to be tuned. Practically, the feature ranking and selection was implemented within the cross validation (see below) in a nested fashion to prevent double dipping. Weka version 3.8 was used for the ML experiments [19].
Classification experiments
Two main ML experiments were conducted in this work. In the first case, the ML model was trained to predict future diagnosis restricted to normal (NC) versus abnormal cognition (MCI or AD). The second experiment was a three-class classification performed to predict individual-specific follow-up diagnosis (NC, MCI, AD) using the baseline features. For each experiment, we conducted a stepwise approach wherein we explored brain morphological features only (demographics+MRI), followed by clinical features only (demographics+MBI), and then combining clinical and brain morphology features to explore if the performance of the ML model improves by combining neuroimaging and clinical features (including MBI).
A 10-fold cross-validation approach was used to assess the models by training ten models for each experiment. In each iteration, 90% of the data were randomly selected for training and 10% for testing. Thus, this process results in one prediction per sample of the entire dataset. This process was repeated ten times to assess the variability of the evaluation metrics. Therefore, the resulting evaluation metrics are averaged over the ten cross-validation iterations and the 95% confidence intervals are reported. Metrics of model performance were area under the receiver operating characteristics (ROC-AUC) curve, accuracy (percent correctly classified), true and false positives, true and false negatives, precision (i.e., the positive predictive value), recall (i.e., sensitivity), and F-measure (harmonic mean of precision and recall).
RESULTS
Table 1 shows demographic characteristics and MBI scores of the sample. Across groups, there were no significant differences in age and education. However, there were significant differences between groups in the follow-up period. Individuals with baseline normal cognition were followed for a longer time (M = 68.63 months; SD = 43.46) compared to patients with baseline MCI (M = 53.19 months, SD = 34.72). Additionally, there were significant group differences in all MBI domains and MBI total score, with individuals with MCI scoring higher. Figure 2 shows the distribution of the two groups across MBI domains. At follow-up, there were 83 individuals with NC, 112 with MCI, and 145 with AD.
Table 1
Demographic characteristics and neuropsychiatric test scores across the two groups
| Total sample | NC | MCI | p | |
| (n = 340) | (n = 102) | (n = 238) | ||
| Median [IQR] | Median [IQR] | Median [IQR] | ||
| Age (y) | 74.00 | 75.00 | 74.00 | 0.23 |
| [71.00, 80.00] | [71.00, 80.00] | [70.00, 80.00] | ||
| Education (y) | 16.00 | 16.00 | 16.00 | 0.867 |
| [14.00, 18.00] | [14.00, 18.00] | [14.00, 18.00] | ||
| Sex (M: F) | 206 : 134 | 52 : 50 | 154 : 84 | 0.024 |
| Follow-up period (months) | 40.50 | 48.00 | 38.00 | 0.002 |
| [29.00, 84.25] | [35.00, 111.50] | [25.00, 76.00] | ||
| MBI Drive/Motivation | 0 | 0 | 0 | <0.001 |
| [0, 0.50] | [0, 0] | [0, 0.50] | ||
| MBI Emotional Dysregulation | 0.50 | 0 | 0.50 | <0.001 |
| [0, 1.00] | [0, 0] | [0, 1.50] | ||
| MBI Impulse Dyscontrol | 0.50 | 0 | 1.00 | <0.001 |
| [0, 1.50] | [0, 0.38] | [0, 1.88] | ||
| MBI Social Inappropriateness | 0 | 0 | 0 | <0.001a |
| [0, 0] | [0, 0] | [0, 0.50] | ||
| MBI Psychotic Symptoms | 0 | 0 | 0 | 0.021b |
| [0, 0] | [0, 0] | [0, 0] | ||
| MBI total score | 1.50 | 0 | 2.00 | <0.001 |
| [0.50, 3.00] | [0, 1.00] | [1.00, 3.50] |
aNC M(SD)=0.025(0.013); MCI: M(SD)=0.255(0.03). bNC: M(SD)=0; MCI: M(SD)=0.034(0.01). Non-parametric tests conducted, with median and interquartile range [IQR] reported. NC, normal cognition; MCI, mild cognitive impairment; M, male; F, female; M, mean; SD, standard deviation.
Fig. 2
Frequency distribution of MBI domains in individuals with normal cognition (NC, n = 102) and mild cognitive impairment (MCI, n = 238).
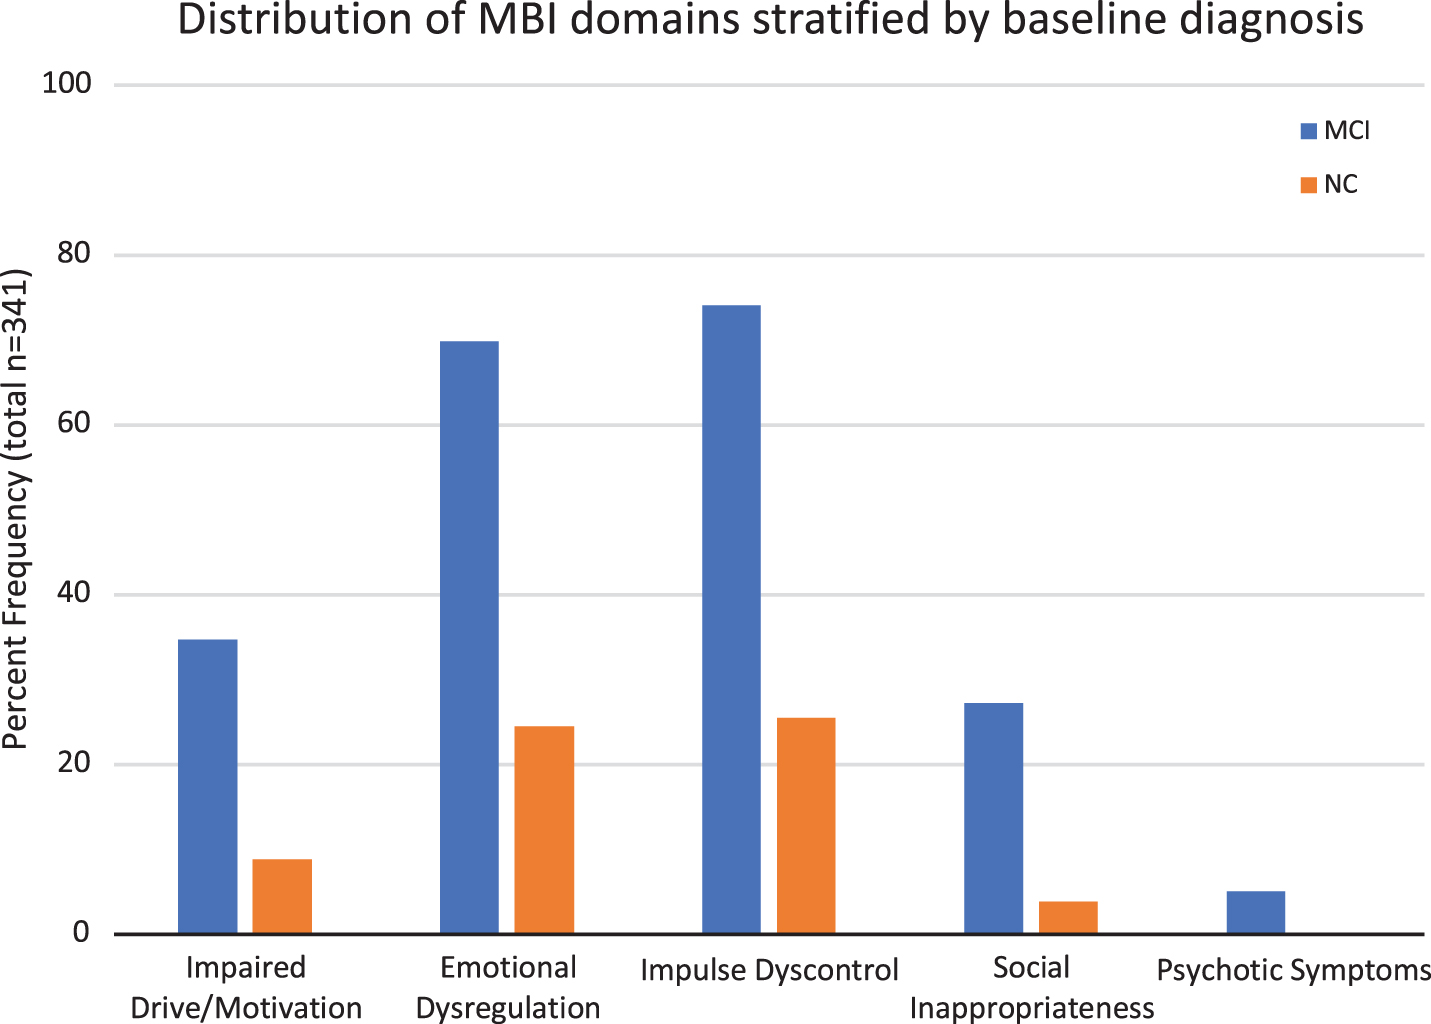
Table 2 shows the class balance (i.e., number of individuals for each diagnostic status at follow-up) and output metrics for the two classification experiments. For the three-class experiment, the reported measurements are an average of the metrics for each of the three classes (each one being a positive class in its own calculation). Combining the two types of features (clinical+brain morphological features) led to a better prediction model compared to using clinical or morphology features alone and thus are discussed in a greater detail below. For the combined approach, the mean area under the ROC curve (ROC-AUC) for experiment 1 and 2 was 0.86 (CI:0.853–0.867) and 0.73 (CI: 0.725–0.743), respectively.
Table 2
Frequency of each diagnosis at the follow-up visits in the three classification experiments and the associated output metrics for each
| Experiment | Class 1 | Class 2 | Class 3 | Type of features | Selected features | TP rate M [CI] | FP rate M [CI] | Precision M [CI] | Recall M [CI] | F-Measure M [CI] | AUC M [CI] | Accuracy M [CI] |
| 1 (Normal versus Abnormal) | NC:83 (24.5%) | MCI/AD: 257 (75.5%) | Clinical+MRI | 2 | 0.85 [0.84-0.85] | 0.30 [0.29-0.31] | 0.84 [0.84-0.85] | 0.85 [0.84-0.85] | 0.85 [0.84-0.85] | 0.86 [0.85-0.87] | 84.9% [84.4-85.4] | |
| Clinical only | 4 | 0.82 [0.81-0.82] | 0.34 [0.32-0.36] | 0.81 [0.81-0.82] | 0.82 [0.81-0.82] | 0.81 [0.81-0.82] | 0.79 [0.78-0.79] | 81.8% [81.2-82.4] | ||||
| MRI only | 41 | 0.76 [0.75-0.77] | 0.50 [0.48-0.51] | 0.74 [0.73-0.75] | 0.76 [0.75-0.77] | 0.75 [0.74-0.75] | 0.77 [0.76-.078] | 75.7% [74.8-76.6] | ||||
| 2 (NC versus MCI versus AD) | NC:83 (24.5%) | MCI: 112 (32.9%) | AD: 145 (42.6%) | Clinical+MRI | 7 | 0.59 [0.58-0.59] | 0.23 [0.23-0.24] | 0.57 [0.56-0.58] | 0.59 [0.58-0.59] | 0.57 [0.56-0.58] | 0.73 [0.72-0.74] | 58.8% [58.1-59.4] |
| Clinical only | 9 | 0.54 [0.53-0.55] | 0.26 [0.26-0.27] | 0.51 [0.50-0.52] | 0.54 [0.53-0.55] | 0.51 [0.50-0.52] | 0.67 [0.66-0.68] | 54.3% [53.2-55.3] | ||||
| MRI only | 5 | 0.48 [0.47-0.49] | 0.28 [0.28-0.29] | 0.46 [0.45-0.47] | 0.48 [0.47-0.49] | 0.46 [0.46-0.47] | 0.66 [0.66-0.67] | 48.2% [47.4-49.0] |
NC, normal cognition; MCI, mild cognitive impairment; AD, Alzheimer’s disease. Output metrics of a decision-tree based algorithm, combined with a relief feature selector – M, average over the ten repeated 10-fold cross-validation; CI, 95% confidence interval; TP, true positive; FP, false positive; AUC, area under the ROC curve.
The binary classification experiment (classifying participants as NC versus MCI/AD) required only two features, achieving a ROC-AUC of 0.86 (CI:0.853-0.867). On average, this model correctly classified 84.9% (CI: 84.4% – 85.4%) of the cases, with a sensitivity of 0.92 and a specificity of 0.63.
For the second ML experiment (classifying patients into three categories based on final diagnosis: NC, MCI, or AD), the optimal model required seven features achieving an overall discrimination (ROC-AUC) of 0.73 (CI: 0.725–0.743) and a mean accuracy of 58.8% (CI: 58.1% – 59.4%). With each class being a positive class in its own calculation, the mean group specific sensitivity and specificity metrics were as follows: NC (sensitivity = 0.87, specificity = 0.66), MCI (sensitivity = 0.81, specificity = 0.31), and AD (sensitivity = 0.69, specificity = 0.76).
Table 3 shows the features selected for the two experiments. In both, the MBI total scores and the left hippocampus volume were selected as the highest ranked features. However, the three-class experiment required additional features including scores on the MBI impulse dyscontrol domain, cortical thickness of the left entorhinal cortex, scores on the MBI emotion dysregulation domain, volume of the left entorhinal cortex, and cortical thickness of the left middle temporal gyrus.
Table 3
Features selected via ML to predict follow up diagnostic status based on baseline inputs in the first two experiments
| Features Selected | Total sample | NC | MCI |
| (n = 340) | (n = 102) | (n = 238) | |
| Median [IQR] | Median [IQR] | Median [IQR] | |
| MBI Total Score*, ** | 1.50 | 0.00 | 2.00 |
| [0.50, 3.00] | [0.00, 1.00] | [1.00, 3.50] | |
| Volume of Left Hippocampus (mm3) *, ** | 3251.50 | 3617.50 | 3072.50 |
| [2833, 3681] | [3250, 3918] | [2713, 3510] | |
| MBI Impulse Dyscontrol Score** | 0.50 | 0.00 | 1.00 |
| [0.00, 1.50] | [0.00, 0.38] | [0.00, 1.88] | |
| Cortical Thickness | 3.21 | 3.38 | 3.07 |
| Average of Left Entorhinal (mm)** | [2.83, 3.51] | [3.22, 3.61] | [2.73, 3.42] |
| MBI Emotional | 0.50 | 0 | 0.50 |
| Dysregulation Score** | [0, 1.00] | [0, 0] | [0, 1.50] |
| Volume of Left | 1682.00 | 1904.50 | 1558.00 |
| Entorhinal (mm3)** | [1372, 1996] | [1675, 2110] | [1282, 1943] |
| Cortical Thickness Average of Left | 2.66 | 2.73 | 2.59 |
| Middle Temporal Gyrus (mm)** | [2.48, 2.78] | [2.65, 2.82] | [2.43, 2.74] |
*Experiment 1: Subjects classified into: NC versus MCI or AD-dementia ⟶ 2 features. **Experiment 2: Subjects classified into: NC versus MCI versus AD-dementia ⟶ 7 features. Non-parametric tests conducted, with median and interquartile range (IQR) reported. NC, normal cognition; MCI, mild-cognitive impairment.
DISCUSSION
ML methods can identify distinctive imaging and clinical features and patterns to make diagnostic predictions. Clinically, this approach can potentially assist in dementia prognostication for those presenting with cognitive complaints, as this is a common question clinicians are facing. NPS are common in prodromal dementia [20], can even present in preclinical dementia [5], and are clinically significant [21–24]. While several studies have used complex ML models to predict stages of dementia, NPS are often ignored as potentially predictive features [1, 10, 25]. In this study, the future diagnostic status of participants was predicted using clinical information, structural MRI, and MBI scores. The ML models combining clinical, MBI scores, and structural MRI features achieved the highest accuracy predicting diagnostic status at follow-up in comparison to the ML models using clinical or brain morphological features only.
In the two-class experiment, the ML model achieved a high accuracy (84.9%) and required only two features to distinguish normal from impaired (NC versus MCI/AD). The three-class experiment resulted in an accuracy of 58.8%, which despite being lower than the accuracy of the two-class experiment is still considerably better than chance level. A more detailed investigation of the results revealed that differentiating the MCI and AD group was the most challenging for this classifier. It is likely that in the ADNI-1 dataset, some individuals with MCI have patterns of structural atrophy similar to AD, suggesting that MCI may be more similar to AD than NC. This similarity between MCI and AD might also make it more challenging for the ML model to distinguish between the two groups, thus, requiring more features. Clinical experience mirrors this challenge in that the differentiation between MCI and dementia is based on functional decline, which can sometimes be difficult to identify or quantify, resulting in an overlap between groups. Thus, the results identifying features to distinguish normal from abnormal are more clinically meaningful, in comparison to those distinguishing between degrees of impairment (MCI versus AD). Combining different types of data could help to further improve the accuracy of the three-class model to differentiate between clinically relevant groups.
In this study cohort, the ML model required only 2–7 features to optimally classify individuals for the two classification tasks. MBI total scores had greater prognostic utility as quantified by the information gain metric compared to all other clinical or volumetric variables for predicting diagnostic status over time. In both classification experiments, the MBI total score was ranked as the most important variable for distinguishing the normal versus abnormal cognition group, as well as for classifying individuals into NC, MCI, and AD groups. Additionally, the two-class experiment included the volume of the left hippocampus as an important predictor. Of the seven features required for the three-class classification, four were imaging markers (left hippocampus volume, cortical thickness and volume of the entorhinal cortex, and cortical thickness of the left middle temporal gyrus) and three were NPS markers (MBI total score, impulse dyscontrol score, and emotional dysregulation score) emphasizing the importance of NPS in the AD process.
The majority of previously described ML models for classification of MCI and AD have focused on a single imaging modality, while only a few multimodal classification models have been developed to predict progression of the neurodegenerative disease [1, 10, 25, 26]. However, researchers have mostly narrowed ML studies to include clinical, cognitive, and structural or functional neuroimaging variables only. In a recent systematic review, it was highlighted that to improve the performance of ML models, additional types of data must be explored [27]. MBI is a novel way of capturing and presenting NPS data. Based on the results in this study, it is evident that including MBI in ML models has the potential to increase the prognostic utility and accuracy. In this work, we demonstrated that these symptoms are amongst the most important predictors, along with left hippocampus volume, cortical thickness and volume of the entorhinal cortex, and cortical thickness of the left middle temporal gyrus.
The volumetric findings are generally consistent with past literature in which one of the earliest imaging marker identified is atrophy in the medial temporal lobe, specifically in the hippocampus and entorhinal cortex, which previously also has been found to be predictive of progression from MCI to AD [1, 10, 28]. With a similar goal of building a clinically-translatable ML model, Grassi et al. focused on inexpensive measurements such as demographics, neuropsychological tests, cardiovascular risk indexes, and visual rating scale of brain atrophy to predict the likelihood of conversion to dementia in pre-MCI/MCI participants [29]. Their best model required 16 features out of a total of 34, which achieved a classification accuracy of 91.3%, with the cognitive test scores, diagnostic status, hippocampal and entorhinal atrophy being within the top 10 features [29]. While differences in sample, ML algorithm used, and features analyzed could explain the difference in performance accuracy when compared to our results, the brain regions identified were similar and thus they are potentially important predictors of cognitive decline and dementia.
Recent evidence also suggests that assessment of NPS such as apathy, mood disturbances, anxiety, agitation, disinhibition, and psychosis may provide a simple and efficient method to identify a high-risk population for dementia [30, 31]. Population-based [7, 32] as well as clinic-based cohort [33] studies provide consistent evidence that NPS in MCI are associated with higher risk for incident dementia, with an estimated annual rate of progression to dementia of 25% for MCI plus NPS in contrast to 10-15% per year for MCI alone [33, 34]. Similarly, NPS in older adults with NC confers a higher likelihood of progression to MCI and dementia [8]. However, investigating these behavioral symptoms in predictive models is underappreciated, in part due to the way NPS are historically measured. Our study highlights the importance of MBI total and domain specific MBI scores as important predictors of progression to worsened diagnosed status.
Our study differs from Korolev et al. who used total and item-scores from the NPI-Q in their prognostic model of progression from MCI to AD. With this approach, NPS were not identified as important features [10]. In our view, the most likely explanation is that by requiring sustained NPS, consistent with the definition of MBI, we likely reduced noise (i.e., false positives) introduced by transient and reactive neuropsychiatric symptoms. In a population-based study, the point prevalence of NPS at a single assessment was quite high at 34.1% within a sample encompassing individuals from normal aging to MCI [15]. However, validation studies of MBI using the full criteria (including the proper 6-month reference range, and using the appropriate MBI case ascertainment tool— the MBI checklist [13]) gave lower estimates of prevalence, 5.8% in subjective cognitive decline [35] and 14.2% in MCI [36], which are probably more specific for persistent changes related to neurodegeneration. This smaller and higher risk group offers an opportunity for more targeted and efficient use of imaging and biomarker studies to capture preclinical disease [37]. Thus, the MBI requirement for later life emergent and sustained NPS may better reflect true NPS that result from neurodegeneration and proteinopathies associated with dementia, removing symptoms that may be a result of non-dementia etiologies [38].
Additionally, beyond the total MBI score, the impulse dyscontrol and emotional dysregulation domains were also observed as important features in the prediction models developed in this work. The prevalence of agitation in MCI varies from 5–25% in population-based studies [39]. Agitation and irritability are associated with greater atrophy in frontal, insular, amygdala, cingulate, and hippocampal regions [40, 41], and with posterior cingulate hypometabolism in preclinical AD [42]. The overall prevalence of depression in MCI is 32% and more frequent in clinical (40%) versus community (25%) samples. Additionally, a recent scoping review has highlighted the importance of the natural history of emotional dysregulation symptoms (i.e., later life onset versus chronic and recurrent symptoms) in preclinical and prodromal dementia, emphasizing the prognostic utility of these symptoms when assessed and measured appropriately [38].
There are several strengths of the present study. A unique aspect is the use of individuals in the preclinical and prodromal phase of AD, i.e., individuals with NC and MCI baseline diagnostic status, to classify participants into the various diagnostic groups at follow-up visits. Additionally, by using the rigorous cross-validation approach, we attempted to avoid the issue of over-fitting the training data, thus, improving the reliability and generalizability of the results. The results of the cross-validation suggest that the ML models are quite robust and reliable as the confidence intervals are quite narrow and decrease the risk of the findings not being reproducible in external datasets or not being clinically applicable. Nevertheless, the developed ML models should be evaluated using prospectively collected independent data in the next step for further validation.
Limitations
Our study has some limitations inherent with the ADNI database and due to our study criteria/analysis plan. One such limitation is the variability in the follow-up period. By not having a maximum cut-off, our results might be confounded as long follow-up time is beneficial in seeing changes for those with NC at baseline. However, we are also more likely to see MCI-converters. Our study was also limited by the measures included in the analysis. By focusing on a single imaging modality, we restricted our findings to MRI structural changes only, while other studies have shown improved classification accuracies with a multi-modal imaging approach [1, 10, 43]. Thus, while the accuracy of our classification models was not as high, it might be possible to improve this by including other image-based biomarkers such as PET and fMRI. However, we believe that NPS, when appropriately measured, will remain important features for the prediction and, thus, future studies should evaluate multiple imaging modalities supplemented with neuropsychiatric data in their ML models. Finally, MBI case detection was approximated using transformations of the NPI-Q. Previous studies have demonstrated inflated MBI prevalence estimates when using this method compared to studies using the MBI checklist (MBI-C). The MBI-C is the specific MBI case ascertainment instrument, developed to measure NPS in non-demented community dwelling functionally independent older adults, i.e., the pre-dementia population [13]. While we operationalized MBI+cases as those who had NPS present at two time points, there is still some risk of measurement error with this approach. The MBI-C has a 6-month reference range and stipulates clearly that symptoms be emergent in later life, sustained for 6 months, and represent a change from baseline behavior [13]. Furthermore, the only item in the NPI-Q that approximates the social inappropriateness domain in MBI is “disinhibition”, but there may be overlap between disinhibition and agitation/impulsivity. In the MBI-C, there are discrete differences in these domains, with questions developed for the five MBI domains, in language geared toward community dwelling older adults. Future studies should use the MBI-C in predictive algorithms, once datasets that have incorporated this instrument become available (http://www.MBItest.org). Despite its overwhelming utility, there are also some limitations from the use of ADNI, such as the exclusion of patients with psychiatric conditions simply based on severity on psychiatric rating scales [38], and the Alzheimer-centric approach to enrolment. Finally, our findings are a first step in a series of experiments in a series of datasets. These findings need replication and extension in other datasets, which should also explore other ML approaches.
Conclusion
In summary, this is one of a few studies that combines baseline clinical, neuropsychiatric, and structural MRI data in non-demented older adults using a ML framework to predict future cognitive category. Our proof of concept study supports that ML models can achieve better results if appropriately described and measured NPS in an MBI framework are used as features, in addition to commonly used imaging biomarkers, in order to predict disease progression in those with preclinical or prodromal illness. This approach can drive research into earlier detection of dementia, assist with more efficient resource utilization, and also inform clinical practice with a greater sensitivity to later life emergent NPS and dementia risk.
ACKNOWLEDGMENTS
Grant support included the Alzheimer Society of Calgary via the Hotchkiss Brain Institute (Ismail), the Canada Research Chairs program as well as the River Fund at Calgary Foundation (Forkert), and the University of Calgary (Gill). We also acknowledge the Mathison Centre for Mental Health Research & Education, and the Ron and Rene Ward Centre for Healthy Brain Aging for support.
Data collection and sharing for this project was funded by the Alzheimer’s Disease Neuroimaging Initiative (ADNI) (National Institutes of Health Grant U01 AG024904) and DOD ADNI (Department of Defense award number W81XWH-12-2-0012). ADNI is funded by the National Institute on Aging, the National Institute of Biomedical Imaging and Bioengineering, and through generous contributions of several others.
Authors’ disclosures available online (https://www.j-alz.com/manuscript-disclosures/19-1169r1).
REFERENCES
[1] | Rathore S , Habes M , Iftikhar MA , Shacklett A , Davatzikos C ((2017) ) A review on neuroimaging-based classification studies and associated feature extraction methods for Alzheimer’s disease and its prodromal stages, Neuroimage 155: , 530–548. |
[2] | Hampel H , Bürger K , Teipel SJ , Bokde ALW , Zetterberg H , Blennow K ((2008) ) Core candidate neurochemical and imaging biomarkers of Alzheimer’s disease, Alzheimers Dement 4: , 38–48. |
[3] | Ewers M , Sperling RA , Klunk WE , Weiner MW , Hampel H ((2011) ) Neuroimaging markers for the prediction and early diagnosis of Alzheimer’s disease dementia, Trends Neurosci 34: , 430–442. |
[4] | Sperling RA , Aisen PS , Beckett LA , Bennett DA , Craft S , Fagan AM , Iwatsubo T , Jack CR , Kaye J , Montine TJ , Park DC , Reiman EM , Rowe CC , Siemers E , Stern Y , Yaffe K , Carrillo MC , Thies B , Morrison-Bogorad M , Wagster MV , Phelps CH ((2011) ) Toward defining the preclinical stages of Alzheimer’s disease: Recommendations from the National Institute on Aging-Alzheimer’s Association workgroups on diagnostic guidelines for Alzheimer’s disease, Alzheimers Dement 7: , 280–292. |
[5] | Salvatore C , Cerasa A , Battista P , Gilardi MC , Quattrone A , Castiglioni I ((2015) ) Magnetic resonance imaging biomarkers for the early diagnosis of Alzheimer’s disease: A machine learning approach, Front Neurosci 9: , 307. |
[6] | Ismail Z , Mortby ME ((2017) ) Cognitive and neuropsychiatric screening tests in older adults. In Mental Health and Illness of the Elderly. Mental Health and Illness Worldwide, Chiu H, Shulman K, eds. Springer, Singapore, pp. 343-368. |
[7] | Peters ME , Rosenberg PB , Steinberg M , Norton MC , Welsh-Bohmer KA , Hayden KM , Breitner J , Tschanz JT , Lyketsos CG ((2013) ) Neuropsychiatric symptoms as risk factors for progression from CIND to dementia: The Cache County Study, Am J Geriatr Psychiatry 21: , 1116–1124. |
[8] | Geda YE , Roberts RO , Mielke MM , Knopman DS , Christianson TJ , Pankratz VS , Boeve BF , Sochor O , Tangalos EG , Petersen RC , Rocca WA ((2014) ) ine neuropsychiatric symptoms and the risk of incident mild cognitive impairment: A population-based study, Am J Psychiatry 171: , 572–581 Basel. |
[9] | Ismail Z , Smith EE , Geda Y , Sultzer D , Brodaty H , Smith G , Agüera-Ortiz L , Sweet R , Miller D , Lyketsos CG ((2016) ) Neuropsychiatric symptoms as early manifestations of emergent dementia: Provisional diagnostic criteria for mild behavioral impairment, Alzheimers Dement 12: , 195–202. |
[10] | Korolev IO , Symonds LL , Bozoki AC ((2016) ) Predicting progression from mild cognitive impairment to Alzheimer’s dementia using clinical, MRI, and plasma biomarkers via probabilistic pattern classification, PLOS One 11: , e0138866. |
[11] | Mortby ME , Black SE , Gauthier S , Miller D , Porsteinßon A , Smith EE , Ismail Z ((2018) ) Dementia clinical trial implications of mild behavioral impairment, Int Psychogeriatr 30: , 171–175. |
[12] | Kaufer DI , Cummings JL , Ketchel P , Smith V , MacMillan A , Shelley T , Lopez OL , DeKosky ST ((2000) ) Validation of the NPI-Q, a brief clinical form of the Neuropsychiatric Inventory, J Neuropsychiatry Clin Neurosci 12: , 233–239. |
[13] | Ismail Z , Agüera-Ortiz L , Brodaty H , Cieslak A , Cummings J , Fischer CE , Gauthier S , Geda YE , Herrmann N , Kanji J ((2017) ) The Mild Behavioral Impairment Checklist (MBI-C): A rating scale for neuropsychiatric symptoms in pre-dementia populations, J Alzheimers Dis 56: , 929–938. |
[14] | Sheikh F , Ismail Z , Mortby ME , Barber P , Cieslak A , Fischer K , Granger R , Hogan DB , Mackie A , Maxwell CJ , Menon B , Mueller P , Patry D , Pearson D , Quickfall J , Sajobi T , Tse E , Wang M , Smith EE ; PROMPT registry investigators ((2018) ) Prevalence of mild behavioral impairment in mild cognitive impairment and subjective cognitive decline, and its association with caregiver burden, Int Psychogeriatr 30: , 233–244. |
[15] | Mortby ME , Ismail Z , Anstey KJ ((2018) ) Prevalence estimates of mild behavioral impairment in a population-based sample of pre-dementia states and cognitively healthy older adults, Int Psychogeriatr 30: , 221–232. |
[16] | Fischl B ((2012) ) FreeSurfer, Neuroimage 62: , 774–781. |
[17] | Landwehr N , Hall M , Frank E ((2005) ) Logistic model trees, Mach Learn 59: , 161–205. |
[18] | Breiman L ((2017) ) Classification and regression trees, Routledge. |
[19] | Witten IH , Frank E , Hall MA ((2011) ) DataMining: Practical Machine Learning Tools and Techniques. Morgan Kaufmann, Burlington, MA. |
[20] | Ismail Z , Elbayoumi H , Smith EE , Fischer CE , Schweizer TA , Millikin C , Hogan DB , Patten SB , Fiest KM ((2017) ) A systematic review and meta-analysis for the prevalence of depression in mild cognitive impairment, JAMA Psychiatry 74: , 58–67. |
[21] | McKhann GM , Knopman DS , Chertkow H , Hyman BT , Jack CR , Kawas CH , Klunk WE , Koroshetz WJ , Manly JJ , Mayeux R , Mohs RC , Morris JC , Rossor MN , Scheltens P , Carrillo MC , Thies B , Weintraub S , Phelps CH ((2011) ) The diagnosis of dementia due to Alzheimer’s disease: Recommendations from the National Institute on Aging-Alzheimer’s Association workgroups on diagnostic guidelines for Alzheimer’s disease, Alzheimers Dement 7: , 263–269. |
[22] | Korolev IO ((2014) ) Alzheimer’s disease: A clinical and science review, Med Student Res J 04: , 024–033 basic. |
[23] | Fischer CE , Ismail Z , Schweizer TA ((2012) ) Impact of neuropsychiatric symptoms on caregiver burden in patients with Alzheimer’s disease, Neurodegener Dis Manag 2: , 269–277. |
[24] | Fischer CE , Ismail Z , Schweizer TA ((2012) ) Delusions increase functional impairment in Alzheimer’s Disease, Dement Geriatr Cogn Disord 33: , 393–399. |
[25] | Schouten TM , Koini M , de Vos F , Seiler S , van der Grond J , Lechner A , Hafkemeijer A , Möller C , Schmidt R , de Rooij M , Rombouts SARB ((2016) ) Combining anatomical, diffusion, and resting state functional magnetic resonance imaging for individual classification of mild and moderate Alzheimer’s disease, Neuroimage Clin 11: , 46–51. |
[26] | Dyrba M , Barkhof F , Fellgiebel A , Filippi M , Hausner L , Hauenstein K , Kirste T , Teipel SJ ((2015) ) Predicting prodromal Alzheimer’s disease in subjects with mild cognitive impairment using machine learning classification of multimodal multicenter diffusion-tensor and magnetic resonance imaging data, J Neuroimaging 25: , 738–747. |
[27] | Pellegrini E , Ballerini L , Hernandez MdCV , Chappell FM , González-Castro V , Anblagan D , Danso S , Muñoz-Maniega S , Job D , Pernet C , Mair G , MacGillivray TJ , Trucco E , Wardlaw JM ((2018) ) Machine learning of neuroimaging for assisted diagnosis of cognitive impairment and dementia: A systematic review, Alzheimers Dement (Amst) 10: , 519–535. |
[28] | Zhang D , Shen D , Initiative AsDN ((2012) ) Predicting future clinical changes of MCI patients using longitudinal and multimodal biomarkers, PLoS One 7: , e33182. |
[29] | Grassi M , Perna G , Caldirola D , Schruers K , Duara R , Loewenstein DA ((2018) ) A clinically-translatable machine learning algorithm for the prediction of Alzheimer’s disease conversion in individuals with mild and premild cognitive impairment, J Alzheimers Dis 61: , 1555–1573. |
[30] | Ballard C , Day S , Sharp S , Wing G , Sorensen S ((2008) ) Neuropsychiatric symptoms in dementia: Importance and treatment considerations, Int Rev Psychiatry 20: , 396–404. |
[31] | Bateman DR , Gill S , Hu S , Foster ED , Ruthirakuhan MT , Sellek AF , Mortby ME , Matušková V , Pin Ng K , Tarawneh RM , Freund-Levi Y , Kumar S , Gauthier S , Rosenberg PB , de Oliveira FF , Devanand DP , Ballard C , Ismail Z ((2020) ) Agitation and impulsivity in mid and late life as possible risk markers for incident dementia. Alzheimers Dement (N Y), in press. DOI : 10.1002/trc2.12016 |
[32] | Pink A , Stokin GB , Bartley MM , Roberts RO , Sochor O , Machulda MM , Krell-Roesch J , Knopman DS , Acosta JI , Christianson TJ , Pankratz VS , Mielke MM , Petersen RC , Geda YE ((2015) ) Neuropsychiatric symptoms, APOE ɛ4, and the risk of incident dementia: A population-based study, Neurology 84: , 935–943. |
[33] | Rosenberg PB , Mielke MM , Appleby BS , Oh ES , Geda YE , Lyketsos CG ((2013) ) The association of neuropsychiatric symptoms in MCI with incident dementia and Alzheimer disease, Am J Geriatr Psychiatry 21: , 685–695. |
[34] | Petersen RC , Doody R , Kurz A , Mohs RC , Morris JC , Rabins PV , Ritchie K , Rossor M , Thal L , Winblad B ((2001) ) Current concepts in mild cognitive impairment, Arch Neurol 58: , 1985. |
[35] | Mallo SC , Ismail Z , Pereiro AX , Facal D , Lojo-Seoane C , Campos-Magdaleno M , Juncos-Rabadán O ((2019) ) Assessing mild behavioral impairment with the mild behavioral impairment checklist in people with subjective cognitive decline, Int Psychogeriatr 31: , 231–239. |
[36] | Mallo SC , Ismail Z , Pereiro AX , Facal D , Lojo-Seoane C , Campos-Magdaleno M , Juncos-Rabadán O ((2018) ) Assessing mild behavioral impairment with the Mild Behavioral Impairment-Checklist in people with mild cognitive impairment, J Alzheimers Dis 66: , 83–95. |
[37] | Lussier FZ , Pascoal TA , Chamoun M , Therriault J , Tissot C , Savard M , Kang MS , Mathotaarachchi S , Benedet AL , Parsons M , Qureshi MNI , Thomas ÉM , Shin M , Dion L-A , Massarweh G , Soucy J-P , Tsai I-H , Vitali P , Ismail Z , Rosa-Neto P , Gauthier S ((2020) ) Mild behavioral impairment is associated with β-amyloid but not tau or neurodegeneration in cognitively intact elderly individuals, Alzheimers Dement 16: , 192–199. |
[38] | Ismail Z , Gatchel J , Bateman DR , Barcelos-Ferreira R , Chantillon M , Jaeger J , Donovan NJ , Mortby ME ((2018) ) Affective and emotional dysregulation as pre-dementia risk markers: Exploring the mild behavioral impairment symptoms of depression, anxiety, irritability, and euphoria, Int Psychogeriatr 30: , 185–196. |
[39] | Apostolova LG , Cummings JL ((2008) ) Neuropsychiatric manifestations in mild cognitive impairment: A systematic review of the literature, Dement Geriatr Cogn Disord 25: , 115–126. |
[40] | Trzepacz PT , Yu P , Bhamidipati PK , Willis B , Forrester T , Tabas L , Schwarz AJ , Saykin AJ , Alzheimer’s Disease Neuroimaging Initiative ((2013) ) Frontolimbic atrophy is associated with agitation and aggression in mild cognitive impairment and Alzheimer’s disease, Alzheimers Dement 9: , S95–S104.e101. |
[41] | Rosenberg PB , Nowrangi MA , Lyketsos CG ((2015) ) Neuropsychiatric symptoms in Alzheimer’s disease: What might be associated brain circuits? Mol Aspects Med 43-44: , 25–37. |
[42] | Ng KP , Pascoal TA , Mathotaarachchi S , Chung C-O , Benedet AL , Shin M , Kang MS , Li X , Ba M , Kandiah N , Rosa-Neto P , Gauthier S , Alzheimer’s Disease Neuroimaging Initiative ((2017) ) Neuropsychiatric symptoms predict hypometabolism in preclinical Alzheimer disease, Neurology 88: , 1814–1821. |
[43] | Zhang D , Wang Y , Zhou L , Yuan H , Shen D ((2011) ) Multimodal classification of Alzheimer’s disease and mild cognitive impairment, Neuroimage 55: , 856–867. |


