
Morphometric Analysis of Hippocampal and Neocortical Pyramidal Neurons in a Mouse Model of Late Onset Alzheimer’s Disease
Abstract
The study of late-onset (sporadic) Alzheimer’s disease (LOAD) has lacked animal models where impairments develop with aging. Oxidative stress promotes LOAD, so we have developed an oxidative stress-based model of age-related cognitive impairment based on gene deletion of aldehyde dehydrogenase 2 (ALDH2). This enzyme is important for the detoxification of endogenous aldehydes arising from lipid peroxidation. Compared to wildtype (WT) mice, the knockout (KO) mice exhibit a progressive decline in recognition and spatial memory and AD-like pathologies. Here we performed morphometric analyses in the dorsal and ventral hippocampal CA1 regions (dCA1 and vCA1) as well as in overlying primary sensory cortex to determine if altered neuronal structure can help account for the cognitive impairment in 12-month old KO mice. Dendritic morphology was quantitatively analyzed following Golgi-Cox staining using 9 WT mice (108 neurons) and 15 KO mice (180 neurons). Four pyramidal neurons were traced per mouse in each region, followed by branched structured analysis and Sholl analysis. Compared to WT controls, the morphology and complexity of dCA1 pyramidal neurons from KOs showed significant reductions in apical and basal dendritic length, dendrite intersections, ends, and nodes. As well, spine density along dorsal CA1 apical dendrites was significantly lower in KO versus WT. In contrast, pyramidal arborization in the vCA1 and primary sensory cortex were only minimally reduced in KO versus WT mice. These data suggest a region-specific vulnerability to oxidative stress-induced damage and/or a major and specific reduction in synaptic input to the pyramidal neurons of the dorsal hippocampus. This is in keeping with studies showing that lesions to the dorsal hippocampus impair primarily cognitive memory whereas ventral hippocampal lesions cause deficits in stress, emotion, and affect.
INTRODUCTION
There are numerous transgenic mouse models of Alzheimer’s disease (AD) which exhibit neuropathological changes dependent on the overexpression of mutant human genes linked to early onset, familial AD. However, genetic changes account for only a small proportion of AD cases (1–5%). In contrast, the study of late-onset (sporadic) Alzheimer’s disease (LOAD) lacks animal models that mirror age-related progression of AD pathologies. Animals that develop pathology because they age, rather than because they are genetically programmed, would facilitate the assessment of intervention strategies that relieve AD symptoms and slow/reverse the underlying disease process.
Oxidative stress has been implicated as a primary driving force in AD pathogenesis [1, 2] and we have developed an oxidative stress-based model of age-related cognitive impairment based on gene deletion of aldehyde dehydrogenase 2 (ALDH2), an enzyme important for the detoxification of endogenous aldehydes (e.g., 4-hydroxynonenal, HNE) arising from lipid peroxidation. Increased levels of HNE protein adducts occur in the brains of AD patients at both early and late stages of disease progression [3–5] and likewise, Aldh2 knockout (KO) mice exhibit increased levels of HNE protein adducts. They also exhibit a progressive age-related decline in hippocampus-dependent working and spatial memory tasks, decreased hippocampal volume, and several AD-like pathological changes compared to age-matched wild type (WT) counterparts. These include age-related increases in amyloid-β (Aβ), phosphorylated tau protein and activated caspases, synaptic loss, defective CREB signaling, and several vascular pathologies [6].
In the current study, we performed morphometric analyses of pyramidal neurons in the dorsal (dCA1) and ventral (vCA1) hippocampus as well as in overlying layer V pyramidal neurons of the primary sensory neocortex in 12-month-old mice. The purpose was to determine whether altered neuronal structure could help account for the observed deficits in cognition previously observed in the KO mice. In other words, can we identify a morphological substrate that helps to explain the observed cognitive impairment and hippocampal volume loss observed in the Aldh2 KO mice?
The rationale for specifically examining dCA1 and vCA1 are their clear differences not only in anatomic connectivity and functionality, but also in electrophysiological properties, gene expression, and responses to stress (reviewed in [7–10]). The dorsal hippocampus receives visual, auditory, and somatosensory information from sensory cortices via the dorsolateral entorhinal cortex and has efferent projections to posterior neocortical areas such as retrosplenial and posterior parietal cortices. These cortical regions involve cognitive processing of visuospatial information, memory processing, and spatial navigation. On the other hand, the ventral hippocampus connects, primarily via the ventromedial entorhinal cortex, with prefrontal and more anterior parts of cingulate cortices, and also with regions of the olfactory bulb, amygdala, and hypothalamus, indicating involvement in affective functioning and in control of neuroendocrine and autonomic responses. Lesioning studies have provided further evidence of the different functional roles of the dorsal and ventral hippocampus: lesions to the dorsal hippocampus result in impaired spatial memory [11, 12] whereas deficits in olfactory and emotional memory occur after lesions to the ventral hippocampus [13, 14]. In contrast to the CA1 region, the overlying sensory cortex consisting of primary somatosensory cortex (SS1) and primary visual cortex (V1), are each responsible for initial processing of somatic or visual sensations, so these regions are separate from higher cognitive functioning.
With respect to electrophysiological properties, there are distinct differences between dorsal and ventral CA1 pyramidal neurons in basic membrane parameters and excitability (e.g., input resistance, resting membrane potential) [15]. Long term potentiation (LTP) is stronger in the dorsal hippocampus, and this is correlated with a higher density of NMDA receptors, higher NMDA-mediated field excitatory postsynaptic potentials [16], and a more effective interaction between NMDA receptors and L-type voltage dependent calcium channels [17]. Furthermore, in the RNA-seq database of gene expression in hippocampal neurons [18], a number of genes in a gene cohort associated with LTP exhibited increased expression in dCA1 neurons relative to vCA1 neurons.
Pyramidal neurons are the major projecting neurons from the hippocampal CA1 region and from the neocortex and thereby represent a proxy for neuronal integrity within these regions. Their dendritic arborizations are the site of synaptic input, so less branching or reduced dendritic spine numbers would provide evidence that the afferent information, and thus the quality of the pyramidal cell output, has been compromised. Moreover, a reduction in dendritic branching and spine density in Aldh2 KO mice could reflect region-specific vulnerability to oxidative stress-induced damage and inability to adequately compensate for the reduced detoxification of lipid peroxidation-derived aldehydes seen in this model.
MATERIALS AND METHODS
Animals
All procedures for animal experimentation were undertaken in accordance with the principles and guidelines of the Canadian Council on Animal Care and were approved by the Queen’s University Animal Care Committee. Twelve-month-old mice were maintained under a 12-h light/dark cycle, with free access to food and water. The Aldh2-/- mice have a C57BL/6 background and were generated by gene targeting knockout as previously described [19] and kindly provided by Dr. T. Kawamoto (University of Occupational and Environmental Health, Kitakyushu, Japan). Wildtype and Aldh2-/- cohorts used in the current study were generated by mating heterozygotes, and genotyping of the progeny by PCR analysis of genomic DNA extracted from ear punches using the primers as reported [20].
The KO mice begin to exhibit impaired performance in working memory, spatial working memory, and spatial reference memory tasks by 3-4 months of age and plateau at 7–8 months [6]. Biochemical measures continue to change up to one year of age [6]. The Sholl analysis of 12-month-old animals was appropriate to maximize the chances of observing changes in dendritic morphology that develop with age. We are currently analyzing younger animals to track the time course of the development of these changes.
Golgi-Cox staining
Under isoflurane anesthesia, brains were perfused with 20 ml PBS by transcardiac perfusion. Brains were removed and processed using the FD Rapid GolgiStain™ Kit (FD NeuroTechnologies, Columbia MD) following the manufacturer’s instructions. A Leica VT1000 S Vibrating-blade vibratome was used to cut coronal sections of the fixed brains. Section thickness was 130 to 150 μm, the speed adjustment was 0.175 mm/s (scale setting 4 to 6), and the vibration frequency was 30 Hz (scale setting 3). The sections were cut in artificial cerebrospinal fluid (240 mM sucrose, 3.3 mM KCl, 26 mM NaHCO3, 1.3 mM MgSO4·7H2O, 1.23 mM NaH2PO4, 11 mM D-glucose, and 1.8 mM CaCl2.) and then mounted on gelatin-coated slides with a drop of ‘C’ solution from the FD Rapid GolgiStain™ Kit. After mounting sections on the slide, the remaining ‘C’ solution was wiped away with a strip of filter paper to ensure that the slides totally dried and that the sections remained attached during the staining process. The slides were dried in the dark in a fume hood for at least 24 h prior to staining.
Morphological analyses
Morphological analyses were carried out using the Neurolucida System Version 11.03, and Neurolucida Explorer Software (MBF Bioscience, VT, USA). Pyramidal neurons were traced and analyzed under a 40x objective lens from 9 WT (4 male and 5 female) and 15 KO (5 male and 10 female) mice. In each animal, three regions were analyzed, tracing 4 neurons in each region, specifically the dorsal CA1 (dCA1), the ventral CA1 (vCA1) and the overlying primary sensory cortex (either SS1 or V1). So in total, 9 WT mice×3 regions×4 neurons = 108 neurons versus 15 KO mice×3 regions×4 neurons = 180 neurons. The observer was blinded as to whether the sections were from WT or KO mice.
Using the Neurolucida Explorer Software, a Sholl analysis [21] was performed on each neuron. Concentric rings each increased in radius by 20 μm were layered around the cell body until dendrites were completely encompassed. Dendrite length was measured within a concentric ring area and plotted. Branching points (nodes) were reported as the number per concentric ring area. Intersections were determined as the number of points where the processes crossed a concentric ring.
Complexity, as defined in Neurolucida Explorer, refers to the normalization and comparison of dendrites among fundamentally different neurons. Complexity = [Sum of the terminal orders + Number of terminals] * [Total dendritic length / Number of primary dendrites], A ‘terminal‘ is defined as a dendritic ending, and ‘Terminal order‘ is the number of “sister” branches encountered while proceeding from the terminal to cell body (calculated for each terminal) [22].
A branched structured analysis was also performed on each neuron. [https://www.mbfbioscience.com/help/neurolucida_explorer/Content/Analyze/Branched_Structure.htm?Highlight = total%20nodes]. This included a variety of analyses, one being the neuron summary that provides an overview of the selected neuron components: axons, dendrites, and cell body. The overview includes dendritic lengths, complexity, and the number of nodes and ends, revealing systematic variation among the different brain regions. Regarding possible changes to the neuronal soma, cell body perimeter was measured at its widest cross-sectional (XS) diameter to determine if there was systematic swelling or shrinking of the pyramidal cell body population in the KO compared to WT mice. Also, the number of basal dendrites per cell body was counted to determine if any primary dendrites were completely lost in KO versus WT.
For spine density analyses, only the dCA1 region was compared between the 9 WT and 15 KO mice (under blinded conditions) because only this region proved to have significantly reduced dendritic arbors in KO versus WT mice. Two neurons per mouse were sampled and data averaged separately for each animal. A segment was chosen from a proximal apical dendrite (30–120 μm from the cell body), from a distal apical dendrite (220–340 μm from the cell body), or from a basal dendrite [23]. The number of spines along each 10 μm length was counted under oil immersion using a 100X objective lens.
Classification of spine type was carried out by measuring the head width and neck length [24]. Criteria were followed for assigning dendritic spines to one of four shape classes. Spines were judged as ‘long thin’ [25] if the spine’s head diameter was greater than the maximum diameter of the neck (meaning a well-formed head) and if the neck length was greater than its diameter [26]. Spines were judged as ‘mushroom’ if the diameter of the head was greater than the diameter of the neck and neck diameter greater than its length [25], or if the spine had an enlarged head with a narrow neck [27]. Spines were judged as ‘stubby’ if the diameter of the neck was similar to the total length of the spine (no obvious neck) [25]. Spines were further categorized based on the following measurements: Mushroom: width > 0.6 μm; Long thin: length > 1 μm; Thin: length: width ratio > 1; Stubby: length width ratio ≤1 [28].
Statistical analysis
For the morphological analyses we used 9 WT and 15 KO mice and analyzed 4 neurons per region in each mouse. The mean value of the 4 replicate neurons for each neuronal trait in each animal was then averaged for the 9 WT or 15 KO mice. For the spine density analysis of dCA1 neurons, two neurons per mouse (9 WT and 15 KO) were analyzed. Differences between KO and WT animals for each neuronal trait were analyzed using a Student’s t-test for unpaired data. All statistical analyses were performed using GraphPad Prism, Version 8.2.1.
RESULTS
Hippocampal CA1 pyramidal neurons
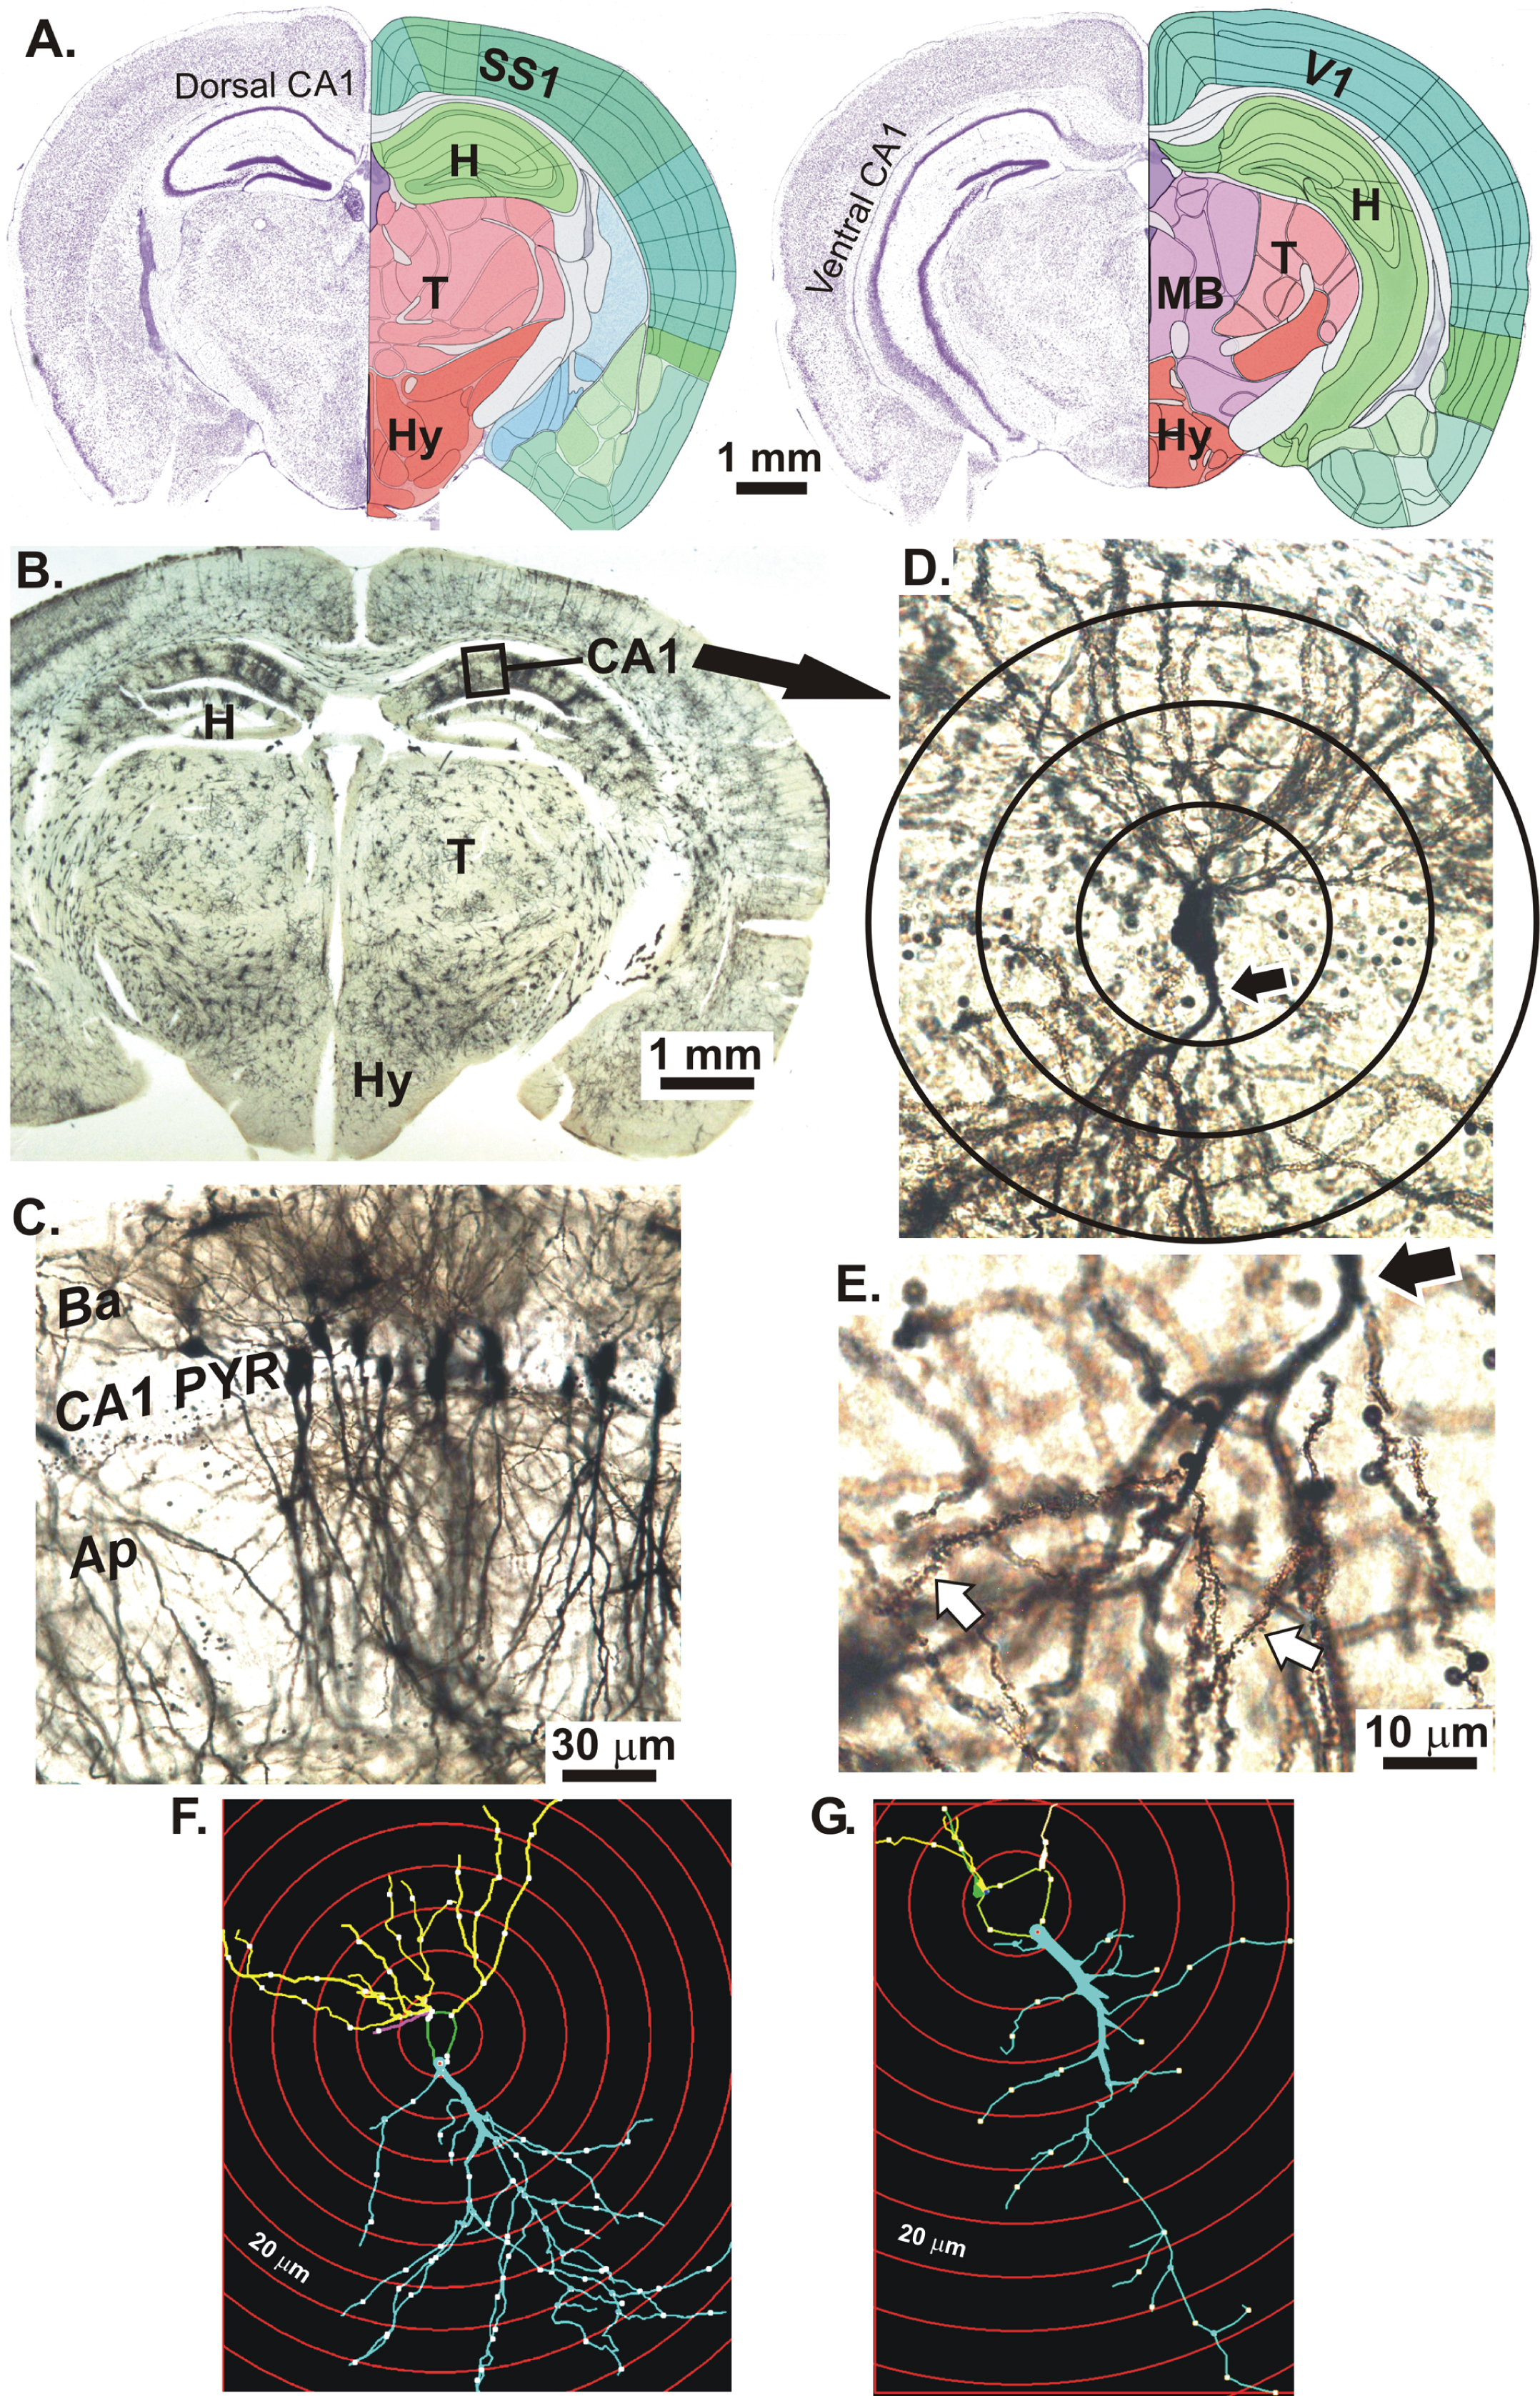
Figure 1A shows coronal Nissl-stained sections of the 56-day-old mouse brain at the level of the dorsal CA1 region (left) and ventral CA1 region (right) of the hippocampus (H). The primary somatosensory cortex (SS1) overlies the majority of the CA1 region except most caudally, where it becomes primary visual cortex (V1). In a Golgi-Cox stained mouse coronal section cut at the level of the dCa1 region (Fig. 1B), neurons stain randomly including the dCA1 region. At higher magnification (Fig. 1C), the CA1 stratum pyramidale displays cell bodies with basal dendrites (Ba) in the stratum oriens and apical dendrites (Ap) in the stratum radiatum. In Fig. 1D, a CA1 pyramidal neuron with apical dendrites is shown with the proximal portion of the apical dendrite (arrow). Sholl ‘rings’ at 20 μm-diameter increments and centered on the cell body are overlaid. At higher magnification of the apical dendritic arbor, dendritic spines are visible (Fig. 1E, white arrows). In Figs. 1F and 1G, digital renderings of two dCA1 pyramidal neurons illustrate a more extreme example of arbor reduction in a KO mouse (G) compared to WT (F).
Fig.1
A) Coronal Nissl-stained sections of an adult mouse brain at the level of the dorsal CA1 region (left) and ventral CA1 region (right) of the hippocampus (H). The overlying neocortex is mainly primary somatosensory cortex (SS1) and more caudally, some primary visual cortex (V1). B) Golgi-Cox stained mouse coronal slice at the level of the dorsal CA1 region (box). C) CA1 stratum pyramidale with apical dendrites (Ap) in the stratum radiatum and basal dendrites (Ba) in the stratum oriens (below). D) A CA1 neuron with the proximal portion of its apical dendrite (arrow). Sholl rings are placed at 20 μm diameter intervals. E) Higher magnification of apical dendrite branches showing spines (white arrows). Hypothalamus (HY); Thalamus (T); Midbrain (MB). F) Digitized image of a dCA1 pyramidal cell tracing from a WT mouse showing dendrites (lines), nodes (dots), and Sholl rings (red circles). G) dCA1 pyramidal cell tracing from a KO mouse showing an obviously reduced dendritic arbor compared to the WT neuron in F. Images in A adapted from brainatlas.org.
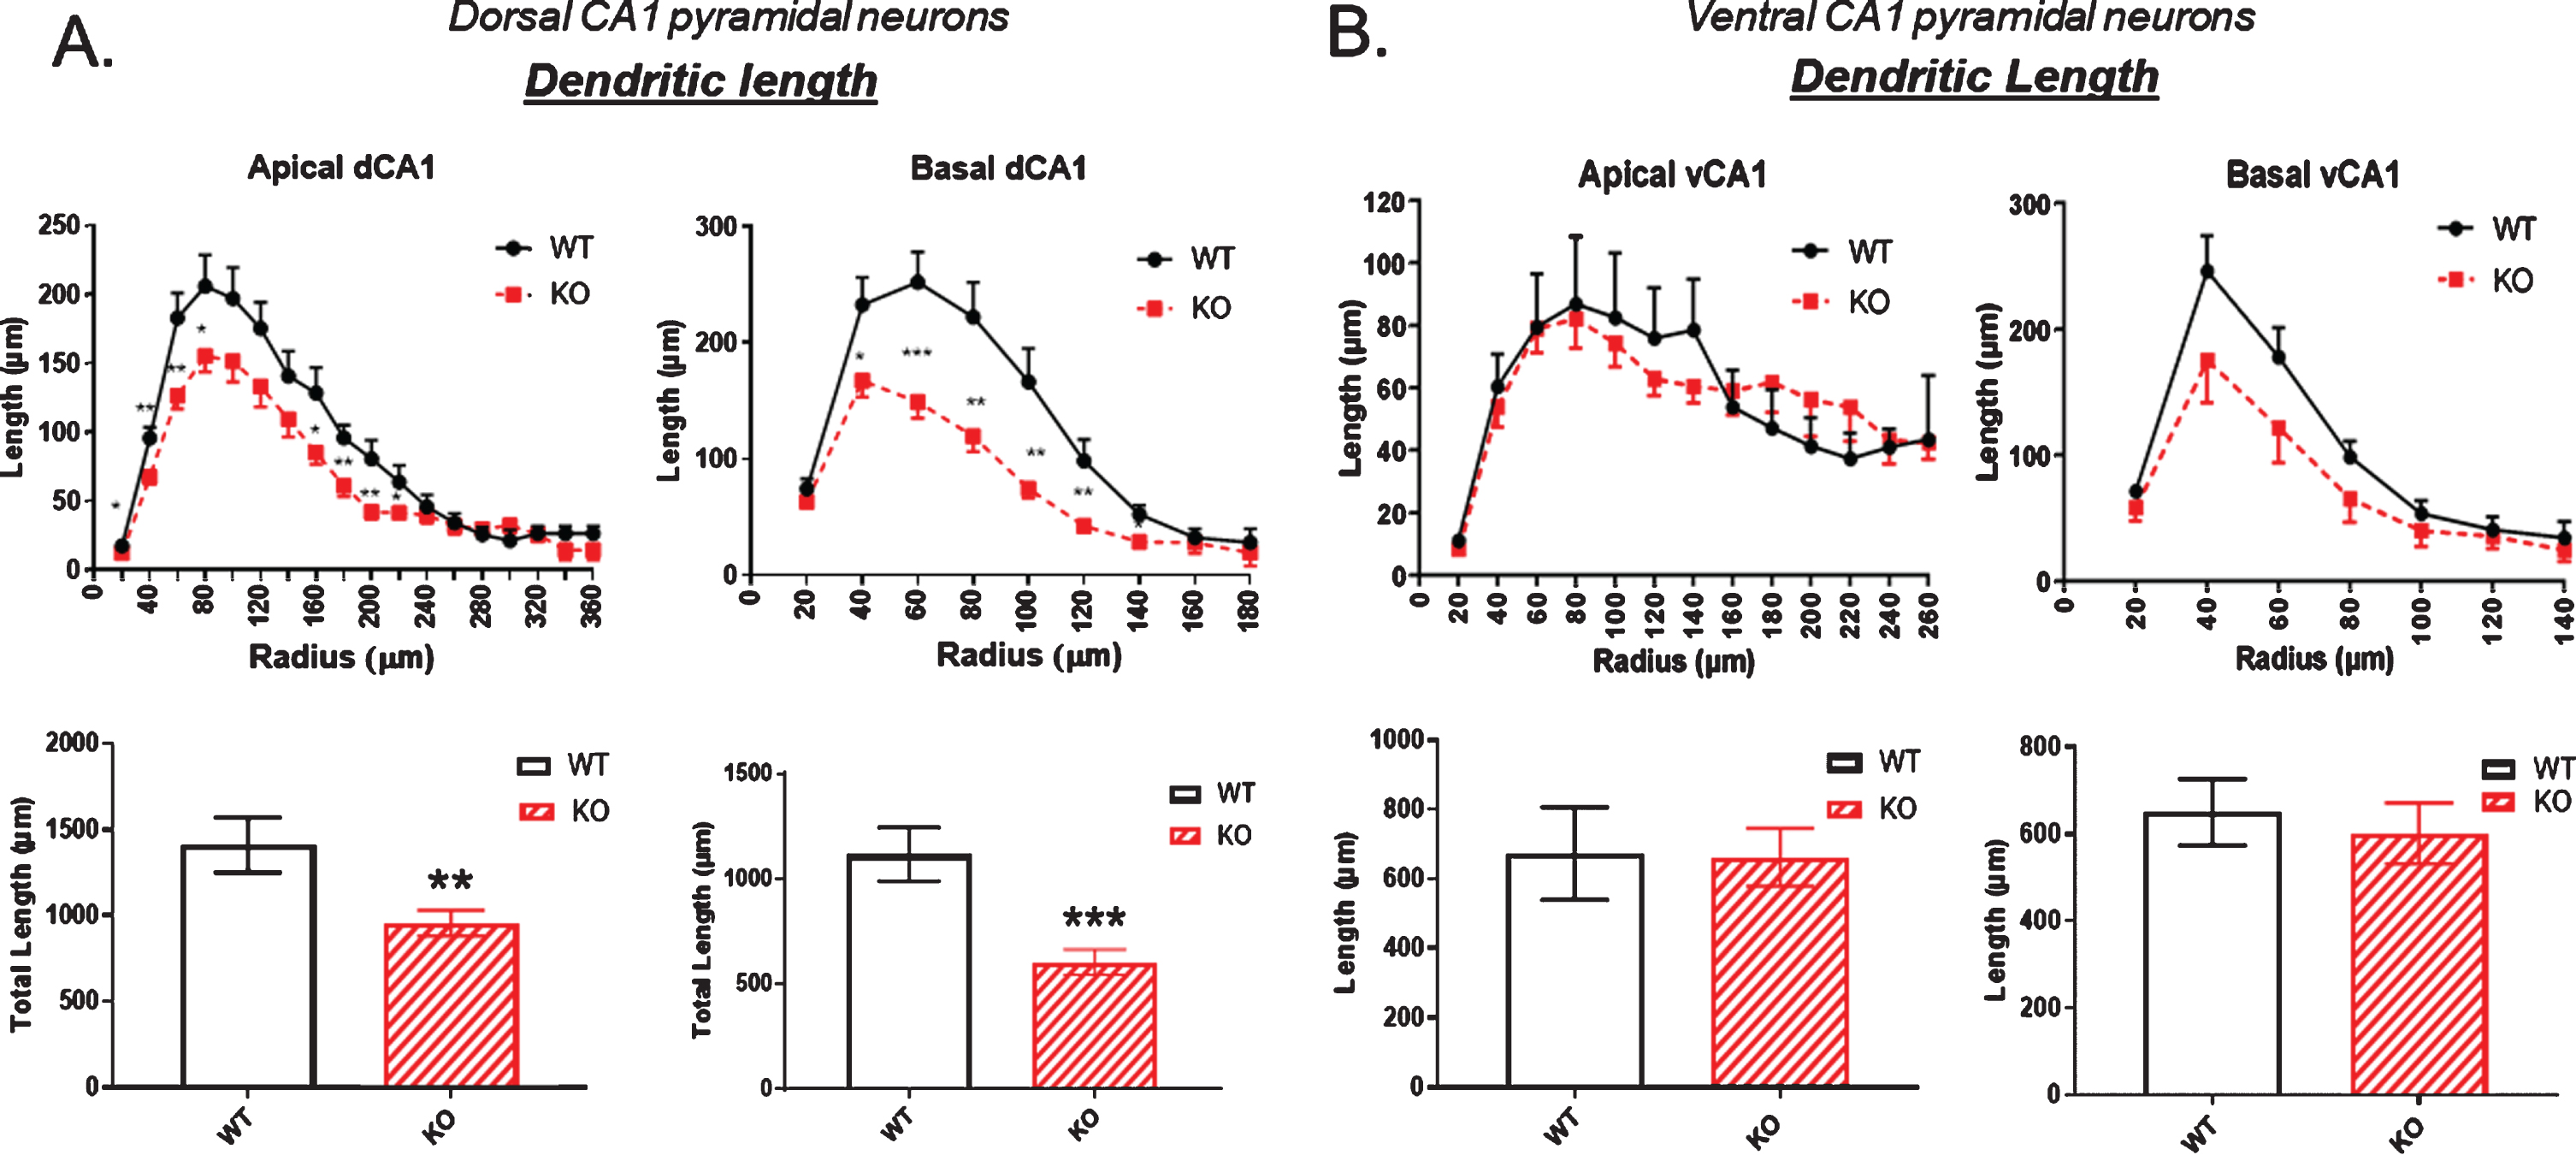
Using Sholl analysis, we examined dendritic length in dorsal and ventral hippocampal pyramidal neurons using the Sholl rings. In the dCA1 there was a significant reduction in dendritic length in KO versus WT mice measured at each ring progressively moving outwards (Fig. 2A). This was particularly evident in the basal dendrites (Fig. 2A, right). In the ventral CA1, dendritic length both in apical and basal regions of the CA1 neurons was not significantly reduced in the KO mice compared to WT (Fig. 2B).
Fig.2
A) Dendritic length is significantly reduced in the dorsal CA1 pyramidal cell region of KO mice compared to WT, particularly in the basal dendrites (right). B) In contrast, no significant reductions in dendritic length are observed in in the ventral CA1 region of KO versus WT mice. Data represent the mean±SEM of measurements from 9 WT and 15 KO mice, and were analyzed by Student’s t-test for unpaired data. *significant difference as indicated (*p < 0.05, **p < 0.01, ***p < 0.001).
Next, extending observations to the number of dendritic nodes, that is, branch points in a dendritic arbor, there was again a significant node reduction in both apical and basal dendrites of the dCA1 in KO compared to WT mice (Fig. 3A). In contrast, the node count in vCA1 neurons was again not significantly reduced in KO animals compared to WT. Figure 3B shows no statistically significant change in node number in the neurons of the ventral hippocampus.
Fig.3
The number of dendritic nodes [branch points] in a dendritic arbor is significantly reduced in both the apical and basal dendrites of pyramidal cells of the dorsal CA1 region of KO versus WT mice. B) In contrast, no significant reduction in node number is observed in the ventral CA1 region of KO versus WT mice. Data represent the mean±SEM of measurements from 9 WT and 15 KO mice, and were analyzed by Student’s t-test for unpaired data. *significant difference as indicated (*p < 0.05, **p < 0.01).
![The number of dendritic nodes [branch points] in a dendritic arbor is significantly reduced in both the apical and basal dendrites of pyramidal cells of the dorsal CA1 region of KO versus WT mice. B) In contrast, no significant reduction in node number is observed in the ventral CA1 region of KO versus WT mice. Data represent the mean±SEM of measurements from 9 WT and 15 KO mice, and were analyzed by Student’s t-test for unpaired data. *significant difference as indicated (*p < 0.05, **p < 0.01).](https://ip.ios.semcs.net:443/media/jad/2020/74-4/jad-74-4-jad191067/jad-74-jad191067-g003.jpg)
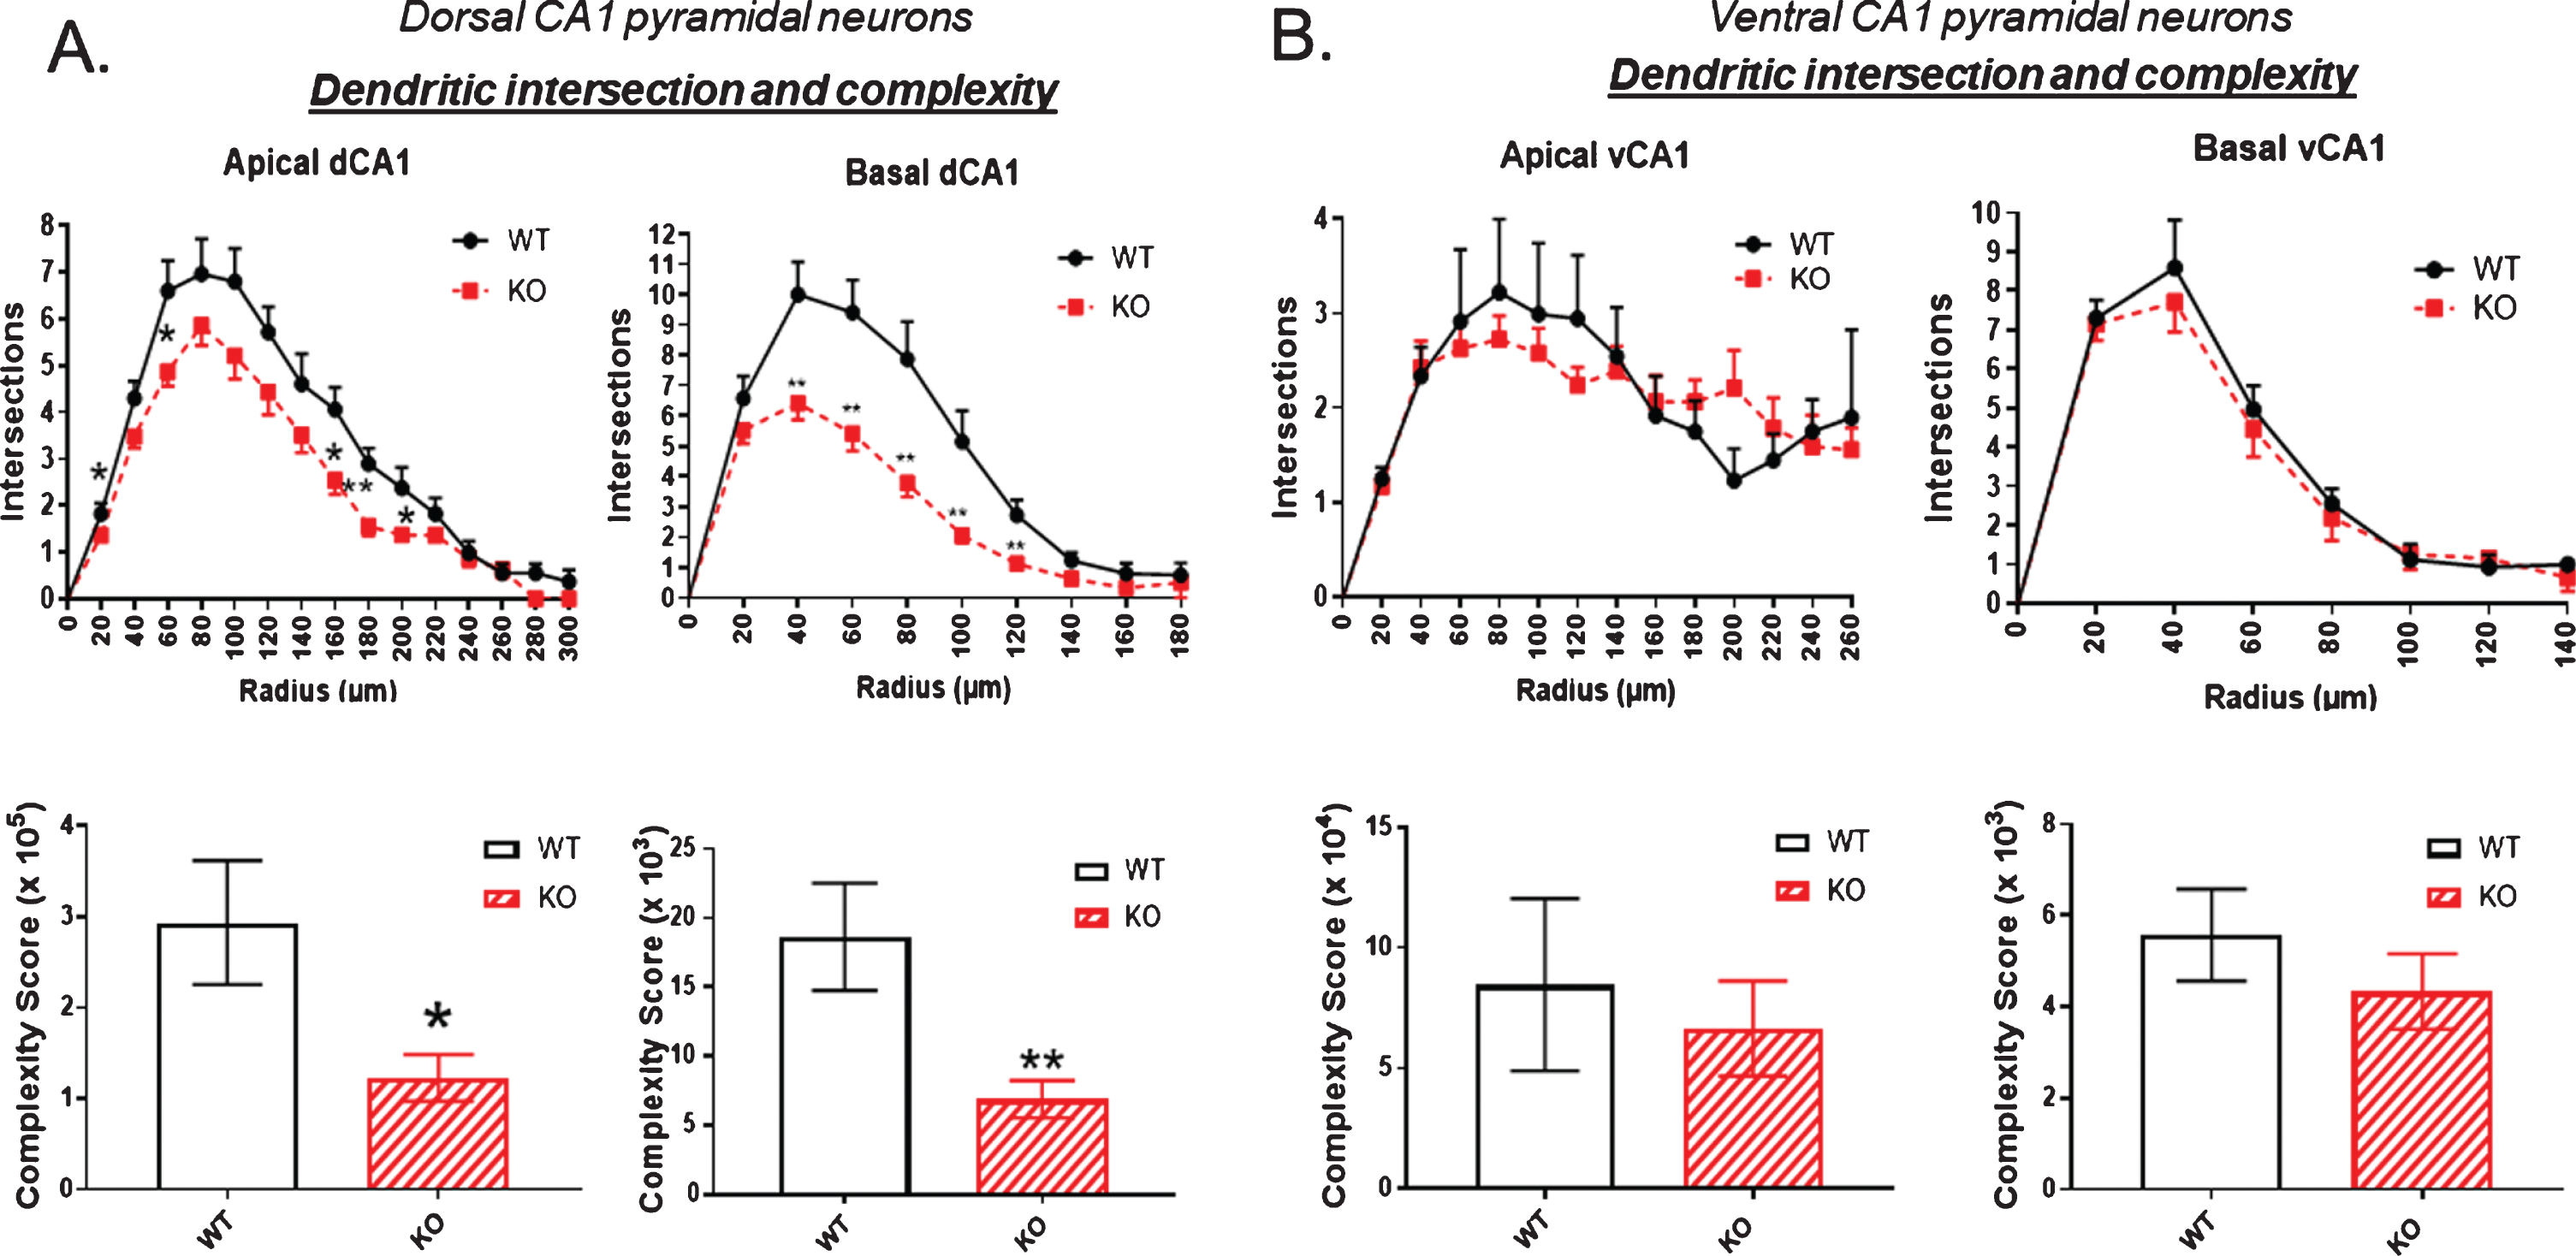
Figure 4 examines the number of dendritic intersections and overall complexity of an arbor, again mapping points at each Sholl ring. The complexity score was significantly reduced in both apical and basal dendrites of the dorsal hippocampus of KO compared to WT, as shown in Fig. 4A. In contrast, Fig. 4B demonstrates no statistically significant change in complexity in the neurons of the ventral hippocampus.
Fig.4
The number of dendritic intersections as a measure of arbor complexity is significantly reduced in the dorsal CA1 pyramidal cell region of KO mice compared to WT, both in apical and basal dendrites. B) By contrast, no significant reduction in intersections is observed in the ventral CA1 region of KO versus WT mice. Data represent the mean±SEM of measurements from 9 WT and 15 KO mice, and were analyzed by Student’s t-test for unpaired data. *significant difference as indicated (*p < 0.05, **p < 0.01).
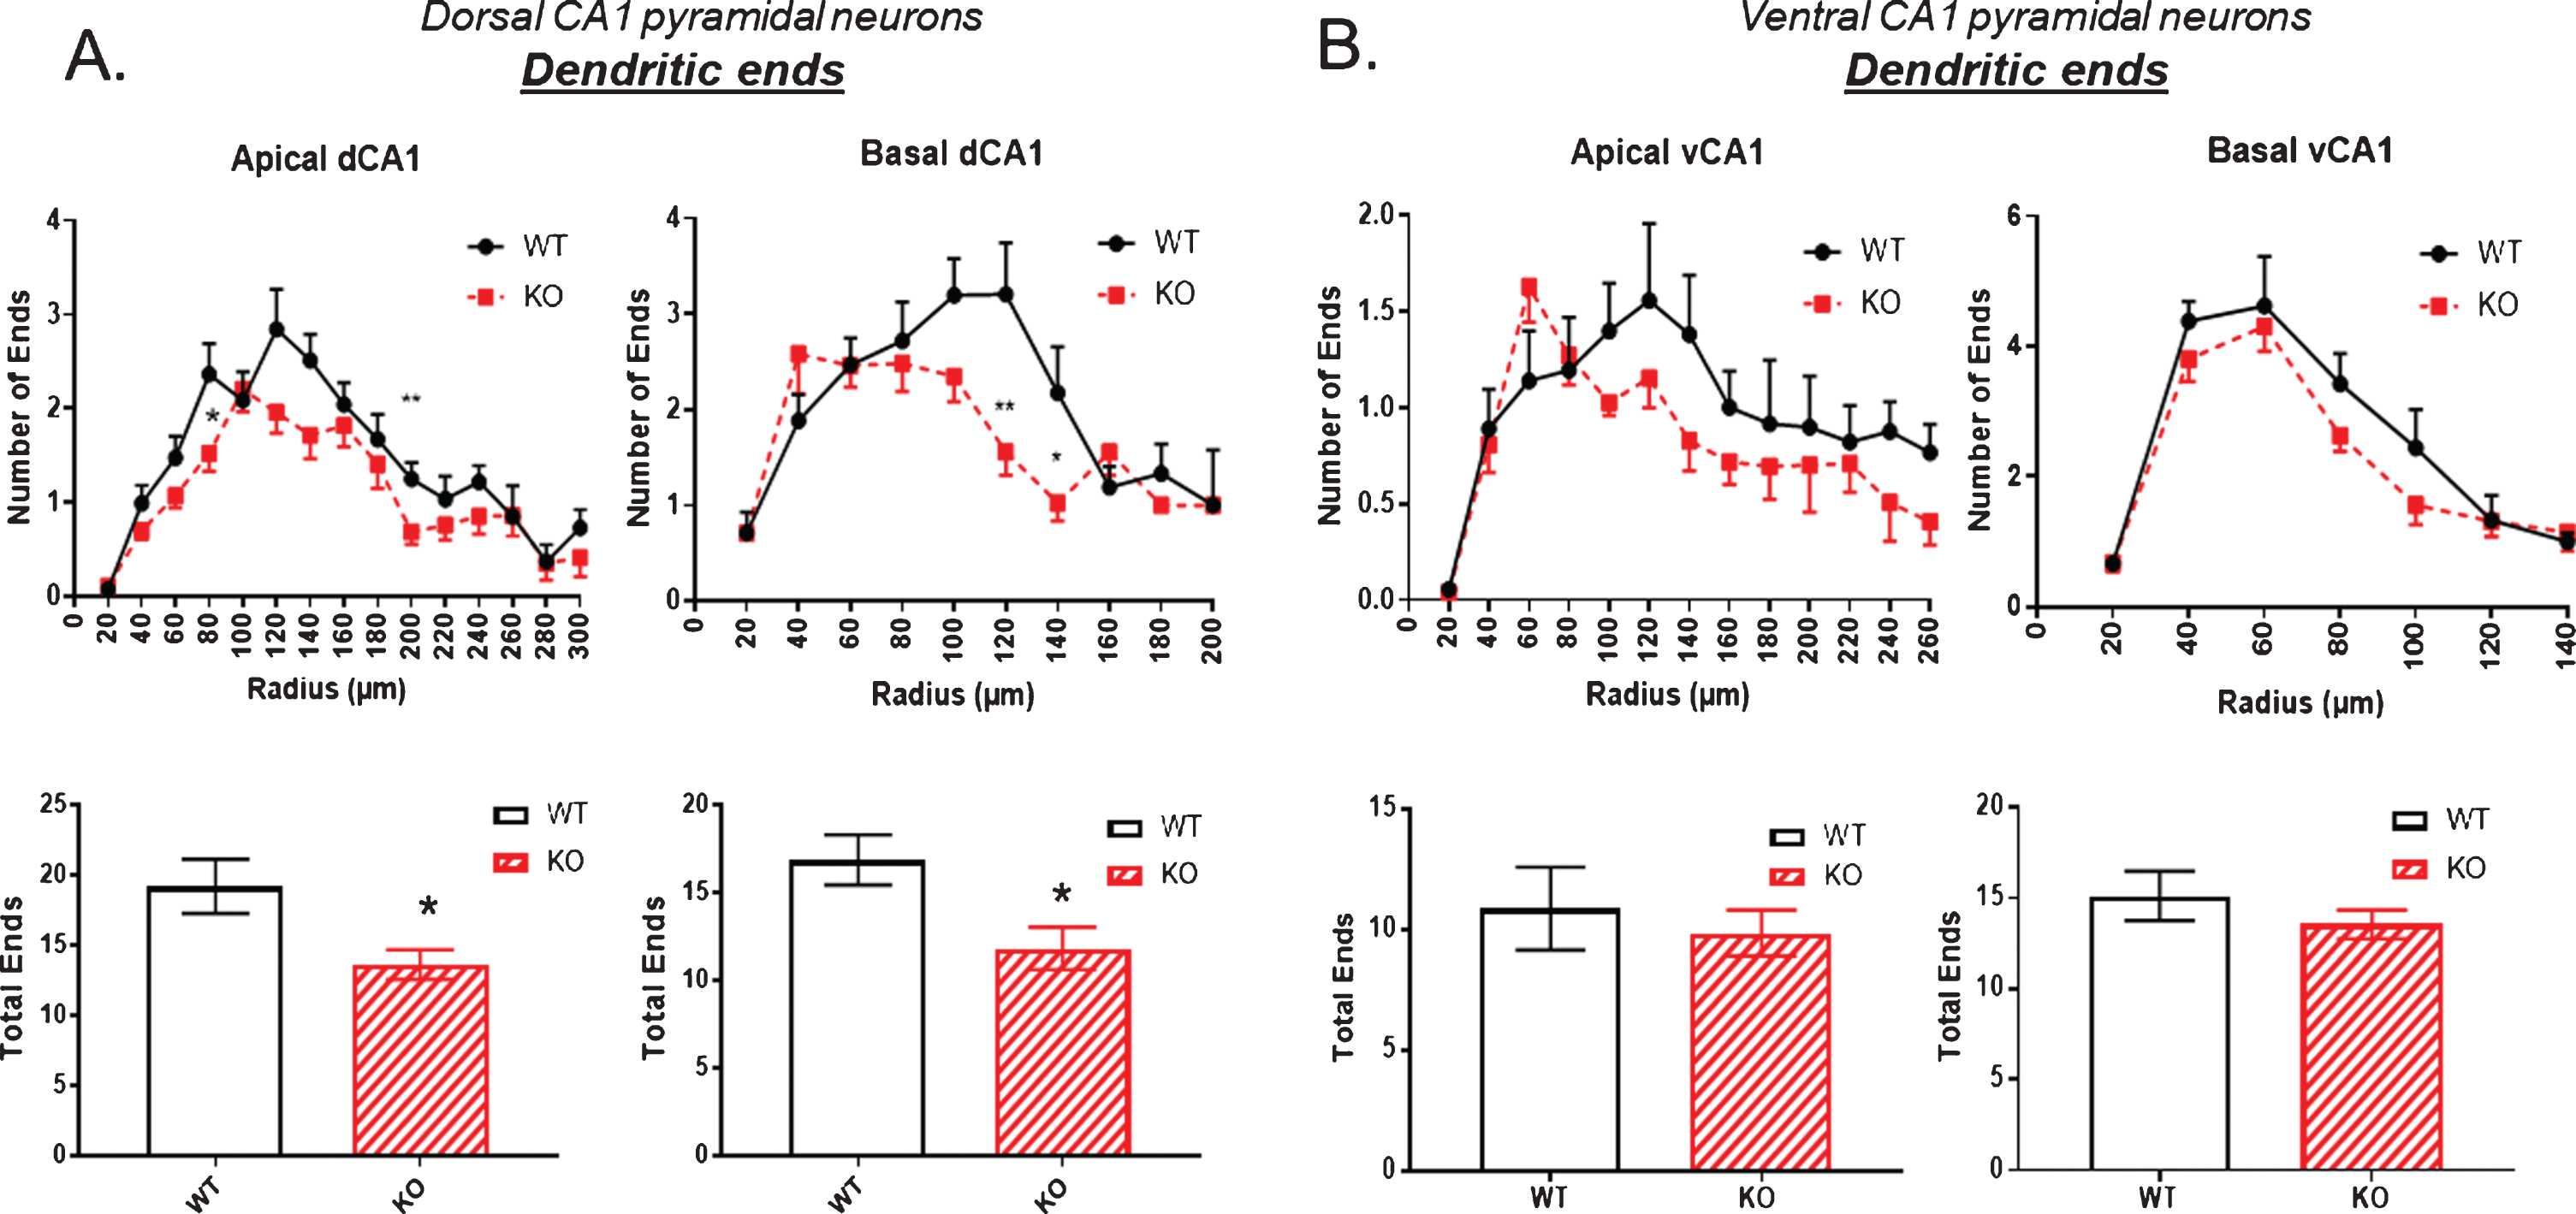
The number of dendritic ends is examined in Fig. 5. There was a small but significant reduction in both apical and basal dendritic ends in the dorsal hippocampus of KO mice compared to WT (Fig. 5A). This difference was not evident in the ventral hippocampus as shown in Fig. 5B.
Fig.5
The number of dendritic ends as a measure of total dendrite branches is significantly reduced in the dorsal CA1 pyramidal cell region of KO mice compared to WT, both in apical and basal regions. B) By contrast, no significant reduction in dendritic ends is observed in the ventral CA1 region of KO versus WT mice. Data represent the mean±SEM of measurements from 9 WT and 15 KO mice, and were analyzed by Student’s t-test for unpaired data. *significant difference as indicated (*p < 0.05, **p < 0.01).
Neocortical layer V pyramidal neurons
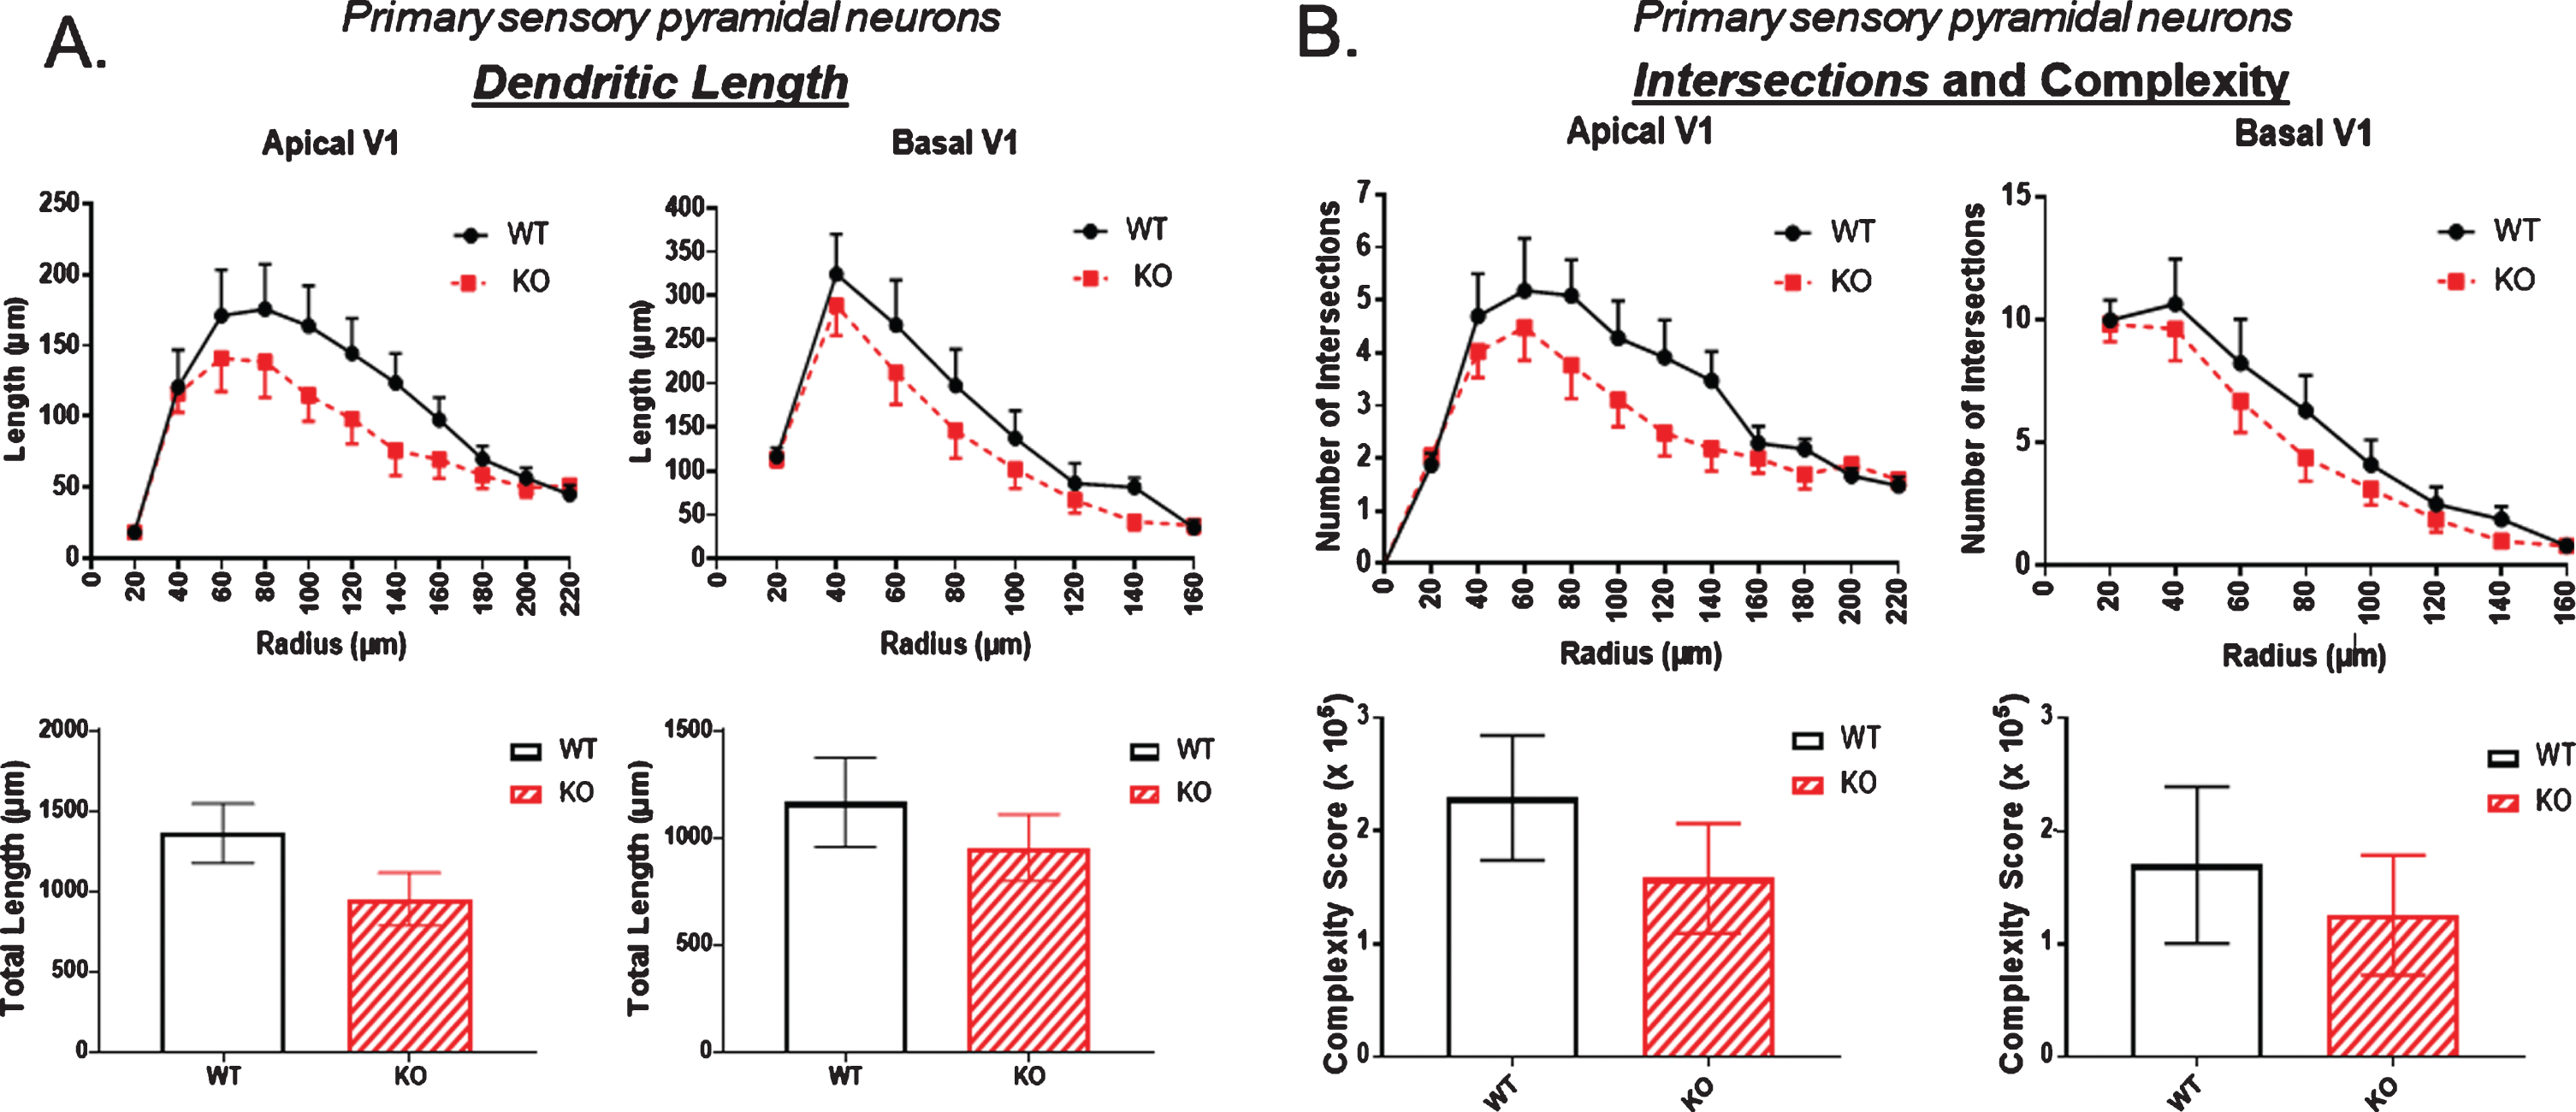
The apparent reductions in the dCA1 of KO mice prompted us to examine if there might be a more generalized reduction in pyramidal neuron arborization in the overlying neocortex. Therefore, we analyzed the dendritic parameters described above in the layer V pyramidal neurons of the primary somatosensory cortex (SS1) which overlies the dorsal (and some of the ventral) hippocampus in mice. Moving caudally, primary visual cortex (V1) replaces SS1. As shown in Fig. 6A, there was a trend towards a reduction in dendritic length in both the apical and basal dendrites of KO compared to WT mice. A similar trend was also observed from analysis of intersections and complexity shown in Fig. 6B where again both apical and basal dendrites showed reduced numbers in KO compared to WT mice. However, none of these reductions were statistically significant.
Fig.6
In the primary sensory cortex there was a consistent trend towards A) reduced dendritic length and B) reduced dendritic complexity in KO versus WT mice, but these reductions were not statistically significant. Data represent the mean±SEM of measurements from 9 WT and 15 KO mice, and were analyzed by Student’s t-test for unpaired data.
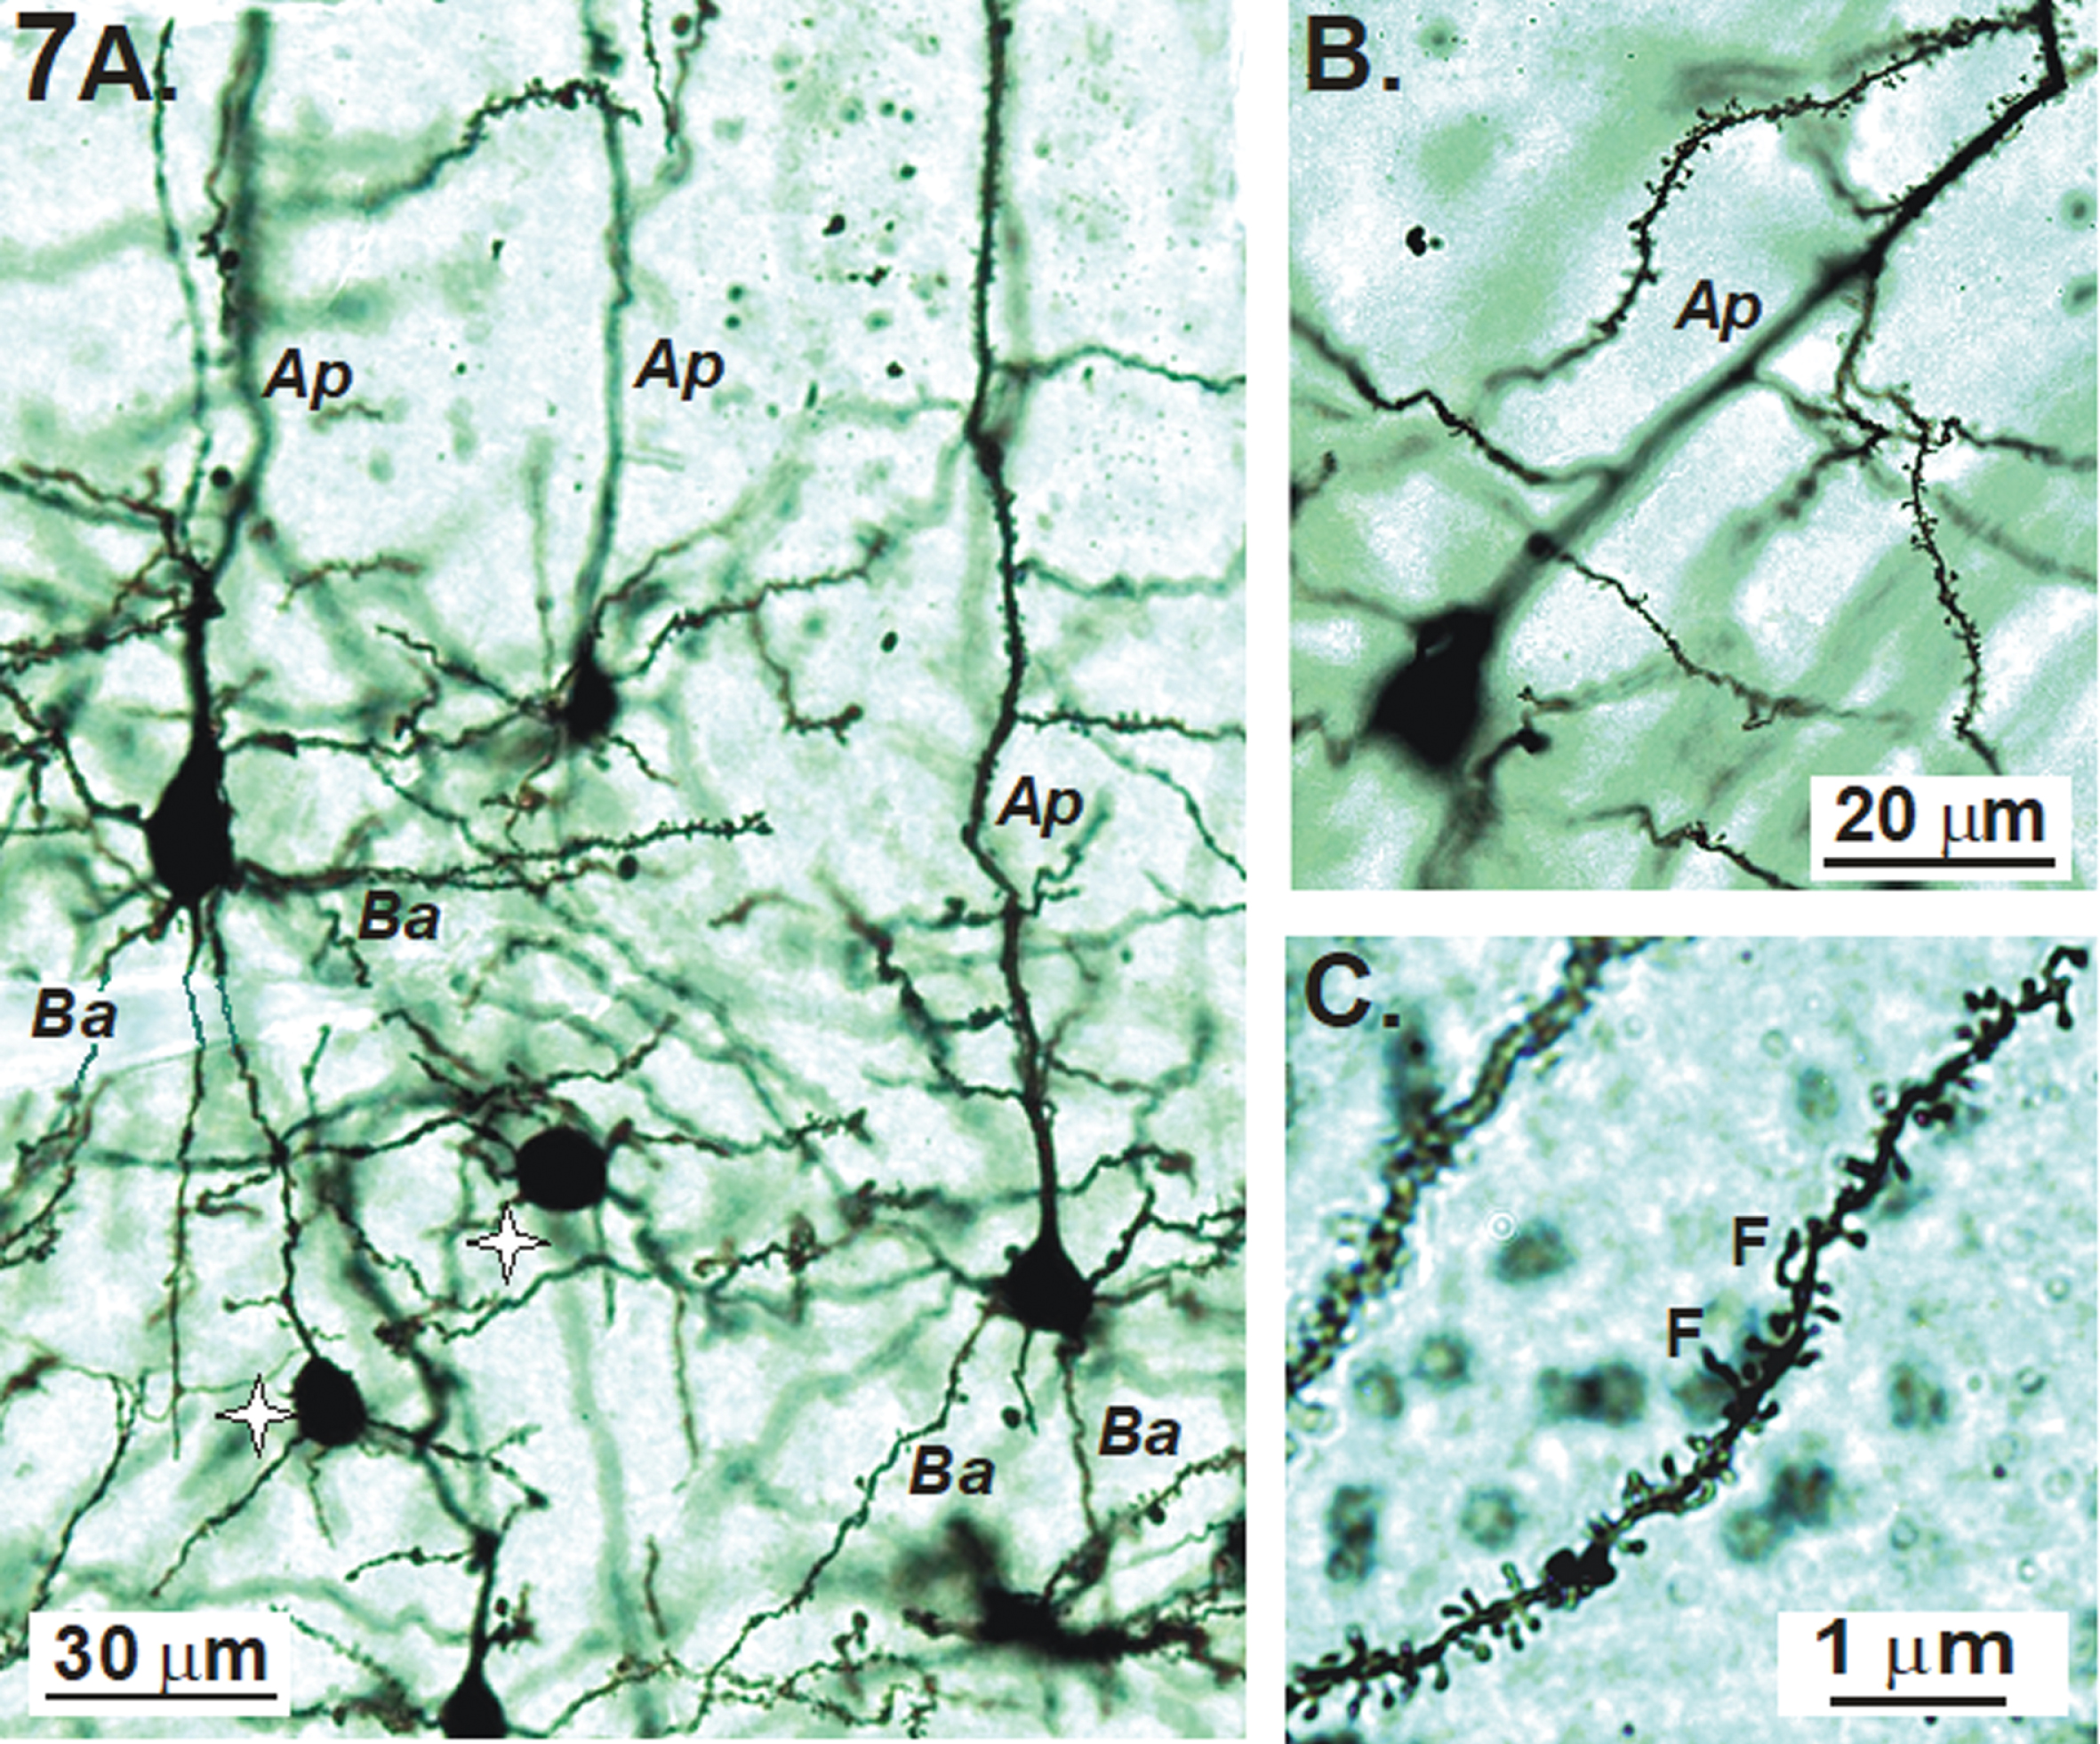
Examples of Golgi-Cox stained pyramidal neurons of the primary sensory cortex with their apical (Ap) and basal (Ba) dendrites are shown in Fig. 7A. Interneurons with dendrites lacking spines (stars) also stain. A majority of dendritic spines on pyramidal cells are mushroom-shaped (Fig. 7B) with a few interspersed filapodic (F) spines (Fig. 7C).
Fig.7
A, B) Examples of Golgi-Cox stained pyramidal neurons of the primary sensory cortex with their apical (Ap) and basal (Ba) dendrites. Non-spiny interneurons (stars) also stain. C) In this image, most of the dendritic spines are mushroom-shaped with a few filapodic (F) spines.
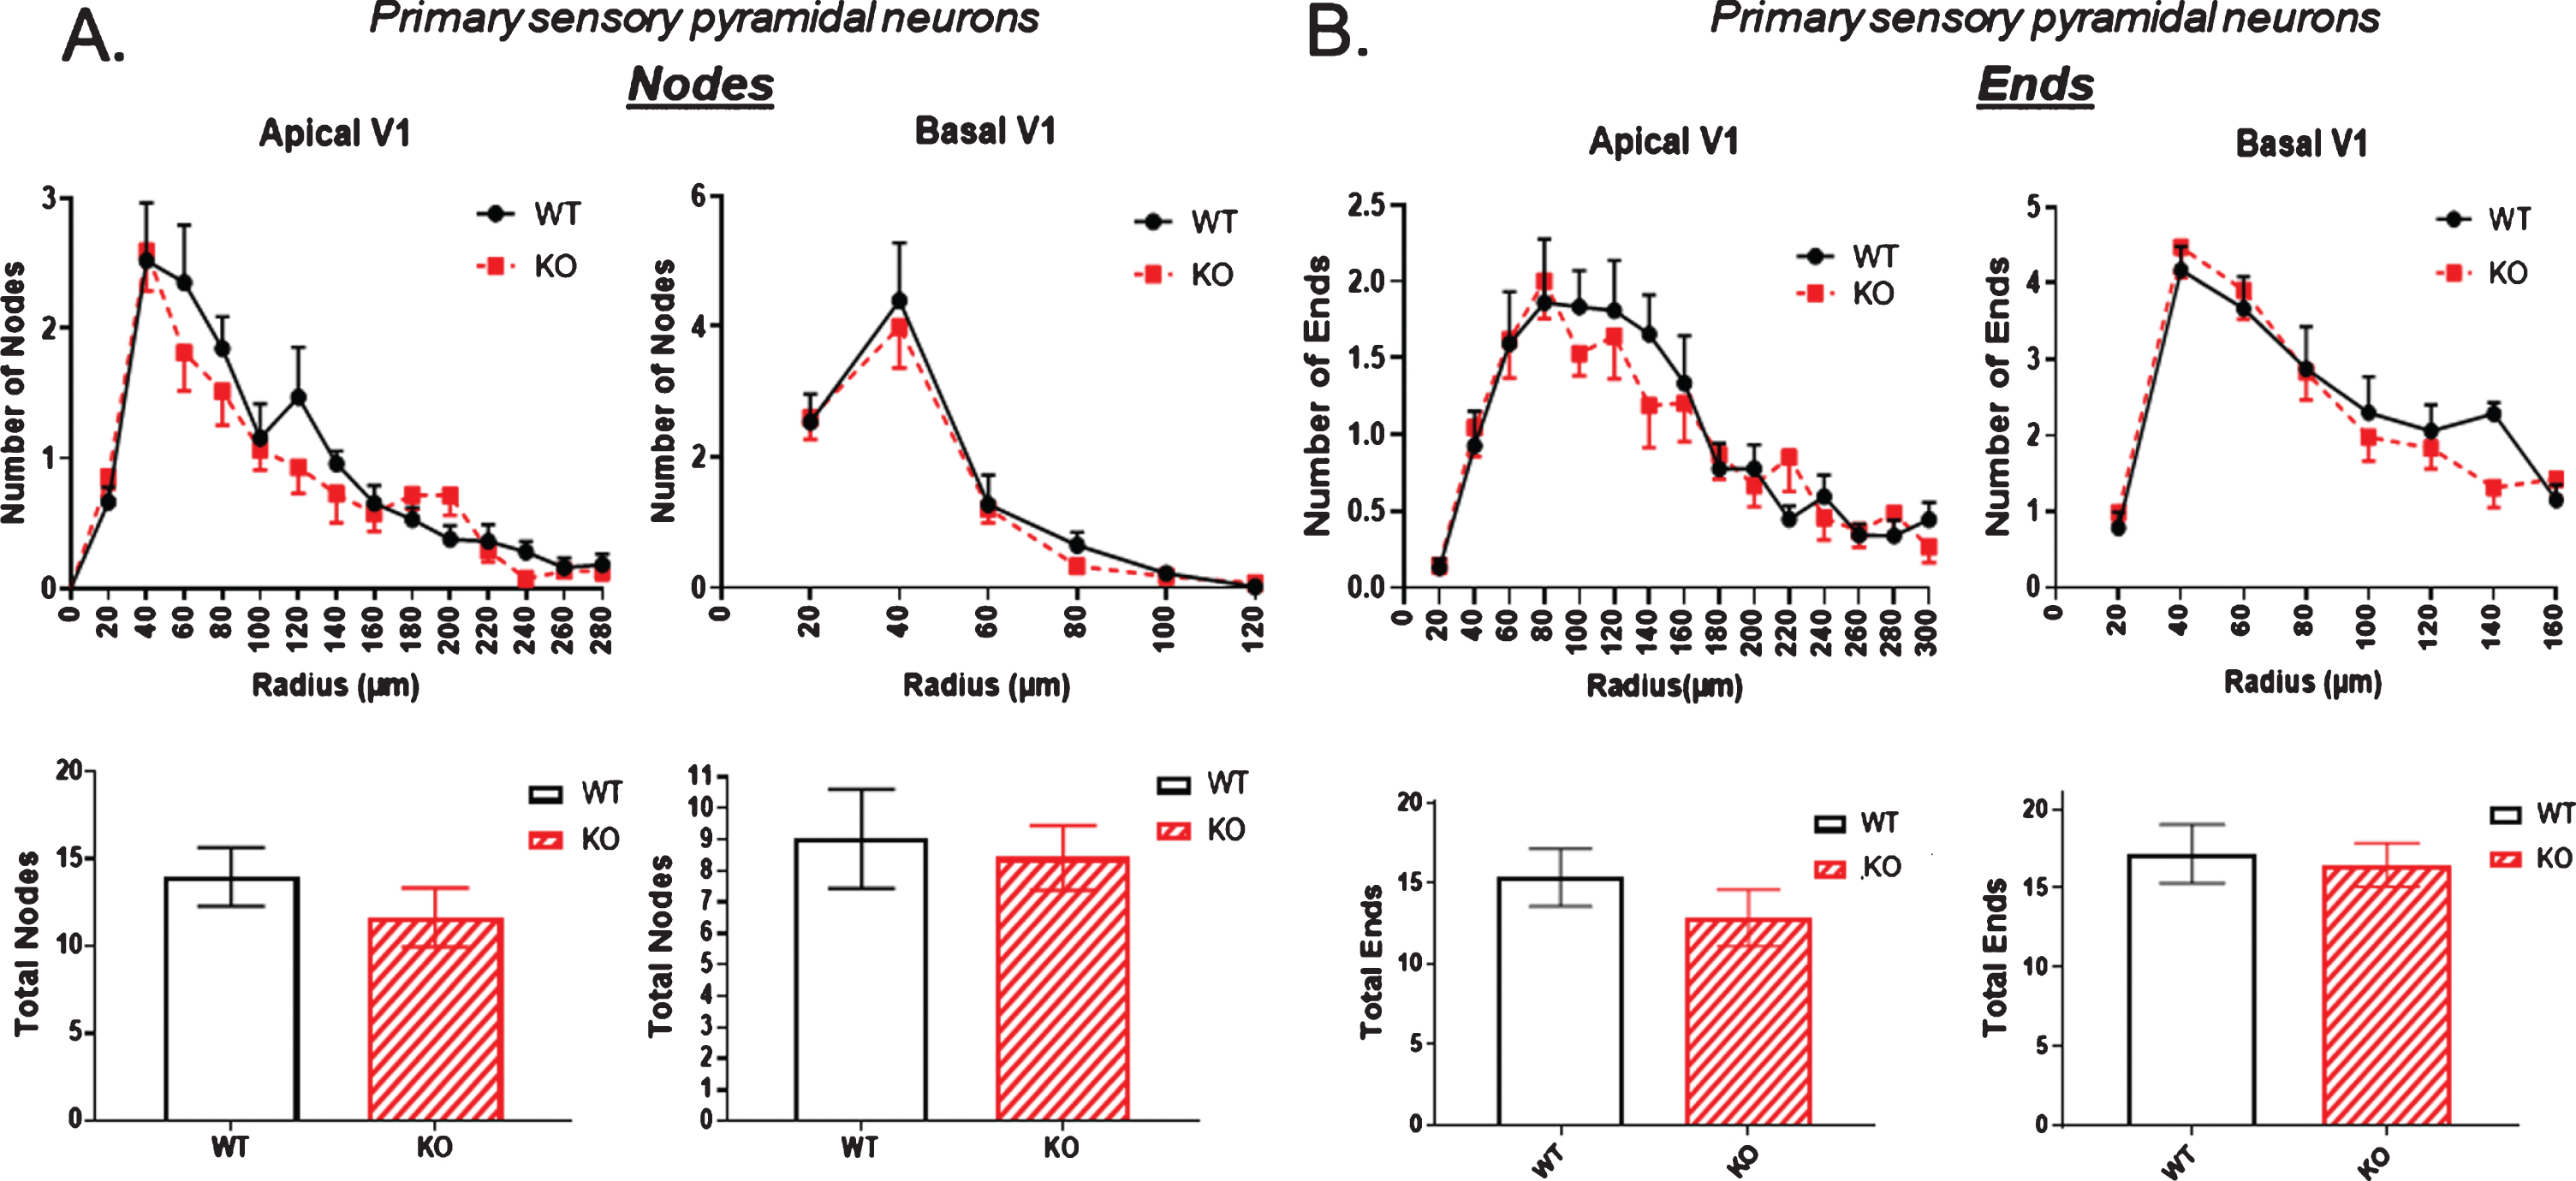
In examining the node numbers in primary sensory cortex, neither apical nor basal dendrites showed any reduction when comparing KO to WT mice (Fig. 8A). Likewise, no reduction in the number of dendritic ends was observed in apical or basal dendrites of the sensory cortex in KO versus WT (Fig. 8B).
Fig.8
Dendrites of pyramidal neurons in primary sensory cortex displayed no significant difference in A) the number of nodes and B) the number of dendritic ends in KO versus WT mice. Data represent the mean±SEM of measurements from 9 WT and 15 KO mice, and were analyzed by Student’s t-test for unpaired data.
Pyramidal cell bodies
One possibility that might account for the reduced dendritic arbor of the dorsal hippocampal neurons in KOs is that these neurons have lost one or more dendrites emanating from the cell body. We addressed this possibility in Fig. 9A, B and C (left panels) where the number of basal dendrites emerging from the cell body was counted. Neither in the two hippocampal areas nor in the primary sensory cortex was there a reduction in the basal dendrite count. This indicates that the reduced arbors in the dorsal hippocampus of KOs do not result from the loss of primary dendrites arising from a cell body.
Fig.9
Because of the significant reduction in the dorsal CA1 region arborization observed in KO versus WT mice (Figs. 2–5), the number of primary basal dendrites and the cell body perimeters were measured in A) the dorsal CA1 region, B) the ventral CA1 region, and C) the primary sensory cortex. There were no significant differences in the number of primary basal dendrites or in the cell body perimeters in KO versus WT mice in any of the three regions. Data represent the mean±SEM of measurements from 9 WT and 15 KO mice, and were analyzed by Student’s t-test for unpaired data.
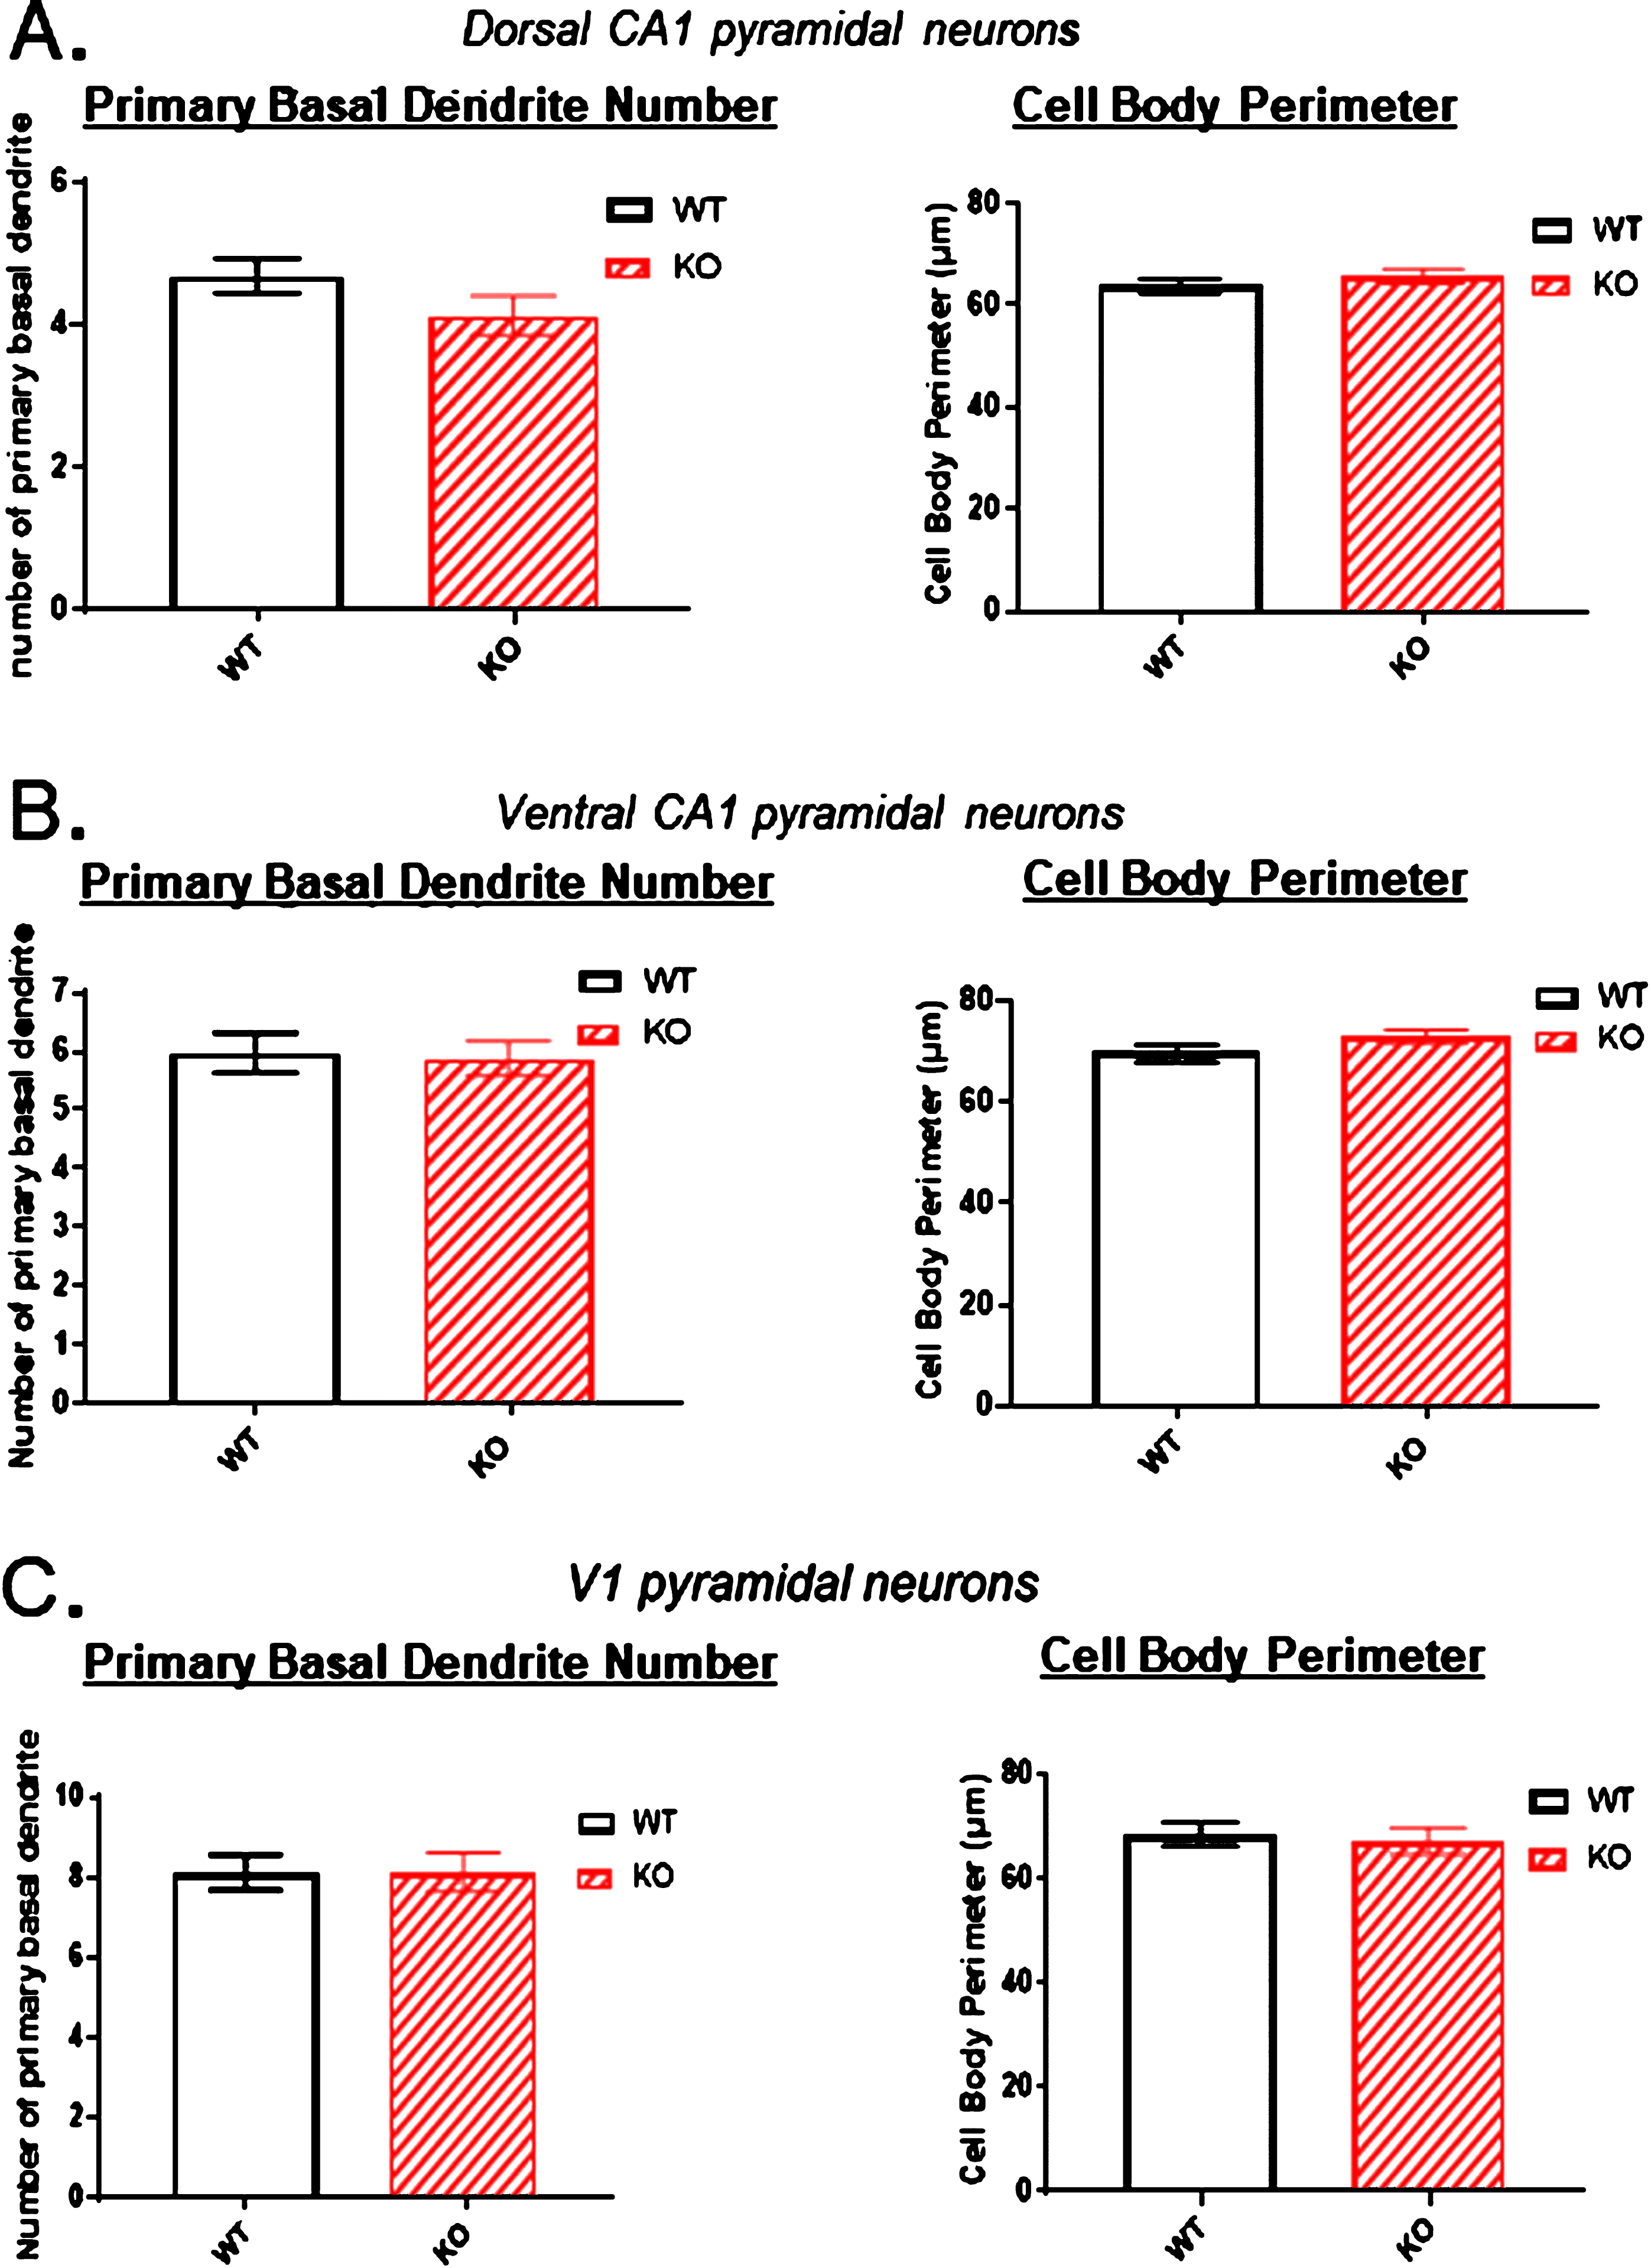
It is well documented that neurons under ischemic stress show initial swelling of their cell bodies followed hours later by the shrinkage of necrosis. Therefore, the pyramidal somata of KOs versus WTs were also examined to determine if there was a detectable volume change to the cell body in those neurons where their dendritic arbor was reduced. The perimeter of each pyramidal cell body was traced and recorded. Figures 9A, B and C (right panels) illustrate that there was no obvious cell body swelling or shrinkage of the cell bodies in any of the three regions examined.
Dendritic spine density
The apparent pruning of the pyramidal arbors of KO versus WT mice in the dorsal (but not ventral) CA1 region (Figs. 2–5), prompted us to examine if the density of spines (i.e., the number of spines/10 μm of dendritic length) was reduced. If so, where was the reduction within the arbor of KO versus WT mice? And were specific types of spines affected along dCA1 dendrites? Different types of spines on dendrites originating from CA1 pyramidal cell bodies are shown in Fig. 10. Dendritic spines were most commonly mushroom-shaped (M). Other types were thin (T), filapodic (F), or stubby (S). The dendrite itself might also show some dilatations (D).
Fig.10
A-F). Different types of spines on dendrites originating from CA1 pyramidal cell bodies. The reduction in the dorsal CA1 region arborization in KO versus WT mice (Figs. 2–5) prompted the question of whether spine density was reduced and if so, were specific types of spines lost. Dendritic spines are most commonly mushroom-shaped (M). Other types are thin (T), filapodic (F), or stubby (S). The dendrite itself may also be dilated (D).
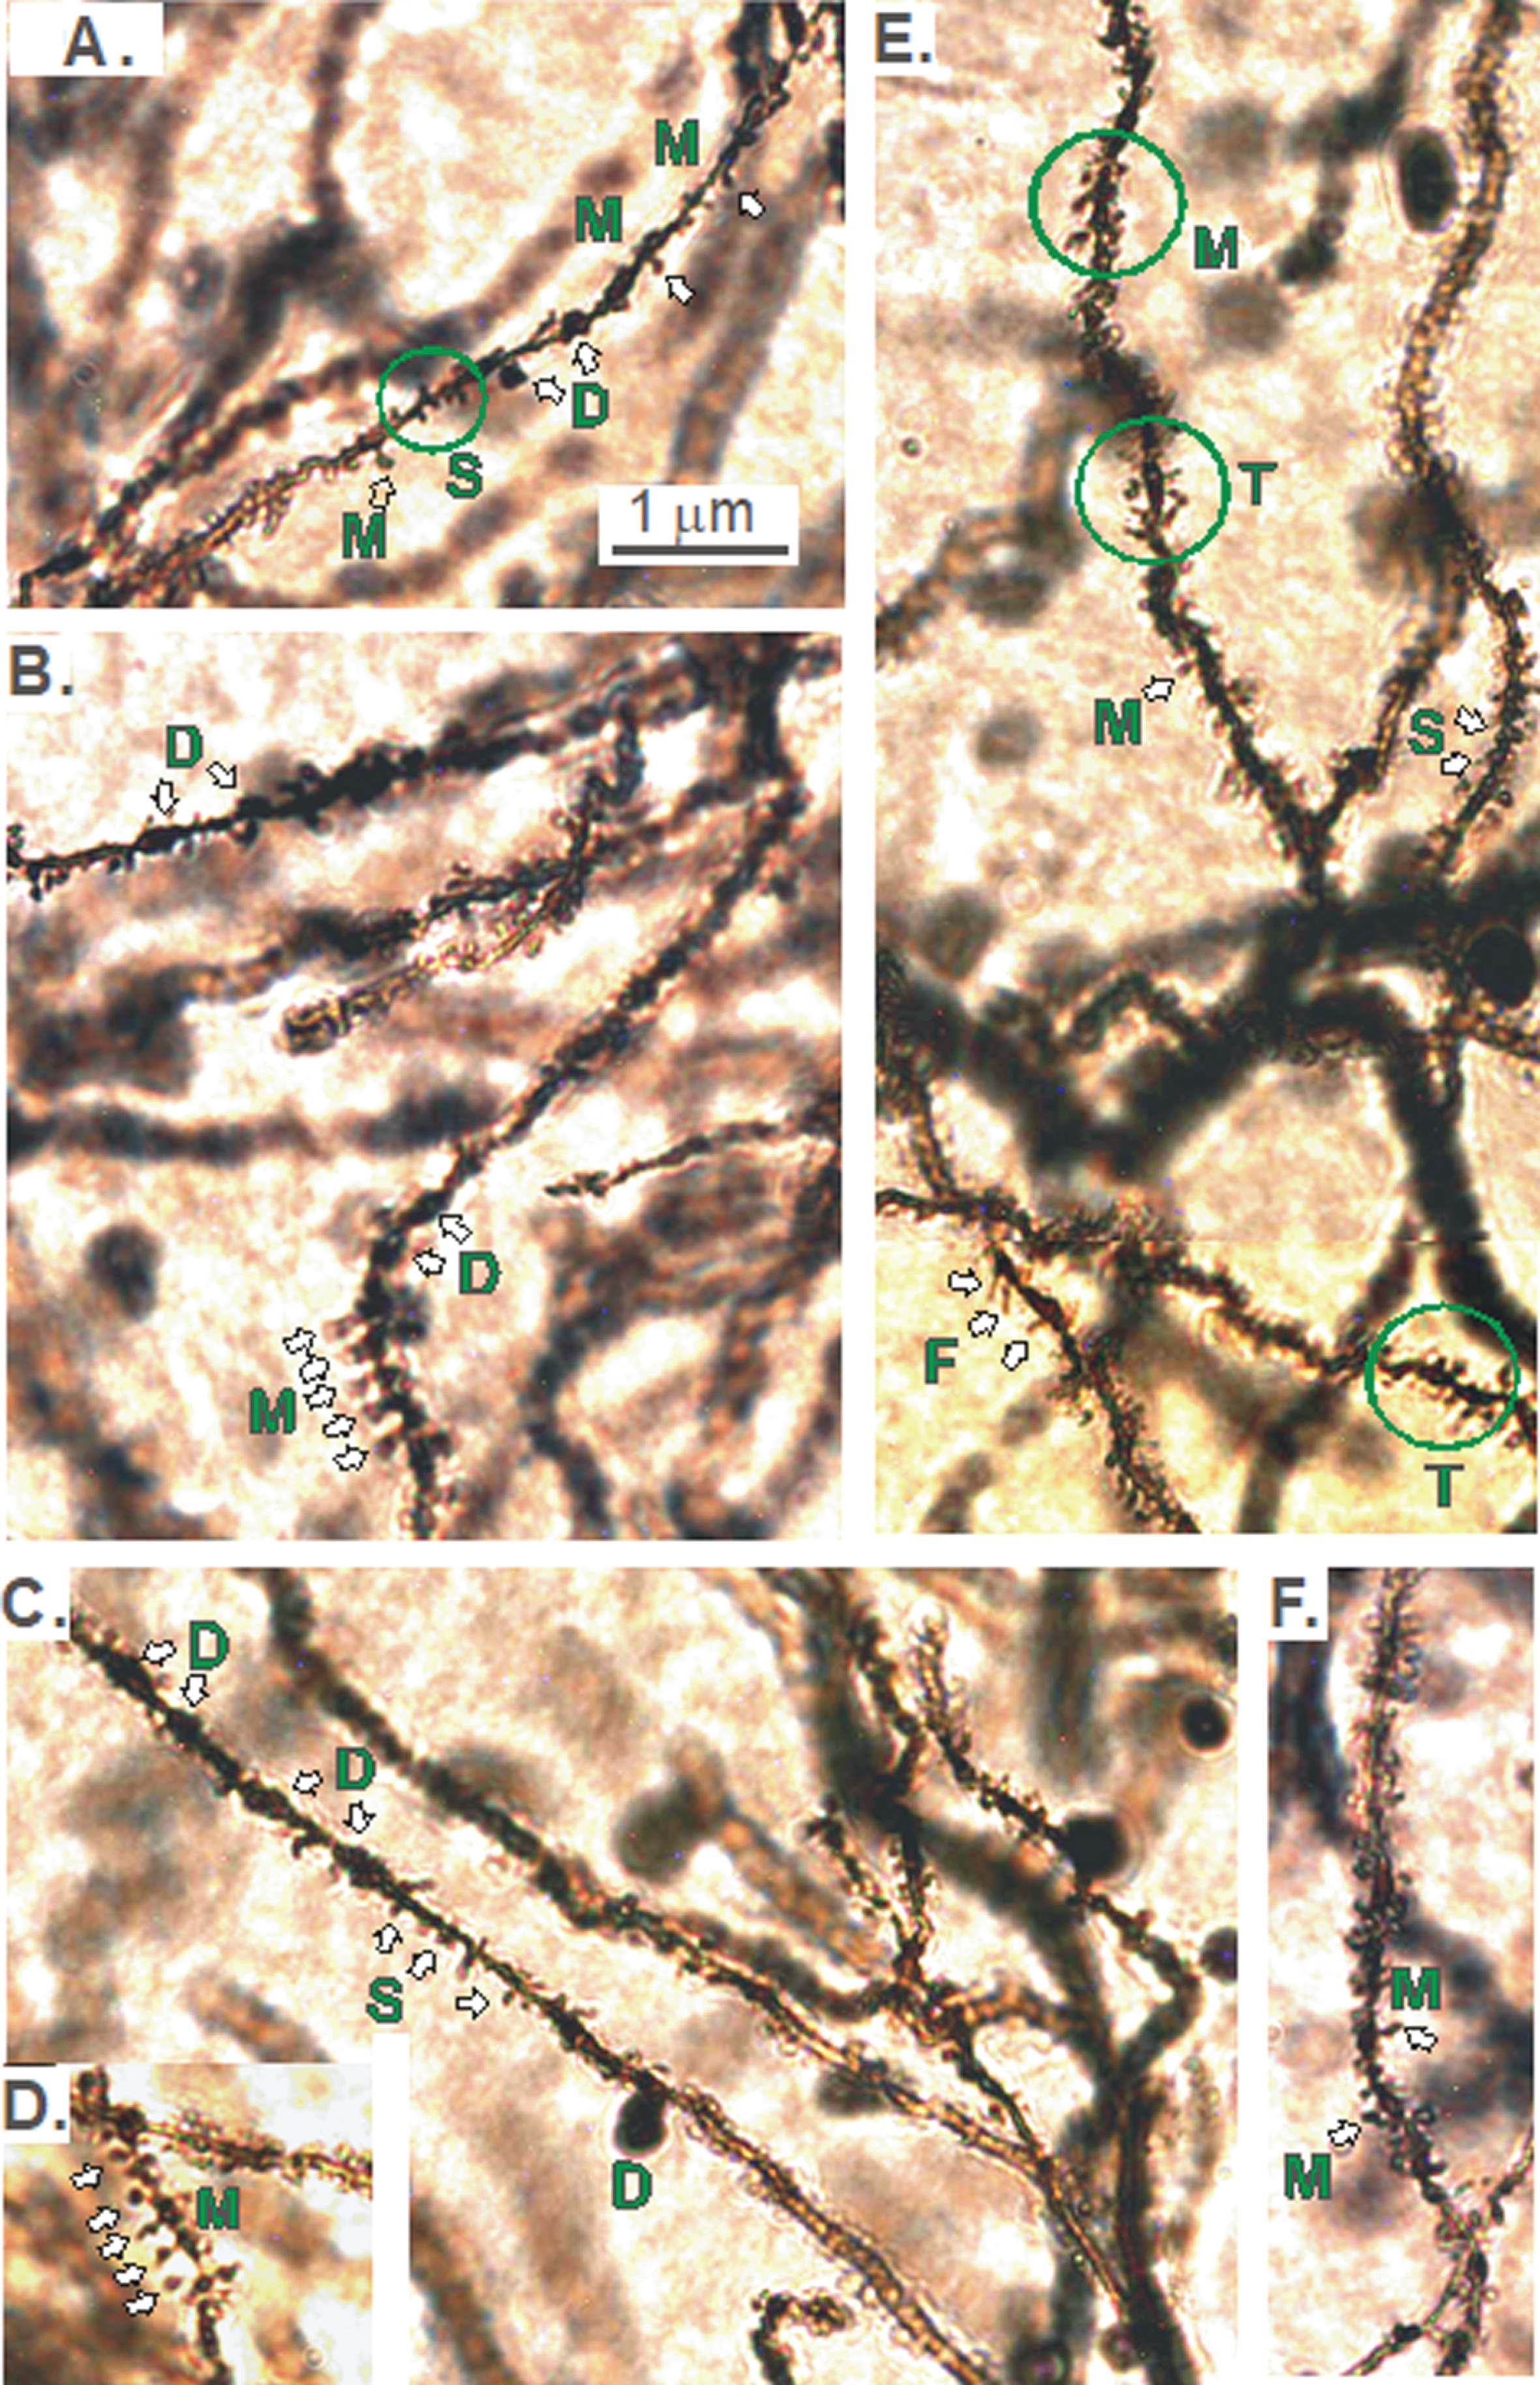
Table 1
Summary of morphological changes to pyramidal neurons in the two hippocampal regions and in the overlying primary sensory neocortex of the Aldh2-/- mouse. Compared to WT controls, reductions in the extent of dendritic arborization are specific to the dorsal CA1 region. No statistically significant change (NC) is observed in other regions, although some values consistently trend as reductions and approach significance (NC*)
| Dendritic Properties | Change in KO versus WT mice | |||
| dCA1 | vCA1 | SS1/V1 | ||
| apical | basal | |||
| Length | ↓↓ | ↓↓↓ | NC* | NC* |
| Nodes | ↓↓ | ↓↓ | NC | NC |
| Intersections | ↓↓ | ↓↓↓ | NC | NC* |
| Ends | ↓ | ↓ | NC | NC |
| Spine density | ↓ | NC* | ––– | ––– |
| # of 1° basal dendrites | NC | NC | NC | |
| Cell body perimeter | NC | NC | NC | |
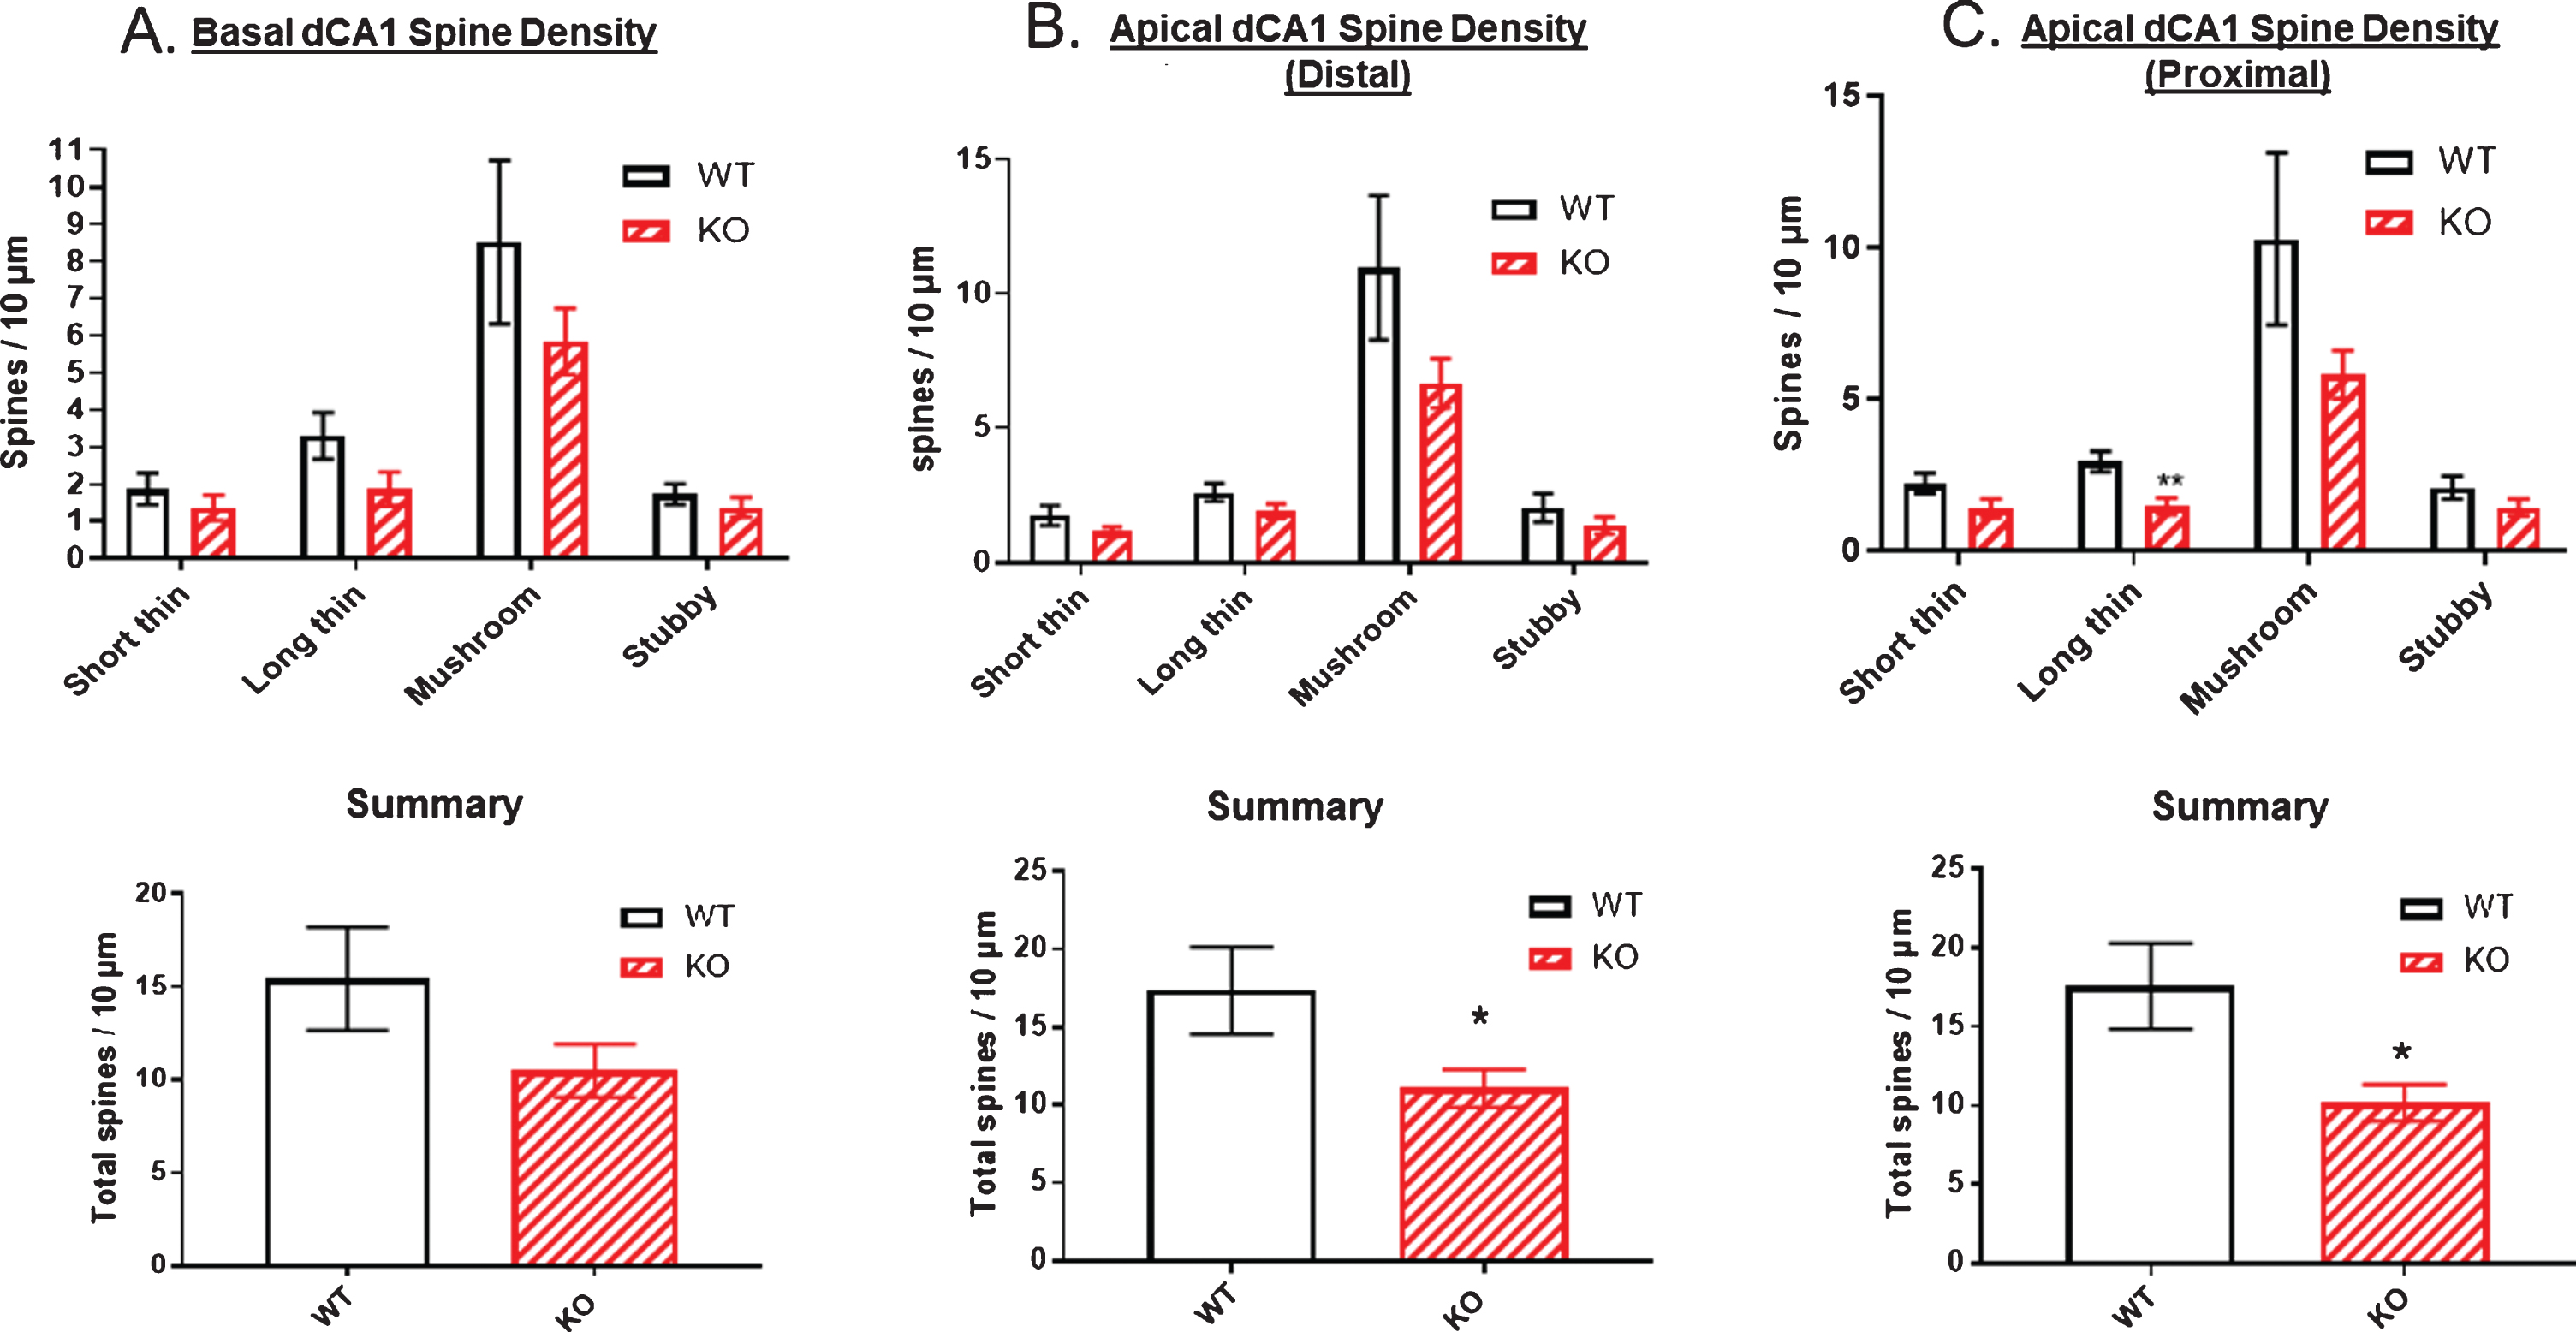
Figure 11 (top panels) examined spine density broken down by spine type along dendrites originating from dCA1 pyramidal cell bodies. The number of each spine type was plotted per 10 μm of dendrite length in the three regions of the arbor: basal (Fig. 11A), apical distal (Fig. 11B), and apical proximal (Fig. 11C). In all three dCA1 regions, the mushroom type of spine predominated. There was a trend for reduced spine density of all four spine types in each of the three dCA1 regions. Total spine density was significantly reduced in the two apical regions by approximately 55% (Fig. 11B, C, bottom panels). The basal region also showed a 33% reduction in total spine density, but this did not reach significance (Fig. 11A, bottom panel).
Fig.11
Reductions in spine numbers on dendrites originating from dorsal CA1 pyramidal cell bodies. Dendritic spines are most commonly mushroom-shaped (upper panels). A) Total spine density was not significantly reduced in the basal dendrites of dCA1 in KO versus WT mice but was significantly reduced by ∼55% in both B) distal and C) proximal regions of apical dendrites in comparison to WT (lower panels). Data represent the mean±SEM of measurements from 9 WT and 15 KO mice, and were analyzed by Student’s t-test for unpaired data. *significant difference as indicated (*p < 0.05).
DISCUSSION
We found that in 12-month-old Aldh2-/- (KO) mice, both basal and apical CA1 dendrites located in the dorsal hippocampus are significantly shorter, as well as having fewer dendritic nodes, ends, and intersections compared to age-matched WT mice. Significantly, these reductions are not detected in pyramidal neurons of the ventral hippocampus of these same KO mice. These Aldh2-/- mice display significantly reduced complexity throughout their dendritic trees in dCA1 but not vCA1. Along these dendrites in dCA1, spine density is reduced by ∼33% in basal dCA1 dendrites and by ∼55% in apical dCA1 dendrites (both proximal and distal regions) compared to the WT mice. So not only is the dendritic arbor apparently trimmed back, but the density of spines along these dendrites is reduced in KO versus WT mice. Notably, the cell body perimeter and the number of their primary dendrites of these same pyramidal neurons are not affected, indicating that it is dendrites and not their cell bodies that are most altered structurally in the in dCA1 of the KO mice.
Whereas the dCA1 is part of the circuitry that registers a cognitive map for navigation, enabling animals to properly orient and execute behaviors in a learned environment, vCA1 connectivity regulates the impact of emotional experiences and controls general affective states (references in [8]). While we have not specifically tested autonomic, endocrine, defensive, social, or reproductive control systems in this mouse model, our finding that vCA1 pyramidal cells in KO mice are structurally no different from their WT counterparts suggests more normal information processing dealing with homeostasis and emotion compared to defects in dCA1-dependent cognitive function that we have previously reported in Aldh2 KO mice [6, 29].
The layer V pyramidal neurons in the overlying primary sensory cortex (SS1) and more caudally, primary visual cortex (V1) of the KO mice show a consistent trend toward reduced dendrite branching and complexity. Because there are no direct inputs to SS1 or to V1 from dCA1, this trend might represent a general cut-back of pyramidal neurons in the KO neocortex. More neocortical regions would need to be sampled to confirm this. We suspect that neocortical regions involved with cognition (e.g., entorhinal cortex) would show a more dramatic reduction in pyramidal cell arborization than the primary sensory cortices examined in this study.
What then could account for the selective reduction of dendritic complexity in dCA1? Several lines of evidence suggest that the dorsal hippocampus is more vulnerable to damage by oxidative stress. Studies using quench-assisted MRI demonstrated increased free radical production in vivo in the dorsal but not intermediate CA1 region of the hippocampus of Aldh2 KO mice relative to wildtype mice [30], suggesting increased basal oxidative stress in this region. This same increase in free radical production was also observed in the dCA1 region in the 5XFAD mouse model of familial AD. It is well known that ischemia/reperfusion results in the accelerated formation of reactive oxygen species (ROS) [31, 32]. The dCA1 region is much more vulnerable than vCA1 to ischemic damage following ischemia reperfusion [33], suggesting that antioxidant defense mechanisms in dCA1 neurons are less able to counteract excessive ROS production.
A number of studies have described differential gene expression along the dorsoventral long axis of the hippocampus [18, 34–36]. The expression of a number of genes involved in antioxidant defense is greater in vCA1 than in dCA1 pyramidal neurons, including mitochondrial superoxide dismutase, myeloperoxidase, ALDH5A1, glutathione transferase A4, NAD(P)H quinone oxidoreductase, and, in particular, Nrf2 [18, 36]. Nrf2, a transcription factor of great importance in responding to oxidative stress by upregulating the expression of numerous enzymes involved in antioxidant defense, has a 2-fold greater expression in vCA1 neurons compared to dCA1 neurons. Conversely, the expression of NADPH oxidase 4, an important source of superoxide synthesis, is 2-fold greater in dCA1 neurons. Together, these data suggest that the dCA1 region is inherently more susceptible to the deleterious effects of oxidative stress-induced damage, and this could account for the reduced arborization of CA1 neurons in this region of the hippocampus.
In conclusion, this study demonstrates significantly reduced branching and complexity of dendrites specific to CA1 pyramidal neurons in the dorsal (but not ventral) hippocampus in 12-month-old Aldh2 KO mice as compared to their WT counterparts. This apparent ‘trimming back’ of the dendritic arbors helps account for the previously observed cognitive deficits in these KO mice compared to their WT cohort as described by D’Souza et al. [6]. A progressive decline in recognition and spatial memory by the age of 12 months in KOs would be expected to develop over those months, such that a progressive reduction of CA1 dendritic arborization in the dorsal (but not ventral) hippocampus should also develop as these mice age. We are currently examining that possibility.
ACKNOWLEDGMENTS
The authors thank Mrs. Diane Anderson for technical assistance and Dr. D.J. Cook (Department of Surgery, Queen’s University) for the use of his microscope and the Neurolucida system. The Aldh2-/- mice were kindly provided by T. Kawamoto, University of Occupational and Environmental Health, Kitakyushu, Japan. This work was supported by a grant to RHM by the Saudi Cultural Bureau, a Canadian Institutes of Health Research grant to BMB (PJT 153013), and operating grants from the Heart and Stroke Foundation of Canada (G-19-0024266) and the National Science and Engineering Research Council (RGPN/04624-2017) to RDA.
Authors’ disclosures available online (https://www.j-alz.com/manuscript-disclosures/19-1067r2).
REFERENCES
[1] | Nunomura A , Perry G , Aliev G , Hirai K , Takeda A , Balraj EK , Jones PK , Ghanbari H , Wataya T , Shimohama S , Chiba S , Atwood CS , Petersen RB , Smith MA ((2001) ) Oxidative damage is the earliest event in Alzheimer disease. J Neuropathol Exp Neurol 60: , 759–767. |
[2] | Praticò D , Uryu K , Leight S , Trojanoswki JQ , Lee VMY ((2001) ) Increased lipid peroxidation precedes amyloid plaque formation in an animal model of Alzheimer amyloidosis. J Neurosci 21: , 4183–4187. |
[3] | Reed T , Perluigi M , Sultana R , Pierce WM , Klein JB , Turner DM , Coccia R , Markesbery WR , Butterfield DA ((2008) ) Redox proteomic identification of 4-Hydroxy-2-nonenal-modified brain proteins in amnestic mild cognitive impairment: Insight into the role of lipid peroxidation in the progression and pathogenesis of Alzheimer’s disease. Neurobiol Dis 30: , 107–120. |
[4] | Reed TT , Pierce WM , Markesbery WR , Butterfield DA ((2009) ) Proteomic identification of HNE-bound proteins in early Alzheimer disease: Insights into the role of lipid peroxidation in the progression of AD. Brain Res 1274: , 66–76. |
[5] | Perluigi M , Sultana R , Cenini G , Di Domenico F , Memo M , Pierce WM , Coccia R , Butterfield DA ((2009) ) Redox proteomics identification of 4-hydroxynonenal-modified brain proteins in Alzheimer’s disease: Role of lipid peroxidation in Alzheimer’s disease pathogenesis. Proteomics Clin Appl 3: , 682–693. |
[6] | D’Souza Y , Elharram A , Soon-Shiong R , Andrew RD , Bennett BM ((2015) ) Characterization of Aldh2-/- mice as an age-related model of cognitive impairment and Alzheimer’s disease. Mol Brain 8: , 1–16. |
[7] | Moser MB , Moser EI ((1998) ) Functional differentiation in the hippocampus. Hippocampus 8: , 608–619. |
[8] | Fanselow MS , Dong HW ((2010) ) Are the dorsal and ventral hippocampus functionally distinct structures. Neuron 65: , 7–19. |
[9] | Strange BA , Witter MP , Lein ES , Moser EI ((2014) ) Functional organization of the hippocampal longitudinal axis. Nat Rev Neurosci 15: , 655–669. |
[10] | Skelin I , Kilianski S , McNaughton BL ((2018) ) Hippocampal coupling with cortical and subcortical structures in the context of memory consolidation. Neurobiol Learn Mem 160: , 21–31. |
[11] | Moser E , Moser MB , Andersen P ((1993) ) Spatial learning impairment parallels the magnitude of dorsal hippocampal lesions, but is hardly present following ventral lesions. J Neurosci 13: , 3916–3925. |
[12] | Moser MB , Moser EI , Forrest E , Andersen P , Morris RG. ((1995) ) Spatial learning with a minislab in the dorsal hippocampus. Proc Natl Acad Sci U S A 92: , 9697–9701. |
[13] | Kjelstrup KG , Tuvnes FA , Steffenach HA , Murison R , Moser EI , Moser MB ((2002) ) Reduced fear expression after lesions of the ventral hippocampus. Proc Natl Acad Sci U S A 99: , 10825–10830. |
[14] | Hunsaker MR , Fieldsted PM , Rosenberg JS , Kesner RP ((2008) ) Dissociating the roles of dorsal and ventral CA1 for the temporal processing of spatial locations, visual objects, and odors. Behav Neurosci 122: , 643–650. |
[15] | Malik R , Dougherty KA , Parikh K , Byrne C , Johnston D ((2016) ) Mapping the electrophysiological and morphological properties of CA1 pyramidal neurons along the longitudinal hippocampal axis. Hippocampus 26: , 341–361. |
[16] | Maggio N , Shavit Stein E , Segal M ((2015) ) Ischemic LTP: NMDA-dependency and dorso/ventral distribution within the hippocampus. Hippocampus 25: , 1465–1471. |
[17] | Papatheodoropoulos C , Kouvaros S ((2016) ) High-frequency stimulation-induced synaptic potentiation in dorsal and ventral CA1 hippocampal synapses: The involvement of NMDA receptors, mGluR5, and (L-Type) voltage-gated calcium channels. Learn Mem 23: , 460–464. |
[18] | Cembrowski MS , Wang L , Sugino K , Shields BC , Spruston N ((2016) ) Hipposeq: A comprehensive RNA-seq database of gene expression in hippocampal principal neurons. eLife 5: , e14997. |
[19] | Kitagawa K , Kawamoto T , Kunugita N , Tsukiyama T , Okamoto K , Yoshida A , Nakayama K , Nakayama KI ((2000) ) Aldehyde dehydrogenase (ALDH) 2 associates with oxidation of methoxyacetaldehyde; in vitro analysis with liver subcellular fraction derived from human and Aldh2 gene targeting mouse. FEBS Lett 476: , 306–311. |
[20] | Isse T , Oyama T , Kitagawa K , Matsuno K , Matsumoto A , Yoshida A , Nakayama K , Nakayama KI , Kawamoto T ((2002) ) Diminished alcohol preference in transgenic mice lacking aldehyde dehydrogenase activity. Pharmacogenetics 12: , 621–626. |
[21] | Sholl DA ((1953) ) Dendritic organization in the neurons of the visual and motor cortices of the cat. J Anat 87: , 387–406. |
[22] | Pillai AG , de Jong D , Kanatsou S , Krugers H , Knapman A , Heinzmann JM , Holsboer F , Landgraf R , Joëls M , Touma C ((2012) ) Dendritic morphology of hippocampal and amygdalar neurons in adolescent mice is resilient to genetic differences in stress reactivity. PLoS One 7: , e38971. |
[23] | Perez-Cruz C , Nolte MW , Van Gaalen MM , Rustay NR , Termont A , Tanghe A , Kirchhoff F , Ebert U ((2011) ) Reduced spine density in specific regions of CA1 pyramidal neurons in two transgenic mouse models of Alzheimer’s disease. J Neurosci 31: , 3926–3934. |
[24] | Risher WC , Ustunkaya T , Alvarado JS , Eroglu C ((2014) ) Rapid Golgi analysis method for efficient and unbiased classification of dendritic spines. PLoS One 9: , e107591. |
[25] | Harris KM , Jensen FE , Tsao B ((1992) ) Three-dimensional structure of dendritic spines and synapses in rat hippocampus (CA 1) at postnatal day 15 and adult ages: Implications for the maturation of synaptic physiology and long-term potentiation. J Neurosci 12: , 2685–2705. |
[26] | Spiga S , Talani G , Mulas G , Licheri V , Fois GR , Muggironi G , Masala N , Cannizzaro C , Biggio G , Sanna E , Diana M ((2014) ) Hampered long-term depression and thin spine loss in the nucleus accumbens of ethanol-dependent rats. Proc Natl Acad Sci U S A 111: , E3745–E3754. |
[27] | Chapleau CA , Larimore JL , Theibert A , Pozzo-Miller L ((2009) ) Modulation of dendritic spine development and plasticity by BDNF and vesicular trafficking: Fundamental roles in neurodevelopmental disorders associated with mental retardation and autism. J Neurodev Disord 1: , 185–196. |
[28] | Risher WC , Patel S , Kim IH , Uezu A , Bhagat S , Wilton DK , Pilaz LJ , Singh Alvarado J , Calhan OY , Silver DL , Stevens B , Calakos N , Soderling SH , Eroglu C ((2014) ) Astrocytes refine cortical connectivity at dendritic spines. Elife 3: , e04047. |
[29] | Elharram A , Czegledy NM , Golod M , Milne GL , Pollock E , Bennett BM , Shchepinov MS ((2017) ) Deuterium-reinforced polyunsaturated fatty acids improve cognition in a mouse model of sporadic Alzheimer’s disease. FEBS J 284: , 4083–4095. |
[30] | Berkowitz BA , Lenning J , Khetarpal N , Tran C , Wu JW , Berri AM , Dernay K , Haacke EM , Shafie-Khorassani F , Podolsky RH , Gant JC , Maimaiti S , Thibault O , Murphy GG , Bennett BM , Roberts R ((2017) ) In vivo imaging of prodromal hippocampus CA1 subfield oxidative stress in models of Alzheimer’s disease and Angelman syndrome. FASEB J 31: , 4179–4186. |
[31] | Granger DN , Kvietys PR ((2015) ) Reperfusion injury and reactive oxygen species: The evolution of a concept. Redox Biol 6: , 524–551. |
[32] | Milne GL , Dai Q , Roberts LJ 2nd ((2015) ) The isoprostanes–25 years later. Biochim Biophys Acta 1851: , 433–445. |
[33] | Ashton D , Van Reempts J , Haseldonckx M , Willems R ((1989) ) Dorsal-ventral gradient in vulnerability of CA1 hippocampus to ischemia: A combined histological and electrophysiological study. Brain Res 487: , 368–372. |
[34] | Thompson CL , Pathak SD , Jeromin A , Ng LL , MacPherson CR , Mortrud MT , Cusick A , Riley ZL , Sunkin SM , Bernard A , Puchalski RB , Gage FH , Jones AR , Bajic VB , Hawrylycz MJ , Lein ES ((2008) ) Genomic anatomy of the hippocampus. Neuron 60: , 1010–1021. |
[35] | Dong HW , Swanson LW , Chen L , Fanselow MS , Toga AW ((2009) ) Genomic-anatomic evidence for distinct functional domains in hippocampal field CA1. Proc Natl Acad Sci U S A 106: , 11794–11799. |
[36] | Cembrowski MS , Bachman JL , Wang L , Sugino K , Shields BC , Spruston N ((2016) ) Spatial gene-expression gradients underlie prominent heterogeneity of CA1 pyramidal neurons. Neuron 89: , 351–368. |


