
PRKAG2 Gene Expression Is Elevated and its Protein Levels Are Associated with Increased Amyloid-β Accumulation in the Alzheimer’s Disease Brain
Abstract
Increased amyloid-β (Aβ) accumulation associated with abnormal autophagy-lysosomal activity and nutrient kinase dysregulation are common features in Alzheimer’s disease (AD) brain. Recent studies have identified PRKAG2 and TIPRL genes that control nutrient kinase regulated autophagy, and here we determined if their expression is altered in postmortem AD brains. Gene and protein expression of TIPRL were unchanged. However, gene expression of PRKAG2 was increased 3-fold and its protein levels positively correlated with Aβ accumulation in the AD brain. In summary, our findings suggest that increased PRKAG2 is an important contributing factor to Aβ accumulation in the AD brain.
INTRODUCTION
Autophagy is an important clearance pathway for misfolded and aggregate proteins and its dysfunction has been implicated in the impaired clearance of aggregate proteins in neurodegenerative diseases including Alzheimer’s disease (AD), frontotemporal dementia (FTD), and Lewy body dementia (LBD). The autophagy pathway is impaired at different steps in various types of dementias and mostly associated with increased autophagy initiation and reduced autophagosome degradation [1]. AD brain shows a marked upregulation of lysosomal activity, including extensive involvement of autophagosomes and acid hydrolases such as cathepsin D with amyloid-β (Aβ) protein deposits [1, 2]. Whereas, LBD is characterized by a decrease in Atg7 expression which is predicted to result in deficient initiation of the autophagic process [3]. A high proportion of FTD cases have a hereditary component and several pathogenic gene mutations impact pathways associated with later steps of autophagy including the CHMP2B (charged multivesicular body protein 2B) and VCP (valosin containing protein) genes, which lead to impaired autophagosome maturation [4].
Autophagy is closely regulated by nutrient signaling kinases [mammalian (or mechanistic) target of rapamycin complex 1] (mTORC1) and AMP-activated kinase (AMPK). mTORC1 and AMPK act as the main upstream sensors, while Unc-51 like autophagy activating kinase 1 (ULK1) complex integrates the upstream signals and transduces them to the downstream autophagy pathway [5]. Signaling from mTORC1 and AMPK pathways is essential for regulating anabolic and catabolic pathways and growing evidence suggests that these nutrient sensing kinases are dysregulated in AD and other neurodegenerative diseases [6]. Studies have identified regulatory genes PRKAG2 (Protein Kinase AMP-Activated Non-Catalytic Subunit Gamma 2) and TIPRL (TOR Signaling Pathway Regulator) that modulate the ability of AMPK and mTORC1 to control autophagy during stress. AMPK is a heterotrimeric protein complex composed of 3 subunits including a non-catalytic regulatory gamma subunit PRKAG2. AMPK is an evolutionarily conserved master switch in the cellular energy balance activated during metabolic stress [7] [8]. PRKAG2 homolog, SNF4Aγ is required for regulation of developmental and stress-induced autophagy in a drosophila model [9]. TIPRL facilitates amino-acid regulated mTORC1 signaling through its association with protein phosphatase 2A (PP2Ac). TIPRL promotes H2AX (histone H2A variant) phosphorylation during DNA damage [10] and also functions as a negative regulator of autophagy [11]. The above studies show an important role for PRKAG2 and TIPRL in regulating nutrient kinase signaling and autophagy during stress. But whether their expression levels are altered in the AD brain and if they are associated with impaired autophagy and accumulation of Aβ is unknown.
The main aim of this study was to determine the gene and protein expression levels of autophagosome marker microtubule-associated protein 1A/1B-light chain 3B (LC3), lysosomal hydrolase Cathpesin D, autophagy regulators PRKAG2 and TIPRL in frontal cortex and hippocampal regions of postmortem brain tissues of patients with AD, FTD, LBD, and in healthy controls. We also assessed whether Aβ accumulation correlated with autophagy related proteins LC3BI, LC3BII, Cathepsin D, PRKAG2, and TIPRL. Our findings show that gene expression of PRKAG2 was increased 3-fold in AD-hippocampus and AD-frontal cortex and its protein levels positively correlated with Aβ accumulation in the brain. Whereas, gene and protein expression of TIPRL were unchanged. Our findings suggest that increased PRKAG2 may be an important contributing factor to Aβ accumulation in AD brain.
MATERIAL AND METHODS
Postmortem brains
All experiments were conducted in frontal cortex (F) and hippocampus (H) regions of postmortem brain tissues of patients with AD (n = 15), FTD (n = 5), LBD (n = 5), and healthy controls (n = 5) obtained from the Sydney Brain Bank (SBB), approved by Human Research Ethics Committee of Edith Cowan University (approval number 14820).
cDNA synthesis and gene expression analysis in brain homogenates
Frozen brain tissues (100 mg) were suspended in 300μl Tris-buffered saline (TBS), pH 7.4 with ceramic beads and homogenized at 4000 RPM for 3 cycles of 45 s using a MoBio PowerlyzerTM at 4°C. The brain homogenates were aliquoted into 100μl lots and stored at –80°C. RNA and cDNA preparation were prepared from the brain homogenates using RNeasy lipid tissue mini extraction kit and Qiagen reverse transcription kit. For the quantification of the products (RNA and cDNA), QubitTM dsDNA HS Assay kits (ThermoFisher) were used. Gene expression of autophagosome marker LC3B (Hs00797944_s1), lysosomal hydrolase Cathepsin D (CTSD, Hs00157205_m1), PRKAG2 (Hs00211903_m1), TIPRL (Hs00295580_m1) and endogenous control Glyceraldehyde 3-phosphate dehydrogenase (GAPDH, Hs03929097_g1) was conducted on cDNA synthesized from brain homogenates using Taqman assays on the QuantStudio 12K system. Fold change in gene transcripts was measured using comparative Ct method using the QuantStudio(TM) Real-Time PCR Systems software platform, with GAPDH as endogenous control and frontal cortex from healthy controls (Cont-F) as the reference biological group.
Westerns quantification for brain homogenates
Brain homogenates in TBS were used for western blotting analysis and protein quantification of Aβ, LC3B isoforms LC3BI and LC3BII, Cathepsin D, PRKAG2, TIPRL and control GAPDH. All samples were loaded in duplicate using 4–12% BisTris gels, including a pooled brain homogenate sample as an internal control in each gel. An average of all the internal controls (mean internal control) for each antibody and an internal control factor for each gel was calculated. Average of the duplicate of every sample was calculated and normalized using the internal control factor for the respective gel. Aβ antibody WO2 (3.5 kDa) was a generous gift from Prof. Colin Masters, Melbourne. Other antibodies including GAPDH (37 kDa), LC3B (14 and 16 kDa), mature Cathepsin D (30 kDa), PRKAG2 (60 and 75 kDa isoforms), and TIPRL (32 kDa) were purchased from Cell Signaling or Abcam.
Statistical analysis
To determine statistical significance for comparisons of gene and protein markers measured in brain tissue samples as Mean±Standard Deviation (SD), 1-way ANOVA was used, while Pearson’s correlation was used to assess correlation. Statistical significance was considered post-Tukey correction. All the statistical analyses were conducted on Graphpad Prism software.
RESULTS
Increased PRKAG2 gene expression in AD brain
Increased accumulation of Aβ and elevated lysosomal activity are pathological hallmarks of AD, so we initially assessed expression levels of these markers in frontal cortex (F) and hippocampal (H) regions of postmortem brain tissues of patients with AD, FTD, LBD, and in healthy controls. We first assessed Aβ and GAPDH levels in postmortem brain tissues by western immunoblotting (Fig. 2, Supplementary Figures 1 and 2). Aβ was mostly detected as a monomer at 4 kDa; however, its length was not known. Aβ levels were significantly higher in AD-F as compared to Cont-F. Aβ levels was also high in AD-H as compared to Cont-H, but was not significant. LBD-F also showed increased Aβ levels, as compared to Cont-F indicative of the AD like neuropathology routinely observed in LBD brains [12]. Although our findings show increased Aβ levels in AD-H compared to Cont-H, it was not significant. It is now widely accepted that Aβ accumulation in the brain does not always correlate with neurodegeneration and there are individuals who have low brain amyloid with neurodegeneration (A-N+) and ones who have high amyloid without neurodegeneration (A + N-) [13]. We therefore postulate that this maybe a contributing factor to the low level of Aβ detected in the hippocampi of AD subjects. To address this issue in more details, we assessed Aβ protein levels quantified by western immunoblotting (6E10 antibody) in individual samples of frontal cortex and hippocampal samples of AD and control (Supplementary Figure 2). Low Aβ levels (as compared to Fig. 2) were observed in AD frontal cortex samples 13 and AD hippocampus samples 2, 7, and 11. High Aβ levels (as compared to Fig. 2) was observed in control hippocampus sample 3. Overall, this data supports the growing literature suggesting that Aβ accumulation does not always correlate with neurodegeneration.
Fig.1
Gene and protein expression of autophagy markers LC3B and Cathepsin D in AD, FTD, LBD, and control brains. Gene expression of autophagosome marker LC3B (Hs00797944_s1), lysosomal hydrolase Cathepsin D (CTSD, Hs00157205_m1) and endogenous control Glyceraldehyde 3-phosphate dehydrogenase (GAPDH, Hs03929097_g1) was conducted on cDNA synthesized from homogenates of frontal cortex (F) and hippocampus (H) regions of postmortem brain tissues from AD, LBD, FTD, and healthy controls (Cont) using Taqman assays on the QuantStudio 12K system. Fold change in gene transcripts of LC3B (A) and CTSD (B) was measured using comparative Ct method with GAPDH as endogenous control and Cont-F as the reference biological group. No significant changes were observed in the expression of LCB and Cathepsin D between the different groups. Protein levels of LC3B isoforms LC3I (C) and LC3II (D) and mature isoform of Cathepsin D (E) was also measured using western blotting analysis of the brain homogenates. A representative image of the western blot is shown here (F). No significant change in levels of LC3I (16 kDa) and LC3II (14 kDa) were observed between the different groups. Levels of mature Cathepsin D (30 kDa) was increased in AD-F and LBD-F regions as compared to Cont-F (Mean±SD, *p<0.05).
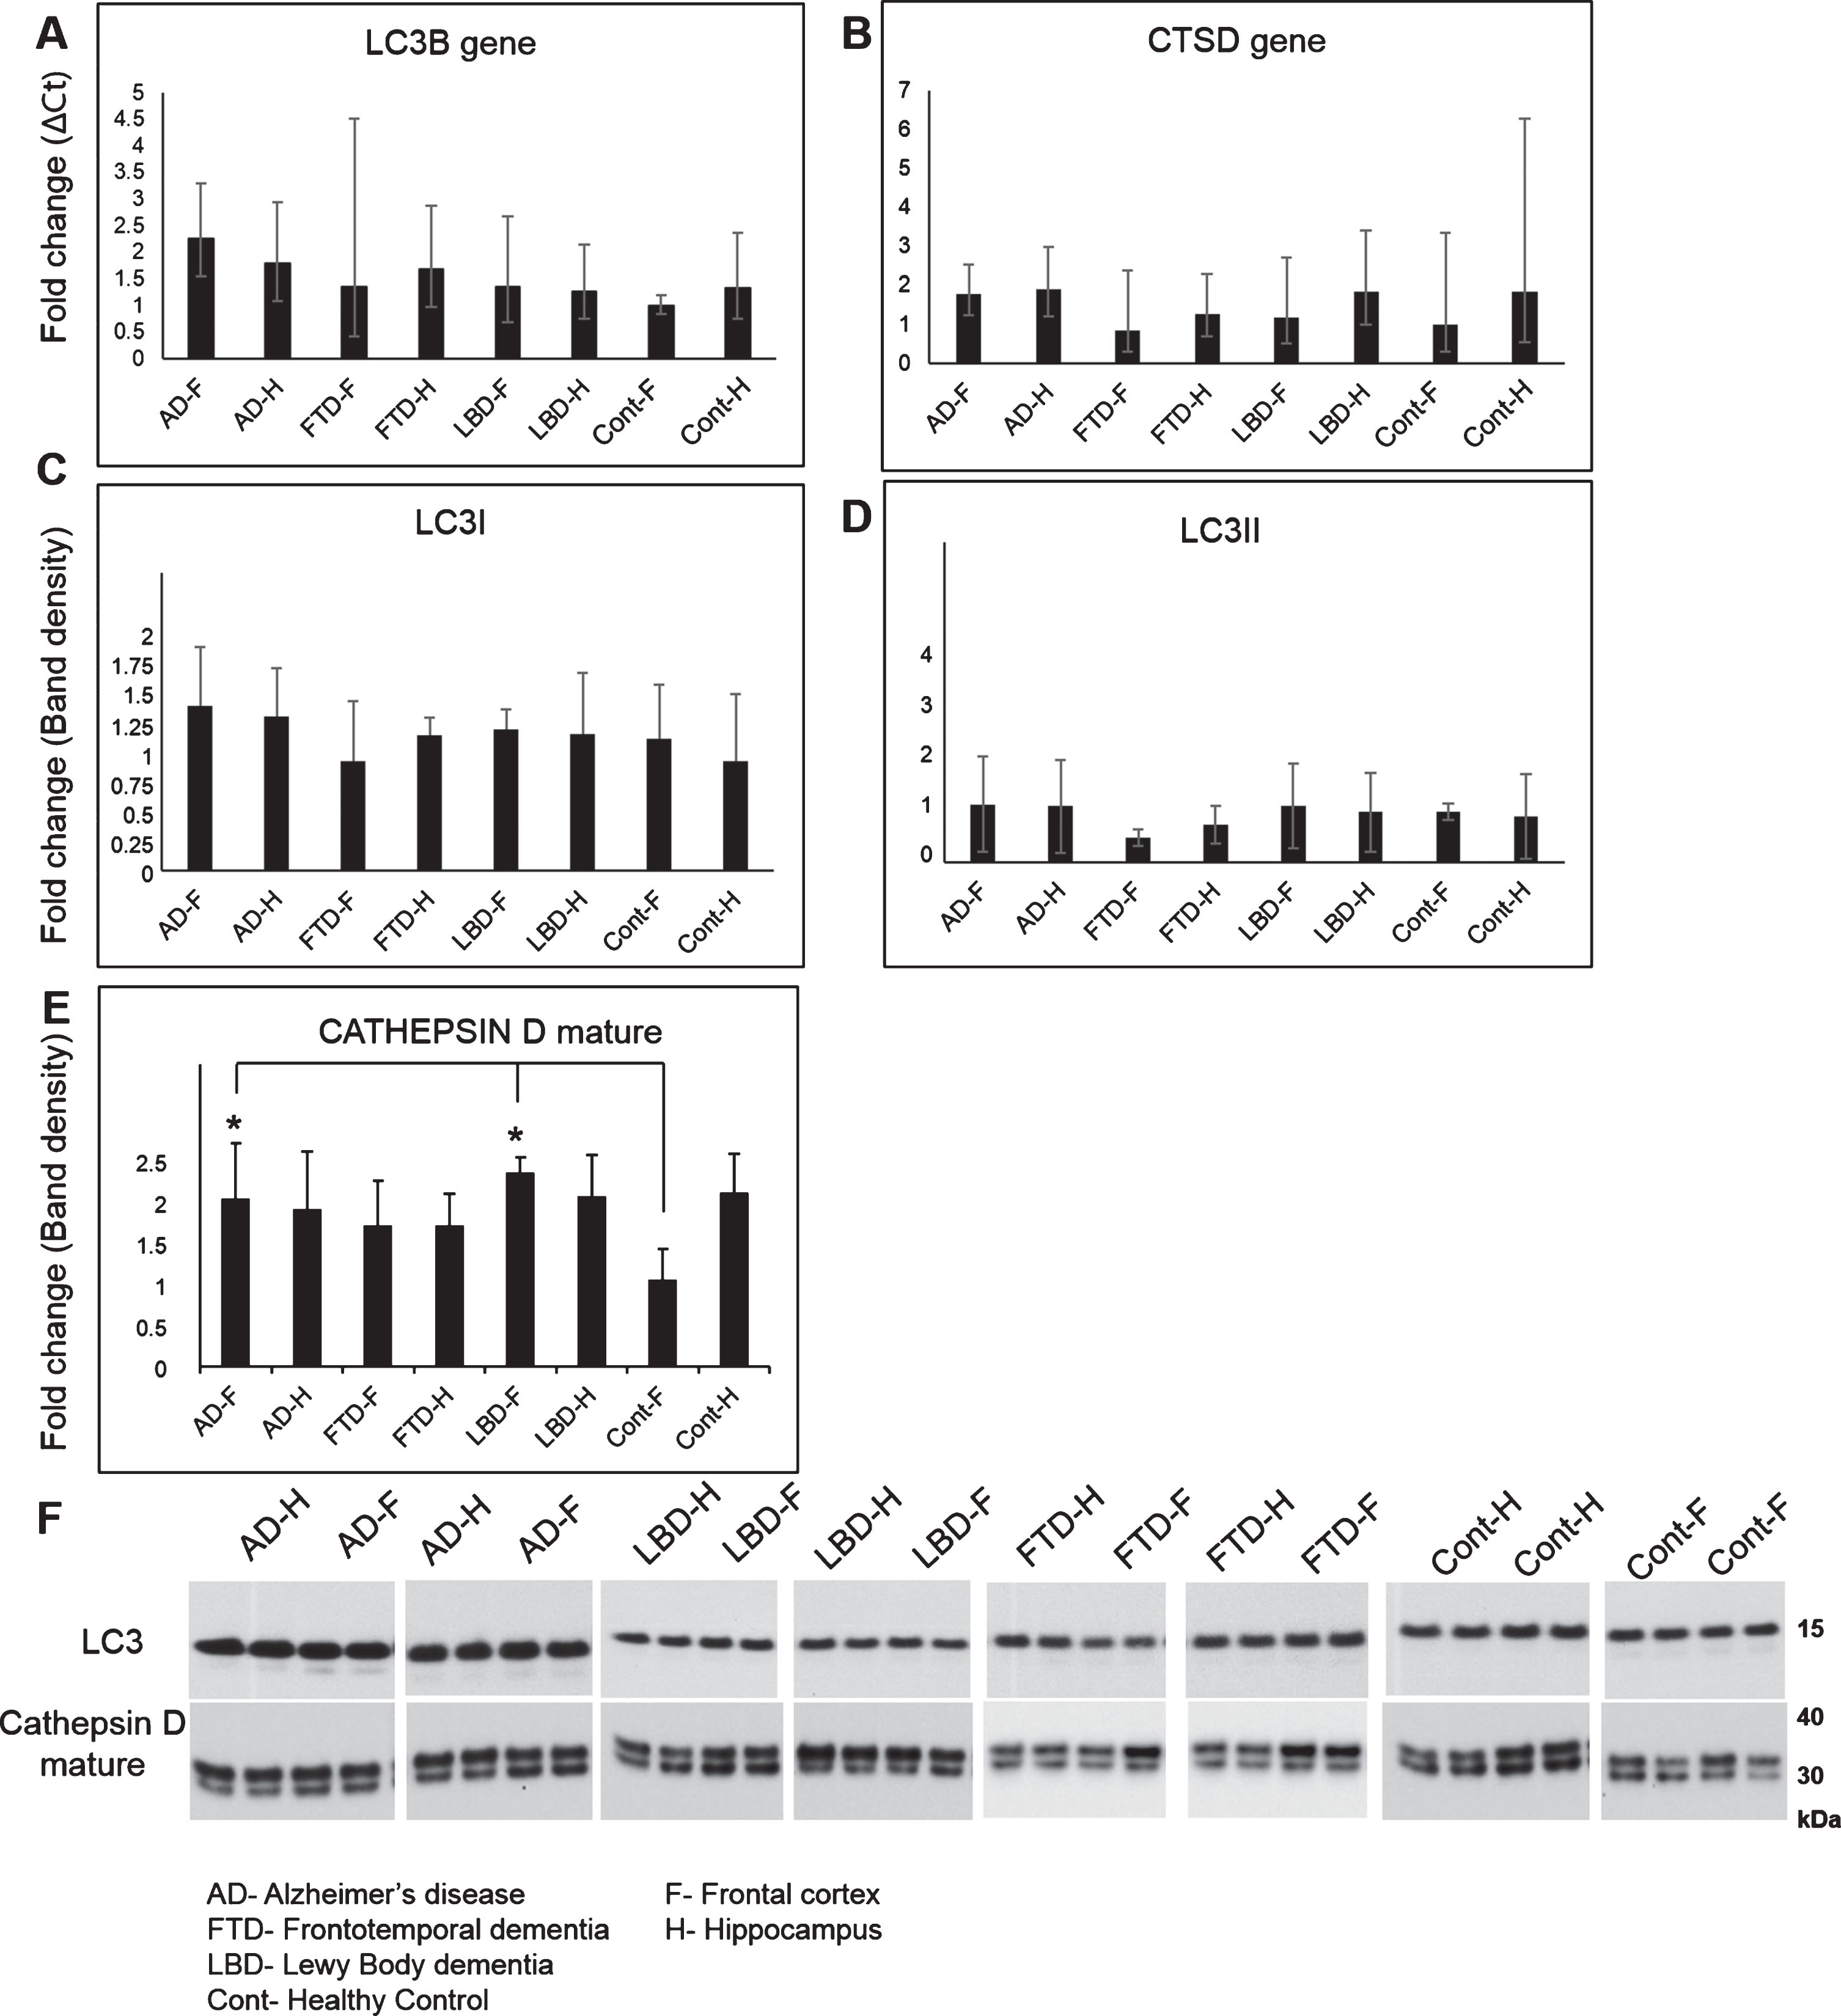
Fig.2
Gene and protein expression of autophagy regulators PRKAG2, TIPRL, and Aβ in AD, FTD, LBD, and control brains. Gene expression of autophagy regulators PRKAG2 (Hs00211903_m1), TIPRL (Hs00295580_m1), and endogenous control GAPDH (Hs03929097_g1) was conducted on cDNA synthesized from homogenates of frontal cortex (F) and hippocampus (H) regions of postmortem brain tissues from AD, LBD, FTD, and healthy controls (Cont) using Taqman assays on the QuantStudio 12K system. Fold change in gene transcripts of PRKAG2 (A) and TIPRL (B) was measured using comparative Ct method with GAPDH as endogenous control and Cont-F as the reference biological group. A 3-fold increase in PRKAG2 transcripts was observed in AD-F as compared to FTD-F, LBD-F and Cont-F (Mean±SD, *p<0.05). No significant changes were observed in the expression of TIPRL between the different groups. Protein levels of PRKAG2 (C), TIPRL (D), Aβ (E), and GAPDH (F) was also measured using western blotting analysis of the brain homogenates. A representative image of the western blot is shown here (G). No significant change in levels of PRKAG2 (60 and 75 kDa isoforms) and TIPRL (32 kDa) were observed between the different groups. Aβ (4 kDa) was significantly higher in AD-F and LBD-F as compared to Cont-F (Mean±SD, *p < 0.05).
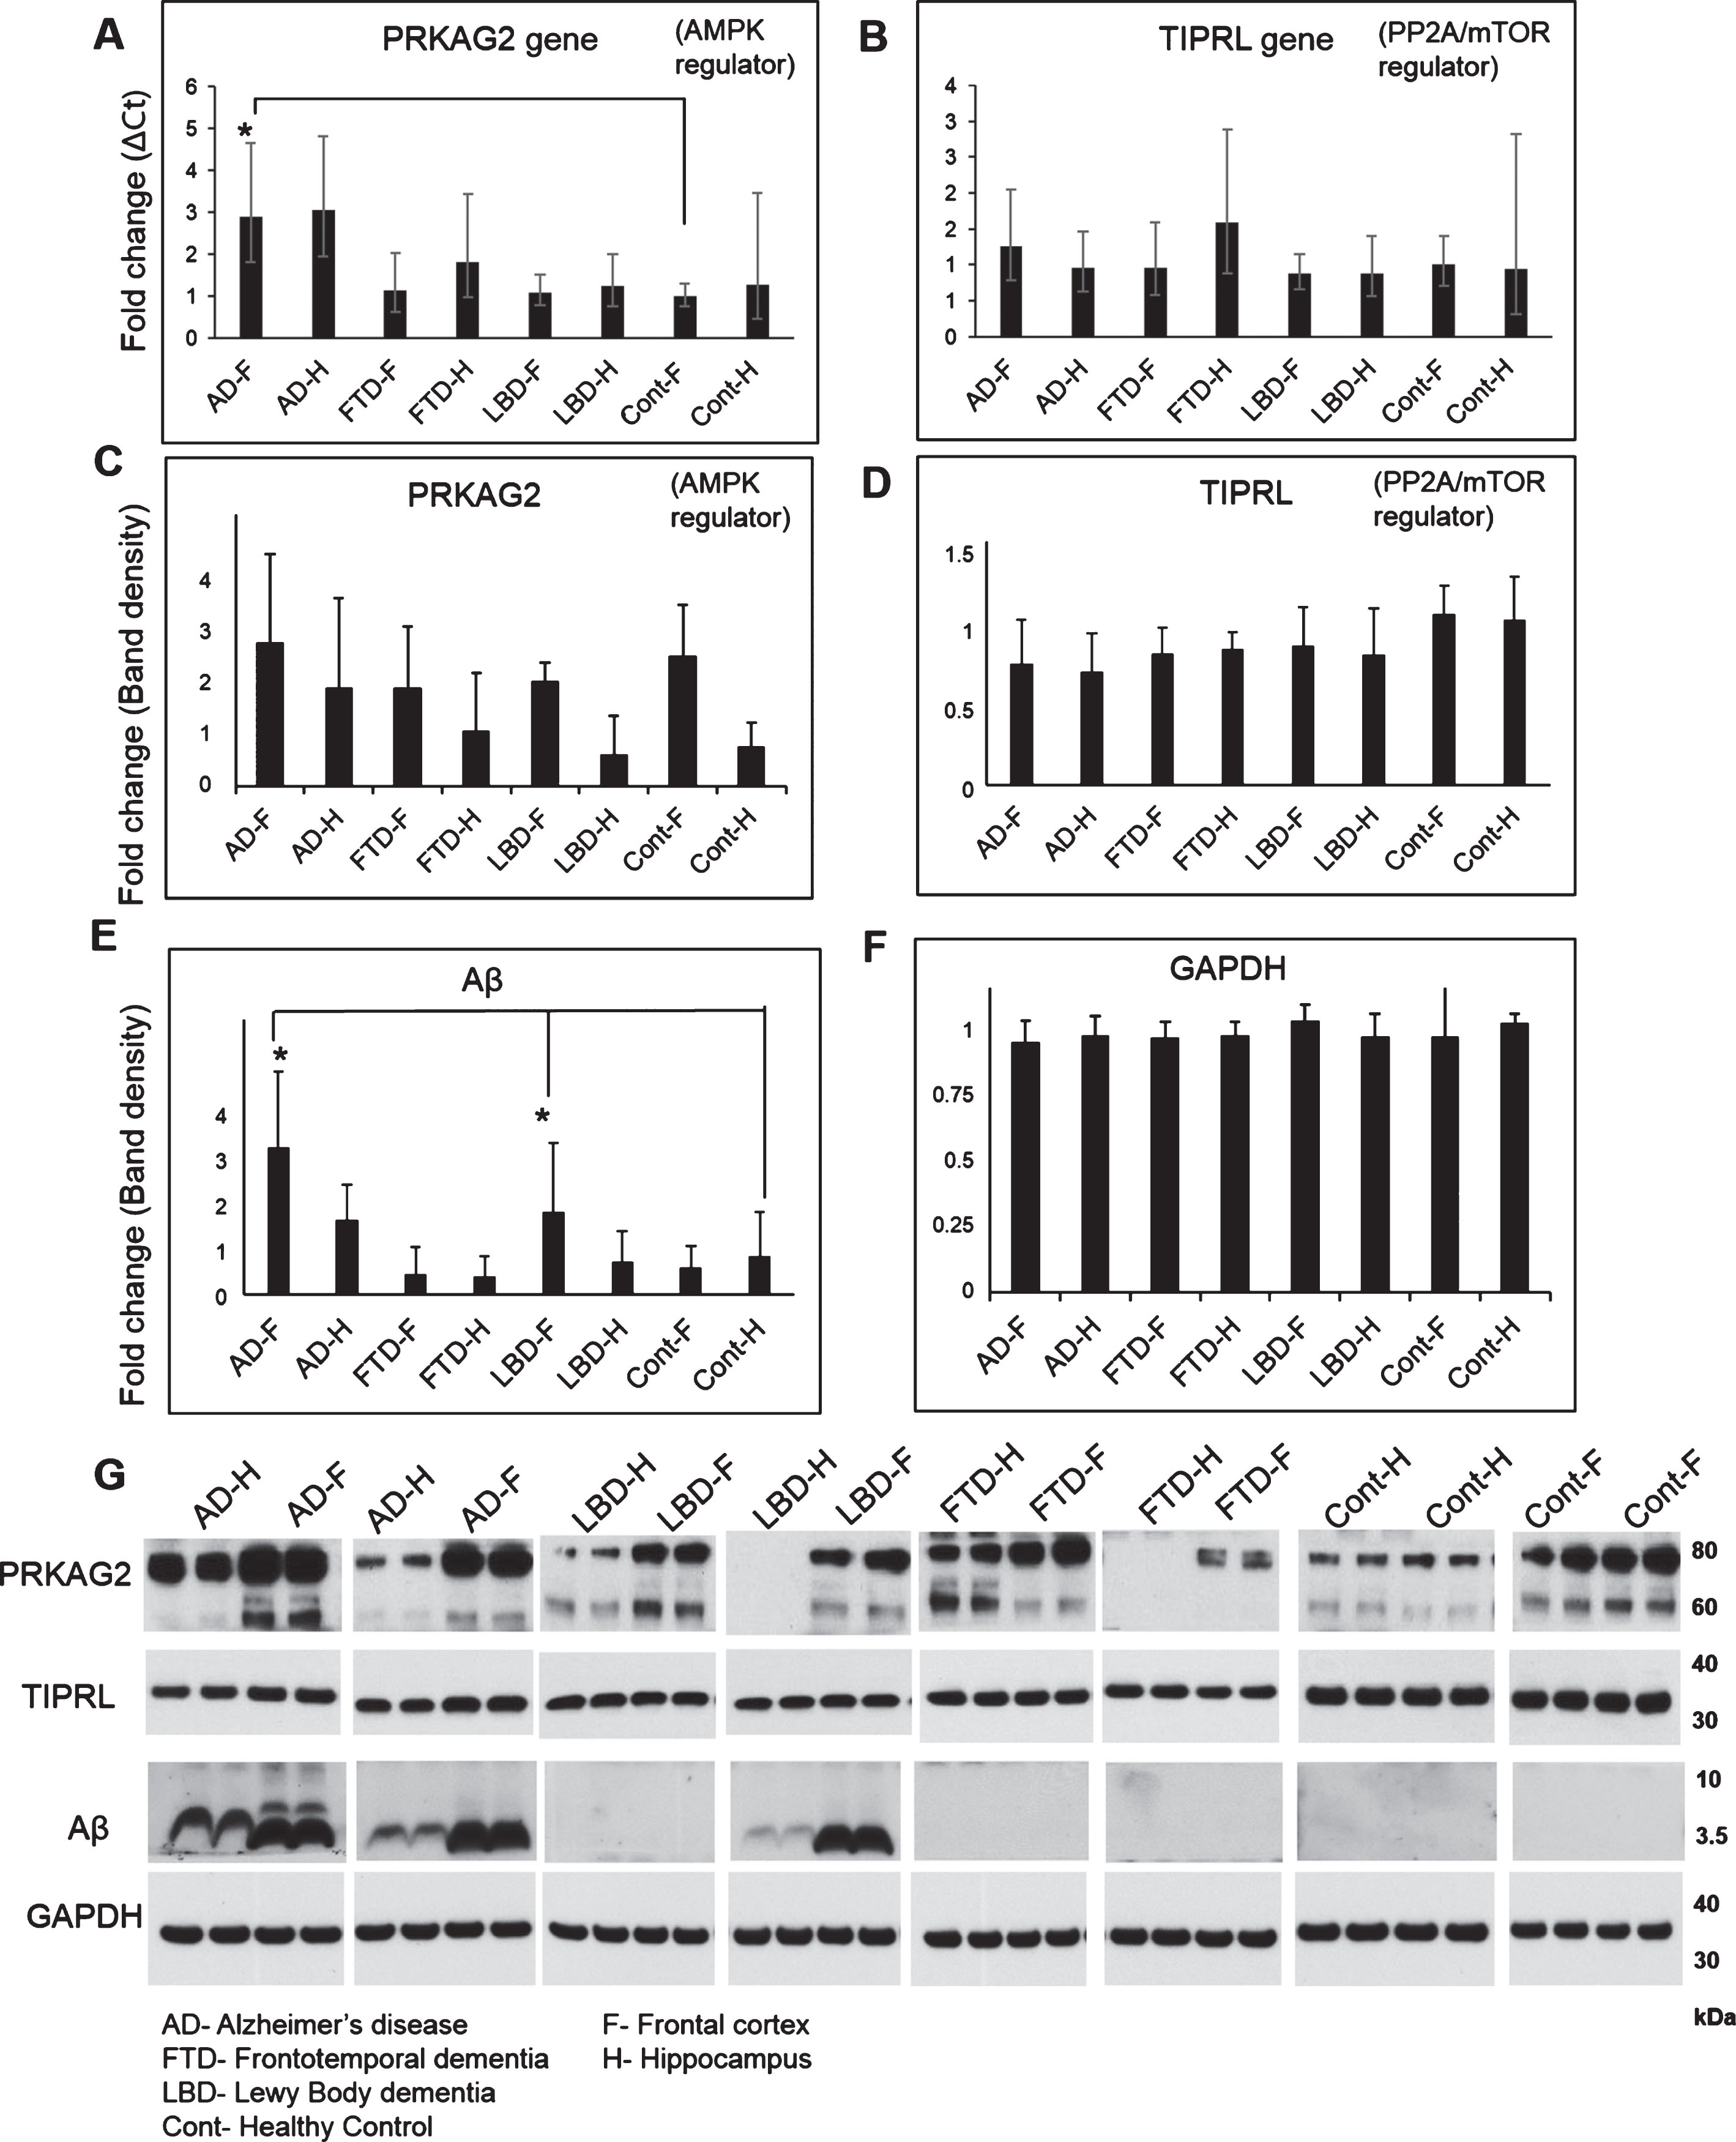
Fig.3
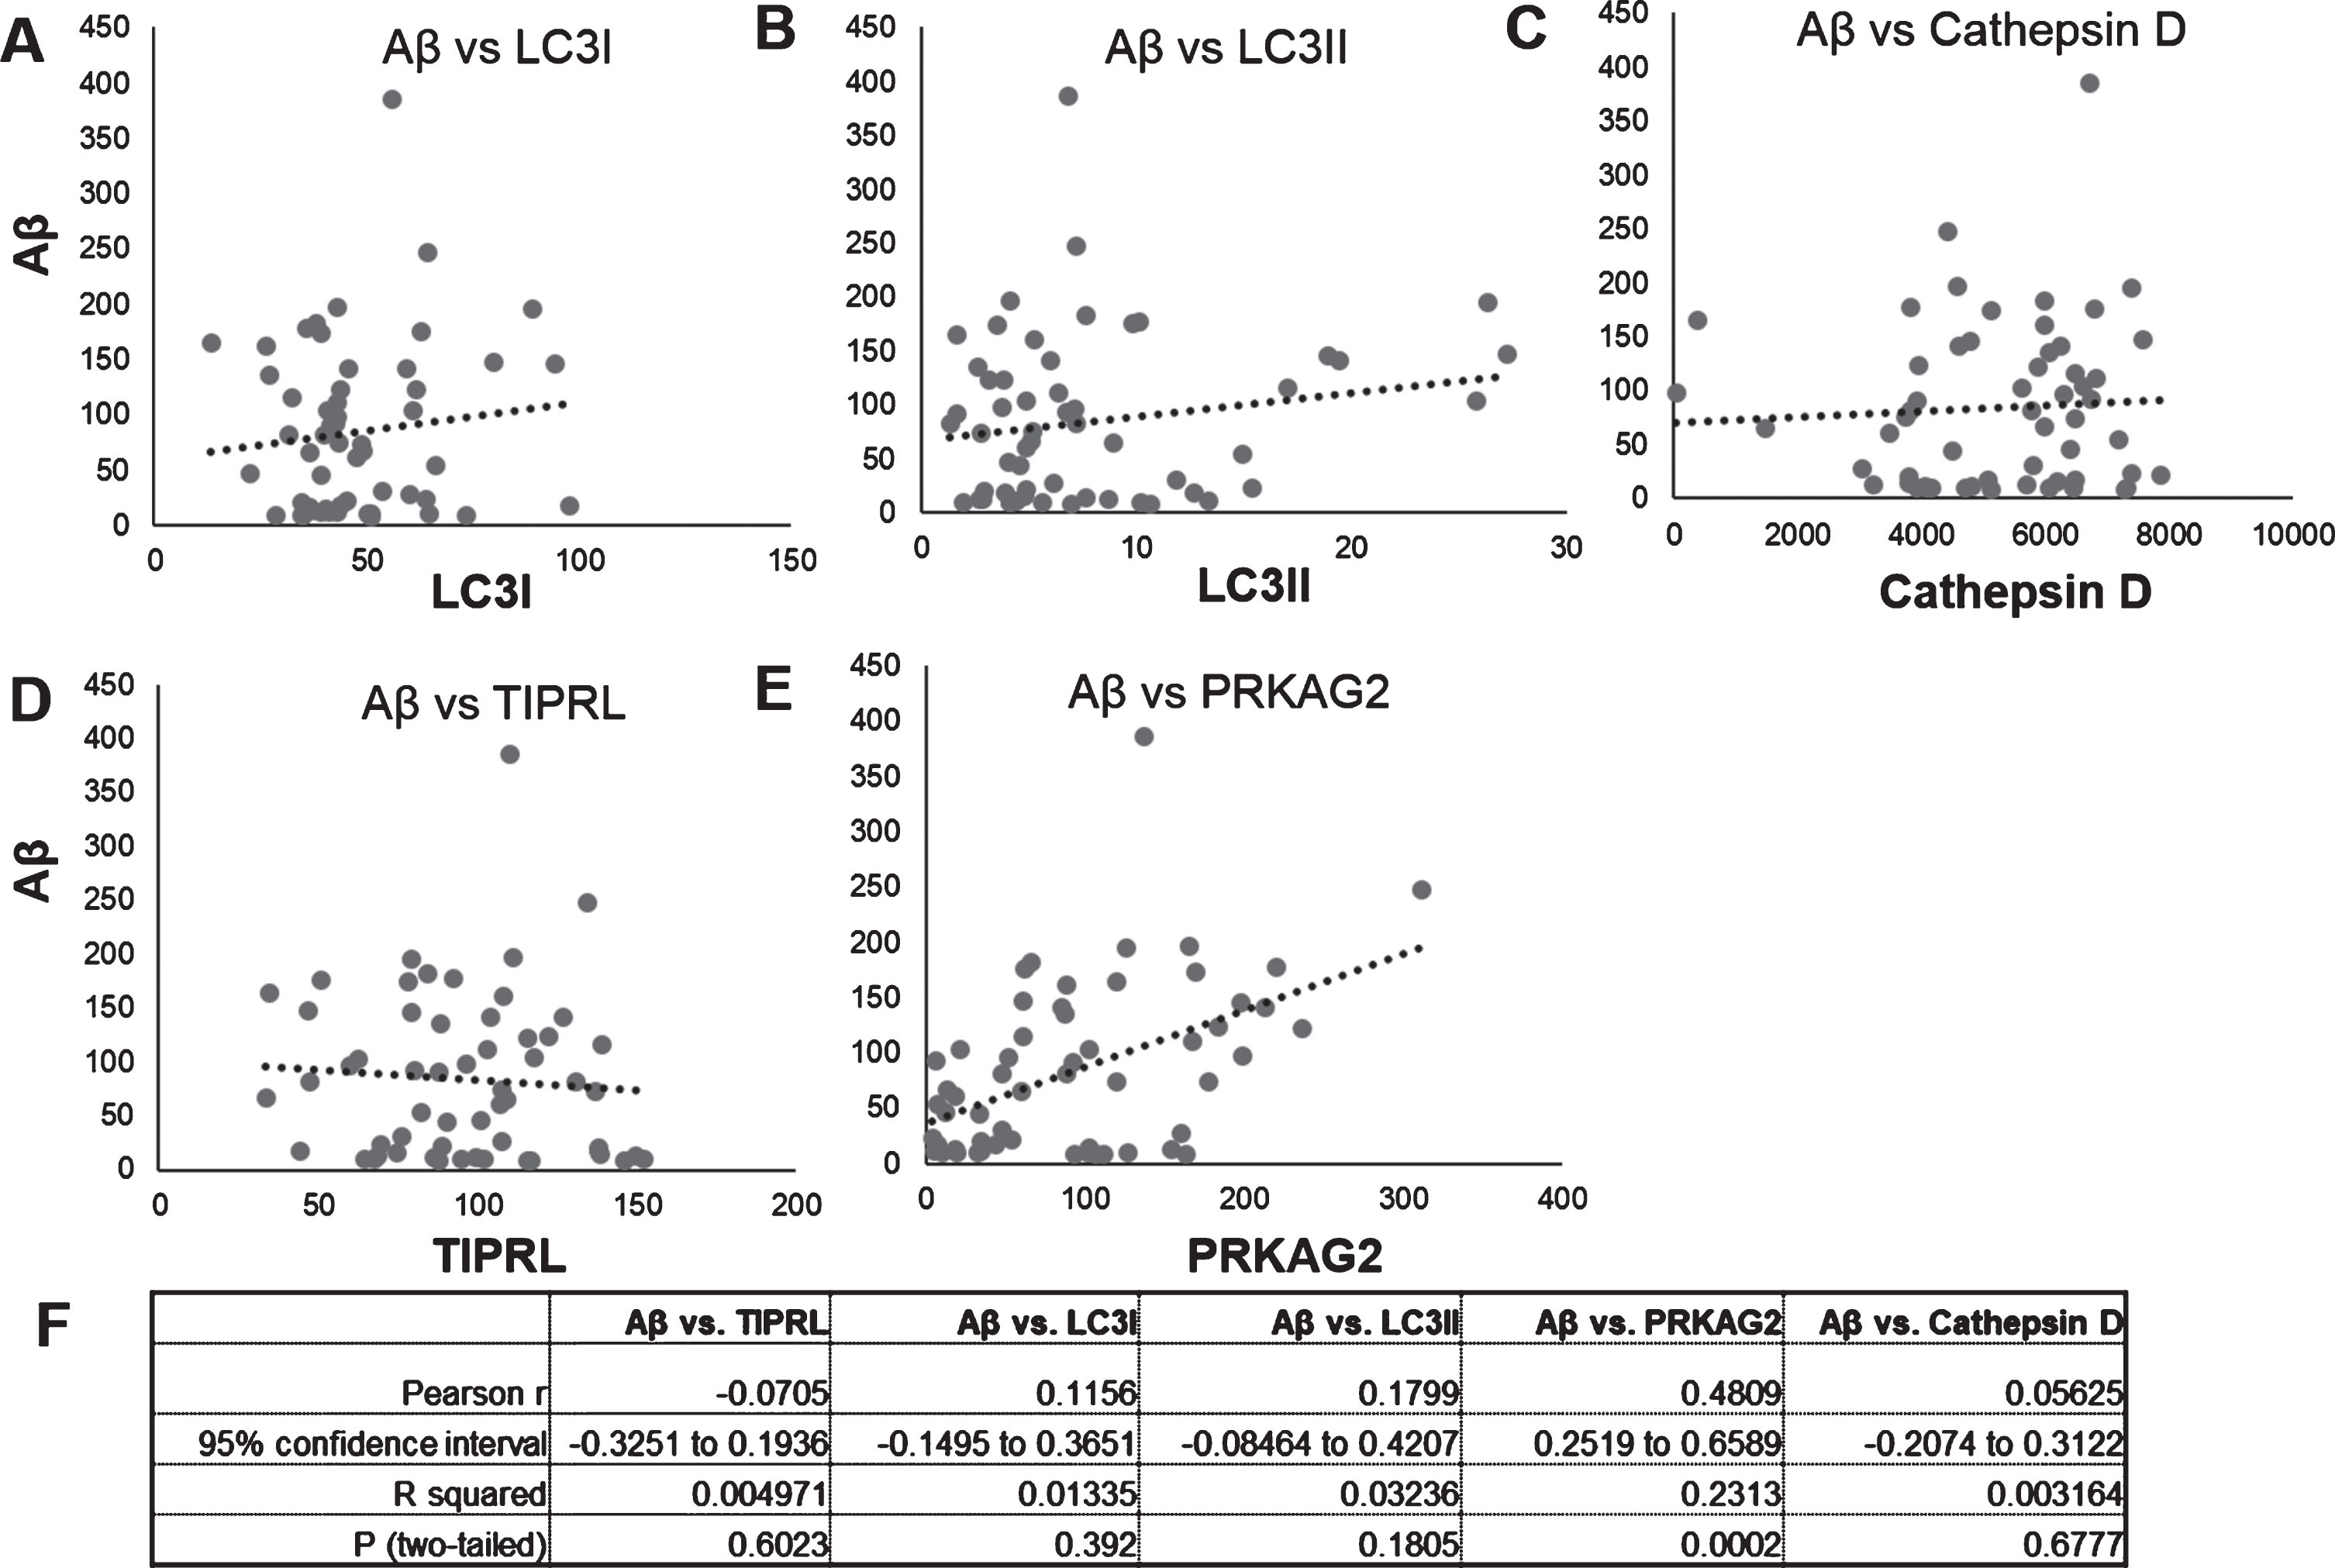
Correlation of Aβ and autophagy proteins LC3, Cathepsin D, PRKAG2, and TIPRL mRNA and protein levels. Correlation of Aβ protein levels (Fig. 2) to protein levels of LC3B isoforms, LC3I (Fig. 2C), LC3II (Fig. 2D), mature Cathepsin D (Fig. 2E), PRKAG2 (Fig. 3C), and TIPRL (Fig. 3D) was done using Pearsons correlation analysis. Aβ levels positively correlated to PRKAG2 levels (r = 0.4809, p < 0005).
Next we assessed gene and protein expression of autophagosome marker LC3B and lysosomal hydrolase Cathepsin D in postmortem brain tissues. Fold change in gene transcription was measured using comparative Ct method with GAPDH as endogenous control and Cont-F as the reference biological group. No significant changes were observed in the expression of LC3B and Cathepsin D between the different groups. Also, no significant change in the protein levels of LC3BI (16 kDa) and LC3BII (14 kDa) was observed between the different groups. However, levels of mature Cathepsin D (30 kDa) was increased in AD-F and LBD-F regions as compared to Cont-F (*p < 0.05). We observed increased levels of mature cathepsin D protein in Cont-H, as compared to Cont-F; however, this was not significant. Overall, our findings above were similar to previous studies of postmortem AD brains [1] showing Aβ accumulation associated with increased Cathepsin D, indicative of elevated lysosomal activity in AD, particularly in the frontal cortex region.
We next assessed gene and protein expression of autophagy regulators PRKAG2 and TIPRL (Fig. 2). No significant changes were observed in the gene or protein expression of TIPRL between different groups. A small decrease in TIPRL protein was observed in AD-F and AD-H compared to healthy control, but was not significant. Notably, a 3-fold increase in PRKAG2 gene expression was observed in AD-F as compared to FTD-F, LBD-F, and Cont-F (*p < 0.05). Despite a marked upregulation of PRKAG2 gene expression in AD-F, no significant change in levels of PRKAG2 protein (60 and 75 kDa isoforms) were observed between different groups. We observed increased expression of PRKAG2 protein in frontal cortex compared to hippocampus in LBD, FTD, and healthy controls; however, this was not significant. Overall, these findings showing elevated PRKAG2 gene expression combined with increased mature Cathepsin D protein is in agreement with previous studies showing increased autophagy induction in AD brain.
PRKAG2 protein levels positively correlate with increased Aβ accumulation in brain
Our findings above show increased lysosomal activity and expression of autophagy regulator PRKAG2 in the AD brain. To determine if Aβ accumulation is related to changes in PRKAG2 and autophagy-lysosome pathway in the brain, we performed a Pearson correlation analysis of Aβ levels to levels of PRKAG2, TIPRL and autophagy markers LC3B and Cathepsin D. No significant correlation was observed between Aβ and LC3B, Cathepsin D or TIPRL. However, a significant positive correlation was observed between Aβ and PRKAG2 (r = 0.4809, p = 0.0002). The variability observed in the correlation is possibly due to the significantly higher levels of Aβ in AD and LBD brains as compared to FTD and control brains, as shown in Fig. 2. Although PRKAG2 protein was not significantly increased in AD, we observed that increased Aβ accumulation was associated with increased PRKAG2 protein expression. PRKAG2 is a regulator of stress-induced autophagy and overall the data suggests that increased PRKAG2 gene expression maybe a response to increased Aβ accumulation and proteotoxic stress in the brain. Although there was increased transcript levels of PRKAG2 in AD, we did not observe its translation into protein. Growing evidence suggest that the spatial and temporal variations of mRNAs, as well as the local availability of resources for protein biosynthesis, strongly influence the relationship between protein levels and their coding transcripts and that transcript levels are not sufficient to predict protein levels in many scenarios, especially during cell dysfunction and disease [14]. It is therefore possible that the lack of translation of increased PRKAG2 gene expression to protein levels in AD postmortem brains is possibly due to impaired protein synthesis as a result of brain atrophy and neurodegeneration.
DISCUSSION
Autophagy is the primary catabolic pathway activated by nutrient signaling kinases AMPK and mTORC1 in response to cellular stressors including nutrient and energy starvation. Increased induction of autophagy is relatively frequent in neurodegenerative diseases, but whether this greater induction rate signifies disease development is yet to be established. Our findings showing increased gene expression of PRKAG2, a positive regulator of autophagy suggest that it may be a contributing factor to autophagy induction in AD. The autophagy pathway is impaired at different steps in neurodegenerative diseases and mostly associated with increased autophagy initiation and reduced autophagosome degradation [1, 15]. Our findings showing increased PRKAG2 gene expression in AD combined with a positive association with Aβ levels suggest that PRKAG2 dysfunction is specific to AD and related to Aβ accumulation, a pathological hallmark of AD.
Mutations in PRKAG2 are associated with heart muscle disease [16, 17] and single nucleotide polymorphisms (SNPs) in PRKAG2 have shown to been associated with cognitive impairment and metabolic dysfunction in old age [18]. Whether these PRKAG2 mutations and SNPs alter PRKAG2 expression in the brain leading to autophagy dysfunction and accumulation of protein aggregates like Aβ is unknown. Transcription factor EB (TFEB) is the master regulator of lysosome biogenesis and autophagy, including PRKAG2 transcription [19]. The role of TFEB in AD pathogenesis remains contradictory. Increased TFEB expression and its targets have been observed in AD patient derived fibroblasts [20] and in the hippocampus of AD subjects [21]. Similar upregulation of TFEB and its targets have been reported in transgenic AD mice [22, 23]. These findings strongly support TFEB gain-of-function in AD may contribute to increased PRKAG2 expression observed in our findings (Fig. 2). However, in contrast, AD patient lymphocytes and monocytes has markedly decreased TFEB expression [24]. In agreement, subcellular fractionation of AD patient brain samples documented a selective loss of nuclear TFEB [25]. These opposing results demonstrate the need for a thorough dissection of TFEB dysfunction in AD and its potential role in regulating PRKAG2 activation in AD brain.
Our findings suggest that increased PRKAG2 gene expression could be a response to increased Aβ accumulation and proteotoxic stress in the brain. Increased autophagy induction has been previously observed in experimental models in which a disease-related protein such as α-synuclein or SOD1 is overexpressed [26, 27]. It is possible that autophagy induction in response to mutant or damaged proteins and aggregates could be compensatory and neuroprotective at early stages of disease, but may be counterproductive if lysosomal clearance becomes compromised. Impaired lysosomal clearance maybe induced by protein aggregates like Aβ which in turn could also secondarily elevate autophagy induction, promoting further damage to the neuronal processes. The molecular mechanisms that link defective autophagy and Aβ accumulation in AD are unclear and our findings suggest that the combination of increased autophagy induction via PRKAG2 and defective clearance of autophagosomes can create conditions favorable for Aβ accumulation in AD. Further investigation of PRKAG2 gene and variants in modulating neuronal autophagy and Aβ accumulation in disease models and patients will be critical to establish its pathogenic role in AD.
DISCLOSURE STATEMENT
Authors’ disclosures available online (https://www.j-alz.com/manuscript-disclosures/19-0948r2).
SUPPLEMENTARY MATERIAL
[1] The supplementary material is available in the electronic version of this article: https://dx.doi.org/10.3233/JAD-190948.
REFERENCES
[1] | Nixon RA , Wegiel J , Kumar A , Yu WH , Peterhoff C , Cataldo A , Cuervo AM ((2005) ) Extensive involvement of autophagy in Alzheimer disease: an immuno-electron microscopy study. J Neuropathol Exp Neurol 64: , 113–122. |
[2] | Ginsberg SD , Hemby SE , Lee VM , Eberwine JH , Trojanowski JQ ((2000) ) Expression profile of transcripts in Alzheimer’s disease tangle-bearing CA1 neurons. Ann Neurol 48: , 77–87. |
[3] | Crews L , Spencer B , Desplats P , Patrick C , Paulino A , Rockenstein E , Hansen L , Adame A , Galasko D , Masliah E ((2010) ) Selective molecular alterations in the autophagy pathway in patients with Lewy body disease and in models of alpha-synucleinopathy. PLoS One 5: , e9313. |
[4] | Deng Z , Sheehan P , Chen S , Yue Z ((2017) ) Is amyotrophic lateral sclerosis/frontotemporal dementia an autophagy disease? Mol Neurodegener 12: , 90. |
[5] | Russell RC , Yuan HX , Guan KL ((2014) ) Autophagy regulation by nutrient signaling. Cell Res 24: , 42–57. |
[6] | Godoy JA , Rios JA , Zolezzi JM , Braidy N , Inestrosa NC ((2014) ) Signaling pathway cross talk in Alzheimer’s disease. Cell Commun Signal 12: , 23. |
[7] | Hardie DG , Hawley SA , Scott JW ((2006) ) AMP-activated protein kinase–development of the energy sensor concept. J Physiol 574: , 7–15. |
[8] | Mitchelhill KI , Stapleton D , Gao G , House C , Michell B , Katsis F , Witters LA , Kemp BE ((1994) ) Mammalian AMP-activated protein kinase shares structural and functional homology with the catalytic domain of yeast Snf1 protein kinase. J Biol Chem 269: , 2361–2364. |
[9] | Lippai M , Csikos G , Maroy P , Lukacsovich T , Juhasz G , Sass M ((2008) ) SNF4Agamma, the Drosophila AMPK gamma subunit is required for regulation of developmental and stress-induced autophagy. Autophagy 4: , 476–486. |
[10] | Rosales KR , Reid MA , Yang Y , Tran TQ , Wang WI , Lowman X , Pan M , Kong M ((2015) ) TIPRL inhibits protein phosphatase 4 activity and promotes H2AX phosphorylation in the DNA damage response. PLoS One 10: , e0145938. |
[11] | Nakashima A , Tanimura-Ito K , Oshiro N , Eguchi S , Miyamoto T , Momonami A , Kamada S , Yonezawa K , Kikkawa U ((2013) ) A positive role of mammalian Tip41-like protein, TIPRL, in the amino-acid dependent mTORC1-signaling pathway through interaction with PP2A. FEBS Lett 587: , 2924–2929. |
[12] | Spires-Jones TL , Attems J , Thal DR ((2017) ) Interactions of pathological proteins in neurodegenerative diseases. Acta Neuropathol 134: , 187–205. |
[13] | Jack CR Jr. , Wiste HJ , Knopman DS , Vemuri P , Mielke MM , Weigand SD , Senjem ML , Gunter JL , Lowe V , Gregg BE , Pankratz VS , Petersen RC ((2014) ) Rates of beta-amyloid accumulation are independent of hippocampal neurodegeneration. Neurology 82: , 1605–1612. |
[14] | Liu Y , Beyer A , Aebersold R ((2016) ) On the dependency of cellular protein levels on mRNA abundance. Cell 165: , 535–550. |
[15] | Mputhia Z , Hone E , Tripathi T , Sargeant T , Martins R , Bharadwaj P ((2019) ) Autophagy modulation as a treatment of amyloid diseases. Molecules 24: , E3372. |
[16] | Blair E , Redwood C , Ashrafian H , Oliveira M , Broxholme J , Kerr B , Salmon A , Ostman-Smith I , Watkins H ((2001) ) Mutations in the gamma(2) subunit of AMP-activated protein kinase cause familial hypertrophic cardiomyopathy: evidence for the central role of energy compromise in disease pathogenesis. Hum Mol Genet 10: , 1215–1220. |
[17] | Folmes KD , Chan AY , Koonen DP , Pulinilkunnil TC , Baczko I , Hunter BE , Thorn S , Allard MF , Roberts R , Gollob MH , Light PE , Dyck JR ((2009) ) Distinct early signaling events resulting from the expression of the PRKAG2 R302Q mutant of AMPK contribute to increased myocardial glycogen. Circ Cardiovasc Genet 2: , 457–466. |
[18] | Kim E , Lee SH , Lee KS , Cheong HK , Namkoong K , Hong CH , Oh BH ((2012) ) AMPK gamma2 subunit gene PRKAG2 polymorphism associated with cognitive impairment as well as diabetes in old age. Psychoneuroendocrinology 37: , 358–365. |
[19] | Palmieri M , Impey S , Kang H , di Ronza A , Pelz C , Sardiello M , Ballabio A ((2011) ) Characterization of the CLEAR network reveals an integrated control of cellular clearance pathways. Hum Mol Genet 20: , 3852–3866. |
[20] | Coffey EE , Beckel JM , Laties AM , Mitchell CH ((2014) ) Lysosomal alkalization and dysfunction in human fibroblasts with the Alzheimer’s disease-linked presenilin 1 A246E mutation can be reversed with cAMP. Neuroscience 263: , 111–124. |
[21] | Bordi M , Berg MJ , Mohan PS , Peterhoff CM , Alldred MJ , Che S , Ginsberg SD , Nixon RA ((2016) ) Autophagy flux in CA1 neurons of Alzheimer hippocampus: Increased induction overburdens failing lysosomes to propel neuritic dystrophy. Autophagy 12: , 2467–2483. |
[22] | Landel V , Baranger K , Virard I , Loriod B , Khrestchatisky M , Rivera S , Benech P , Feron F ((2014) ) Temporal gene profiling of the 5XFAD transgenic mouse model highlights the importance of microglial activation in Alzheimer’s disease. Mol Neurodegener 9: , 33. |
[23] | Zhang YD , Zhao JJ ((2015) ) TFEB participates in the Abeta-induced pathogenesis of Alzheimer’s disease by regulating the autophagy-lysosome pathway. DNA Cell Biol 34: , 661–668. |
[24] | Tiribuzi R , Crispoltoni L , Porcellati S , Di Lullo M , Florenzano F , Pirro M , Bagaglia F , Kawarai T , Zampolini M , Orlacchio A , Orlacchio A ((2014) ) miR128 up-regulation correlates with impaired amyloid beta(1-42) degradation in monocytes from patients with sporadic Alzheimer’s disease. Neurobiol Aging 35: , 345–356. |
[25] | Wang H , Wang R , Carrera I , Xu S , Lakshmana MK ((2016) ) TFEB overexpression in the P301S model of tauopathy mitigates increased PHF1 levels and lipofuscin puncta and rescues memory deficits. eNeuro 3: , ENEURO.0042-16.2016. |
[26] | Xilouri M , Vogiatzi T , Vekrellis K , Park D , Stefanis L ((2009) ) Abberant alpha-synuclein confers toxicity to neurons in part through inhibition of chaperone-mediated autophagy. PLoS One 4: , e5515. |
[27] | Morimoto N , Nagai M , Ohta Y , Miyazaki K , Kurata T , Morimoto M , Murakami T , Takehisa Y , Ikeda Y , Kamiya T , Abe K ((2007) ) Increased autophagy in transgenic mice with a G93A mutant SOD1 gene. Brain Res 1167: , 112–117. |


