
Transplantation of Mesenchymal Stem Cells Improves Amyloid-β Pathology by Modifying Microglial Function and Suppressing Oxidative Stress
Abstract
Mesenchymal stem cells (MSC) are increasingly being studied as a source of cell therapy for neurodegenerative diseases, and several groups have reported their beneficial effects on Alzheimer’s disease (AD). In this study using AD model mice (APdE9), we found that transplantation of MSC via the tail vein improved spatial memory in the Morris water maze test. Using electron paramagnetic resonance imaging to evaluate the in vivo redox state of the brain, we found that MSC transplantation suppressed oxidative stress in AD model mice. To elucidate how MSC treatment ameliorates oxidative stress, we focused on amyloid-β (Aβ) pathology and microglial function. MSC transplantation reduced Aβ deposition in the cortex and hippocampus. Transplantation of MSC also decreased Iba1-positive area in the cortex and reduced activated ameboid shaped microglia. On the other hand, MSC transplantation accelerated accumulation of microglia around Aβ deposits and prompted microglial Aβ uptake and clearance as shown by higher frequency of Aβ-containing microglia. MSC transplantation also increased CD14-positive microglia in vivo, which play a critical role in Aβ uptake. To confirm the effects of MSC on microglia, we co-cultured the mouse microglial cell line MG6 with MSC. Co-culture with MSC enhanced Aβ uptake by MG6 cells accompanied by upregulation of CD14 expression. Additionally, co-culture of MG6 cells with MSC induced microglial phenotype switching from M1 to M2 and suppressed production of proinflammatory cytokines. These data indicate that MSC treatment has the potential to ameliorate oxidative stress through modification of microglial functions, thereby improving Aβ pathology in AD model mice.
INTRODUCTION
Alzheimer’s disease (AD) is a common neurodegenerative disease which progressively impairs memory and cognition. Histopathologically, AD is characterized by aggregation of amyloid-β (Aβ) proteins into extracellular senile plaques, intracellular neurofibrillary tangles, and synaptic and neuronal loss [1, 2]. Increased Aβ deposition is the key pathogenic factor of AD and the main cause of neuronal loss in the amyloid cascade hypothesis [3]. Recent evidence indicates that the mechanism of Aβ neurotoxicity reflects the complex interaction of multifocal processes, suggesting the existence of multiple potential targets for AD treatment [4–9]. As one of the neurotoxic mechanisms of Aβ, the involvement of oxidative stress due to free radical production has been proposed [10].
Oxidative stress is known to induce the pathological progression of a variety of diseases. The nervous system is vulnerable to oxidative stress because it has high oxygen consumption rate and high levels of polyunsaturated fatty acids, and is not particularly enriched in antioxidant defense enzymes [11]. Aβ deposits may form high affinity complexes with metal ions such as copper and zinc and undergo redox cycling, generating hydroxyl radicals (•OH) [12, 13]. We previously measured in vivo changes of the redox status (the balance between antioxidants and oxidants) in the brain of AD model mice noninvasively by three-dimensional (3D) electron paramagnetic resonance (EPR) imaging, and demonstrated a significantly accelerated change in redox state in model mice showing increased Aβ deposition and glial activation [14]. We reported that proinflammatory cytokines such as TNFα increased in the microglial fraction of Aβ-stimulated AD mice brain [15], and that microglia internalized Aβ through the TLR4/CD14 complex as one of Aβ clearance pathways [16]. From these findings, we focused on microglial function in AD progression, and whether modification of microglial function prevents progression of AD through suppression of oxidative stress.
Mesenchymal stem cells (MSC) are originally somatic stem cells derived from mesodermal tissue. Since the potential of these cells to differentiate into neuron has been demonstrated [17, 18], MSC are increasingly attracting attention as a source of cell therapy for neurological diseases. MSC hold great promise as cell therapy for neurological diseases such as cerebral ischemia and Parkinson’s disease. We have reported that MSC expressed several neurotrophic factors and suppressed neuroinflammation in Parkinson’s disease model rats [19]. Other groups have shown beneficial effects of MSC in AD model mice [20–27]. However, the mechanisms of the MSC effects are not fully understood. In this study, we examined the effects of MSC on Aβ pathology in AD model mice, and also evaluated the effect of MSC treatment on the redox status using in vivo EPR imaging technique.
MATERIALS AND METHODS
Animal model
All animal experiments were conducted according to the Animal Guideline of Sapporo Medical University and approved by the Animal Care and Use Committee of Sapporo Medical University. Hemizygous APPswe/PS1dE9 (APdE9) founder mice expressing chimeric mouse/human amyloid precursor protein (APPswe) (mouse APP695 harboring a human Aβ domain and K594 N and M595 L mutations linked to Swedish familial AD pedigrees) and human presenilin 1 exon 9 deletion mutation (PS1dE9) were purchased from Jackson Laboratory, USA. All the mice used in this study were bred by mating male APdE9 mice with female C57BL6/J mice in the animal facilities at Sapporo Medical university. Male APdE9 mice and male wild-type (WT) littermates were used in this study. Mice were maintained in an accredited animal holding facility with controlled temperature (24±2°C), air pressure and lighting (12 h light-dark schedule), and were given access to food ad libitum.
Transplantation of MSC
Preparation of MSC culture was based on previous work in Honmou’s laboratory [28]. Bone marrow was obtained from femoral bones of 6-week-old Sprague-Dawley rats (Sankyo Labo Service Corporation Inc, Tokyo, Japan) or green fluorescent protein (GFP)-expressing rats [SD-Tg (CAG-EGFP)] (Japan SLC, Shizuoka, Japan). Bone marrow diluted in 10 ml of Dulbecco’s modified Eagle’s medium-high glucose (DMEM; Wako) supplemented with 10% heat inactivated fetal bovine serum (FBS; GE Healthcare Life Sciences, UT, USA), 100 U/ml penicillin and 0.1 mg/ml streptomycin (Life Technologies Corporation, CA, USA) was plated on 10 cm2 tissue culture dish, and incubated at 37°C in humidified atmosphere with 5% CO2. MSC were selected by plastic adhesion, and nonadherent cells were removed by replacing the medium 48 h after cell seeding. When cultures almost reached confluence after approximately one week, the adherent cells were detached with trypsin-EDTA solution (Life Technologies Corporation) and subcultured at 3×10⁴ cells/ml. In the present study, we used MSC after one passage for transplantation and in vitro assays.
MSC transplantation protocols consisted of three groups. APdE9 mice were randomized in two groups. In APdE9-MSC group, 3×10⁵ MSC in 200 μl of DMEM were injected into 7.5-month-old APdE9 mice via the tail vein. APdE9-sham group and WT group were injected with 200 μl of DMEM as controls. All mice were given subcutaneous injection of cyclosporine A (10 mg/kg; Novartis Pharma, Tokyo, Japan) every other day from the day before transplantation (Fig. 1a).
Fig.1
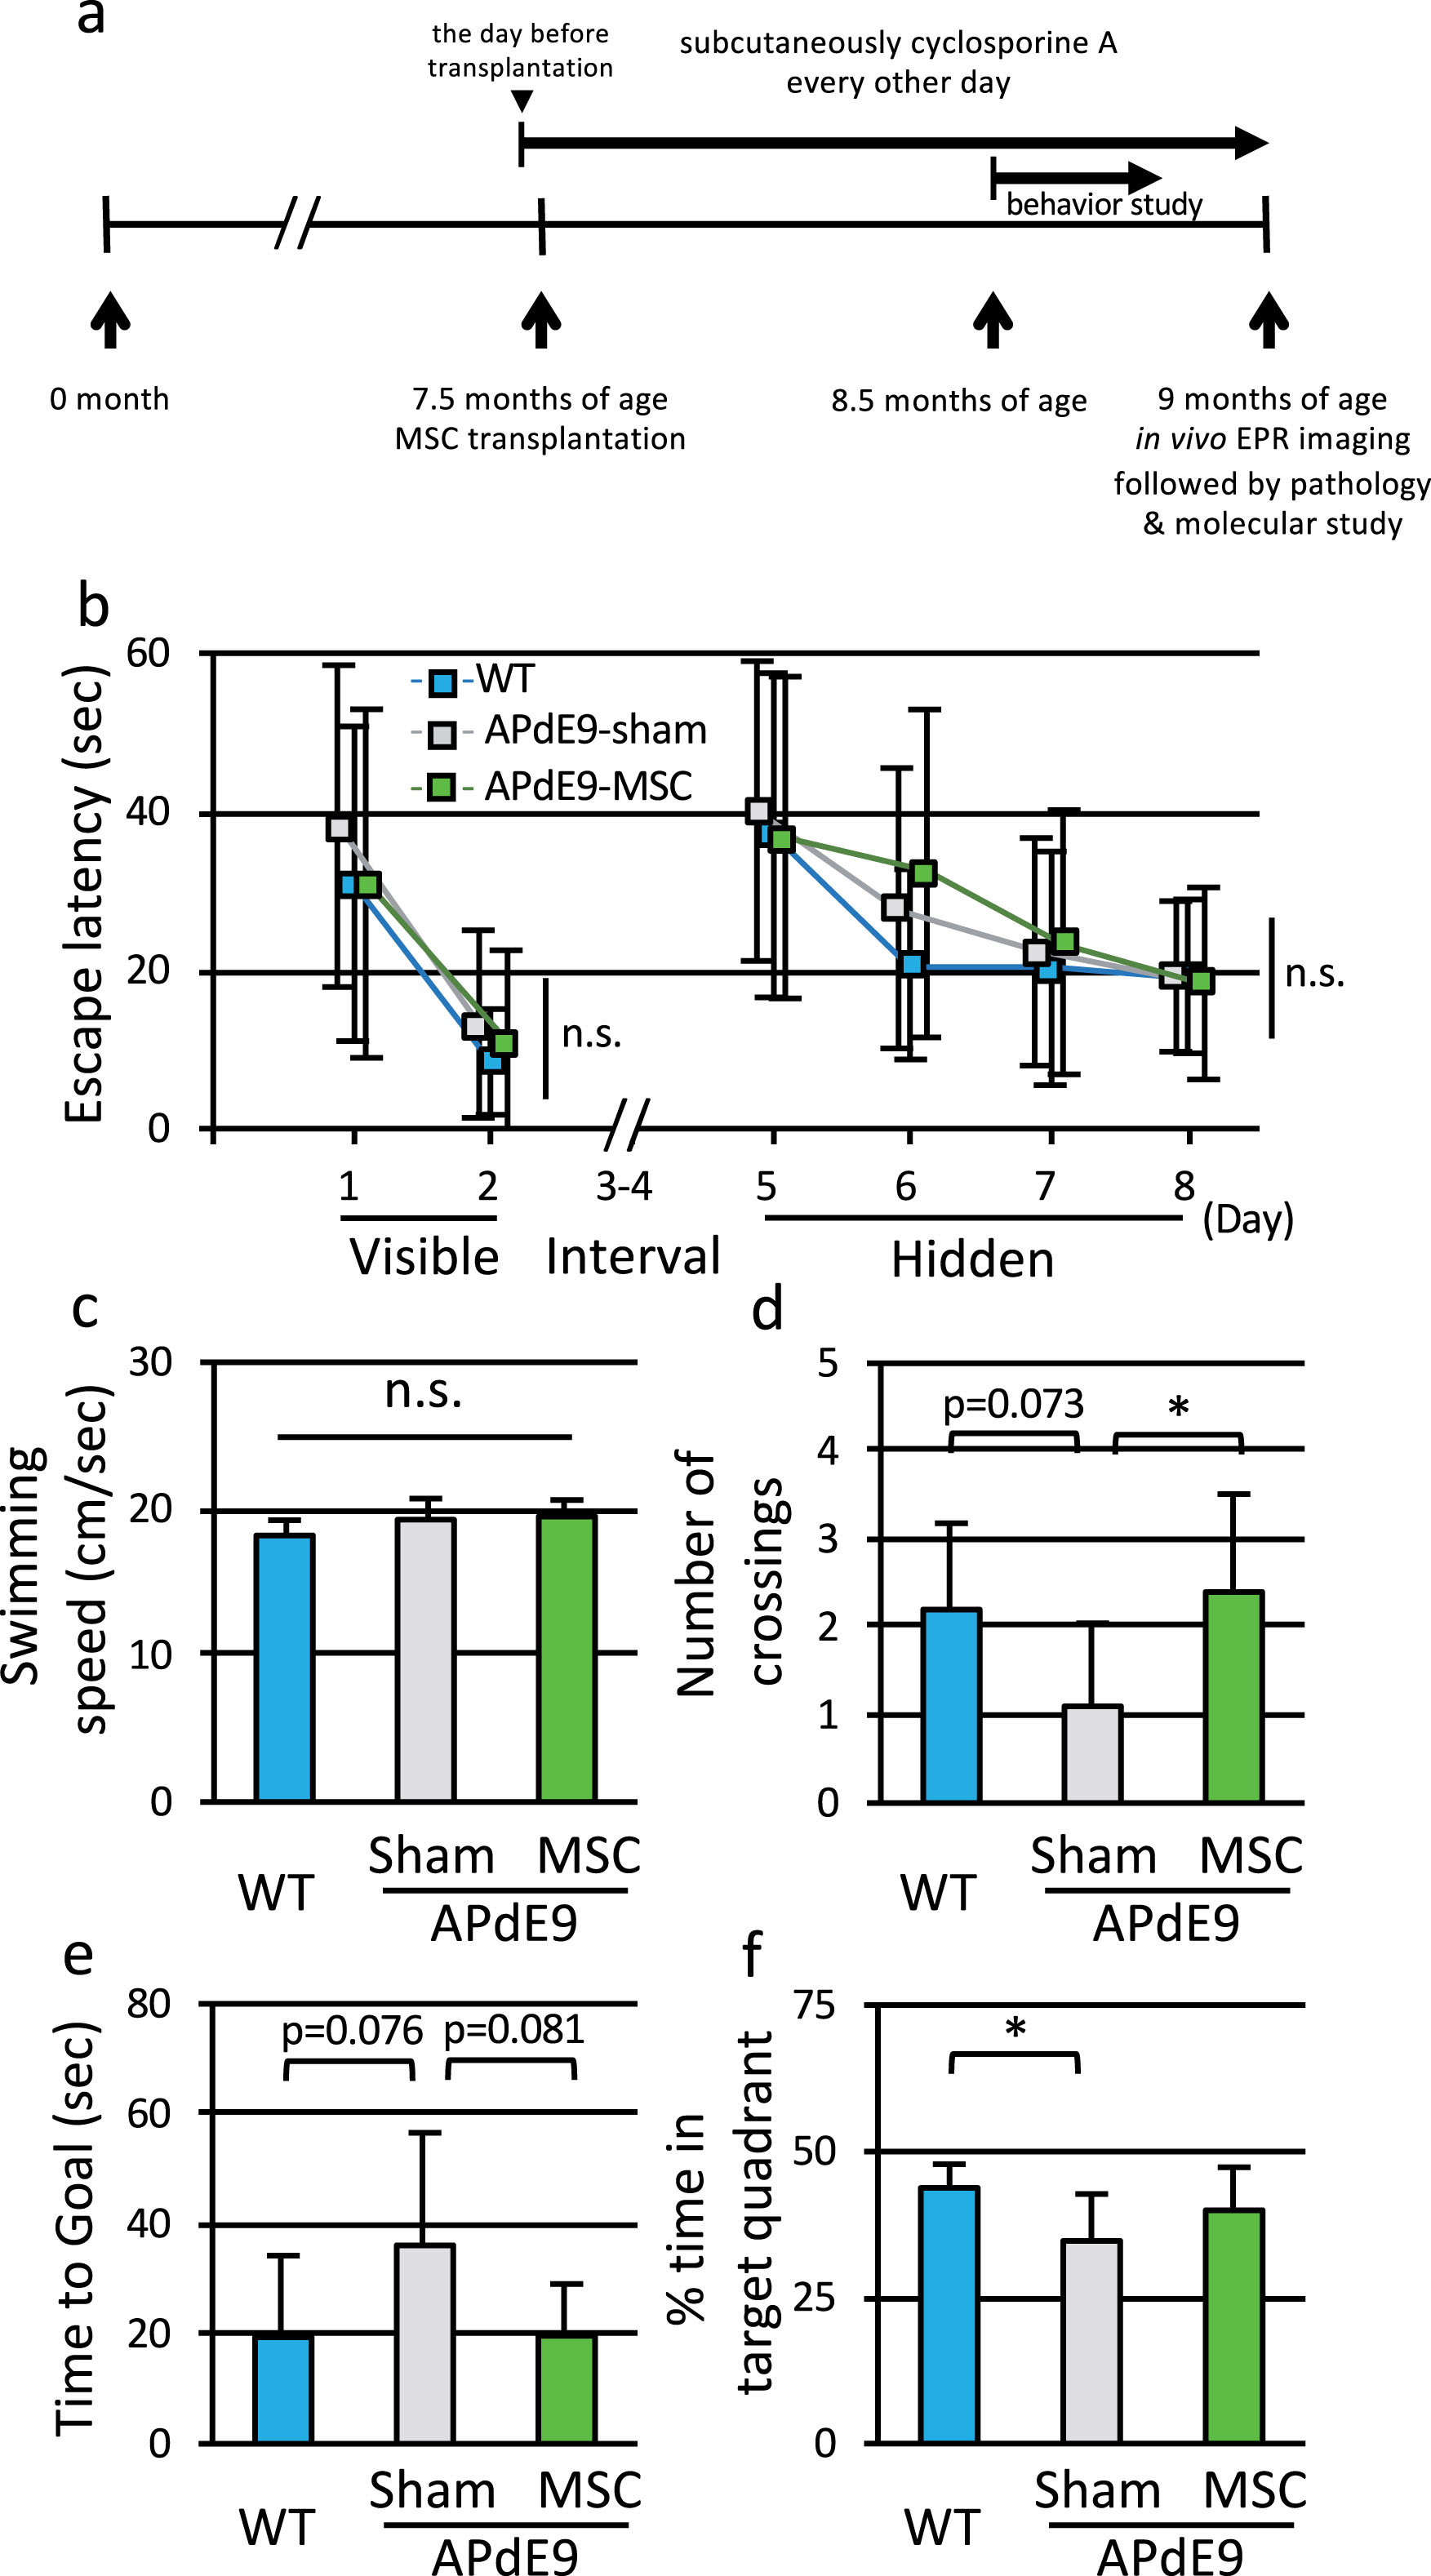
Transplantation of MSC improved spatial memory function of APdE9 mice. a) Schematic diagram of the protocol. To assess spatial learning and memory function, Morris water maze test was performed in WT, APdE9-sham, and APdE9-MSC mice at 8.5 months of age. EPR imaging was performed at 9 months of age. b) Escape latency in the training trials of Morris water maze test for WT mice, APdE9-sham mice, and APdE9-MSC mice. c) Swimming speed in the probe trial of Morris water maze test for three groups of mice. d) Number of crossing through the area where the platform was located, e) latency to reach where the platform was located, and f) percentage of time spent in target quadrant in the probe trial of Morris water maze test (n = 10 for each group).
MSC derived from GFP-expressing rats were used to examine in vivo localization of MSC in recipient mice after transplantation. 3×10⁵ GFP-expressing MSC (MSC-GFP) in 200 μl of DMEM were injected into 21-month-old APdE9 mice (n = 2) via the tail vein. The mice were injected with cyclosporine A as described previously. One day after transplantation, the brain, spleen, and lung were removed.
Morris water maze (MWM) test
MWM test was performed one month after MSC transplantation. The apparatus consisted of a circular pool (1.2 m in diameter) filled with water maintained at 18.0±1.0°C. A variety of visual cues were provided in the testing area and kept constant during the task process. The swimming activity of each mouse was monitored by an overhead video camera, and analyzed with a video tracking system (ActiMetrics, IL, USA). A mouse performed 5 trials per day with 15 min interval between trials. In each trial, the mouse had to swim until it reached the platform. After reaching the platform, the mouse was allowed to remain for 30 s. If the mouse failed to reach the platform within 60 s, the test was ended, and the mouse was guided to the platform. In the visible platform training (days 1 and 2), the platform was placed 1 cm below the surface of the water in the center of the pool, and a small object was attached for visualization of the platform area. In the hidden platform training (days 5, 6, 7, and 8), the platform with no object was placed in the center of one quadrant of the pool. A two-day interval (days 3 and 4) was placed between the visible and hidden platform training. Twenty-four hours after the final training (day 9), the platform was removed, and the probe trial was performed. The mouse was allowed 60 s to search for the platform, and the latency to reach the area where the platform was previously located was recorded. The number of times the mouse crossed the area where the platform was located and the percentage of time spent in the target quadrant were also recorded.
In vivo EPR imaging
In vivo EPR imaging was performed on WT, APdE9-sham, and APdE9-MSC mice after the behavioral experiment was completed. EPR images of mouse heads were obtained as previously described [14]. An in-house built 750 MHz CW-EPR imager was used. The blood-brain barrier (BBB) permeable nitroxide MCP (3-methoxycarbonyl-2,2,5,5-tetramethylpyrrolidine-1-yloxy, Fig. 2a) (NARD Chemicals, Ltd., Osaka, Japan) was used as a redox-sensitive imaging probe. A mouse was anesthetized by intraperitoneal injection of ketamine (50 mg/kg) and xylazine (1 mg/kg). MCP (1.5 μmol/g body weight) in PBS was injected via the tail vein over approximately 15 s. The data acquisition time for EPR imaging was 9 s for 181 projections and 50 ms field scanning (6 mT field scan). EPR images were obtained using the filtered back-projection algorithm, and two-dimensional (2D) EPR images were generated from the reconstructed 3D images. The imaging matrix was 128×128×128 pixels, and the field of view was 50×50×50 mm.
Fig.2
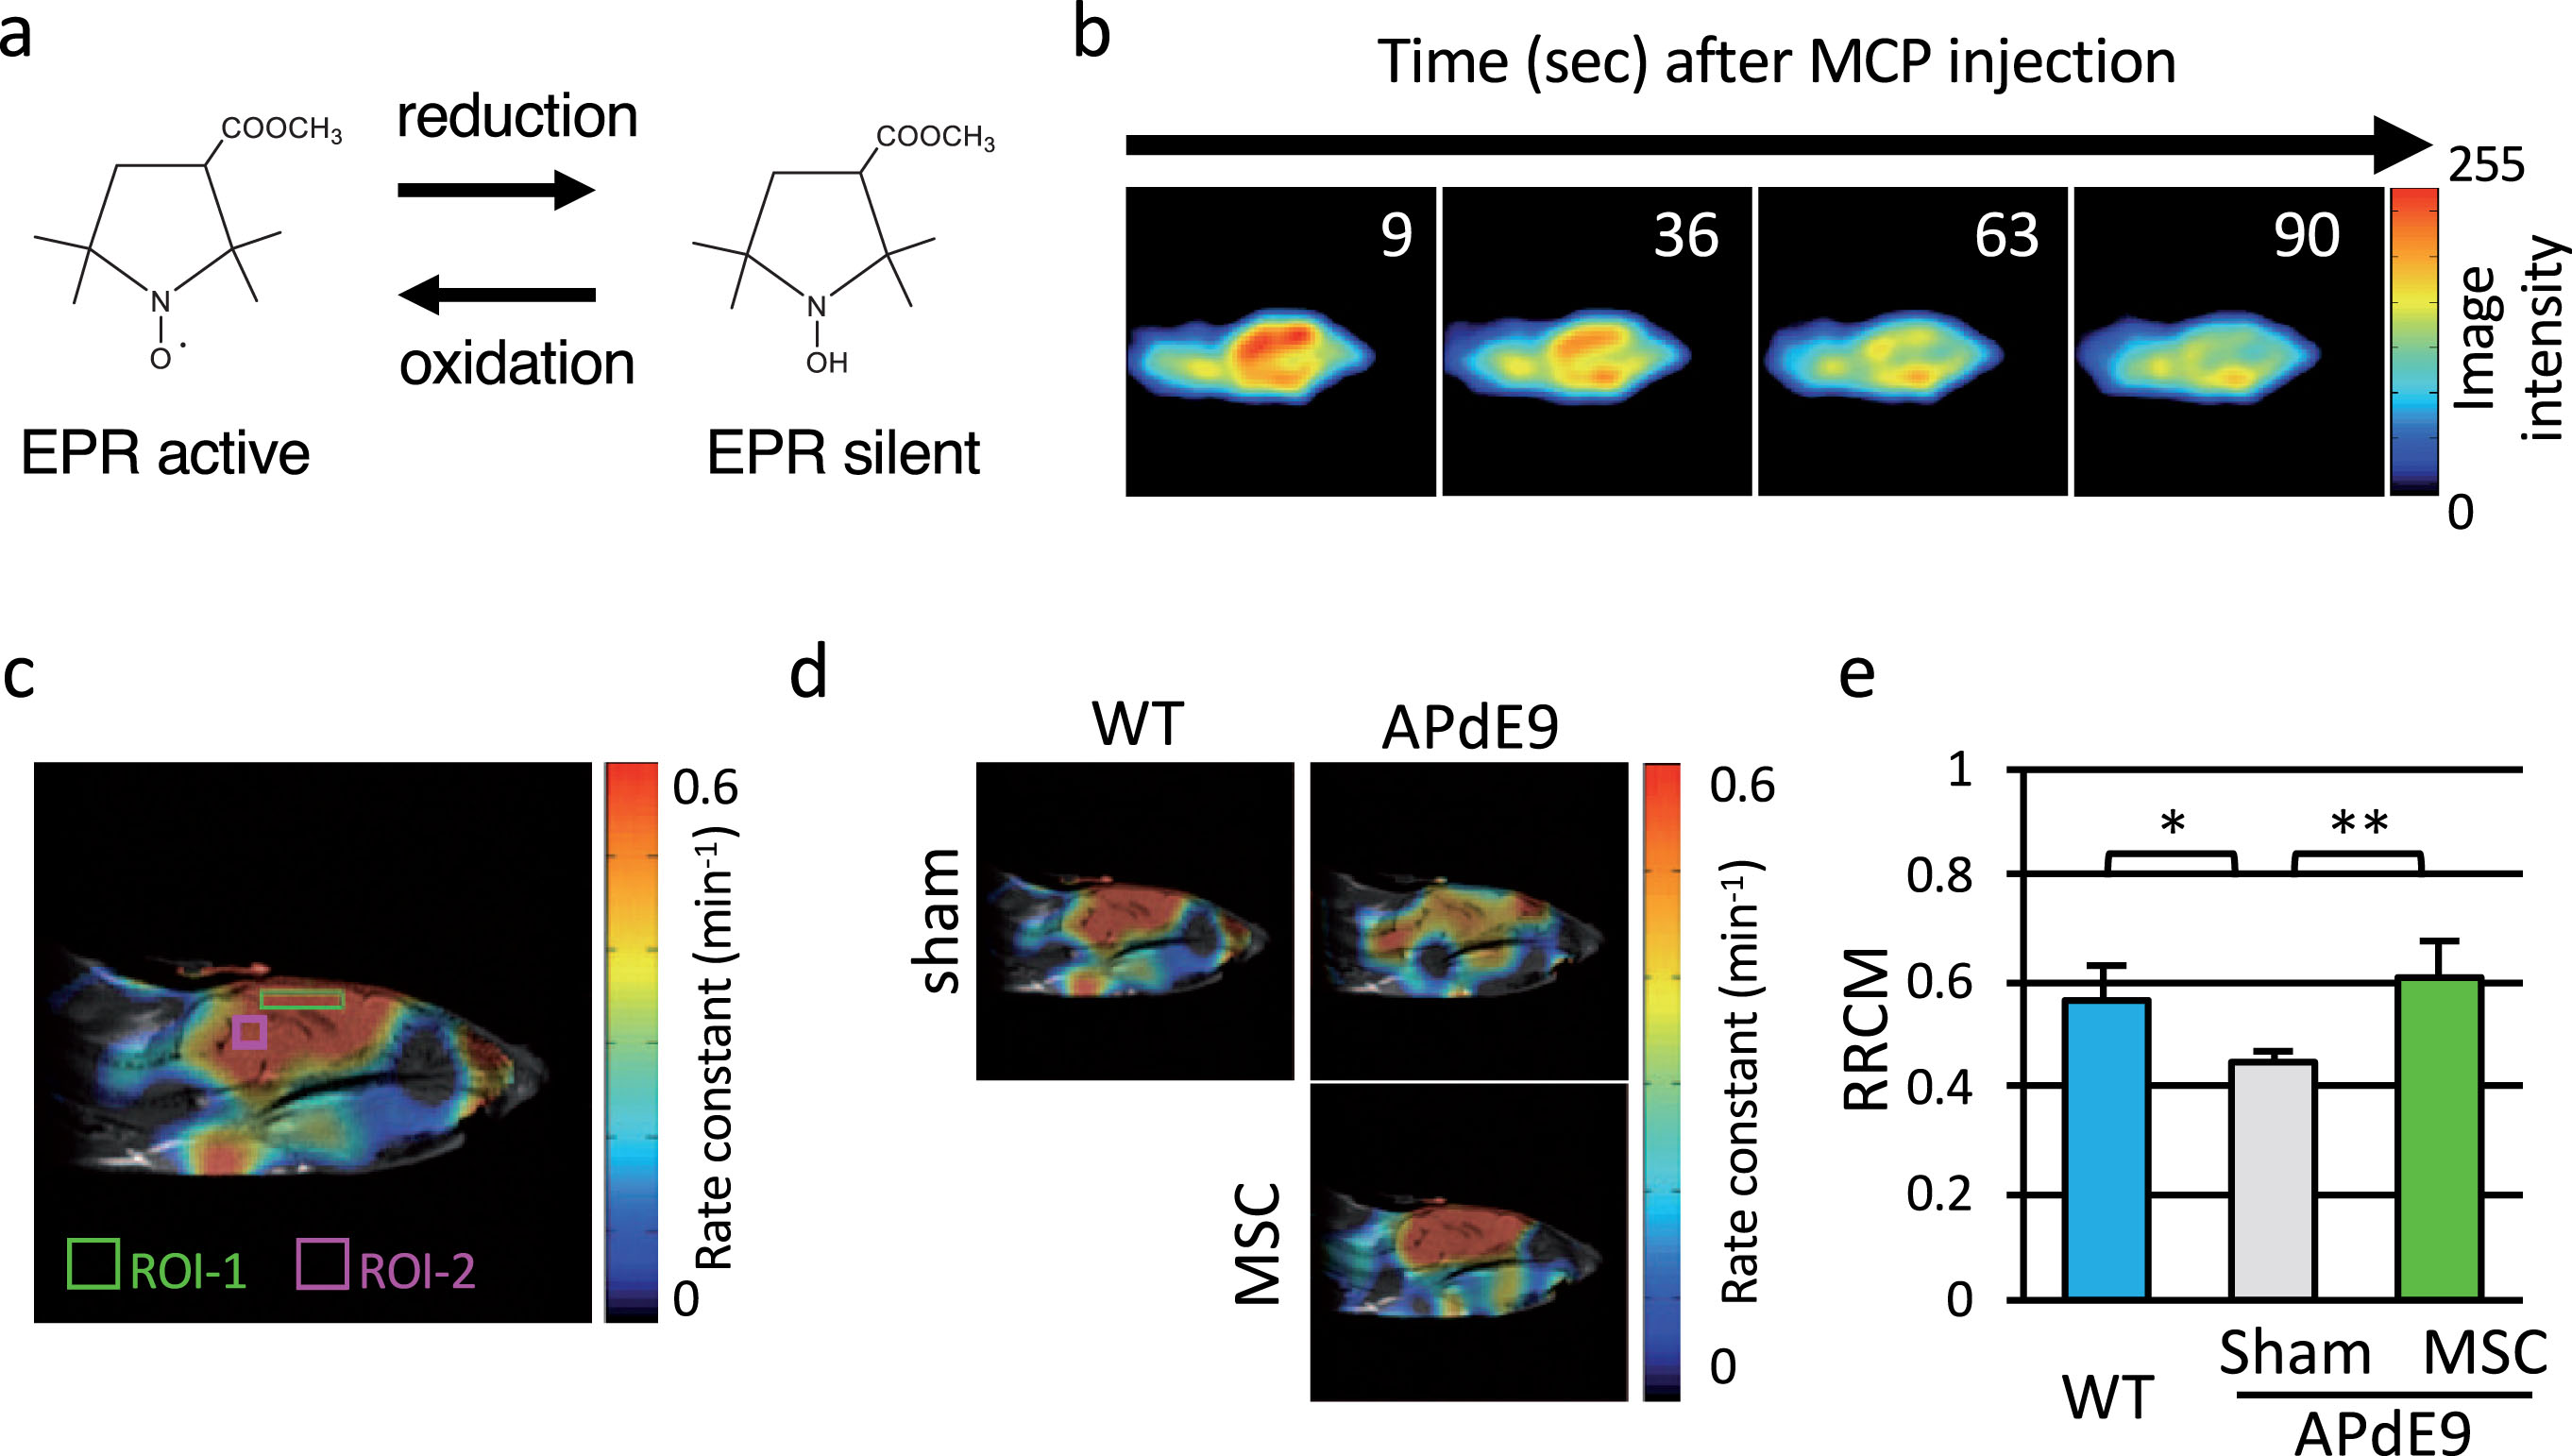
Transplantation of MSC ameliorated redox status in APdE9 mice brain. a) Chemical structure of MCP, a BBB permeable nitroxide compound. b) Serial changes in EPR images (median sagittal plane) over time in a representative MCP-injected WT mouse head. c) Redox map of a representative WT mouse brain. The ROIs in the cerebral cortex (ROI-1) and the midbrain (ROI-2) are indicated. d) Representative redox maps of WT, APdE9-sham, and APdE9-MSC mouse heads. e) RRCM (ratio of the MCP reduction rate constant in the cerebral cortex to that in the midbrain) in WT, APdE9-Sham, and APdE9-MSC groups (n = 9 for WT, n = 5 for APdE9-sham, and n = 8 for APdE9-MSC).
The time course of the image intensity at each pixel of 2D slice EPR image (128×128 pixels) was extracted and used for calculating rate constant of the reduction reaction of MCP using a custom-written program in LabVIEW software (National Instruments) as reported previously [29]. The rate constant of the MCP reduction reaction was evaluated at each pixel using eight serial 2D slice EPR images over time and mapped in 2D format to obtain the so called “redox map”.
MRI of mice was acquired using an MR mini scanner (MR Technology, Tsukuba, Japan) with a 0.5-T permanent magnet. MRI was performed using a spin-echo multi-slice T1-weighted sequence. Typical imaging parameters were: repetition time, 450 ms; echo time, 12 ms; field of view, 60×30 mm2; matrix, 256×128 pixels; number of excitations, 15; and slice thickness, 1.5 mm. Co-registration of EPR images to MRI was performed as described previously [29]. Before EPR imaging, anatomical images of the mouse head were obtained by MRI. Sagittal images of the spatial map of MCP content and map of MCP rate constant were co-registered to the MRI anatomical images.
Region of interest (ROI) was chosen in the co-registered image obtained, and the average rate constant of MCP in the selected ROI was calculated using a custom-written program on Matlab software (The MathWorks, MA, USA).
Tissue preparation
The mouse was deeply anesthetized with medetomidine (0.75 mg/kg), midazolam (4 mg/kg), and butorphanol tartrate (5 mg/kg), then perfused with saline. Half of the brain and other tissues were fixed for one day with 4% paraformaldehyde in PBS, transferred to 10% sucrose followed by 20% sucrose in PBS, and used for histopathological analysis. The other half of the brain was stored at –80°C and used for biochemical analysis.
Histopathology and immunohistochemistry
Brain sections of 9-month-old WT and APdE9 mice were prepared as described previously [15]. Free-floating brain sections were subjected to antigen retrieval in 20 mM citrate buffer, pH 8.0 at 80°C for 30 min [30]. Immunohistochemistry was performed by incubating with rat anti-CD14 antibody (clone M5E2, 1 : 100; BD Pharmingen, CA, USA), rabbit anti-Iba1 antibody (polyclonal, 1 : 1,000; Wako), or mouse anti-Aβ antibody (clone 6E10, 1 : 2,000; Covance, NJ, USA) for 3 days at 4°C. For immunoenzyme staining, the sections were probed using biotinylated anti-mouse or anti-rabbit IgG antibody (1 : 2,000; Vector Laboratories, CA, USA) for 2 h at room temperature. Then, the sections were visualized by DAB (3,3’-Diaminobenzidine) staining using avidin peroxidase (ABC Elite Kit, Vector Laboratories). For immunofluorescence staining, the sections were probed using anti-mouse IgG antibody conjugated with Alexa Flour 594, anti-rabbit IgG antibody conjugated with Alexa Flour 488, anti-mouse IgG antibody conjugated with Alexa Fluor 633, anti-rabbit IgG antibody conjugated with Alexa Fluor 594, anti-rat IgG antibody conjugated with Alexa Flour 488 (each diluted 1 : 2,000; Thermo Fisher, MA, USA) for 2 h at room temperature. Then, sections were counterstained with Hoechst 33342 (1 : 1,000; Dojindo Laboratories, Kumamoto, Japan) for 30 min. For GFP-MSC–transplanted APdE9 mice, all organs were frozen and cut into 20 μm-thick slices using a cryostat. Unstained sections were mounted on glass slides. Fluorescence was observed under a laser scanning confocal microscope (Nikon A1+; Nikon, Tokyo, Japan) or fluorescence microscope (BZ-X710; KEYENCE, Tokyo, Japan).
Quantification of amyloid plaque burden and microglia of brain section
In 9-month-old WT and APdE9 mice, anti-Aβ and anti-Iba1 antibody-stained, DAB-labeled sections were analyzed by measuring the percentage of positively stained area in a microscopic field using ImageJ software (National Institutes of Health, MD, USA) as reported previously [31]. For quantitative analysis, three serial brain sections at intervals of 400 μm were used for each mouse. For quantification of the Aβ deposition, we designated the entire parietal association cortex or the entire hippocampus in each brain section of each mouse as the analysis region. For quantification of the Iba-1 positive area, four high-magnification fields of view per each section were randomly assigned as the analysis region from the parietal cortex area. For quantification of microglial accumulation around Aβ deposits and ratio of Aβ-positive or CD14-positive microglia in high-power field, Aβ images were observed without Iba1 or CD14 images and all Z-direction stack images for each Aβ deposit were captured sequentially in microscopic fields.
Enzyme-linked immunosorbent assay (ELISA)
To measure the amount of Aβ1–40 or Aβ1–42 in the brain tissue, a tris-buffered saline (TBS)-extracted fraction and a formic acid (FA)-extracted fraction were prepared according to the following procedures as described previously [32, 33]. To measure the amount of internalized Aβ1–42 remaining in MG6 cells, MG6 cells were collected and lysed in RIPA sample buffer (Wako) with protease inhibitor cocktail (Wako). The amounts of Aβ1–40 or Aβ1–42 in FA-extracted fraction, TBS-extracted fraction and cell lysate were measured using Human βAmyloid (1–40) ELISA Kit Wako II (FUJIFILM Wako, Osaka, Japan) and human Aβ42-specific ELISA kit (Thermo Fisher).
Preparation of Aβ1–42
Monomeric, oligomeric and fibrillar Aβ42 were prepared as described previously with minor modification [16, 34]. For monomeric Aβ42 preparations, HiLyte™ Fluor 488 or 633-labeled human synthetic Aβ1–42 (Aβ-488 or -633) and non-labeled Aβ1–42 (Ana Spec, CA, USA) were suspended to 1 mM in 1,1,1,3,3,3-hexafluoro-2-propanol (HFIP; Sigma Aldrich, MO, USA) and lyophilized. Peptide films were re-suspended to 5 mM in DMSO and sonicated for 30 min, then diluted to 100 μM in PBS. Starting with these monomeric peptide preparations, Aβ-488 or -633 and non-labeled Aβ1–42 were further incubated at 4°C for 24 h to promote oligomeric formation, and at 37°C for 24 h to promote fibril formation [16].
RNAi-mediated knockdown
Mouse microglial cell line MG6 was cultured in DMEM containing 10% FBS, penicillin and streptomycin in a 37°C incubator with 5% CO2 [35, 36]. MSC culture was obtained from 6-week-old Sprague-Dawley rats as described above. We used MSC after one passage for in vitro analysis. RNAi-mediated knockdown was performed by transfecting siRNAs targeting CD14 (30 nM; Sigma Aldrich) or universal negative control (UNC; 30 nM; Sigma Aldrich) into MG6 cells using Lipofectamine RNAiMAX Transfection Reagent (Thermo Fisher) according to manufacturer’s instruction. Experiments were completed at 48 h after transfection, and cells were collected.
For in vitro analyses, conditioned medium of MSC was collected from confluent MSC culture 48 h after one passage, and stored at –80°C. Conditioned medium of MG6 cell culture was used as control.
Flow cytometric analysis of Aβ-internalization and CD14
Microglial Aβ internalization was measured using Aβ-488 or -633 as described previously with slight modification [37]. To examine the effects of MSC, MG6 were plated in 24-well plate at a density of 1×10⁵ cells/cm2 and co-cultured with MSC or MG6 cells without direct contact using Costar Transwell (pore size 0.4 μm; Corning, NY, USA). MSC or MG6 cells were cultured on the permeable membrane of a Costar Transwell insert, and the insert was placed in the plate containing MG6 cells at the bottom. MG6 cells were co-cultured with MSC or MG6 for 24 h. Then the MG6 cells were incubated with 1 μM Aβ-488 or -633 and 10 nM of the proteasome inhibitor MG132 (Wako) for 15 min. To inhibit secretion from MSC, Golgistop (BD Bioscience) was added to the medium.
To examine the effects of conditioned medium of MSC, MG6 cells were cultured in DMEM with 10% FBS containing 45% of conditioned medium from MSC culture for 24 h. Then the MG6 cells were incubated with 1 μM Aβ-488 or -633 and 10 nM of the proteasome inhibitor MG132 (Wako) for 15 min. Cells were washed twice with cold PBS and collected for analysis by flow cytometry using FACS Canto II (BD Bioscience).
To examine the effects of MSC on CD14 expression, MG6 cells were co-cultured with MSC or MG6 for 24 h. Cell surface marker was examined by staining with PE-labeled rat anti-mouse CD14 monoclonal antibody (1 : 100). Fc receptors were blocked using FcR Blocking Regent, mouse (Miltenyi Biotec, Bergisch Gladbch, Germany) for 30 min. After 1 h of incubation with the antibody, cells were washed twice with PBS containing 5% FBS and 1 mM EDTA and collected for analysis by flow cytometry using FACS Canto II (BD Bioscience).
RNA isolation and quantitative real-time-PCR (qRT-PCR)
Total RNA was prepared from one-third of the anterior brain tissues or MG6 cells using RNeasy mini kit (Qiagen, Hilden, Germany). Single-stranded complementary DNA (cDNA) was synthesized from more than 1 μg of total RNA in a 50 μL reaction mix for 1 h at 42°C, using 1000 U ReverScript (R) I (Wako) and 5 μM oligo-dT primer. For qRT-PCR, the cDNA products were diluted to 400 μL in 1/10 TE buffer. Amplification was performed using Power SYBR Green Master Mix (Thermo Fisher) with specific primers. The cycling condition was 40 cycle at 95°C for 30 s, 60°C for 30 s, and 72°C for 30 s, followed by a single 10 min extension at 72°C. The mRNA expression level in each sample was standardized against GAPDH. Primer sequences used are listed in Table 1.
Table 1
Primers used in quantitative real-time PCR
| Gene | Forward | Reverse |
| GAPDH | GGGCTGGCATTGCTCTCA | TGTAGCCGTATTCATTGTCATACCA |
| TNF-α | TTCCGAATTCACTGGAGCCTCGAA | TGCACCTCAGGGAAGAATCTGGAA |
| IL6 | TGGCTAAGGACCAAGACCATCCAA | AACGCACTAGGTTTGCCGAGTAGA |
| Arginase1 | GGAAGACAGCAGAGGAGGTG | TATGGTTACCCTCCCGTTGA |
| IL10 | GGCAGAGAACCATGGCCCAGAA | AATCGATGACAGCGCCTCAGCC |
| CD14 | AGGGTACAGCTGCAAGGACT | CTTCAGCCCAGTGAAAGACA |
| TLR4 | TCAAGACCAAGCCTTTCAGC | AACCGATGGACGTGTAAACC |
| TLR2 | AAGAGGAAGCCCAAGAAAGC | AATGGGAATCCTGCTCACTG |
| CD36 | AGTTGGCGAGAAAACCAGTG | TGCACCAATAACAGCTCCAG |
| CD33 | AATTAGGAGGTGTGGCCTTG | TCTGGATTGGCAGACATCAG |
| SCARA | CAACATCACCAACGACCTCA | TGTCTCCCTTTTCACCTTGG |
Western blotting analysis
MG6 cells were collected and lysed in RIPA buffer (Wako) with protease inhibitor cocktail (Wako). Brain tissues were homogenized at 10,000 rpm for 60 s (Polytron PT2500E; Luzern, Switzerland) in 10 volumes (w/v) of N-PER lysis reagent (Thermo Fisher) containing a protease inhibitor cocktail. Samples were subjected to sodium dodecyl sulfate-polyacrylamide gel electrophoresis (SDS-PAGE; 20% polyacrylamide gels in Tricine buffer). Proteins were transferred to a polyvinylidene difluoride membrane (Bio-Rad, CA, USA) by electroelution and then incubated with mouse monoclonal antibody against rat anti-CD14 antibody (1 : 100), mouse anti-GAPDH antibody (1 : 2000, Merck Millipore, MA, USA), rabbit anti-insulin degrading enzyme (IDE) antibody (1 : 1000, Abcam, Cambridge, UK), rabbit anti-neprilysin (NEP) antibody (1 : 1000, Abcam), or rabbit anti-amyloid precursor protein (APP) C-terminal fragment (APP-C) antibody (1 : 1000, Biolegend, CA, USA). Subsequently, protein bands were detected using a chemiluminescence kit (ECL kit; GE Healthcare, Buckinghamshire, UK).
Statistics
All the data are expressed as mean±SD. Differences between groups were analyzed by Student’s t-test or one-way ANOVA followed by post hoc Tukey-Kramer HSD test. For all tests, p < 0.05 was considered statistically significant. JMP11 (SAS Institute Inc., NC, USA) was used for data analysis. In all figures, the asterisks * and ** indicate statistical significance at 5 and 1 percent level, respectively.
RESULTS
Transplantation of MSC improved spatial memory function in APdE9 Mice
In the present study, we injected vehicle (sham) or MSC derived from Sprague-Dawley rat bone marrow into 7.5-month-old APdE9 or WT mice via the tail vein, and injected cyclosporine A subcutaneously every other day from the day before transplantation. We performed the MWM test at 8.5 months of age and EPR imaging at 9 months of age (Fig. 1a). Brain tissues were collected immediately after EPR imaging. We also transplanted MSC-GFP to APdE9 mice to trace MSC location. MSC-GFP were observed in the lung (Supplementary Figure 1a) but not in the brain (Supplementary Figure 1b) on the following day of transplantation, and MSC-GFP in lung were rarely observed at 5 days after transplantation (data not shown).
In the MWM test, WT, APdE9-sham and APdE9-MSC mice were trained for 2 days using the visible platform and for 4 days using the hidden platform. In the training trials, a weak genotype effect was observed when measuring escape latency, but the differences were not significant (Fig. 1b). Probe trial was performed without a platform one day after the last training. Swimming speed measured in the probe trial confirmed no difference in motor function among three groups (Fig. 1c). When counting the number of times a mouse crossed the area where the platform was located (number of crossings), a significant transplantation effect was detected. The number of crossings was significantly greater in APdE9-MSC mice than in APdE9-sham mice (Fig. 1d). The time to arrival at goal tended to be longer in APdE9-sham mice compared to WT mice, and tended to improve in APdE9-MSC mice, although the differences were not significant (Fig. 1e). Retention time in the target quadrant was significantly shorter in APdE9-sham mice than in WT mice, but was comparable between APdE9-MSC and WT mice (Fig. 1f). Thus, a single MSC transplantation improved behavioral disturbance observed in APdE9 mice.
Transplantation of MSC improved redox status in APdE9 mice brain
In vivo EPR imaging was performed in 9-month-old APdE9 and WT mice. Pharmacokinetic EPR imaging study of each mouse brain was carried out after intravenous injection of MCP, a BBB permeable nitroxide compound (Fig. 2a). Representative serial EPR images over time of a WT mouse brain (median sagittal plane) are shown in Fig. 2b. Based on the pharmacokinetics of MCP reduction reaction in mouse heads, the pixel-based rate constant of MCP reduction reaction was calculated and mapped as a redox map (Fig. 2c). For quantitative comparison of redox status of the brain, two ROIs were selected, one in the cerebral cortex (ROI-1; 20×4 pixels, indicated by light green-outlined rectangle) and the other in the midbrain (ROI-2; 6×6 pixels, indicated by pink-outlined rectangle), based on the anatomical map of MRI (Fig. 2c). The midbrain was chosen as a reference tissue that shows little effect from Aβ deposition as reported previously [14]. Representative 2D images of redox state of the three groups are shown in Fig. 2d. To normalize the individual differences in each group, the ratio of MCP reduction rate constant in the cerebral cortex to that in the midbrain (RRCM = rate constant in cerebral cortex/rate constant in midbrain) was used as the index of redox status in living mouse brain. Comparison of RRCM among three groups is shown in Fig. 2e. RRCM in APdE9-MSC mice brain was significantly higher than that in APdE9-sham mice brain, and was comparable to that in WT mice brain (Fig. 2e). Increased RRCM indicated that the redox-sensitive nitroxide MCP in APdE9-MSC mice was reduced faster in APdE9-MSC mice than in APdE9-sham mice, suggesting that the oxidative stress in the cerebral cortex of APdE9-MSC mice was suppressed compared to that in APdE9-sham mice.
Transplantation of MSC reduced Aβ deposition and soluble Aβ42 level in APdE9 mice
We next analyzed the Aβ pathology in APdE9 mice. Aβ deposits in the hippocampus and the cortex (parietal association area) were immunostained with anti-Aβ antibody (6E10). Representative photomicrographs are shown in Fig. 3a and c. There was no Aβ deposition in WT mouse brain (data not shown). In the cortex and hippocampus of APdE9-sham mice, many Aβ plaques were formed (left panels of Fig. 3a and c). On the other hand, Aβ plaques were reduced in both regions of APdE9-MSC mice (right panels of Fig. 3a and c). Using the photomicroscopic images of Aβ, the percentage of positively stained area in a high-power microscopic field of the cortex and the hippocampus was quantified. Aβ-positive area was significantly reduced in APdE9-MSC mice than in APdE9-sham mice, in both the cortex and hippocampus (Fig. 3b, d).
Fig.3
Transplantation of MSC reduced Aβ deposition and soluble Aβ1–42 level in APdE9 mice. a, c) Representative parietal association cortex (a) and hippocampus (c) sections of 9-month-old APdE9-sham (left) and APdE9-MSC mice (right) immunostained for Aβ. Scale bars: 500 μm. b, d) Aβ-positive stained area in cortex (b) and hippocampus (d) in APdE9-sham and APdE9-MSC groups (n = 7 for APdE9-sham, n = 6 for APdE9-MSC). e, f) Quantification of human Aβ1–40 and Aβ1–42 level in TBS-extracted fractions and FA-extracted fractions prepared from the brains of 9-month-old APdE9-sham and APdE9-MSC mice (Aβ1–40 in TBS fraction: n = 8 for APdE9-sham and n = 7 for APdE9-MSC; in FA fraction: n = 8 for both groups. Aβ1–42 in TBS fraction: n = 7 for both groups; in FA fraction: n = 7 for APdE9-sham and n = 8 for APdE9-MSC).
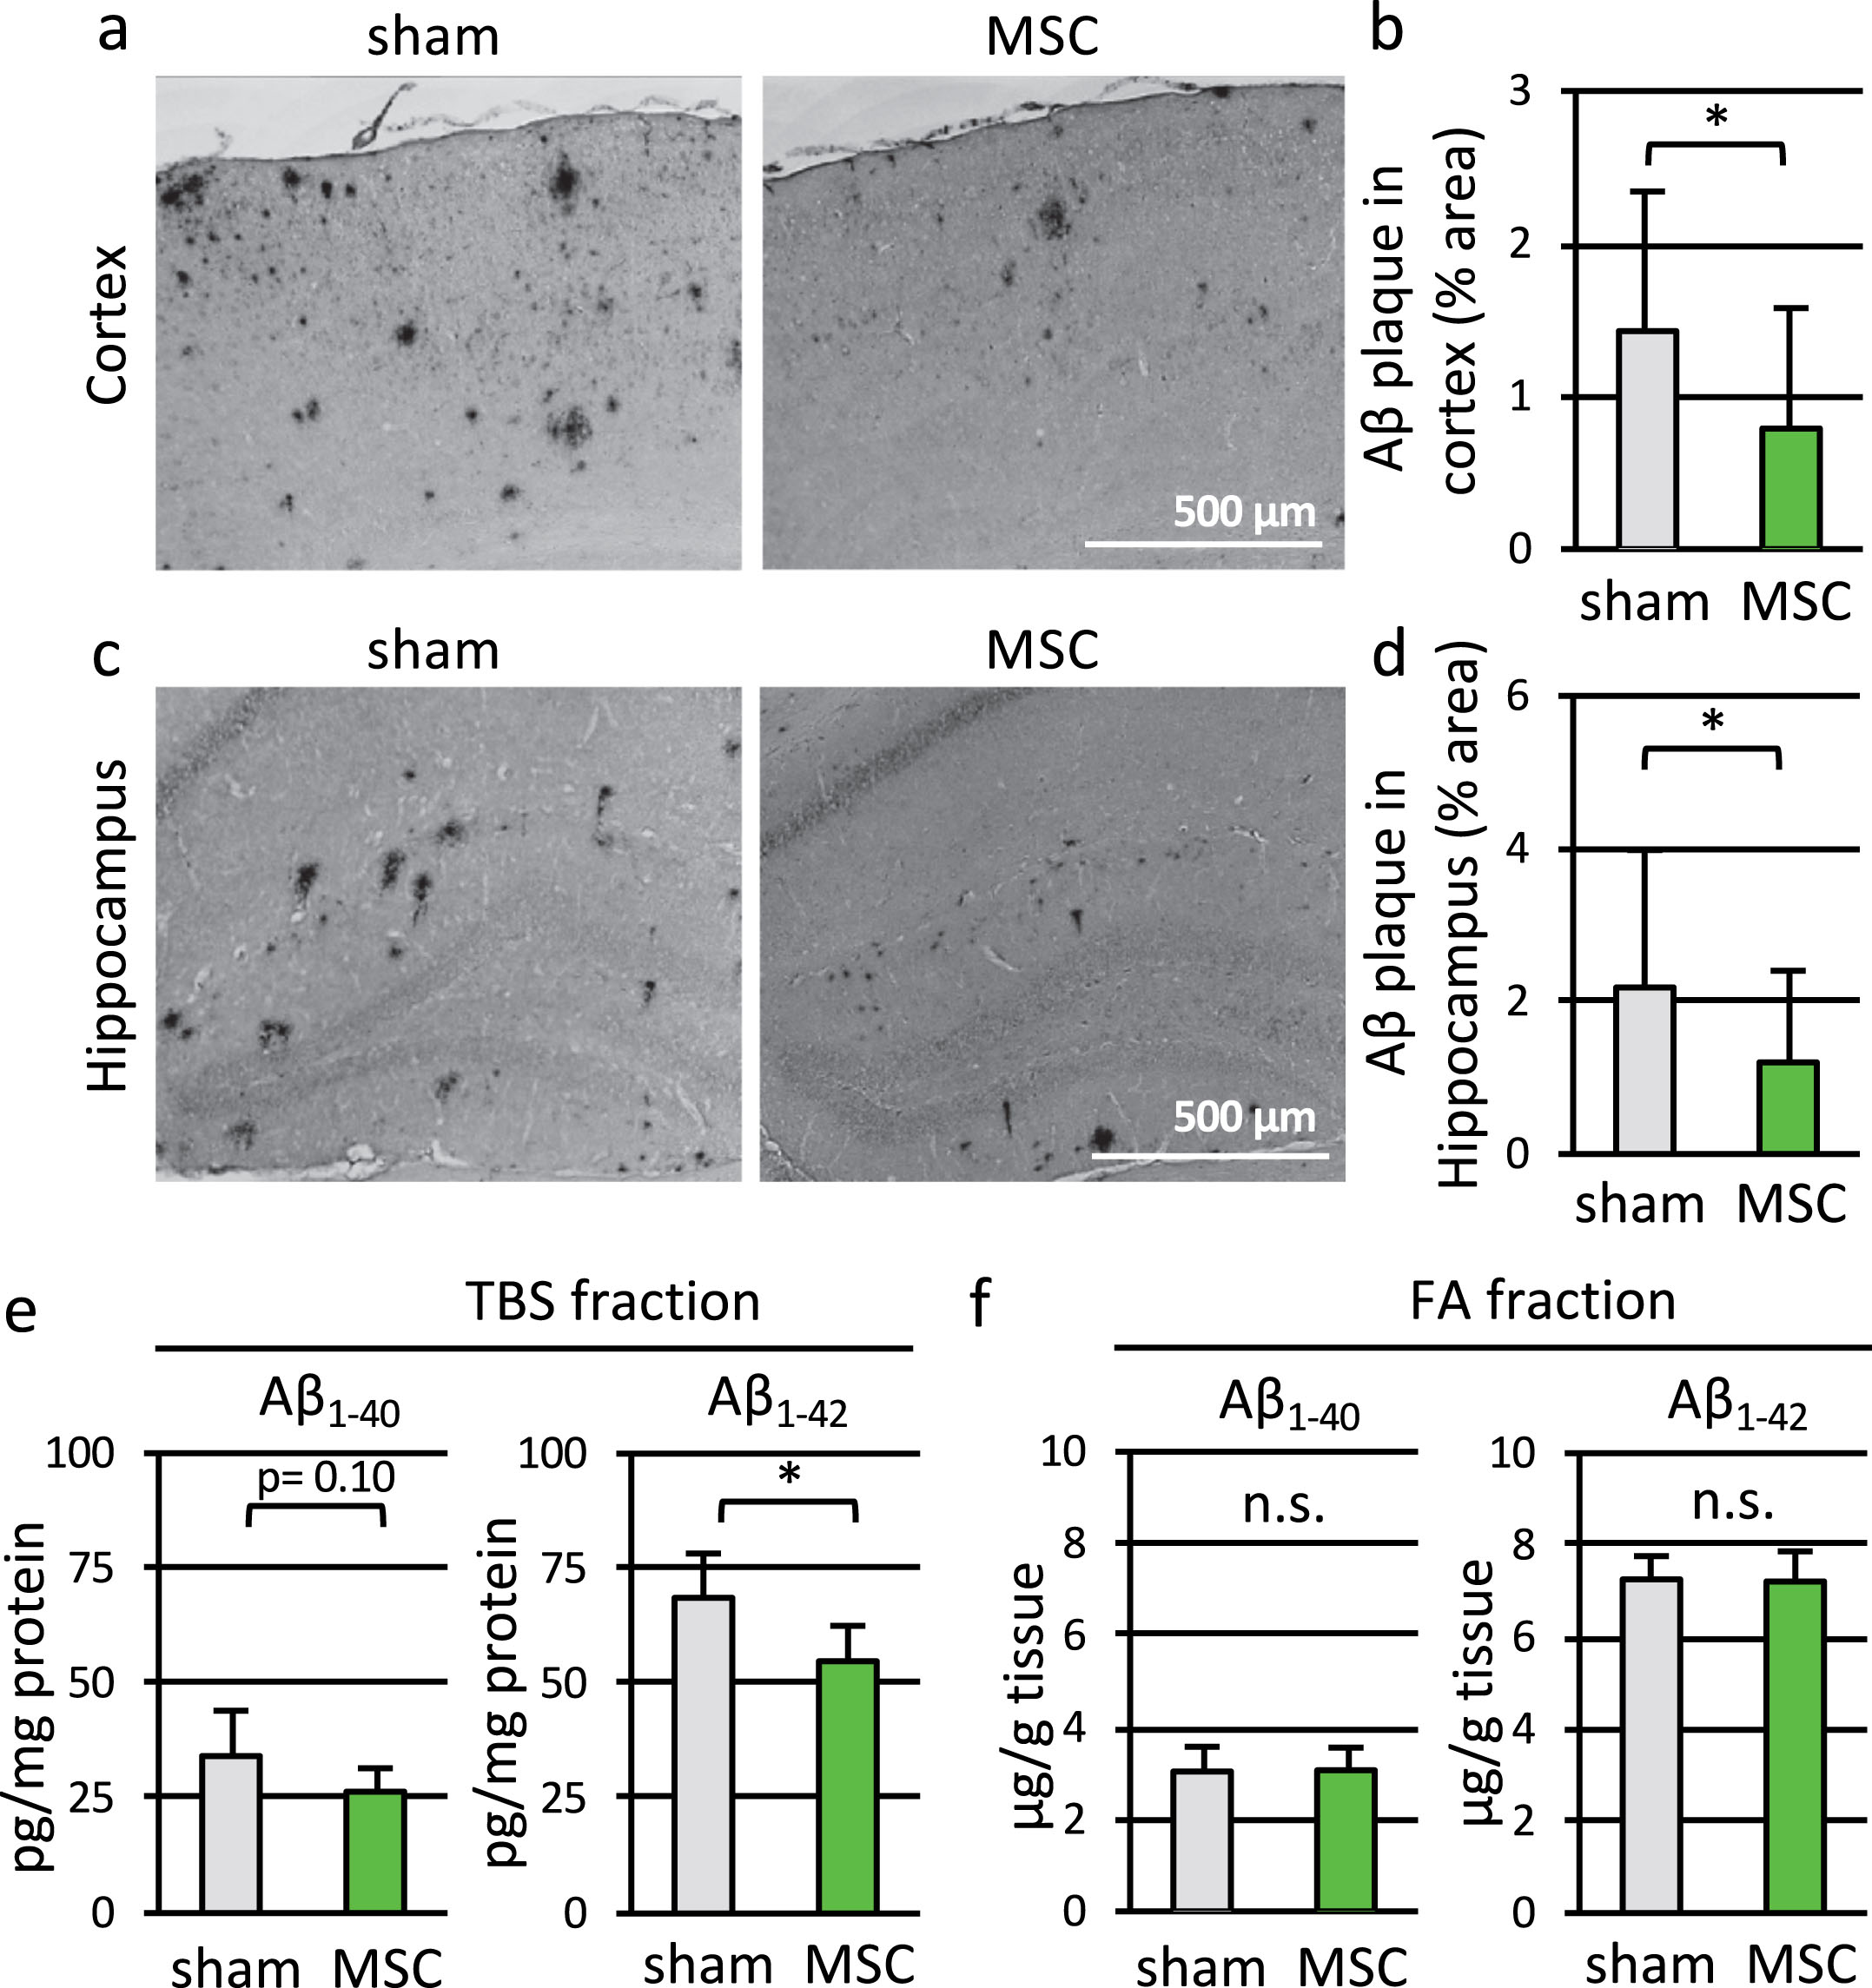
Subsequently, we measured the quantities of human Aβ1–40 and Aβ1–42 (Fig. 3e, f) in the cerebral hemisphere of APdE9 mice, using ELISA. The amounts of soluble Aβ1–40 and Aβ1–42 in TBS-extracted fractions decreased by MSC transplantation, and a significant difference was observed for soluble Aβ1–42 level (Aβ1–42; p = 0.012; Fig. 3e). On the other hand, levels of insoluble Aβ1–40 and Aβ1–42 in FA-extracted fractions were almost the same with or without transplantation (Fig. 3f). Thus, transplantation of MSC reduced the area of Aβ deposition and the level of soluble Aβ in APdE9 mice brain.
Transplantation of MSC accelerated microglial accumulation around Aβ deposits and clearance
To assess the effects of MSC transplantation on microglial clearance of Aβ, we performed immunohistochemistry of microglia and Aβ. Staining of Iba1, a microglial marker, showed accumulation of amoeboid microglia in APdE9 mice, and MSC transplantation decreased Iba1-positive area in the cortex (parietal association area) compared to sham operated mice (Fig. 4a, b).
Fig.4
Transplantation of MSC accelerated microglial accumulation around Aβ deposits and Aβ clearance. a) Representative parietal association cortex sections from 9-month-old WT, APdE9-sham and APdE9-MSC mice immunostained for Iba1. Scale bar is 500 μm. b) Iba1-positive area in WT, APdE9-sham and APdE9-MSC groups (n = 3 for WT, n = 4 for APdE9-sham and APdE9-MSC). c) Immunofluorescent staining of Aβ (red) and Iba1 (green). Nuclei were counterstained with Hoechst 33342 (blue). Radius of dotted circle is 50 μm. Scale bar is 50 μm. d) Microglial accumulation around Aβ plaque is expressed as the ratio of number of microglia around plaque (within 50 μm radius from center of Aβ deposit) to square root of the size of Aβ deposit (n = 50 for both groups). e) Number of microglia with Aβ uptake counted using confocal microscopy. Arrows indicate Aβ-negative microglia, and arrowheads indicate Aβ-positive microglia. Radius of dotted circle is 50 μm. f) Ratio of Aβ-positive microglia to all microglia around Aβ plaque (within 50 μm radius from center of Aβ deposit, n = 21 for both groups). Scale bar; 50 μm.
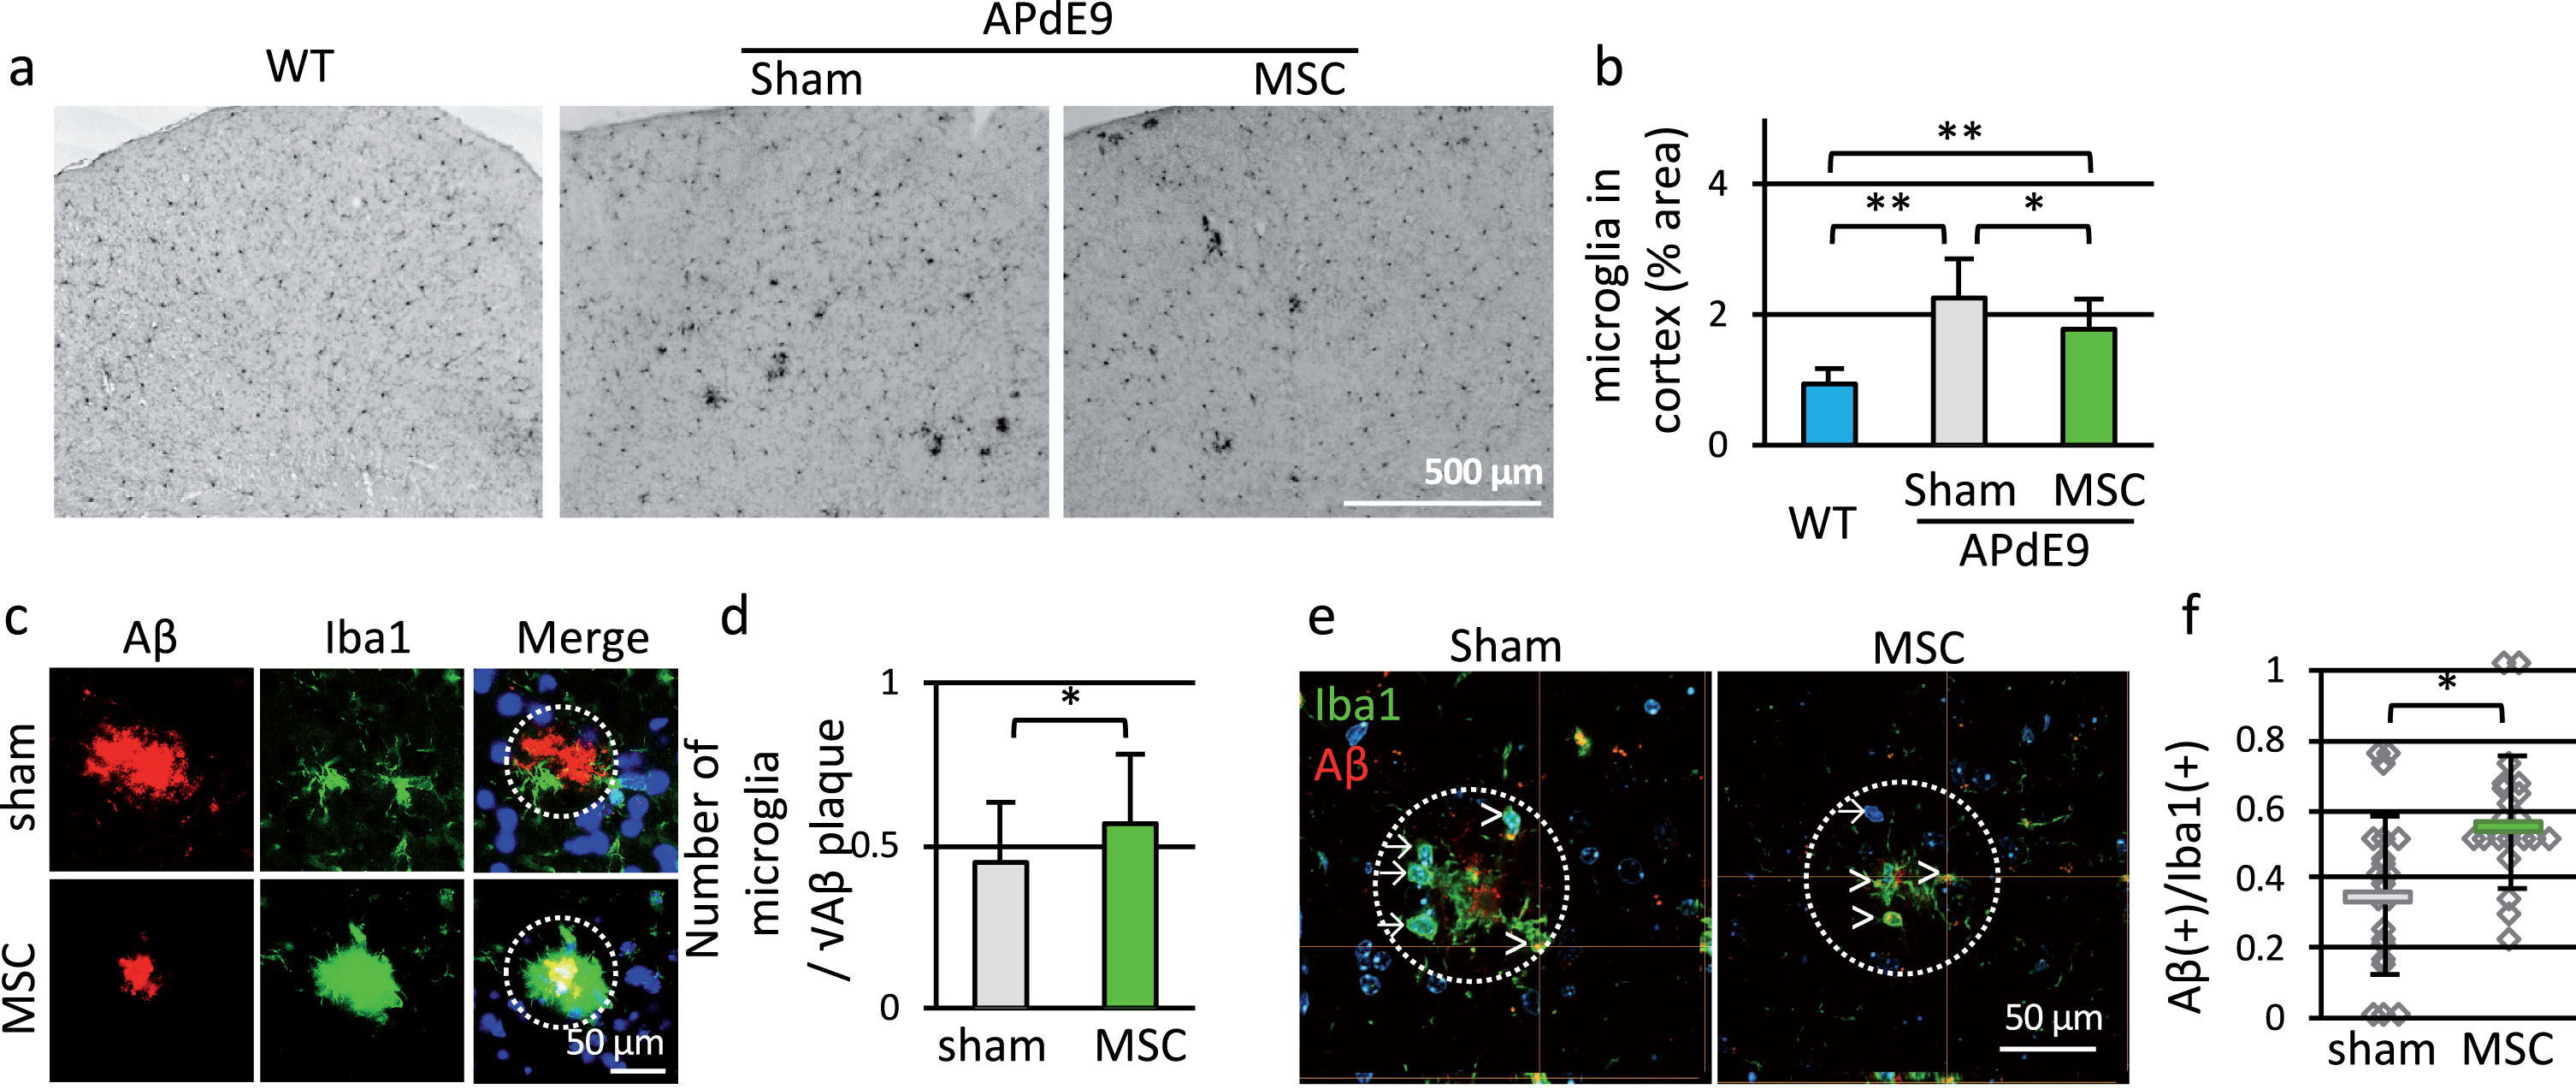
We then performed double staining of Iba1 and Aβ. Despite the reduction of Iba1-positive area, microglia surrounded Aβ deposits tightly in MSC-transplanted group (Fig. 4c). The numbers of microglia accumulated around Aβ deposits (microglia within 50 μm radius from the center of Aβ deposit) and the sizes of Aβ deposit were plotted in Supplementary Figure 2. The numbers of microglia accumulated around Aβ deposits increased in proportion to the square root of the size of Aβ deposit. Ratio of the number of microglia to square root of size of Aβ deposit increased by MSC transplantation (Fig. 4d). Additionally, the ratio of Aβ-positive microglia to all microglia around Aβ deposit increased by MSC treatment (Fig. 4e, f).
On the other hand, Aβ-degrading enzymes such as IDE and NEP in brain tissues did not change by MSC treatment (Supplementary Figure 3). To evaluate the effects of MSC on Aβ production, we performed immunoblot using anti-APP-C antibody. Protein levels of APP C-terminal fragments (C99 and C83) were not different among three groups (Supplementary Figure 3). The above results indicated that MSC treatment modified microglial function to ameliorate Aβ pathology.
MSC accelerated microglial clearance of Aβ in vitro
We next examined whether MSC accelerate uptake of Aβ using the mouse microglial cell line MG6 in vitro. MG6 cells that had been co-cultured with MG6 cells or MSC for 24 h and then exposed to Aβ for 3 h were collected. The amount of Aβ present in the MG6 cells increased significantly by co-culture with MSC compared to co-culture with MG6 cells (Fig. 5a). To exclude the possibility that co-culture with MSC suppressed degradation of Aβ in MG6 cells, we washed out Aβ and incubated the cells in DMEM without FBS for 3 h. We then measured the amount of Aβ remaining in MG6 cells. There was no difference in amount of Aβ remaining in MG6 cells between co-culture with MSC and co-culture with MG6 (Fig. 5a). We also measured microglial uptake of Aβ using fluorescent labeled Aβ with the proteasome inhibitor MG132. Fluorescent intensity of Aβ-488 or -633 taken up by MG6 cells was analyzed by flowcytometry (Supplementary Figure 4). MG6 cells co-cultured with MSC internalized more monomeric Aβ than those co-cultured with MG6 cells (Fig. 5b–d; HFIP/DMSO). Similar results were observed for oligomeric Aβ (Fig. 5d; 4°C 24 h) and fibrillar Aβ (37°C 24 h). Because MSC were reported to secrete various trophic factors [38], we added the protein transport inhibitor Golgistop to the co-culture to block secretion of those factors. The MSC co-culture–induced increase in Aβ uptake was blocked by Golgistop (Fig. 5e).
Fig.5
MSC accelerated microglial clearance of Aβ in vitro. a) MG6 cells were co-cultured with MG6 cells or MSC for 24 h. Amount of Aβ1–42 in MG6 cells was measured before exposure to Aβ [Aβ (–)], after exposure to Aβ for 3 h [Aβ(+)], and 3 h after washout of Aβ (Degradation), using ELISA. MG6 cells were exposed to fluorescent labeled Aβ and MG132 for 15 min. b) Representative images of labeled Aβ taken up by MG6 cells. Scale bar; 20 μm. c–g) Fluorescent intensity of labeled Aβ was analyzed by flowcytometry as Aβ uptake. d) Uptake of monomeric Aβ (HFIP/DMSO), oligomeric Aβ (4°C 24 h) and fibrillar Aβ (37°C 24 h). e) Uptake of Aβ when secretion from MSC was blocked by Golgistop. f) Effect of conditioned medium of MG6 cells (Con) or conditioned medium of MSC (CM) on Aβ uptake by MG6 cells. Conditioned medium was filtered through 100 kDa ultrafiltration filter (100 kDa), 10 kDa ultrafiltration filter (10 kDa), or non-filtered [Filter (–)]. g) Effect of heated conditioned medium (Heat). N.D., not detected; n.s., not significant.
![MSC accelerated microglial clearance of Aβ in vitro. a) MG6 cells were co-cultured with MG6 cells or MSC for 24 h. Amount of Aβ1–42 in MG6 cells was measured before exposure to Aβ [Aβ (–)], after exposure to Aβ for 3 h [Aβ(+)], and 3 h after washout of Aβ (Degradation), using ELISA. MG6 cells were exposed to fluorescent labeled Aβ and MG132 for 15 min. b) Representative images of labeled Aβ taken up by MG6 cells. Scale bar; 20 μm. c–g) Fluorescent intensity of labeled Aβ was analyzed by flowcytometry as Aβ uptake. d) Uptake of monomeric Aβ (HFIP/DMSO), oligomeric Aβ (4°C 24 h) and fibrillar Aβ (37°C 24 h). e) Uptake of Aβ when secretion from MSC was blocked by Golgistop. f) Effect of conditioned medium of MG6 cells (Con) or conditioned medium of MSC (CM) on Aβ uptake by MG6 cells. Conditioned medium was filtered through 100 kDa ultrafiltration filter (100 kDa), 10 kDa ultrafiltration filter (10 kDa), or non-filtered [Filter (–)]. g) Effect of heated conditioned medium (Heat). N.D., not detected; n.s., not significant.](https://ip.ios.semcs.net:443/media/jad/2019/72-3/jad-72-3-jad190817/jad-72-jad190817-g005.jpg)
We next collected conditioned medium from MSC culture for further analyses. Conditioned medium of MSC also enhanced microglial uptake of Aβ [Fig. 5f; Filter (–)]. To exclude extracellular vesicles such as exosomes, we filtered the conditioned medium using a 100 kDa ultrafiltration filter, and the ultrafiltrated conditioned medium still exhibited the effect (Fig. 5f; 100 kDa). However, when the conditioned medium was filtered using a finer filter to exclude most molecules, the conditioned medium lost the effect of enhancing microglial Aβ uptake (Fig. 5f; 10 kDa). Additionally, conditioned medium lost its effect after heating at 95°C for 5 min (Fig. 5g; Heat). These data indicated that secretomes of MSC excluding extracellular vesicles enhanced microglial uptake of Aβ.
MSC transplantation upregulated microglial CD14 expression
We previously reported that microglial CD14 was an important receptor for Aβ uptake [16]. Therefore, we examined microglial CD14 expression in APdE9-MSC mice. CD14-positive microglia were observed around plaques, which is consistent with our previous finding, and the ratio of CD14-positive microglia to total microglia increased significantly in APdE9-MSC mice compared to APdE9-sham (Fig. 6a, b).
Fig.6
MSC treatment upregulated microglial CD14 expression. a) Immunostaining for Iba1 (red) and CD14 (green) in cortex sections from 9-month-old APdE9-sham and APdE9-MSC mice. Nuclei were counterstained with Hoechst 33342 (blue). Arrows indicate CD14-negative microglia, and arrowheads indicate CD14-positive microglia. Radius of dotted circle is 50 μm. Scale bar; 50 μm. b) Ratio of CD14-positive microglia to all microglia around Aβ plaques (n = 33 for both groups). c) Messenger RNA level of CD14 in MG6 cells co-cultured with MG6 cells or MSC. d) Immunoblot of CD14 (top) and GAPDH (bottom). e) Protein level of CD14 in MG6 cells co-cultured with MG6 cells or MSC. f) Knockdown of CD14 by Universal negative control-siRNA (UNC) or CD14-siRNA (CD14). g) Uptake of Aβ by MG6 cells treated with UNC or CD14 siRNA. Twenty-four hours after siRNA treatment, MG6 were co-cultured with MG6 cells or MSC for 24 h and exposed to fluorescent labeled Aβ and MG132 for 15 min.
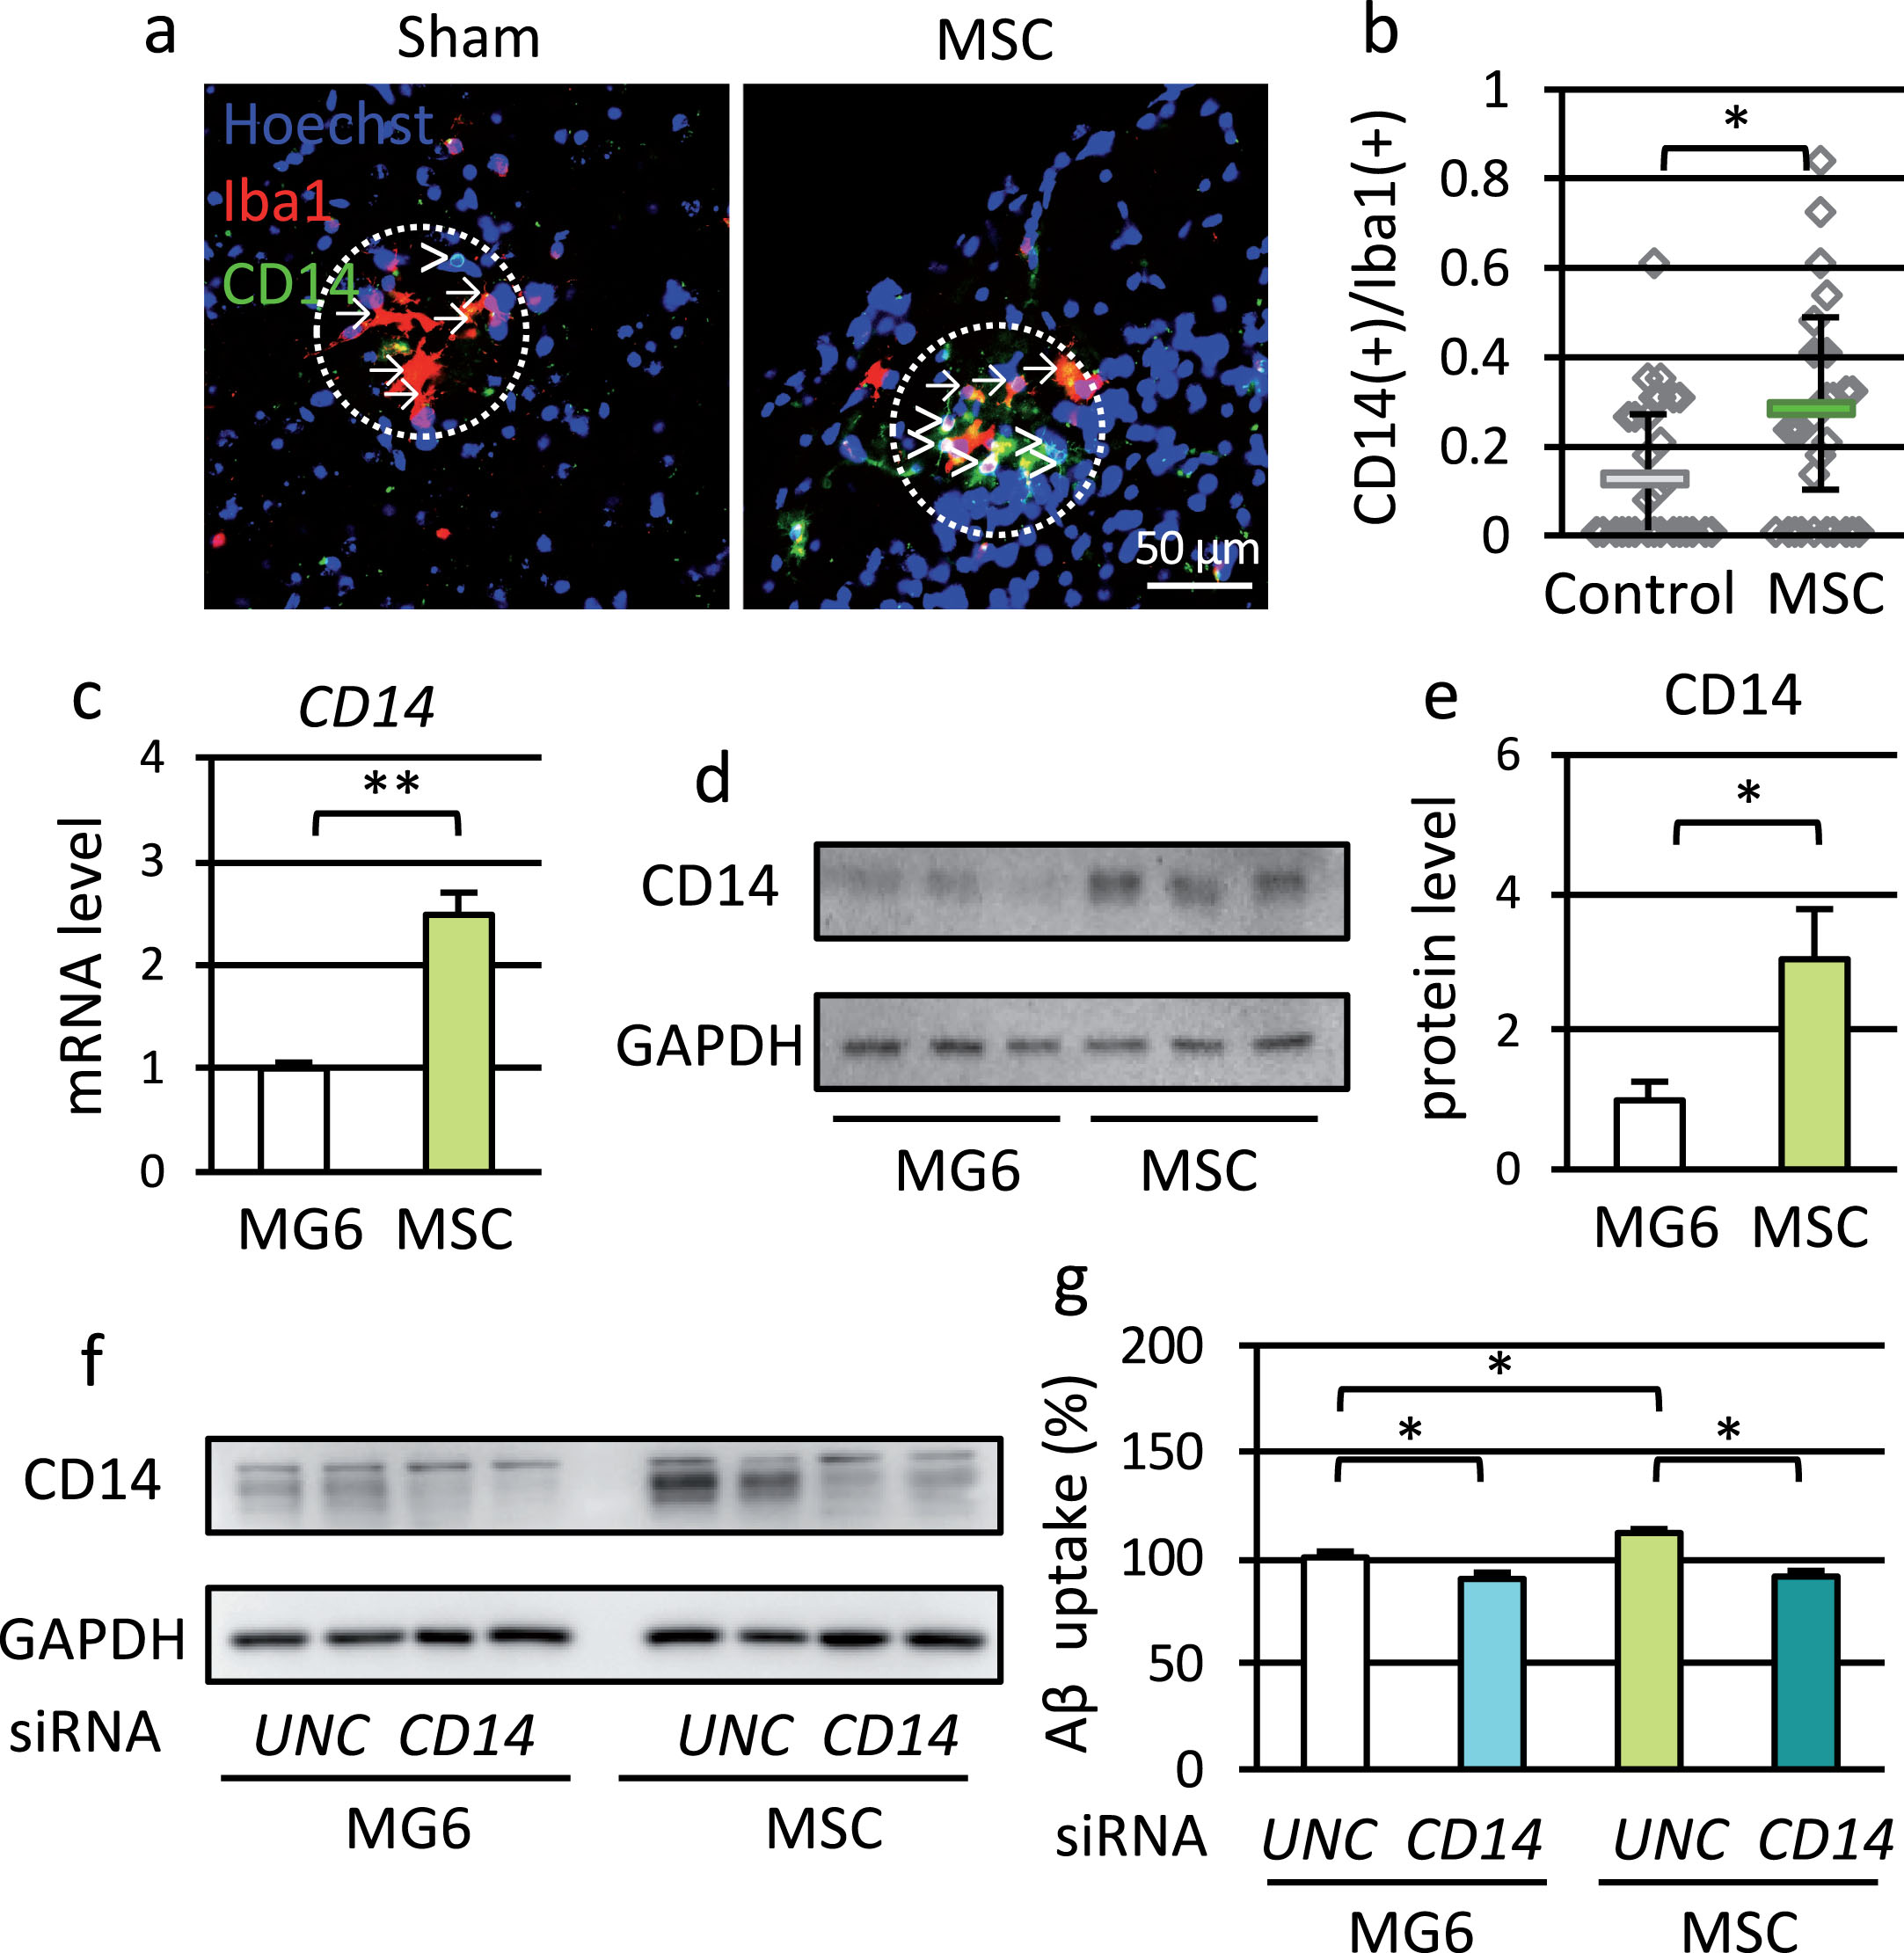
In an in vitro experiment, co-culture of MG6 cells with MSC increased mRNA levels of CD14 (Fig. 6c, Supplementary Figure 5a) and other receptors, TLR2 and SCARA (Supplementary Figure 5b–f). Co-culture with MSC also increased protein level of CD14 (Fig. 6d, e) and the proportion of CD14-positive MG6 cells (Supplementary Figure 5g, h).
To examine whether upregulation of CD14 is one of the main effects of MSC, we knocked down CD14 using siRNA (Fig. 6f), and measured the ability of Aβ uptake (Fig. 6g). In MG6 cells co-cultured with either MG6 cells or MSC, CD14 knockdown suppressed Aβ uptake slightly but significantly. Under CD14 knock-down condition, uptake of Aβ was not changed by co-culture with MSC compared to co-culture with MG6 cells. These data indicated that upregulation of microglial CD14 was one of the mechanisms for improving Aβ clearance by MSC treatment.
MSC treatment modulated microglial phenotype switching from M1 to M2 in vitro
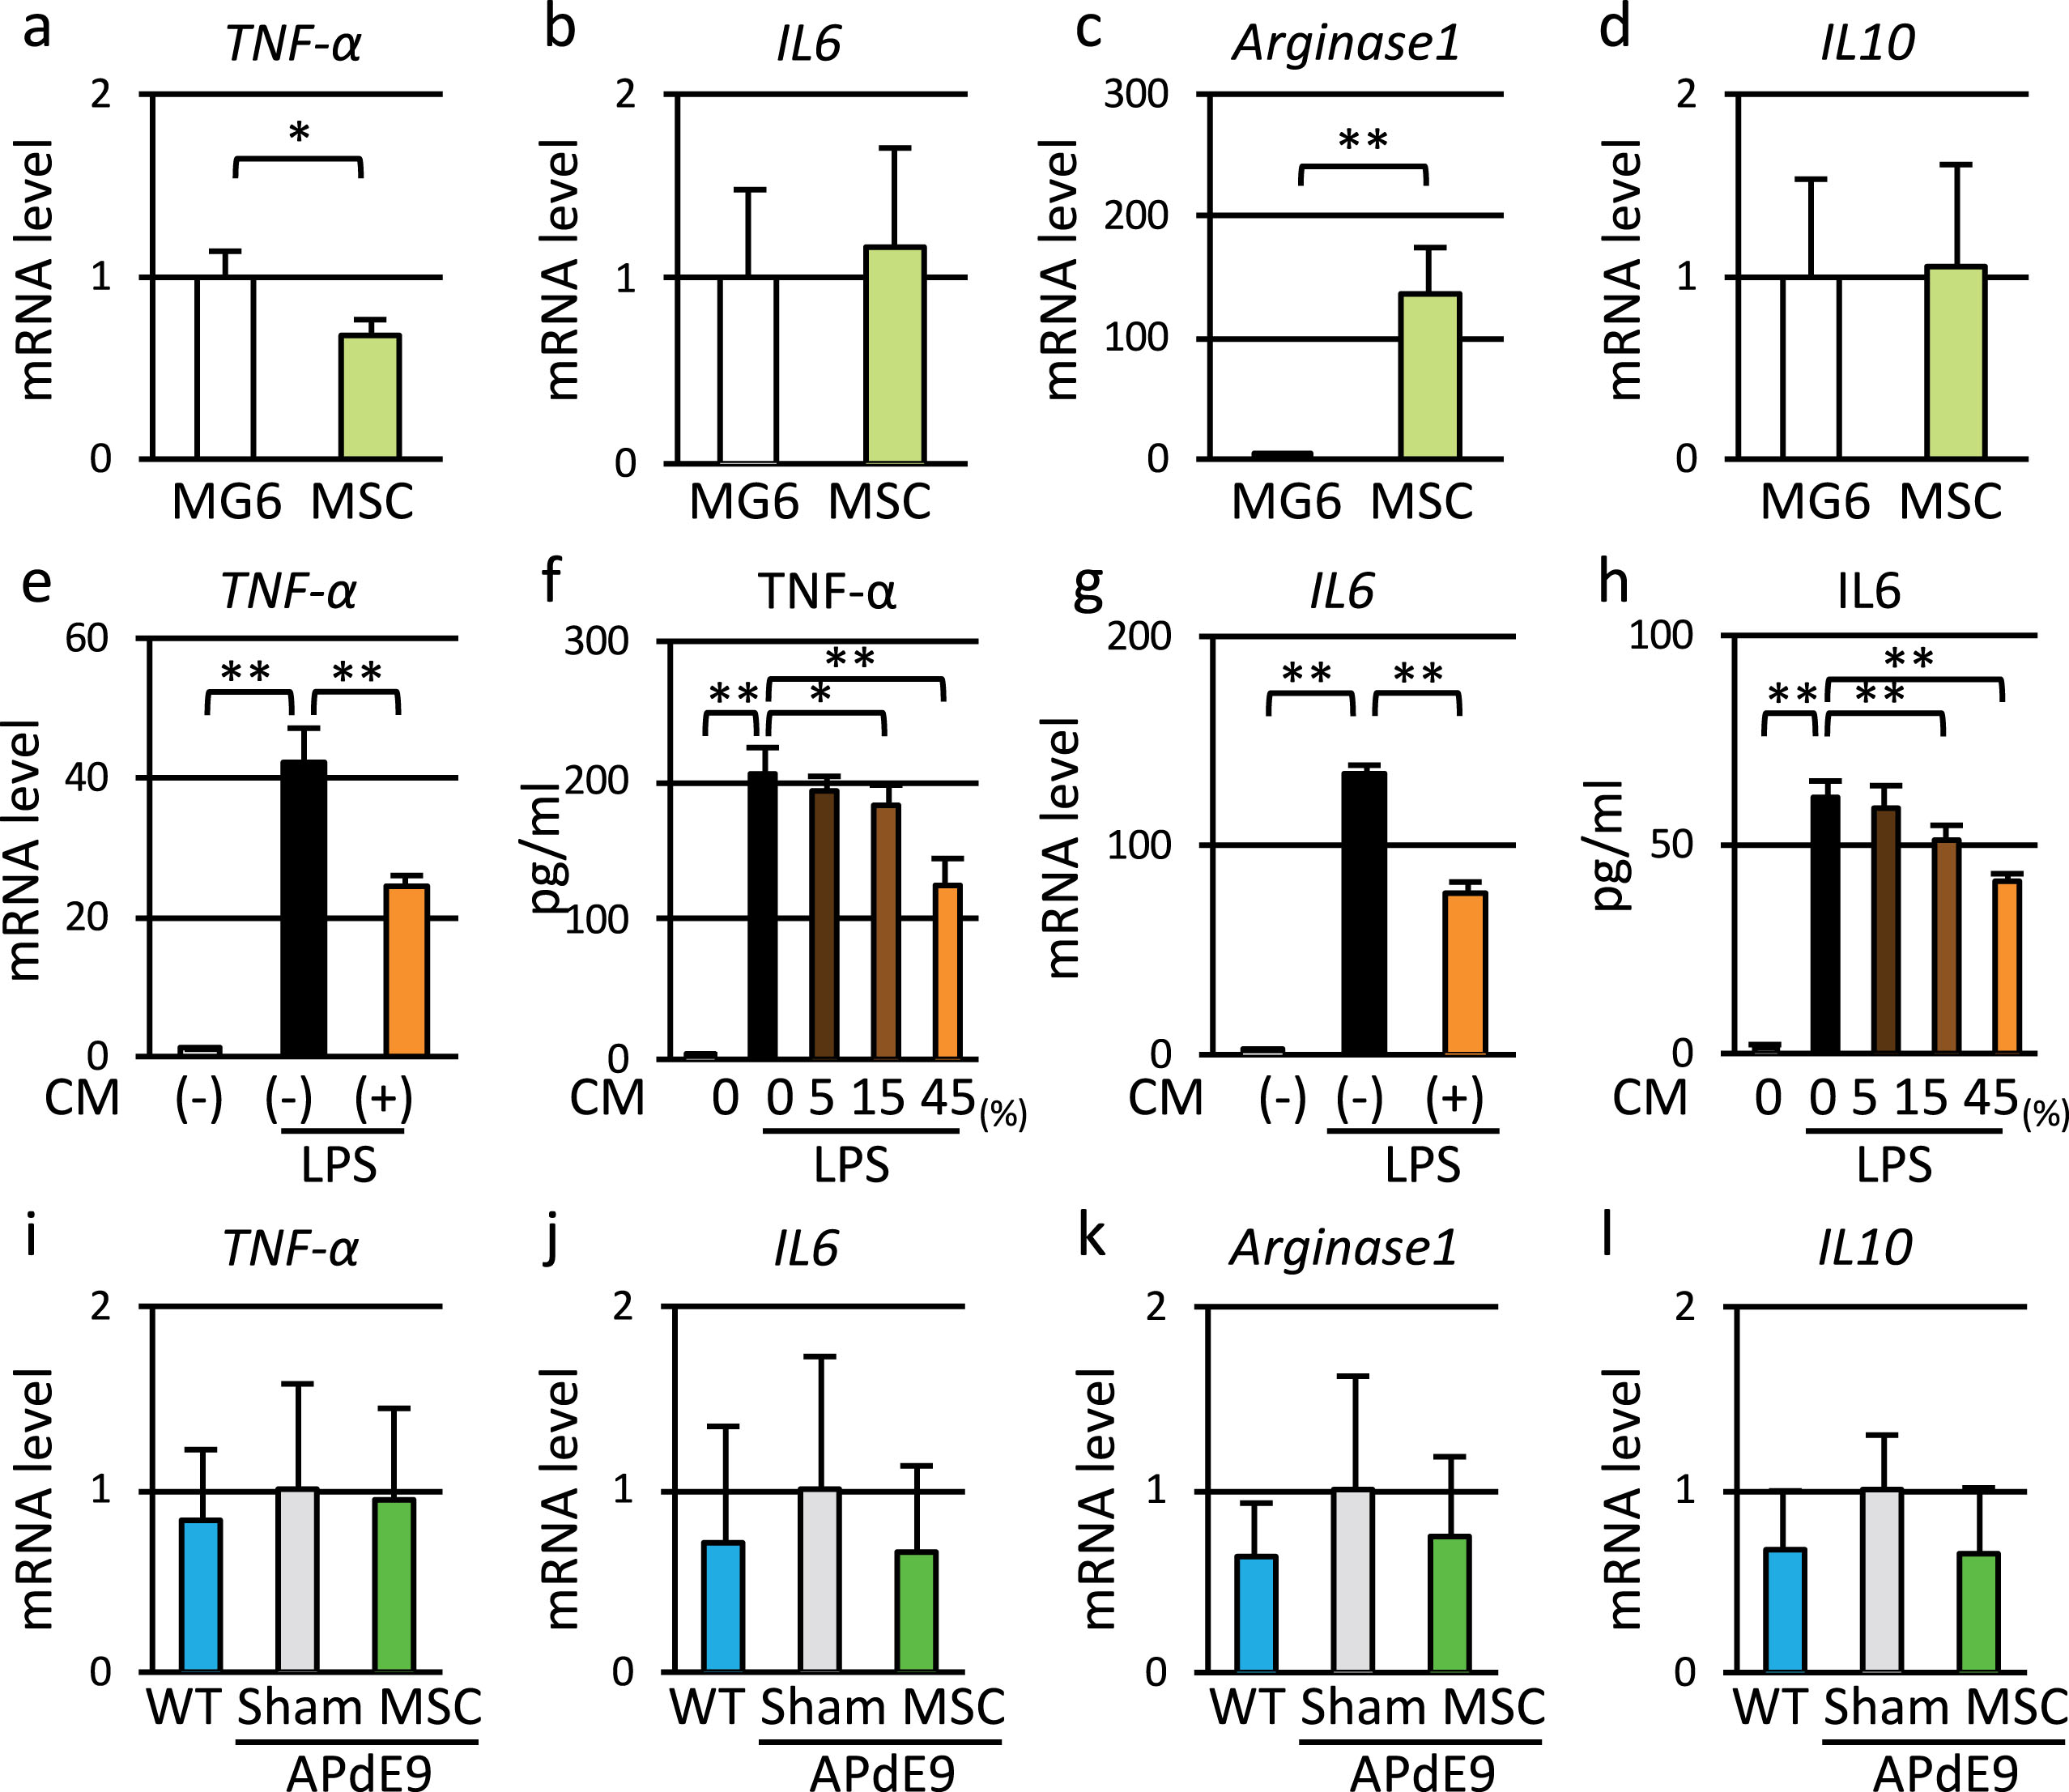
Finally, we measured microglial activity to examine whether upregulation of CD14 promotes microglial M1 polarization. Co-culture with MSC partially changed the expression levels of M1 and M2 marker genes in MG6 cells (Fig. 7a–d). The co-culture slightly reduced expression of the M1 marker TNFα (Fig. 7a) and markedly increased that of the M2 marker arginase1 (Fig. 7c). Additionally, pretreatment of MG6 cells with conditioned medium from MSC suppressed LPS-induced increases in gene and protein expression of TNFα and IL6 (Fig. 7e–h). On the other hand, APdE9 mice given cyclosporine A injection did not show upregulation of M1 genes (Fig. 7i, j). Also, MSC treatment did not change gene expression levels of M1 or M2 markers (Fig. 7i–l). Thus, transplantation of MSC did not exacerbate M1 polarization of microglia or inflammation.
Fig.7
MSC induced M1 to M2 switch of microglia and suppressed production of pro-inflammatory cytokines in vitro. a–d) Expression levels of M1 marker genes (TNF-α and IL6) and M2 marker genes (Arginase1, and IL10) in MG6 cells co-cultured with MG6 cells or MSC. e, g) Expression levels of TNF-α and IL6 genes in MG6 cells stimulated by LPS with or without conditioned medium of MSC (CM). f, h) Secretion of TNF-α and IL6 from MG6 cells stimulated by LPS with or without conditioned medium of MSC. i–l) Expression levels of M1 marker genes and M2 marker genes in vivo.
DISCUSSION
We have previously shown that the redox state of APdE9 mouse brain is impaired at 9 months of age [14]. In the present study, therefore, we transplanted MSC into 7.5-month-old APdE9 mouse and conducted in vivo EPR imaging at 9 months of age. We demonstrated that transplantation of MSC into APdE9 mice improved cognitive function (Fig. 1) and Aβ pathology (Fig. 3), through modulation of microglial functions (Figs. 4–7). Furthermore, we visualized the redox status of mouse brains time-dependently and non-invasively by in vivo EPR imaging technique, and showed for the first time that MSC transplantation improved the unbalanced redox status of APdE9 mouse brains under oxidative stress (Fig. 2).
Several reports have shown that MSC transplantation into AD model animals improves behavioral impairment and Aβ pathology. In previous reports of MSC treatment in AD animal models, various therapeutic mechanisms have been proposed, such as suppressed Aβ production [21], enhanced Aβ degradation [22, 23], suppressed neuroinflammation [22, 24, 25], promoted endogenous neurogenesis [26, 27], and neuronal protection [26]. A combination of various mechanisms is expected to be involved in the therapeutic effect of MSC transplantation.
There are two major administration routes of MSC in AD model animals: direct transplantation into the brain or the intraventricular route, and systemic administration via a vein. Although no study has directly compared the difference in therapeutic effect between the two administration routes, both of them have been reported to be effective to improve cognitive impairment [25, 39]. Intravenous transplantation is considered to be reasonable because of lower invasiveness and greater repeatability compared to intracerebral transplantation. Intravenous MSC have been reported to engraft in the central nervous system in spinal cord injury and stroke animal models [28, 40]. We previously demonstrated transmigration of MSC across brain microvascular endothelial cell monolayers in vitro. In addition, some evidence has indicated that Aβ pathology causes damage to vascular endothelial cells and tight junctions, resulting in impairment of BBB integrity [42, 43].
In the present study, therefore, we initially anticipated that intravenously administered MSC would pass through the BBB to engraft in the brain of AD model mice. Thus, we gave subcutaneous cyclosporine A injections to AD model mice in order to prevent immune rejection of cells that might differentiate into neurons or glial cells after transplantation. However, intravenously transplanted MSC did not engraft in the brain and were detected only in the lung (Supplementary Figure 1). These results suggest that MSC exert therapeutic effect remotely without transition to brain parenchyma. This is supported by our in vitro finding that when co-cultured with microglial cells, not only MSC but also MSC culture supernatant modified the microglial functions (Fig. 5e–g).
In this experiment, we were able to visualize improvement of the undesirable redox status in mouse brain in vivo using EPR imaging. Oxidative stress in mouse brain is caused by an imbalance between reactive oxygen species (ROS) production and anti-oxidant ability to detoxify ROS. Although various biological markers related to oxidative stress have been used in studies of human AD brain and AD animal models, most of them are biological compounds, such as lipids, proteins, and nucleic acids that are wounded by oxidative reaction mediated by ROS. Different from these markers, the EPR imaging method using a nitroxide compound is capable of evaluating and monitoring the redox balance in living animals. Using in vivo EPR imaging system, we previously reported that the redox status of the APdE9 mouse brain was significantly impaired at 9 months of age, accompanied by augmented Aβ accumulation and glial activation [14].
The present study is the first report directly showing the improvement of unbalanced redox state in AD model animal brain by MSC transplantation. In this experiment, MSC transplantation reduced soluble Aβ1–42 levels in APdE9 mouse brain (Fig. 3e). Aβ peptide has been reported to be associated with oxidative stress. In particular, it is known that oxidation of the sulfur moiety of methionine residue at position 35 of Aβ1–42 is closely involved in the production of ROS [44, 45], and that biometals interacting with Aβ peptides may generate ROS [13]. Therefore, these findings suggest that the decrease of Aβ due to MSC transplantation secondarily suppresses ROS production, thereby improving the redox balance. A study showed that human umbilical cord–derived MSC enhanced superoxide dismutase activity in AD model mouse brain [26]. Another in vitro study demonstrated that MSC reduced ROS induced by Aβ oligomer in neurons [46]. Therefore, MSC treatment also may have the potential to enhance antioxidant properties in AD brains. The production of ROS in AD is not only directly attributable to Aβ, but also to mitochondrial damage caused by aging or AD processes. We have previously reported that Aβ accumulates in the mitochondria fraction of APdE9 mice especially in the early stage [47]. Mitochondrial dysfunction induced by Aβ diminishes antioxidant defenses and induces excessive glial inflammatory response. As a result, mitochondrial dysfunction is hypothesized to cause synaptic dysfunction and to be involved in the progression of AD [48, 49]. In vivo redox status of the brain may be a useful biomarker for evaluating disease-modifying treatment of AD, and MSC may be a potentially beneficial treatment targeting oxidative stress.
Given the recent evidence that Aβ oligomer has serious harmful effects with respect to oxidative stress and synaptic damage in the early stage of AD [50], the present results suggest that modifying the amount of soluble Aβ may be the essence of MSC therapy. In our experiment, MSC treatment apparently did not affect the levels of Aβ production or the expression levels of Aβ-degrading enzymes (Supplementary Figure 3). On the other hand, Aβ uptake and degradation by microglia are involved in Aβ clearance. Therefore, we investigated the dynamics of microglia, in particular, the mechanism of Aβ clearance.
In MSC-transplanted APdE9 mouse brain, there was an increase in number of microglia accumulated around Aβ plaques versus size of Aβ deposit (Figs. 4c, d). Condello et al. [51] reported that microglia processes protect adjacent neurites from protofibrilar Aβ toxicity, and that decreased microglial coverage in aging increases neurotoxicity. In addition, we demonstrated an increase in percentage of microglia internalizing Aβ in the peri-plaque region (Fig. 4e, f). In our study, only soluble Aβ42 was reduced by MSC therapy (Fig. 3e), and Aβ-positive area stained by 6E10 antibody was reduced in both cortex and hippocampus. Because 6E10 antibody stains not only the core of Aβ deposition but also oligomeric Aβ around the core [52], microglia may take up neurotoxic soluble Aβ in the periphery of Aβ deposit. We previously reported that CD68 could be a phagocytic marker of microglia in AD model [31], and Kim et al. [22] reported that intravenous injection of human amniotic membrane-derived MSC into AD model mice increased the percentage of CD68-positive microglia among microglia surrounding Aβ plaques. These findings support that MSC treatment promotes Aβ clearance by microglia. We also examined the effect of MSC on Aβ internalization function of microglia in vitro. Some humoral factors contained in the conditioned medium of MSC had the effect of promoting microglial uptake of Aβ in the forms of monomers, oligomers, and fibrils (Fig. 5d). Additionally, the effects tended to be greater for soluble (monomeric and oligomeric) Aβ rather than insoluble Aβ (fibrils). These results suggest that the transplanted MSC enhance soluble Aβ clearance by microglia via extracellular factors and ameliorate Aβ pathology.
There are several mechanisms by which microglia take up various forms of Aβ into the cells, such as phagocytosis, receptor-mediated endocytosis, and pinocytosis [53, 54]. We previously reported that receptor-mediated endocytosis of Aβ through the TLR4/CD14 complex, which is known to be a mediator of Aβ-induced inflammation, is involved in the uptake of fibrillar Aβ by microglia, indicating that microglial CD14 is an important receptor for internalization of Aβ [16]. Because mutation of TLR4 increased soluble Aβ in a mouse model of AD [55] and knockdown of CD14 reduced uptake of monomeric Aβ in vivo (Fig. 6g), the TLR4/CD14 complex may function as a clearance mechanism not only for fibrillar Aβ but also for soluble Aβ. In the present study, MSC transplantation increased the percentage of CD14-positive microglia surrounding amyloid plaques in APdE9 mouse brain (Fig. 6a, b), and MSC treatment increased CD14 expression levels in cultured microglia (Fig. 6c–e). Therefore, MSC transplantation may elevate CD14 in microglia as one of the mechanisms of the soluble Aβ-reducing effect.
However, TLR4/CD14 complex-activated microglia respond to Aβ by secreting chemokines and pro-inflammatory cytokines [55]. To assess whether upregulation of CD14 by MSC treatment accelerates inflammation in AD, we measured mRNA levels of M1 and M2 marker genes. In in vitro assays, co-culture with MSC reduced expression of TNFα and markedly increased that of arginase1 (Fig. 7a–d), and conditioned medium from MSC culture suppressed LPS-induced increases in secretion of TNFα and IL6 (Fig. 7e–h). Th2 cytokines such as TGFβ and IL4 secreted from MSC may switch microglial phenotype to M2 and suppress the production of pro-inflammatory cytokines [56, 57]. This phenotype switching of microglia induced by Th2 cytokines is expected to be beneficial for AD treatment through enhancing Aβ clearance and suppressing inflammation [58, 59]. We previously reported increase in TNFα mRNA level in the microglial fraction from 9-month-old APdE9 mice, and several studies showed upregulation of proinflammatory cytokines in AD patients and AD model animals [15, 60, 61]. However, in the present study, TNFα and IL6 gene expression levels did not increase in APdE9 mice (Fig. 7i, j). Because we used cyclosporine A in all animals, immunosuppression by cyclosporine A may have masked Aβ-stimulated phenotype switching of microglia and Th2 cytokines secreted from MSC.
No component of MSC that has an extracellular therapeutic effect has been identified, however, several studies have shown that secretomes of MSC include anti-inflammatory cytokines, trophic factors and exosomes [62]. Since breakdown of BBB with pericyte and endothelial degeneration occurs in AD patients and model mice, humoral factors might enter the brain parenchyma through BBB [63]. However, we cannot deny the possibility that MSCs suppress immunoreactivity in the peripheral tissue and modulate immune balance of CNS indirectly in vivo.
In the present study, MSC transplantation was performed by single injection via the tail vein, and the pathological therapeutic effect was confirmed at one point 1.5 months after transplantation. When considering clinical application of MSC to AD patients, a question arises as to how long the therapeutic effect of single injection of MSC lasts. If the duration of the therapeutic effect of MSC is clarified, it may be clear whether it is beneficial to repeat MSC transplantation, and how often transplantations need to be repeated for the most efficient treatment. Kim et al. reported that when human amniotic MSC were single-injected into AD model mice, the effects of suppressing inflammatory cytokines in the brain and the effect of modifying microglia activity persisted until 12 weeks after transplantation [22]. Therefore, at least in AD model mice, the therapeutic effect of single MSC transplantation is expected to last in the order of month. It may be related to the following mechanisms: the extracellular factor that contributes to the therapeutic effect released from MSC persists after MSC disappears from the body, or the immunomodulatory effects such as modifying the microglial phenotype are maintained in the order of month. Further experimental investigation is necessary to confirm this point.
The redox state of the brain reflects Aβ pathology, mitochondrial function and glial activation, which may help to evaluate the improvement of pathological condition comprehensively. Also, EPR imaging is able to measure the redox state of the living body noninvasively and repeatedly. Therefore, our data indicate that EPR imaging can provide useful information for monitoring the therapeutic effect of MSC.
In conclusion, transplantation of MSC ameliorated Aβ pathology in AD model mice through modifying Aβ clearance by microglia and improving the unbalanced redox status of the AD model mouse brain, thereby improving cognitive function. In addition, in vivo EPR imaging is a promising tool for monitoring the therapeutic effects of MSC.
ACKNOWLEDGMENTS
This work was supported in part by the Japan Society for the Promotion of Science (JSPS) KAKENHI Grant Numbers JP17K16388 (K.Y.), JP16K19776 (N.I.), JP18K15397 (A.M.), JP17K09783 (S.S.), JP17K07099 (S.H.) and JP16H05279 (S.S.); and the Smoking Research Foundation.
The authors would like to thank Osamu Honmou, MD, PhD for technical advice on the experiments on MSC transplantation.
Authors’ disclosures available online (https://www.j-alz.com/manuscript-disclosures/19-0817r1).
SUPPLEMENTARY MATERIAL
[1] The supplementary material is available in the electronic version of this article: http://dx.doi.org/10.3233/JAD-190817.
REFERENCES
[1] | Perl DP ((2010) ) Neuropathology of Alzheimer’s disease. Mt Sinai J Med 77: , 32–42. |
[2] | Querfurth HW , Laferla FM ((2010) ) Alzheimer’s disease. N Engl J Med 362: , 329–344. |
[3] | Hardy J , Selkoe DJ ((2002) ) The amyloid hypothesis of Alzheimer’s disease: progress and problems on the road to therapeutics. Science 297: , 353–356. |
[4] | Canevari L , Abramov AY , Duchen MR ((2004) ) Toxicity of amyloid beta peptide: tales of calcium, mitochondria, and oxidative stress. Neurochem Res 29: , 637–650. |
[5] | Reddy PH , Beal MF ((2008) ) Amyloid beta, mitochondrial dysfunction and synaptic damage: implications for cognitive decline in aging and Alzheimer’s disease. Trends Mol Med 14: , 45–53. |
[6] | Bharadwaj PR , Dubey AK , Masters CL , Martins RN , MacReadie IG ((2009) ) Abeta aggregation and possible implications in Alzheimer’s disease pathogenesis. J Cell Mol Med 13: , 412–421. |
[7] | Umeda T , Tomiyama T , Sakama N , Tanaka S , Lambert MP , Klein WL , Mori H ((2011) ) Intraneuronal amyloid β oligomers cause cell death via endoplasmic reticulum stress, endosomal/lysosomal leakage, and mitochondrial dysfunction in vivo. J Neurosci Res 89: , 1031–1042. |
[8] | Heneka MT , Carson MJ , El Khoury J , Landreth GE , Brosseron F , Feinstein DL , Jacobs AH , Wyss Coray T , Vitorica J , Ransohoff RM , Herrup K , Frautschy SA , Finsen B , Brown GC , Verkhratsky A , Yamanaka K , Koistinaho J , Latz E , Halle A , Petzold GC , Town T , Morgan D , Shinohara ML , Perry VH , Holmes C , Bazan NG , Brooks DJ , Hunot S , Joseph B , Deigendesch N , Garaschuk O , Boddeke E , Dinarello CA , Breitner JC , Cole GM , Golenbock DT , Kummer MP ((2015) ) Neuroinflammation in Alzheimer’s disease. Lancet Neurol 14: , 388–405. |
[9] | Gilbert BJ ((2013) ) The role of amyloid β in the pathogenesis of Alzheimer’s disease. J Clin Pathol 66: , 362–366. |
[10] | Butterfield DA , Boyd Kimball D ((2004) ) Amyloid beta-peptide(1-42) contributes to the oxidative stress and neurodegeneration found in Alzheimer disease brain. Brain Pathol 14: , 426–432. |
[11] | Li J , O W , Li W , Jiang Z-G , Ghanbari HA ((2013) ) Oxidative stress and neurodegenerative disorders. Int J Mol Sci 14: , 24438–24475. |
[12] | Atwood CS , Perry G , Zeng H , Kato Y , Jones WD , Ling K-Q , Huang X , Moir RD , Wang D , Sayre LM , Smith MA , Chen SG , Bush AI ((2004) ) Copper mediates dityrosine cross-linking of Alzheimer’s amyloid-beta. Biochemistry 43: , 560–568. |
[13] | Tõugu V , Tiiman A , Palumaa P ((2011) ) Interactions of Zn(II) and Cu(II) ions with Alzheimer’s amyloid-beta peptide. Metal ion binding, contribution to fibrillization and toxicity. Metallomics 3: , 250–261. |
[14] | Matsumura A , Emoto MC , Suzuki S , Iwahara N , Hisahara S , Kawamata J , Suzuki H , Yamauchi A , Sato Akaba H , Fujii HG , Shimohama S ((2015) ) Evaluation of oxidative stress in the brain of a transgenic mouse model of Alzheimer disease by in vivo electron paramagnetic resonance imaging. Free Radic Biol Med 85: , 165–173. |
[15] | Iwahara N , Hisahara S , Kawamata J , Matsumura A , Yokokawa K , Saito T , Fujikura M , Manabe T , Suzuki H , Matsushita T , Suzuki S , Shimohama S ((2017) ) Role of suppressor of cytokine signaling 3 (SOCS3) in altering activated microglia phenotype in APPswe/PS1dE9 mice. J Alzheimers Dis 55: , 1235–1247. |
[16] | Fujikura M , Iwahara N , Hisahara S , Kawamata J , Matsumura A , Yokokawa K , Saito T , Manabe T , Matsushita T , Suzuki S , Shimohama S ((2019) ) CD14 and Toll-like receptor 4 promote fibrillar Aβ42 uptake by microglia through A clathrin-mediated pathway. J Alzheimers Dis 68: , 323–337. |
[17] | Woodbury D , Schwarz EJ , Prockop DJ , Black IB ((2000) ) Adult rat and human bone marrow stromal cells differentiate into neurons. J Neurosci Res 61: , 364–370. |
[18] | Dezawa M , Kanno H , Hoshino M , Cho H , Matsumoto N , Itokazu Y , Tajima N , Yamada H , Sawada H , Ishikawa H , Mimura T , Kitada M , Suzuki Y , Ide C ((2004) ) Specific induction of neuronal cells from bone marrow stromal cells and application for autologous transplantation. J Clin Invest 113: , 1701–1710. |
[19] | Suzuki S , Kawamata J , Iwahara N , Matsumura A , Hisahara S , Matsushita T , Sasaki M , Honmou O , Shimohama S ((2015) ) Intravenous mesenchymal stem cell administration exhibits therapeutic effects against 6-hydroxydopamine-induced dopaminergic neurodegeneration and glial activation in rats. Neurosci Lett 584: , 276–281. |
[20] | Wang S-S , Jia J , Wang Z ((2018) ) Mesenchymal stem cell-derived extracellular vesicles suppresses iNOS expression and ameliorates neural impairment in Alzheimer’s disease mice. J Alzheimers Dis 61: , 1005–1013. |
[21] | Yun HM , Kim HS , Park KR , Shin JM , Kang AR , Il Lee K , Song S , Kim YB , Han SB , Chung HM , Hong JT ((2013) ) Placenta-derived mesenchymal stem cells improve memory dysfunction in an Aβ1-42-infused mouse model of Alzheimer’s disease. Cell Death Dis 4: , e958. |
[22] | Kim K-S , Kim HS , Park J-M , Park M-K , Lee H-S , Lim DS , Lee TH , Chopp M , Moon J ((2013) ) Long-term immunomodulatory effect of amniotic stem cells in an Alzheimer’s disease model. Neurobiol Aging 34: , 2408–2420. |
[23] | Kim S , Chang K-A , Kim JA , Park H-G , Ra JC , Kim H-S , Suh Y-H ((2012) ) The preventive and therapeutic effects of intravenous human adipose-derived stem cells in Alzheimer’s disease mice. PLoS One 7: , e45757. |
[24] | Xie Z-H , Liu Z , Zhang X-R , Yang H , Wei L-F , Wang Y , Xu S-L , Sun L , Lai C , Bi J-Z , Wang X-Y ((2016) ) Wharton’s Jelly-derived mesenchymal stem cells alleviate memory deficits and reduce amyloid-β deposition in an APP/PS1 transgenic mouse model. Clin Exp Med 16: , 89–98. |
[25] | Naaldijk Y , Jäger C , Fabian C , Leovsky C , Blüher A , Rudolph L , Hinze A , Stolzing A ((2017) ) Effect of systemic transplantation of bone marrow-derived mesenchymal stem cells on neuropathology markers in APP/PS1 Alzheimer mice. Neuropathol Appl Neurobiol 43: , 299–314. |
[26] | Cui Y , Ma S , Zhang C , Cao W , Liu M , Li D , Lv P , Xing QU , Qu R , Yao N , Yang BO , Guan F ((2017) ) Human umbilical cord mesenchymal stem cells transplantation improves cognitive function in Alzheimer’s disease mice by decreasing oxidative stress and promoting hippocampal neurogenesis. Behav Brain Res 320: , 291–301. |
[27] | Oh SH , Kim HN , Park H-J , Shin JY , Lee PH ((2015) ) Mesenchymal stem cells increase hippocampal neurogenesis and neuronal differentiation by enhancing the Wnt signaling pathway in an Alzheimer’s disease model. Cell Transplant 24: , 1097–1109. |
[28] | Morita T , Sasaki M , Kataoka Sasaki Y , Nakazaki M , Nagahama H , Oka S , Oshigiri T , Takebayashi T , Yamashita T , Kocsis JD , Honmou O ((2016) ) Intravenous infusion of mesenchymal stem cells promotes functional recovery in a model of chronic spinal cord injury. Neuroscience 335: , 221–231. |
[29] | Emoto MC , Sato Akaba H , Hirata H , Fujii HG ((2014) ) Dynamic changes in the distribution and time course of blood-brain barrier-permeative nitroxides in the mouse head with EPR imaging: visualization of blood flow in a mouse model of ischemia. Free Radic Biol Med 74: , 222–228. |
[30] | Jiao Y , Sun Z , Lee T , Fusco FR , Kimble TD , Meade CA , Cuthbertson S , Reiner A ((1999) ) A simple and sensitive antigen retrieval method for free-floating and slide-mounted tissue sections. J Neurosci Methods 93: , 149–162. |
[31] | Matsumura A , Suzuki S , Iwahara N , Hisahara S , Kawamata J , Suzuki H , Yamauchi A , Takata K , Kitamura Y , Shimohama S ((2015) ) Temporal changes of CD68 and α7 nicotinic acetylcholine receptor expression in microglia in Alzheimer’s disease-like mouse models. J Alzheimers Dis 44: , 409–423. |
[32] | Takata K , Kitamura Y , Saeki M , Terada M , Kagitani S , Kitamura R , Fujikawa Y , Maelicke A , Tomimoto H , Taniguchi T , Shimohama S ((2010) ) Galantamine-induced amyloid-beta clearance mediated via stimulation of microglial nicotinic acetylcholine receptors. J Biol Chem 285: , 40180–40191. |
[33] | Kawarabayashi T , Younkin LH , Saido TC , Shoji M , Ashe KH , Younkin SG ((2001) ) Age-dependent changes in brain, CSF, and plasma amyloid (beta) protein in the Tg2576 transgenic mouse model of Alzheimer’s disease. J Neurosci 21: , 372–381. |
[34] | Stine WB , Jungbauer L , Yu C , Ladu MJ ((2011) ) Preparing synthetic Aβ in different aggregation states. Methods Mol Biol 670: , 13–32. |
[35] | Nakamichi K , Saiki M , Kitani H , Kuboyama Y , Morimoto K , Takayama Ito M , Kurane I ((2006) ) Suppressive effect of simvastatin on interferon-beta-induced expression of CC chemokine ligand 5 in microglia. Neurosci Lett 407: , 205–210. |
[36] | Takenouchi T , Ogihara K , Sato M , Kitani H ((2005) ) Inhibitory effects of U73122 and U73343 on Ca2 influx and pore formation induced by the activation of P2X7 nucleotide receptors in mouse microglial cell line. Biochim Biophys Acta 1726: , 177–186. |
[37] | Mandrekar S , Jiang Q , Lee CYD , Koenigsknecht Talboo J , Holtzman DM , Landreth GE ((2009) ) Microglia mediate the clearance of soluble Abeta through fluid phase macropinocytosis. J Neurosci 29: , 4252–4262. |
[38] | Hamada H , Kobune M , Nakamura K , Kawano Y , Kato K , Honmou O , Houkin K , Matsunaga T , Niitsu Y ((2005) ) Mesenchymal stem cells (MSC) as therapeutic cytoreagents for gene therapy. Cancer Sci 96: , 149–156. |
[39] | Lee JK , Jin HK , Endo S , Schuchman EH , Carter JE , Bae J-S ((2010) ) Intracerebral transplantation of bone marrow-derived mesenchymal stem cells reduces amyloid-beta deposition and rescues memory deficits in Alzheimer’s disease mice by modulation of immune responses. Stem Cells 28: , 329–343. |
[40] | Sasaki Y , Sasaki M , Kataoka Sasaki Y , Nakazaki M , Nagahama H , Suzuki J , Tateyama D , Oka S , Namioka T , Namioka AI , Onodera R , Mikami T , Wanibuchi M , Kakizawa M , Ishiai S , Kocsis JD , Honmou O ((2016) ) Synergic effects of rehabilitation and intravenous infusion of mesenchymal stem cells after stroke in rats. Phys Ther 96: , 1791–1798. |
[41] | Matsushita T , Kibayashi T , Katayama T , Yamashita Y , Suzuki S , Kawamata J , Honmou O , Minami M , Shimohama S ((2011) ) Mesenchymal stem cells transmigrate across brain microvascular endothelial cell monolayers through transiently formed inter-endothelial gaps. Neurosci Lett 502: , 41–45. |
[42] | Carrano A , Hoozemans JJM , van der Vies SM , Rozemuller AJM , Van Horssen J , De Vries HE ((2011) ) Amyloid Beta induces oxidative stress-mediated blood-brain barrier changes in capillary amyloid angiopathy. Antioxid Redox Signal 15: , 1167–1178. |
[43] | Marco S , Skaper SD ((2006) ) Amyloid beta-peptide1-42 alters tight junction protein distribution and expression in brain microvessel endothelial cells. Neurosci Lett 401: , 219–224. |
[44] | Hou L , Lee H-G , Han F , Tedesco JM , Perry G , Smith MA , Zagorski MG ((2013) ) Modification of amyloid-β1-42 fibril structure by methionine-35 oxidation. J Alzheimers Dis 37: , 9–18. |
[45] | Butterfield DA , Galvan V , Lange MB , Tang H , Sowell RA , Spilman P , Fombonne J , Gorostiza O , Zhang J , Sultana R , Bredesen DE ((2010) ) In vivo oxidative stress in brain of Alzheimer disease transgenic mice: Requirement for methionine 35 in amyloid beta-peptide of APP. Free Radic Biol Med 48: , 136–144. |
[46] | De Godoy MA , Saraiva LM , de Carvalho LRP , Vasconcelos-Dos-Santos A , Beiral HJV , Ramos AB , Silva LRdP , Leal RB , Monteiro VHS , Braga CV , de Araujo-Silva CA , Sinis LC , Bodart Santos V , Kasai Brunswick TH , Alcantara CdL , Lima APCA , da Cunha-E Silva NL , Galina A , Vieyra A , De Felice FG , Mendez Otero R , Ferreira ST ((2018) ) Mesenchymal stem cells and cell-derived extracellular vesicles protect hippocampal neurons from oxidative stress and synapse damage induced by amyloid-β oligomers. J Biol Chem 293: , 1957–1975. |
[47] | Manabe T , Matsumura A , Yokokawa K , Saito T , Fujikura M , Iwahara N , Matsushita T , Suzuki S , Hisahara S , Kawamata J , Suzuki H , Emoto MC , Fujii HG , Shimohama S ((2019) ) Evaluation of mitochondrial oxidative stress in the brain of a transgenic mouse model of Alzheimer’s disease by in vitro electron paramagnetic resonance spectroscopy. J Alzheimers Dis 67: , 1079–1087. |
[48] | Tönnies E , Trushina E ((2017) ) Oxidative stress, synaptic dysfunction, and Alzheimer’s disease. J Alzheimers Dis 57: , 1105–1121. |
[49] | Wang X , Wang W , Li LI , Perry G , Lee H-G , Zhu X ((2014) ) Oxidative stress and mitochondrial dysfunction in Alzheimer’s disease. Biochim Biophys Acta 1842: , 1240–1247. |
[50] | Ferreira ST , Lourenco MV , Oliveira MM , De Felice FG ((2015) ) Soluble amyloid-β oligomers as synaptotoxins leading to cognitive impairment in Alzheimer’s disease. Front Cell Neurosci 9: , 191. |
[51] | Condello C , Yuan P , Schain A , Grutzendler J ((2015) ) Microglia constitute a barrier that prevents neurotoxic protofibrillar Aβ42 hotspots around plaques. Nat Commun 6: , 6176. |
[52] | Tammineni P , Ye X , Feng T , Aikal D , Cai Q ((2017) ) Impaired retrograde transport of axonal autophagosomes contributes to autophagic stress in Alzheimer’s disease neurons.. eLife 6: , e21776. |
[53] | Napoli I , Neumann H ((2009) ) Microglial clearance function in health and disease. Neuroscience 158: , 1030–1038. |
[54] | Lee CYD , Landreth GE ((2010) ) The role of microglia in amyloid clearance from the AD brain. J Neural Transm 117: , 949–960. |
[55] | Song M , Jin J , Lim J-E , Kou J , Pattanayak A , Rehman JA , Kim H-D , Tahara K , Lalonde R , Fukuchi K-I ((2011) ) TLR4 mutation reduces microglial activation, increases Aβ deposits and exacerbates cognitive deficits in a mouse model of Alzheimer’s disease. J Neuroinflammation 8: , 92. |
[56] | Park HJ , Oh SH , Kim HN , Jung YJ , Lee PH ((2016) ) Mesenchymal stem cells enhance α-synuclein clearance via M2 microglia polarization in experimental and human parkinsonian disorder. Acta Neuropathol 132: , 685–701. |
[57] | Yoo S-W , Chang D-Y , Lee H-S , Kim G-H , Park J-S , Ryu B-Y , Joe E-H , Lee Y-D , Kim S-S , Suh Kim H ((2013) ) Immune following suppression mesenchymal stem cell transplantation in the ischemic brain is mediated by TGF-β. Neurobiol Dis 58: , 249–257. |
[58] | Shimizu E , Kawahara K , Kajizono M , Sawada M , Nakayama H ((2008) ) IL-4-induced selective clearance of oligomeric beta-amyloid peptide(1-42) by rat primary type 2 microglia. J Immunol 181: , 6503–6513. |
[59] | Szczepanik AM , Funes S , Petko W , Ringheim GE ((2001) ) IL-4, IL-10 and IL-13 modulate A beta(1-42)-induced cytokine and chemokine production in primary murine microglia and a human monocyte cell line. J Neuroimmunol 113: , 49–62. |
[60] | Forloni G , Balducci C ((2018) ) Alzheimer’s disease, oligomers, and inflammation. J Alzheimers Dis 62: , 1261–1276. |
[61] | Heppner FL , Ransohoff RM , Becher B ((2015) ) Immune attack: the role of inflammation in Alzheimer disease. Nat Rev Neurosci 16: , 358–372. |
[62] | Ferreira JR , Teixeira GQ , Santos SG , Barbosa MA , Almeida Porada G , Gonçalves RM ((2018) ) Mesenchymal stromal cell secretome: influencing therapeutic potential by cellular pre-conditioning. Front Immunol 9: , 2837. |
[63] | Sweeney MD , Sagare AP , Zlokovic BV ((2018) ) Blood-brain barrier breakdown in Alzheimer disease and other neurodegenerative disorders. Nat Rev Neurosci 14: , 133–150. |


