
The Pathology of Rapid Cognitive Decline in Clinically Diagnosed Alzheimer’s Disease
Abstract
Background:
Variable rate of cognitive decline among individuals with Alzheimer’s disease (AD) is an important consideration for disease management, but risk factors for rapid cognitive decline (RCD) are without consensus.
Objective:
To investigate demographic, clinical, and pathological differences between RCD and normal rates of cognitive decline (NCD) in AD.
Methods:
Neuropsychology test and autopsy data was pulled from the National Alzheimer’s Coordinating Center database from individuals with a clinical diagnosis of AD. Individuals with average decline of 3 or more points on the Mini-Mental Status Examination (MMSE) per year over 3 years were labeled RCD; all others were NCD.
Results:
Sixty individuals identified as RCD; 230 as NCD. These neuropsychology tests differed at baseline (RCD versus NCD): WMS-LM Immediate Recall (4.35[3.39] versus 6.31[3.97], p < 0.001), Animal Naming (12.1[4.83] versus 13.9[4.83], p = 0.007), TMT Part B (187[86.1] versus 159[79.0], p = 0.02), WAIS-Digit Symbol (29.5[11.3] versus 29.5[11.3], p = 0.04), and the BNT (21.5[7.05] versus 23.6[5.09], p = 0.04). RCD had more thyroid disease (30% versus 16%, p = 0.01) and greater usage of AD medication at baseline (80% versus 62%, p = 0.01). RCD had more severe cerebral amyloid angiopathy (1.62[1.0] versus 1.13[1.0], p = 0.002), more neocortical Lewy bodies (20% versus 10%, p = 0.04), and more atrophy (1.54[0.92] versus 1.17[0.83], p = 0.04). A model combining select variables was significant above chance (χ2 = 25.8, p = 0.002), but not to clinical utility (AUC < 0.70; 95% CI).
Conclusion:
Individuals with RCD have more severe pathology, more comorbidities, and lower baseline neuropsychology test scores of language and executive function.
INTRODUCTION
Alzheimer’s disease (AD) is the most common neurodegenerative disease of the central nervous system. Without the development of more effective treatments, the immense financial and emotional impact of this disease is predicted to dramatically worsen over the next several decades [1]. One of the most important problems impacting the management of AD is the variable rate of cognitive decline among patients [2].
Individuals with AD typically decline at a steady but slow rate, losing 1 point per year on the Mini-Mental Status Examination (MMSE) [3]. However, prior work has shown that 1/3 of individuals with AD decline at an accelerated rate, losing 3 or more points on the MMSE every year [4]. Individuals in this group are frequently labelled as having rapid cognitive decline (RCD). Identifying an individual as RCD is important because it is associated with worse functional outcomes [5] and higher mortality [6] than those with normal rates of cognitive decline (NCD). Additionally, the current inability to distinguish RCD in clinical trials increases the likelihood of a false negative outcome (type II error) [7].
Though risk factors are without consensus, prior research has shown onset before age 75 [6, 8, 9], higher levels of education [3, 9, 10], lower baseline cognition [8], and the presence of neuropsychiatric symptoms such as depression, anxiety, and psychosis [2, 11] to be associated with RCD. Other tools such as neuropsychology testing, apolipoprotein E (APOE) genotyping, transactive response DNA binding protein-43 (TDP-43) characterization, and disease comorbidity (autoimmune disease, cardiovascular disease, and medication burden) vary in their predictive abilities of cognitive trajectory [11, 12].
Drawing firm conclusions from previous RCD research is problematic because most studies have relied solely on clinical diagnoses. Misdiagnosis rates of AD are high (20–40%), even in top dementia centers [13]. Thus, postmortem data are required to understand both the underlying pathology and clinical characteristics of RCD.
Autopsy confirmation of AD remains the “gold standard” for the diagnosis and is essential in the identification of comorbidities. The Neuropathology Data Set (NP) is derived from former and current participating Alzheimer's disease Centers (ADC) in accordance to standards set by the National Alzheimer's Coordinating Center (NACC) at the University of Washington, an important NIA-funded data repository of autopsy-confirmed AD and related dementia cases as well as cognitively normal participants [14, 15]. At the time that we obtained data, the NP included more than 4,000 individuals. To date, no large autopsy sample has been assessed for RCD using data on cognitive status and clinical characteristics.
In this study, data from NACC were used to investigate and compare the demographic, clinical, and neuropathological differences between RCD and NCD. We hypothesized differences between groups in demographic profile (particularly age at disease onset and education), baseline cognitive functioning, neuropsychiatric symptoms, AD pathology, and the number of medical comorbidities. We further aimed to identify unique characteristics present at baseline ADC visit that could be predictive of RCD.
METHODS
Participants
Data were requested from the NACC Database (visits conducted between September 2005 and March 2017). The NACC data sets used for this study were the Uniform Data Set (UDS), the NP Data Set, and the Genetic Data Set (RDD-Gen). Participants from NACC who had a total MMSE score between 12–30 at the initial visit, a presumptive etiological diagnosis of AD at the initial visit, and at least three visits with the UDS neuropsychology test battery were included. Participants unable to meet these criteria were excluded. The NACC dataset is fully de-identified, and all participants had provided written informed consent at their ADC, as approved by local institutional review boards [15].
Demographic information and clinical data
Clinical data from the NACC database were obtained from all participants meeting our above extraction criteria. This information included demographic information (age at initial visit, sex, race, level of education, age at cognitive onset, and age at death), baseline MMSE score, and clinical health history (variables of cardiovascular disease, autoimmune disease, psychiatric measures, and medications).
Neuropathological and genetic data
Pathologically determined AD was ascertained by creating a variable combining two NACC variables of amyloid plaques and tau proteins, ranked in severity by CERAD (C score) and Braak Stage (B score), respectively [16]. C Score ranks the density of neuritic plaques (neuron fragments surrounding amyloid-β protein) while B Score measures the cortical distribution of neurofibrillary tangles (aggregates of hyperphosphorylated tau proteins). Plaque and tangle scores in the NP database were derived according to the NIA–Reagan Institute criteria [17]. Pathologically verified AD was defined as a C score of C2 or higher combined with a B score of B2 (stage III) or higher [18]. Defining pathologically verified AD also allowed for the retrospective comparison of the pathological profile of a clinically diagnosed AD sample with a pathologically confirmed subset.
Variables of cerebral amyloid angiopathy, Lewy body distribution, atrophy (cerebral cortical atrophy measured 0–3 in severity and lobar atrophy measured as present/absent), multiple pathology and vascular pathology count variables, TDP-43, and APOE ɛ4 status were also compared between groups. It should be noted that some of these data points were not collected until Version10 of the NP database, leading to only a subset of individuals having this data.
Pathologically verified AD was defined by creating a binary variable (1 = C Score of C2 and B Score of B2 (or stage III) or higher; 0 = not meeting this criteria). Count variables of cerebrovascular disease and “other” pathologies were created to assess for burden of cerebrovascular disease and multiple pathologies.
Neuropsychological tests
Tests selected from the UDS neuropsychology test battery are as follows: MMSE, Wechsler Memory Scale-Revised Logical Memory Ia Story Units Recalled and Logical Memory IIa-Delayed Story Units Recalled, the Boston Naming Test (total raw), Animal Naming Test and Vegetable Naming (total raw), Digit Span forwards and backwards (trials correct), Trail Making Test Part A and B (seconds to complete), and the Wechsler Adult Intelligence Scale-Revised Digit Symbol test (total raw). The test selection identified tests across cognitive domains.
Classification of groups
Participants were classified into two different groups based on a progressive loss of points on the MMSE. Consistent with prior research, individuals were categorized as experiencing RCD if they had an average decline of ≥3 points on the MMSE per year over their first three ADC clinic visits; individuals who did not experience such loss were categorized as experiencing NCD [12].
Statistical analyses
We compared participant demographic, clinical history, and pathological data between groups using Chi-square tests for categorical variables, and independent-samples t-tests for continuous variables.
Subsequently, in order to identify potential independent baseline predictors of RCD, we constructed a multivariable logistic regression model using group membership as the outcome of interest. Independent predictors included in the model were determined in accordance with individual variable significance coupled with previous research on traits predictive of rapid decline in AD. Demographic factors, neuropsychology testing, and disease characteristics were added to the model in congruence with our stated hypothesis as described below:
Demographic factors of education, sex, and age were added to the model despite individual insignificance due to their correlation with neuropsychology testing.
We inspected statistically significant neuropsychological tests for multicollinearity as this could be problematic in the predictive model. Raw scores on the Wechsler Memory Scale-Revised Logical Memory Ia Story Units Recalled, the Animal Naming Test, and Trail Making Test Part B were included due to their significant baseline differences between groups and their relatively low collinearity.
Thyroid disease was included as a significant autoimmune disease measure that has also been cited in previous research as an indicator of worse cognitive trajectory [19, 20] along with neuropsychiatric measures of depression and nighttime behaviors (defined as presence versus absence from the Neuropsychiatric Inventory Questionnaire, NPI-Q [22]) added due to the frequent occurrence of these symptoms in Lewy body disease (LBD) and AD, respectively [21].
Statistical significance was established throughout at p < 0.05 All statistical analyses were performed with the use of SPSS (version 23.0).
RESULTS
Participant demographics and clinical data
This study included 290 participants clinically diagnosed with AD at their initial visit, 230 of which were classified as NCD, and 60 of which were classified as RCD. Those classified as NCD had a mean MMSE decline of 0.94 (SD:0.94) points per year, ranging from a loss of 2.67 points per year to a gain of 1.67 points per year, with mode loss of 0.66 points per year. Those classified as RCD had a mean MMSE decline of 4.28 (SD:1.23) points per year, ranging from a loss of 8 points per year to a loss of 3 points per year, with mode loss of 3.33 points per year. MMSE at initial ADC visit did not differ significantly between groups.
Time from initial diagnosis to death was significantly different between RCD and NCD, but other demographic variables did not differ significantly (Table 1.1).
Table 1.1
Participant Demographicsa
| Characteristics | NCD (n = 230) | RCD (n = 60) | p |
| Mean Number of Visits, y | 5.95 | 5.23 | |
| Age at Initial Visit, mean (SD), y | 79.0 (7.88) | 78.5 (8.08) | 0.64 |
| Sex, No. (%) | |||
| Women | 85 (37.0) | 22 (36.7) | 0.97 |
| Men | 145 (63.0) | 38 (63.3) | |
| Race, No. (%) | |||
| White (%) | 216 (93.9) | 53 (88.3) | 0.14 |
| Non-white (%) | 14 (6.09) | 7 (11.7) | |
| Education, mean (SD), y | 15.5 (2.82) | 15.5 (2.98) | 0.92 |
| Time to death after initial visit, bmean (SD), y | 6.43 (1.73) | 5.70 (1.76) | 0.004 |
| Cognitionc | |||
| Physician assessed age at cognitive onset, mean (SD), y | 73.4 (8.25) | 73.2 (7.98) | 0.82 |
| Baseline MMSE Score, mean (SD) | 24.4 (3.22) | 24.9 (3.76) | 0.29 |
aThe t-test was used assuming equal variance for continuous variables and the χ2 for categorical variables. bThe “time to death after initial visit” variable was calculated by subtracting age at initial visit from age at death. cDue to missing data, the age at cognitive onset has n = 282 (224 NCD/ 58 RCD).
Thyroid disease and AD medication use was more prevalent in the RCD group than the NCD group (30.0 versus 16.1%, p = 0.01; 79.7 versus 62.0%, p = 0.01, respectively). Anxiolytic medication use was significantly higher in the NCD group (9.2 versus 0%, p = 0.02). Other baseline clinical history measures (vascular risk factors, cardiovascular disease, psychiatric measures, and medications) did not vary between groups (see Table 1.2).
Table 1.2
Participant Clinical Data at Baselinea
| Characteristicsb | NCD | RCD | p |
| Vascular Risk Factors | |||
| Hypertension, No. (%) | 123 (53.4) | 25 (41.7) | 0.10 |
| Hypercholesterolemia, No. (%) | 125 (55.3) | 35 (58.3) | 0.68 |
| Body Mass Index (BMI), mean (SD) | 25.8 (3.51) | 25.5 (3.69) | 0.55 |
| Smoking (packs per day), mean (SD) | 1.24 (1.52) | 1.43 (1.68) | 0.39 |
| Alcohol (both active and inactive), No. (%) | 15 (6.52) | 3 (5.00) | 0.66 |
| Cardiovascular Disease | |||
| Myocardial infarction, No. (%) | 24 (10.5) | 6 (10.0) | 0.91 |
| Stroke, No. (%) | 18 (7.86) | 3 (5.00) | 0.45 |
| Atrial fibrillation, No. (%) | 26 (11.4) | 7 (11.7) | 0.96 |
| Congestive heart failure, No. (%) | 8 (3.49) | 1 (1.67) | 0.47 |
| Autoimmune Diseasec | |||
| Thyroid disease, No. (%) | 37 (16.1) | 18 (30.0) | 0.014 |
| Diabetes, No. (%) | 21 (9.13) | 4 (6.67) | 0.55 |
| Psychiatric Measuresd | |||
| Depression, No. (%) | 68 (30.2) | 18 (30.0) | 0.97 |
| Anxiety, No. (%) | 75 (33.3) | 16 (26.7) | 0.33 |
| Medications | |||
| AD Medication, No. (%) | 142 (62.0) | 47 (79.7) | 0.011 |
| Anti-psychotic Medication, No. (%) | 7 (3.06) | 3 (5.08) | 0.45 |
| Anxiolytic, sedative, or hypnotic agent, No. (%) | 21 (9.17) | 0 | 0.016 |
| Antidepressant, No. (%) | 74 (32.3) | 17 (28.8) | 0.61 |
| Antihypertensive, No. (%) | 136 (59.4) | 32 (54.2) | 0.47 |
| Anticoagulant, No. (%) | 69 (30.1) | 22 (37.3) | 0.29 |
| Vasodilator, No. (%) | 7 (3.06) | 0 | 0.17 |
| Angiotensin-converting enzyme (ACE) inhibitors, No. (%) | 41 (17.9) | 11 (18.6) | 0.90 |
| Lipid-lowering agent, No. (%) | 106 (46.3) | 32 (54.2) | 0.28 |
| Nonsteroidal anti-inflammatory, No. (%) | 63 (27.5) | 18 (30.5) | 0.65 |
| Medication Count, mean (SD) | 5.56 (3.58) | 6.05(3.08) | 0.34 |
aThe t-test was used assuming equal variance for continuous variables and the χ2 for categorical variables. bDue to missing data, sample sizes varied among characteristics: n = 286 for hypercholesterolemia (226 NCD/60 RCD), n = 269 for BMI (215 NCD/54 RCD), n = 279 for smoking (219 NCD/60 RCD), n = 289 for myocardial infarction (229 NCD/60 RCD), n = 289 for stroke (229 NCD/60 RCD), n = 288 for atrial fibrillation (228 NCD/60 RCD), n = 289 for congestive heart failure (229 nRC/60 RCD), n = 285 for depression (225 NCD/60 RCD), n = 288 for AD medication (229 NCD/59 RCD), n = 288 for antipsychotics (229 NCD/59 RCD), n = 288 for anxiolytic (229 NCD/59 RCD), n = 288 for antidepressant (229 NCD/59 RCD), n = 288 for antihypertensive (229 NCD/59 RCD), n = 288 for anticoagulant (229 NCD/59 RCD), n = 288 for vasodilator (229 NCD/59 RCD), n = 288 for ACE inhibitor (229 NCD/59 RCD), n = 288 for lipid-lowering agent (229 NCD/59 RCD), n = 288 for nonsteroidal anti-inflammatory (229 NCD/59 RCD), n = 288 for medication count (229 NCD/59 RCD). cBinary categorical variable (0 = no history, 1 = both inactive/active). dDepression and anxiety variables taken from the Neuropsychiatric Inventory Questionnaire (NPI-Q).
Neuropathological and genetic differences
There were differences in pathology between the RCD and NCD groups (see Table 2.1). However, differences in the Braak stage and plaque severity did not meet significance. Contrastingly, non-AD pathology did differ. Cerebral amyloid angiopathy was found to be significantly greater in patients with RCD than NCD (mean [SD]: 1.62[1.03] versus 1.13[1.02], p = 0.002). Additionally, individuals with RCD had significantly more diffuse neocortical Lewy bodies than NCD (20.0% versus 10.0%, p = 0.04), but showed no differences in limbic/amygdala-predominant, brainstem-predominant, or overall presence of Lewy body pathology.
Table 2.1
Neuropathological and Genetic Differences
| Characteristicsa,b | NCD | RCD | p |
| Alzheimer’s Disease Pathology | |||
| Braak Stage NFT, No. (%) | 0.12 | ||
| No Stage | 2 (0.90) | 0 | |
| Stage I | 9 (4.00) | 1 (1.70) | |
| Stage II | 14 (6.20) | 3 (5.00) | |
| Stage III | 16 (7.00) | 2 (3.30) | |
| Stage IV | 32 (14.1) | 3 (5.00) | |
| Stage V | 79 (34.8) | 20 (33.3) | |
| Stage VI | 75 (33.0) | 31 (51.7) | |
| Neuritic Plaques, No. (%) | 0.08 | ||
| C0 | 25 (10.9) | 2 (3.30) | |
| C1 | 32 (13.9) | 4 (6.70) | |
| C2 | 50 (21.7) | 13 (21.7) | |
| C3 | 123 (53.5) | 41 (68.3) | |
| Severity Cerebral Amyloid Angiopathy, mean (SD) | 1.13 (1.02) | 1.62 (1.03) | 0.002 |
| Lewy Body Disease Pathology | |||
| Neocortical-predominant, No. (%) | 23 (10.0) | 12 (20.0) | 0.035 |
| Limbic/Amygdala-predominant, No. (%) | 42 (18.3) | 7 (11.7) | 0.22 |
| Brainstem-predominant, No. (%) | 8 (3.49) | 0 | 0.14 |
| Any LBD present (including region unspecified), No. (%) | 79 (34.5) | 22 (36.7) | 0.75 |
| Atrophy | |||
| Severity of Cerebral Cortical Atrophy, mean (SD) | 1.17 (0.83) | 1.54 (0.92) | 0.043 |
| Presence of Gross Lobar Atrophy, No. (%) | 19 (16.0) | 10 (33.3) | 0.032 |
| Medial temporal lobe/hippocampal sclerosis, No. (%) | 33 (27.5) | 17.2 | 0.40 |
| Proteinopathy | |||
| TDP-43 Phospho-specific, No. (%) | 66 (73.3) | 15 (71.4) | 0.86 |
| Pathology Counts | |||
| Vascular Count, mean (SD)c | 4.48 (2.84) | 4.35 (2.37) | 0.16 |
| Multiple Pathologies Count, mean (SD)d | 0.92 (0.91) | 0.73 (0.84) | 0.75 |
| Genetics | |||
| APOE ɛ4, 2 alleles present, No. (%) | 30 (13.7) | 7 (12.5) | 0.82 |
| APOE ɛ4, any alleles present, No. (%) | 116 (53.0) | 32 (57.1) | 0.58 |
In a subset of patients, atrophy at autopsy suggested that overall cerebral cortical atrophy (28 RCD/117 NCD: mean [SD] 1.54[0.92] versus 1.17[0.83], p = 0.04) as well as gross lobar atrophy (30 RCD/119 NCD: 33.3 versus 16.0%, p = 0.03), was markedly higher in RCD, while medial temporal lobe/hippocampal sclerosis did not differ between groups.
No significant differences were observed in vascular disease count or multiple pathology disease count, TDP-43, or the presence/predominance of the APOE ɛ4 allele.
Among the original total study sample (n = 290:230 NCD; 60 RCD), 218 patients (75%) had pathologically verified AD upon autopsy (Table 2.2). The NCD group contained 165 (72%) participants with pathologically verified AD while the RCD group contained 53 (88%). Identical analyses on the neuropathology of this subset with pathologically confirmed AD were conducted to determine if similar pathological findings were consistent in this subset. It was observed that Braak NFT and neuritic plaque severity were also not significantly different between groups in this subset, and neither was the severity of cortical atrophy, the only variable that differed in significance in this subgroup with respect to the full sample. However, the severity of cerebral amyloid angiopathy, prevalence of neocortical diffuse LBD, and gross lobar atrophy remained significantly different between groups.
Table 2.2
Neuropathological and Genetic Differences: AD Pathologically Confirmed Subset
| Characteristicsb,e | NCD | RCD | p |
| Alzheimer’s Disease Pathology | |||
| Braak Stage NFT, No. (%) | 0.24 | ||
| Stage I | — | — | |
| Stage II | — | — | |
| Stage III | 10 (6.10) | 2 (3.80) | |
| Stage IV | 17 (10.3) | 2 (3.80) | |
| Stage V | 67 (40.6) | 19 (35.8) | |
| Stage VI | 71 (43.0) | 30 (56.6) | |
| Neuritic Plaques, No. (%) | 0.69 | ||
| C0 | — | — | |
| C1 | — | — | |
| C2 | 45 (27.3) | 13 (24.5) | |
| C3 | 120 (72.7) | 40 (75.5) | |
| Severity cerebral amyloid angiopathy, mean (SD) | 1.35 (1.02) | 1.69 (1.00) | 0.04 |
| Lewy Body Disease Pathology | |||
| Neocortical-predominant, No. (%) | 17 (10.4) | 12 (22.6) | 0.02 |
| Limbic/Amygdala-predominant, No. (%) | 29 (17.7) | 6 (11.3) | 0.27 |
| Brainstem-predominant, No. (%) | 3 (1.83) | 0 | 0.32 |
| Any LBD present (including region unspecified), No. (%) | 53 (32.3) | 21 (39.6) | 0.33 |
| Atrophy | |||
| Severity of Cerebral Cortical Atrophy, mean (SD) | 1.24 (0.866) | 1.44 (0.917) | 0.31 |
| Presence of Gross Lobar Atrophy, No. (%) | 14 (15.4) | 9 (33.3) | 0.04 |
| Medial temporal lobe/hippocampal sclerosis, No. (%) | 28 (30.4) | 4 (14.8) | 0.11 |
| Proteinopathy | |||
| TDP-43 Phospho-specific, No. (%) | 48 (72.7) | 12 (66.7) | 0.61 |
| Pathology Counts | |||
| Vascular Count, mean (SD)c | 4.50 (2.64) | 4.19 (2.30) | 0.38 |
| Multiple Pathologies Count, mean (SD)d | 0.81 (0.80) | 0.70 (0.85) | 0.39 |
| Genetics | |||
| APOE ɛ4, 2 alleles present, No. (%) | 29 (18.6) | 7 (14.3) | 0.49 |
| APOE ɛ4, any alleles present, No. (%) | 91 (58.3) | 30 (61.2) | 0.72 |
aDue to missing data, sample sizes varied amongst characteristics: n = 287 for Braak NFT stage (227 NCD/60 RCD), n = 278 for cerebral amyloid angiopathy (223 NCD/55 RCD), n = 289 for LBD (229 NCD/60 RCD), n = 145 for cerebral cortical atrophy (117 NCD/28 RCD), n = 149 for gross lobar atrophy (119 NCD/30 RCD), n = 135 for hippocampal atrophy (106 NCD/29 RCD), n = 111 for TDP-43 Phospho-specific (90 NCD/21 RCD), n = 275 for APOE ɛ4 allele present (219 NCD/56 RCD). bThe t-test was used assuming equal variance for continuous variables and the χ2 for categorical variables for the below characteristics. cThis was derived as a count variable of vascular pathologies, one point given to the presence of each of the following: cerebral amyloid angiopathy, arterial infarcts, lacunes, old infarcts, hemorrhages (old/new), microinfarcts, (old/new), microbleeds, arteriosclerosis, and laminar necrosis. Scores ranged from 0–19, with the mode being 3 vascular pathologies. dThis was derived as a count variable of multiple pathologies, one point given to the presence of each of the following: Frontotemporal lobar degeneration, multiple system atrophy, prion disease, trinucleotide diseases, malformation of cortical development, metabolic disorder, white matter disease, multiple sclerosis, contusion/traumatic brain injury, neoplasm (metastic/primary), infectious process evidence, and herniation. Scores ranged from 0–4, with the mode being 0 additional pathologies. eDue to missing data, sample sizes varied amongst characteristics: n = 218 for Braak NFT stage (165 NCD/53 RCD), n = 218 for neuritic plaques (165 NCD/53 RCD), n = 208 for cerebral amyloid angiopathy (159 NCD/49 RCD), n = 217 for neocortical-predominant LBD (164 NCD/53 RCD), n = 217 for limbic-predominant LBD (164 NCD/53 RCD), n = 217 for brainstem-predominant LBD (164 NCD/53 RCD), n = 217 for any LBD present (164 NCD/53 RCD), n = 114 for cerebral cortical atrophy (89 NCD/25 RCD), n = 118 for gross lobar atrophy (91 NCD/27 RCD), n = 94 for hippocampal atrophy (69 NCD/25 RCD), n = 218 for vascular count (165 NCD/53 RCD), n = 218 for multiple pathologies (165 NCD/53 RCD), n = 205 for APOE ɛ4 2 alleles and alleles present (156 NCD/49 RCD).
Neuropsychological testing differences
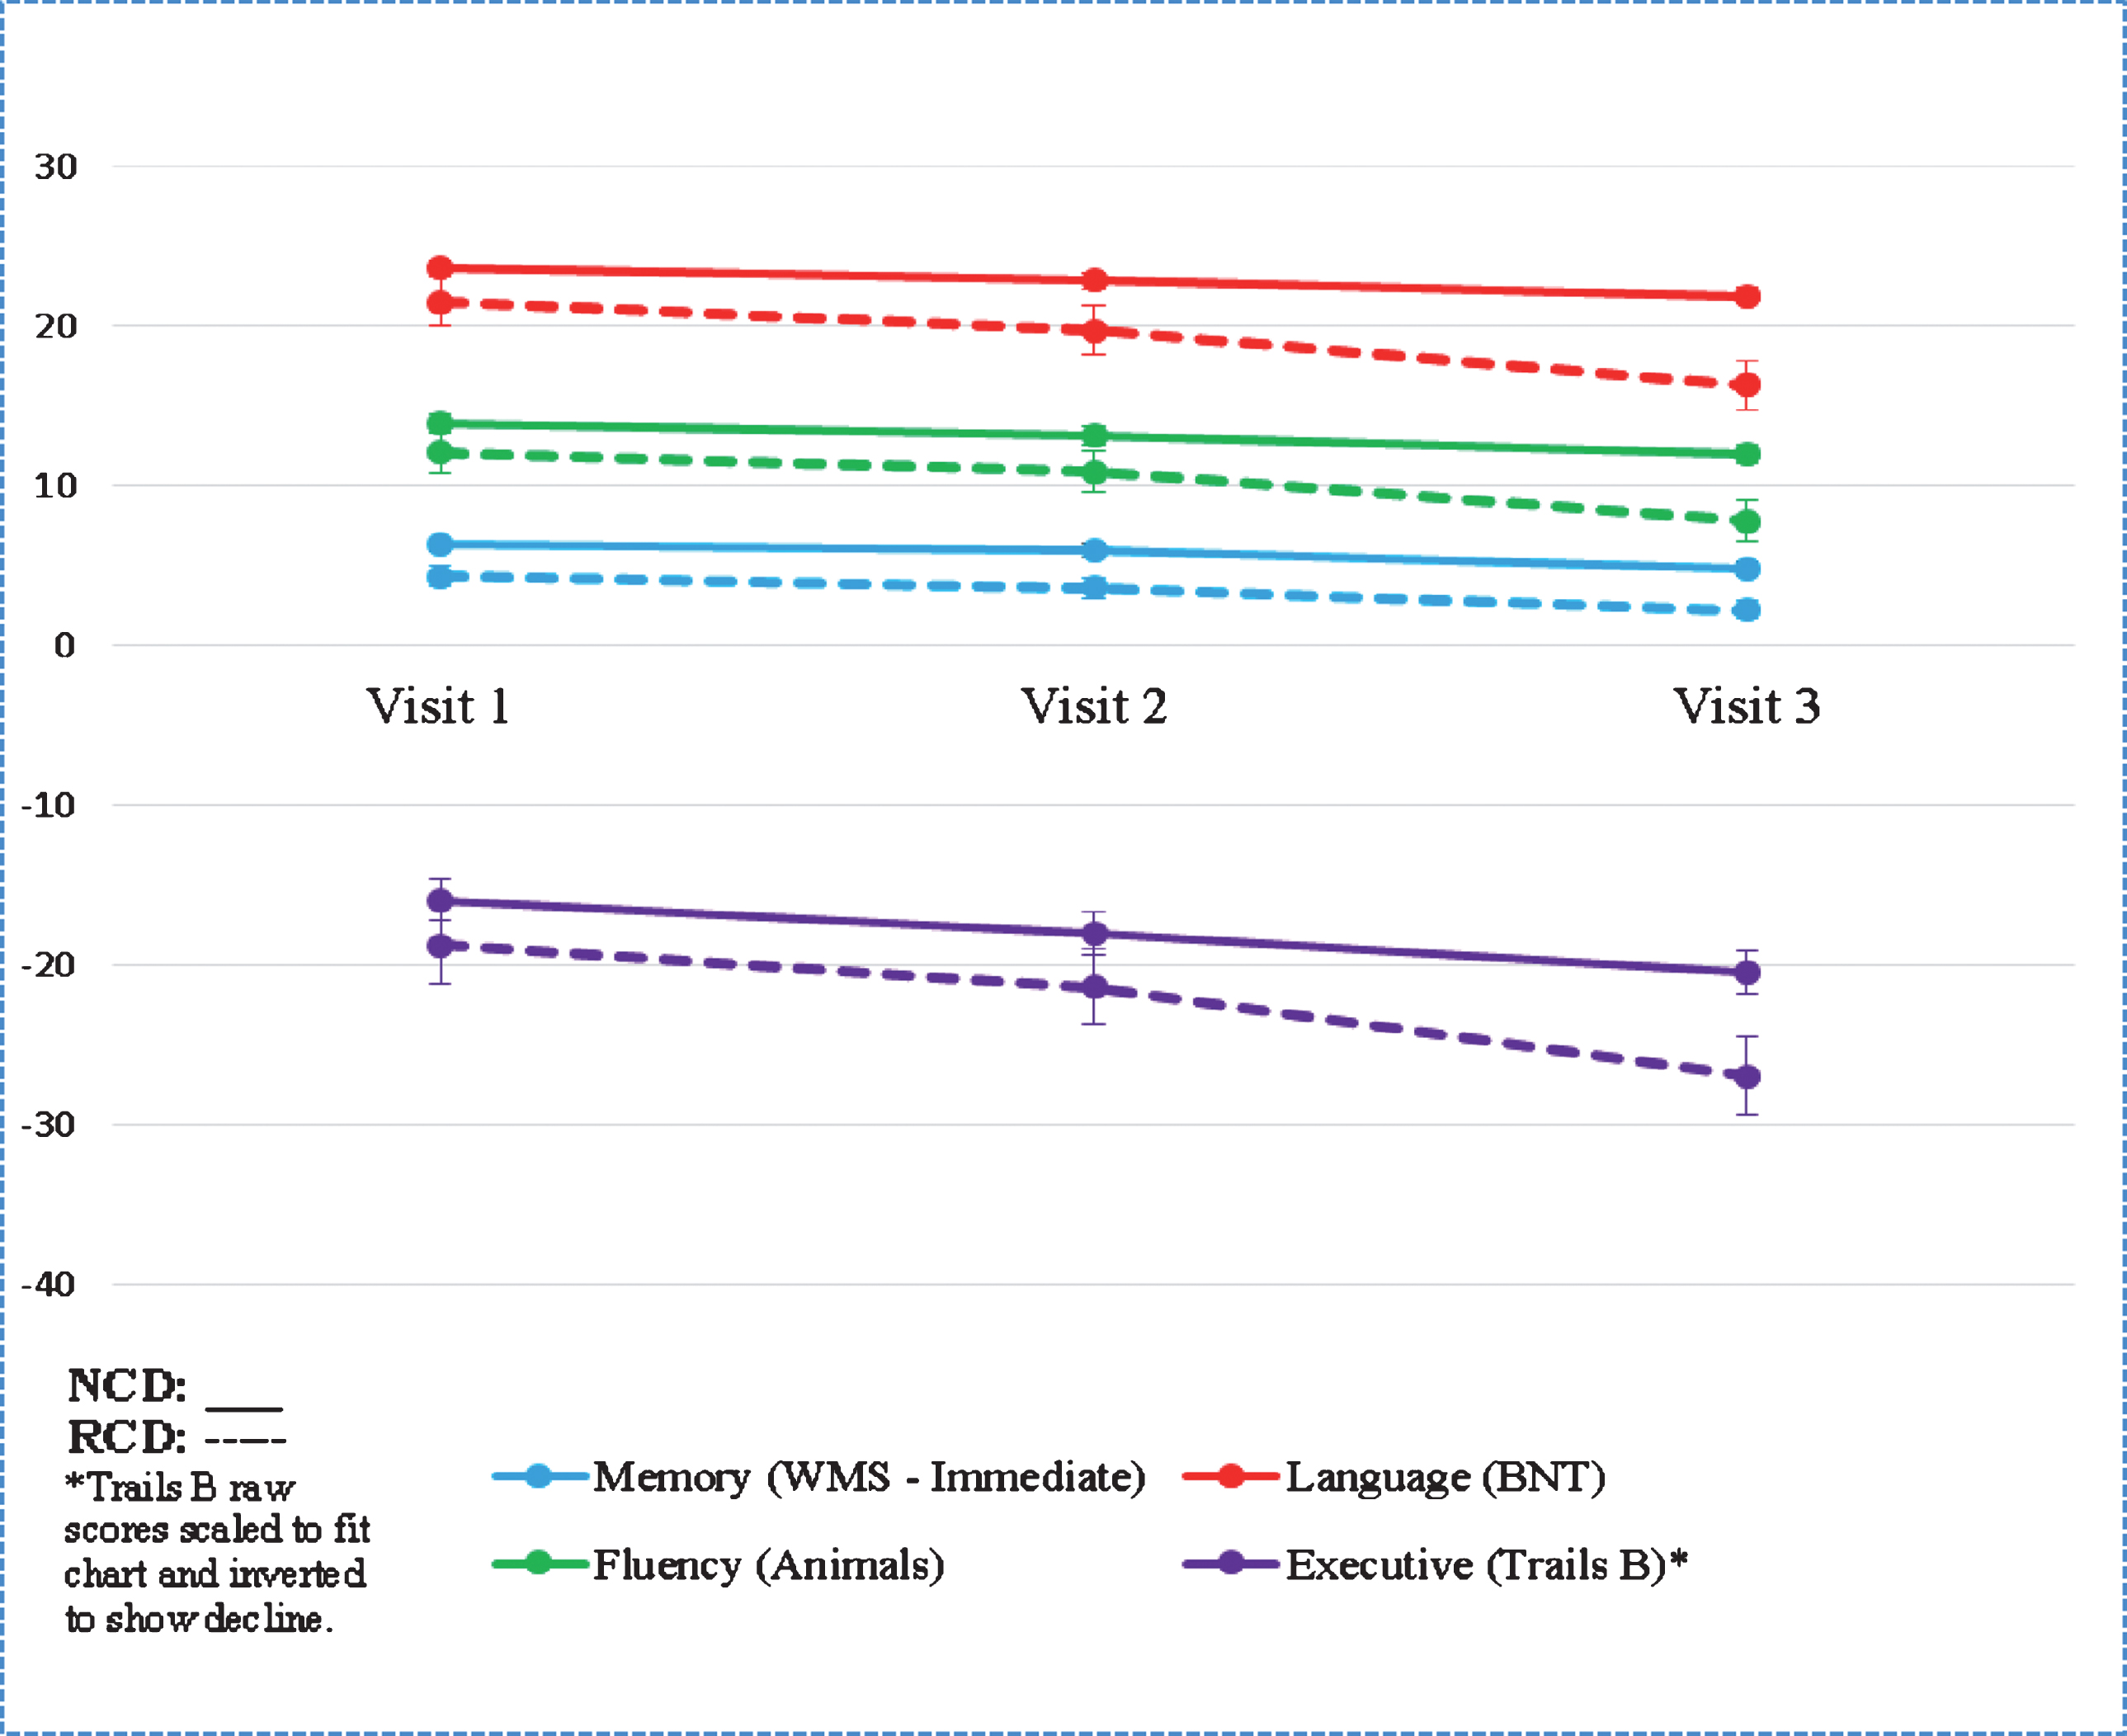
Though baseline scores on the MMSE did not differ significantly, individuals with RCD had lower performance at baseline on the following neuropsychological measures: Wechsler Memory Scale-Revised Logical Memory Ia Story Units Recalled, the Boston Naming Test, the Animal Naming Test, and Trail Making Test part B (see Table 3 and Chart 1). Other neuropsychological measures did not vary at baseline.
Table 3
Neuropsychological Testing Differencesa
| Baseline | Visit Three | |||||
| Testsb | NCD | RCD | p | NCD | RCD | p |
| Memory | 0.001 | |||||
| WMS Logical Memory Immediate Recall, mean (SD) | 6.31 (3.97) | 4.35 (3.39) | <0.001 | 4.85 (4.07) | 2.25 (2.87) | |
| WMS Logical Memory Delayed Recall, mean (SD) | 3.00 (4.22) | 2.52 (3.30) | 0.41 | 2.20 (3.74) | 1.05 (1.89) | |
| Language | ||||||
| Boston Naming Test, mean (SD) | 23.6 (5.09) | 21.5 (7.05) | 0.04 | 21.9 (5.82) | 16.3 (8.87) | |
| Fluency | ||||||
| Animals, mean (SD) | 13.9 (4.51) | 12.1 (4.83) | 0.007 | 12.0 (4.78) | 7.81 (4.46) | |
| Vegetables, mean (SD) | 8.74 (3.37) | 7.88 (3.91) | 0.09 | 7.39 (3.28) | 4.82 (4.50) | |
| Attention/Working Memory/Processing Speed | ||||||
| Digit Span Forward, mean (SD) | 7.82 (2.08) | 7.55 (2.16) | 0.37 | 7.58 (2.00) | 6.30 (2.45) | |
| Digit Span Backward, mean (SD) | 5.53 (1.86) | 5.20 (1.65) | 0.21 | 5.16 (1.90) | 4.03 (2.01) | |
| Trails A, mean (SD) | 51.2 (22.0) | 55.9 (29.7) | 0.25 | 61.0 (30.4) | 82.7 (39.6) | |
| Trails B, mean (SD) | 159 (79.0) | 187 (86.1) | 0.02 | 204 (87.1) | 269 (56.0) | |
| WAIS-R Digit Symbol, mean (SD) | 32.5 (10.1) | 29.5 (11.3) | 0.04 | 28.4 (10.9) | 19.8 (11.7) | |
| MMSE – Total Score, mean (SD) | 24.4 (3.22) | 24.9 (3.76) | 0.29 | 22.6 (4.13) | 19.1 (6.49) | |
aThe t-test was used assuming equal variance for continuous variables. bDue to missing data, sample sizes varied amongst tests: Baseline: n = 286 for WMS immediate (226 NCD/60 RCD), n = 287 for WMS delayed (227 NCD/60 RCD), n = 286 for BNT (227 NCD/59 RCD), n = 289 for Animals (229 NCD/60 RCD), n = 289 for Vegetables (229 NCD/60 RCD), n = 288 for Digit Forward (228 NCD/60 RCD), n = 288 for Digit Backwards (228 NCD/60 RCD), n = 290 for Trails A (230 NCD/60 RCD), n = 284 for Trails B (225 NCD/59 RCD), n = 281for WAIS Digit Symbol (221 NCD/60 RCD). Visit Three: n = 287 for WMS immediate (228 NCD/59 RCD), n = 287 for WMS delayed (228 NCD/59 RCD), n = 287 for BNT (228 NCD/59 RCD), n = 287 for Animals (228 NCD/59 RCD), n = 287 for Vegetables (227 NCD/60 RCD), n = 288 for Digit Forward (228 NCD/60 RCD), n = 288 for Digit Backwards (228 NCD/60 RCD), n = 288 for Trails A (228 NCD/60 RCD), n = 272 for Trails B (212 NCD/60 RCD), n = 281for WAIS Digit Symbol (221 NCD/60 RCD).
Chart 1
Neuropsychological Testing Differences
A model of clinical and neuropsychological predictors of RCD at baseline
A multivariable logistic regression model was fit to determine predictors of group membership, simultaneously entering related variables of disease characteristics, neuropsychological testing, and demographic information. Table 4 summarizes the results from the model, which was found overall to be statistically significant (χ2 = 25.8, p = 0.002), though only slightly above chance level with an AUC of 0.70 (95% CI).
Table 4
Logistic Regression Model for Predictors of RCD at Baseline
| Odds Ratio (95% CI) | p | |
| Characteristicsa | ||
| Disease Characteristics | ||
| Thyroid Disease | 2.87 (1.36–6.05) | 0.005 |
| Depressionb | 0.83 (0.42–1.64) | 0.60 |
| Nighttime Behaviorsb | 0.77 (0.36–1.64) | 0.50 |
| Neuropsychology Testing, per point | ||
| Logical Memory (Immediate) | 0.88 (0.80–0.97) | 0.009 |
| Animals | 0.96 (0.89–1.04) | 0.28 |
| Trails B | 1.00 (0.99–1.01) | 0.20 |
| Demographic Information | ||
| Education, per year | 1.04 (0.93–1.17) | 0.50 |
| Age, per year | 0.98 (0.94–1.02) | 0.27 |
| Male Sex | 1.19 (0.61–2.34) | 0.61 |
aDue to missing data, this model has the following sample size: n = 266 (213 NCD/53 RCD). bVariable taken from the Neuropsychiatric Inventory Questionnaire (NPI-Q).
Presence of thyroid disease (odds ratio (OR): 2.87; 95% CI: 1.36–6.05; p = 0.005) was a significant baseline predictor of RCD as well as receiving a lower raw score on the Wechsler Memory Scale-Revised Logical Memory Ia Story Units Recalled (OR: 0.88; 95% CI: 0.80–0.97; p = 0.009).
Demographics of age, sex, and education were not associated with increased likelihood of an individual’s categorization as RCD within the model, nor were variables of nighttime behavior and depression from the NPI-Q, the Animal Naming Test, or Trail Making Test part B.
DISCUSSION
Central findings
This study looked at demographic, neuropsychological, and pathological correlates of RCD in AD in a large, well characterized sample with autopsy confirmation. The primary finding from our study is that patients with RCD had a more severe pathological signature than their NCD counterparts, specifically with more extensive comorbidity. This is evidenced in the autopsy data which demonstrated that RCD patients, despite having shorter time from diagnosis to death, had more cerebral amyloid angiopathy, greater atrophy, and more diffuse neocortical Lewy bodies. None of the observed demographic factors differed between the groups, which may indicate that RCD is driven primarily by biological factors (i.e., a more aggressive form of AD, with comorbidities) and less influenced by demographics (age, education, etc.) as previous research has suggested.
Secondary findings
Though RCD and NCD had similar baseline MMSE scores, individual neuropsychology test results suggest significant underlying baseline differences in language and memory (WMS Logical Memory Immediate Recall, Animal naming, BNT) and executive functioning (Trails B and WAIS-R Digit Symbol). Lower performance on these tests implies cortical dysfunction, which is consistent with the finding of more extensive extra-limbic atrophy, suggesting that disease has already progressed more extensively throughout the brain in the RCD group before their initial ADC visit. This demonstrates the importance of adequate neuropsychological characterization early on in the disease course, as well as the usefulness of and potential for the development of a predictive model of cognitive trajectory including similar measures.
Baseline cardiovascular risk factors and psychiatric symptoms also did not differentiate between groups, although a significantly higher portion of the RCD population was taking an AD medication at baseline visit. Observing that more RCD individuals are taking cognitive enhancing agents is indicative of other clinically distinguishing factors at baseline that were perceptible by a clinician, yet not captured in the database. This has been suggested in previous studies, which observe that cognitive symptoms may be indicated at baseline presentation without an obvious profile or causative effect [23].
Though a count of multiple pathologies did not appear significant, there was evidence of more comorbidity in the RCD group, with RCD presenting with more neocortical Lewy bodies and evidence of greater occurrence of autoimmune disease (thyroid disease). Other publications have also linked thyroid disease to cognitive decline [19, 20], though this is not consistent across studies [12].
While there is evidence of differences in clinically-identifiable factors at baseline, the regression model with a combination of factors of disease characteristics, neuropsychology testing, and demographic information was inadequately predictive of RCD. However, WMS logical memory immediate recall and thyroid disease were significant within the model, suggesting that further research is warranted, perhaps in different datasets.
Implications for current research
To our knowledge, the present sample is the largest with autopsy confirmation that has been examined for defining factors of RCD. Because of this, we sought to also examine many previous correlations with RCD found in previous publications. Our sample consists of 20% with RCD versus NCD, consistent with the proportions of previous research, varying between 11–40% [24]. We found that many of the distinguishing factors purported by past research did not significantly differentiate groups in our sample. Factors such as age, higher level of education, lower baseline cognition, neuropsychiatric status, and APOE ɛ4 status, were associated with RCD in prior research [12, 24], but did not reach statistical significance in the current sample, further emphasizing that RCD is still lacking consensus in disease profile and definition.
Limitations
One limitation of the present study is the limited specificity of certain data points in NACC, namely variables of vascular pathology, multiple pathology, and thyroid disease. For example, it was difficult from the current dataset to accurately assess severity of vascular burden because the data available suggested that all participants were greatly, and similarly, burdened. More recent data being collected in NACC NP V10 allows for a more nuanced severity quantification of vascular pathology, but it will take time to accumulate an adequate number of participants. The same is true of the multiple pathologies count, though with the opposite limitation, with our sample having a mode of zero additional pathologies. Thyroid disease is also not parsed out into hypo/hyperthyroidism in NACC; prospective data collection would be required to obtain this data. It should also be taken into consideration that the NACC database subject education is likely above the population average, thus potentially limiting the generalizability of results [25].
In regards to the neuropsychology test data, it has been suggested in previous research that the MMSE may be too blunt of an instrument, thus being a questionable choice by which to define RCD. The MMSE has been criticized for its limited ability to assess global cognitive function, namely its lack of sensitivity to language and executive functioning [26]. This could attest to executive and language differences between RCD and NCD at baseline despite nearly identical MMSE scores, and begs the question of whether it should be the measure of choice in defining RCD. However, it can be observed that the neuropsychology database in NACC is also relatively limited in expansiveness, thus restricting the ability to probe deeply into cognition between groups [27].
It is also worth acknowledging the increased possibility of false-positives (Type I error) within our results due to multiple comparisons. The results of this study are hypothesis-generating so we did not adjust for multiplicity.
Implications for future research
Future research should look to biomarkers that might help predict the likelihood of one’s categorization as RCD in vivo, relating to neuropsychology test data over time. Looking at cerebral amyloid angiopathy, the presence of neocortical Lewy bodies, and patterns of atrophy could provide valuable insight into the differences between NCD and RCD in life. It would also be useful to look at datasets that parse out hypo- and hyperthyroidism in individuals with clinically diagnosed AD to see if there are distinguishing clinical presentations between these diseases. In clinical trials, it would be useful to segregate the RCD group to study the differences in their reactions to experimental interventions, and to be aware of the possible comorbidity with Lewy body in this cohort, which might impact trial results.
Overall, we demonstrated that individuals with RCD show more severe pathology, are more likely to have pathological comorbidity, and have lower baseline scores on neuropsychology tests of language and executive function. Despite evidence of baseline differences, a predictive model including these variables was not optimally sensitive to RCD categorization, suggesting that future research is needed to better capture the early profile of patients most likely to decline rapidly.
ACKNOWLEDGMENTS
The NACC database is funded by NIA/NIH Grant U01 AG016976. NACC data are contributed by the NIA-funded ADCs: P30 AG019610 (PI Eric Reiman, MD), P30 AG013846 (PI Neil Kowall, MD), P50 AG008702 (PI Scott Small, MD), P50 AG025688 (PI Allan Levey, MD, PhD), P50 AG047266 (PI Todd Golde, MD, PhD), P30 AG010133 (PI Andrew Saykin, PsyD), P50 AG005146 (PI Marilyn Albert, PhD), P50 AG005134 (PI Bradley Hyman, MD, PhD), P50 AG016574 (PI Ronald Petersen, MD, PhD), P50 AG005138 (PI Mary Sano, PhD), P30 AG008051 (PI Thomas Wisniewski, MD), P30 AG013854 (PI M. Marsel Mesulam, MD), P30 AG008017 (PI Jeffrey Kaye, MD), P30 AG010161 (PI David Bennett, MD), P50 AG047366 (PI Victor Henderson, MD, MS), P30 AG010129 (PI Charles DeCarli, MD), P50 AG016573 (PI Frank LaFerla, PhD), P50 AG005131 (PI James Brewer, MD, PhD), P50 AG023501 (PI Bruce Miller, MD), P30 AG035982 (PI Russell Swerdlow, MD), P30 AG028383 (PI Linda Van Eldik, PhD), P30 AG053760 (PI Henry Paulson, MD, PhD), P30 AG010124 (PI John Trojanowski, MD, PhD), P50 AG005133 (PI Oscar Lopez, MD), P50 AG005142 (PI Helena Chui, MD), P30 AG012300 (PI Roger Rosenberg, MD), P30 AG049638 (PI Suzanne Craft, PhD), P50 AG005136 (PI Thomas Grabowski, MD), P50 AG033514 (PI Sanjay Asthana, MD, FRCP), P50 AG005681 (PI John Morris, MD), P50 AG047270 (PI Stephen Strittmatter, MD, PhD).
Research reported in this publication was supported by an Institutional Development Award (IDeA) from the National Institute of General Medical Sciences of the National Institutes of Health under grant number 5P20GM109025.
Authors’ disclosures available online (https://www.j-alz.com/manuscript-disclosures/19-0302r2).
REFERENCES
[1] | Cummings J , Aisen PS , Dubois B , Frölich L , Jack CR , Jones RW , Morris JC , Raskin J , Dowsett SA , Scheltens P ((2016) ) Drug development in Alzheimer’s disease: The path to 2025. Alzheimers Res Ther 8: , 39. |
[2] | Wilkosz PA , Seltman HJ , Devlin B , Weamer EA , Lopez OL , Dekosky ST , Sweet RA ((2010) ) Trajectories of cognitive decline in Alzheimer’s disease. Int Psychogeriatr 22: , 281–290. |
[3] | Doody RS , Pavlik V , Massman P , Rountree S , Darby E , Chan W ((2010) ) Predicting progression of Alzheimer’s disease. Alzheimers Res Ther 2: , 2. |
[4] | Carcaillon L , Pérès K , Péré JJ , Helmer C , Orgogozo JM , Dartigues JF ((2007) ) Fast cognitive decline at the time of dementia diagnosis: A major prognostic factor for survival in the community. Dement Geriatr Cogn Disord 23: , 439–445. |
[5] | Holtzer R , Wegesin DJ , Albert SM , Marder K , Bell K , Albert M , Brandt J , Stern Y ((2003) ) The rate of cognitive decline and risk of reaching clinical milestones in Alzheimer disease. Arch Neurol 60: , 1137–1142. |
[6] | O’Hara R , Thompson JM , Kraemer HC , Fenn C , Taylor JL , Ross L , Yesavage JA , Bailey AM , Tinklenberg JR ((2002) ) Which Alzheimer patients are at risk for rapid cognitive decline? J Geriatr Psychiatry Neurol 15: , 233–238. |
[7] | Peltomäki T , Alstergren P , Petty R , Ringold S , Nørholt SE , Pedersen TK , Küseler A , Cron RQ , Abramowicz S , Stoustrup CP , Twilt M , Spiegel L , Kristensen KD , Koos B , Stoustrup P , Verna C , Saurenmann RK , Herlin T ((2017) ) Clinical orofacial examination in juvenile idiopathic arthritis: Consensus-based recommendations for monitoring patients in clinical practice and research studies. J Rheumatol 44: , 326–333. |
[8] | Ito K , Ahadieh S , Corrigan B , French J , Fullerton T , Tensfeldt T ((2010) ) Disease progression meta-analysis model in Alzheimer’s disease. Alzheimers Dement 6: , 39–53. |
[9] | Musicco M , Salamone G , Caltagirone C , Cravello L , Fadda L , Lupo F , Mosti S , Perri R , Palmer K ((2010) ) Neuropsychological predictors of rapidly progressing patients with Alzheimer’s disease. Dement Geriatr Cogn Disord 30: , 219–228. |
[10] | Wilson RS , Li Y , Aggarwal NT , Barnes LL , McCann JJ , Gilley DW , Evans DA ((2004) ) Education and the course of cognitive decline in Alzheimer disease. Neurology 63: , 1198–1202. |
[11] | Song YN , Wang P , Xu W , Li JQ , Cao XP , Yu JT , Tan L ((2018) ) Risk factors of rapid cognitive decline in Alzheimer’s disease and mild cognitive impairment: A systematic review and meta-analysis. J Alzheimers Dis 66: , 497–515. |
[12] | Sona A , Ellis KA , Ames D ((2013) ) Rapid cognitive decline in Alzheimer’s disease: A literature review. Int Rev Psychiatry 25: , 650–658. |
[13] | Beach TG , Monsell SE , Phillips LE , Kukull W ((2012) ) Accuracy of the clinical diagnosis of Alzheimer disease at National Institute on Aging Alzheimer Disease Centers, 2005-2010. J Neuropathol Exp Neurol 71: , 266–273. |
[14] | Besser LM , Kukull WA , Teylan MA , Bigio EH , Cairns NJ , Kofler JK , Montine TJ , Schneider JA , Nelson PT ((2018) ) The revised national Alzheimer’s coordinating center’s neuropathology form-available data and new analyses. J Neuropathol Exp Neurol 77: , 717–726. |
[15] | Beekly DL , Ramos EM , Lee WW , Deitrich WD , Jacka ME , Wu J , Hubbard JL , Koepsell TD , Morris JC , Kukull WA , Reiman EM , Kowall N , Landreth G , Shelanski M , Welsh-Bohmer K , Levey AI , Potter H , Ghetti B , Price D , Hyman B , Petersen RC , Sano M , Ferris SH , Mesulam MM , Kaye J , Bennett DA , Yesavage J , Marson D , Beck C , DeCarli C , Cotman C , Cummings JL , Thal LJ , Markesbery W , Gilman S , Trojanowski JQ , DeKosky ST , Chui H , Rosenberg R , Raskind M ((2007) ) The National Alzheimer’s Coordinating Center (NACC) database: The uniform data set. Alzheimer Dis Assoc Disord 21: , 249–258. |
[16] | Murayama S , Saito Y ((2004) ) Neuropathological diagnostic criteria for Alzheimer’s disease. Neuropathology 24: , 254–260. |
[17] | Cronin-Stubbs D , Dekosky ST , Morris JC , Evans DA ((2000) ) Promoting interactions with basic scientists and clinicians: The NIA Alzheimer’s disease data coordinating center. Stat Med 19: , 1453–1461. |
[18] | Hyman BT , Phelps CH , Beach TG , Bigio EH , Cairns NJ , Carrillo MC , Dickson DW , Duyckaerts C , Frosch MP , Masliah E , Mirra SS , Nelson PT , Schneider JA , Thal DR , Thies B , Trojanowski JQ , Vinters HV , Montine TJ ((2012) ) National Institute on Aging-Alzheimer’s Association guidelines for the neuropathologic assessment of Alzheimer’s disease. Alzheimers Dement 8: , 1–13. |
[19] | Hogervorst E , Huppert F , Matthews FE , Brayne C ((2008) ) Thyroid function and cognitive decline in the MRC Cognitive Function and Ageing Study. Psychoneuroendocrinology 33: , 1013–1022. |
[20] | Teri L , Hughes JP , Larson EB ((1990) ) Cognitive deterioration in Alzheimer’s disease: Behavioral and health factors. J Gerontol 45: , 58–63. |
[21] | McKeith IG , Dickson DW , Lowe J , Emre M , O’Brien JT , Feldman H , Cummings J , Duda JE , Lippa C , Perry EK , Aarsland D , Arai H , Ballard CG , Boeve B , Burn DJ , Costa D , Del Ser T , Dubois B , Galasko D , Gauthier S , Goetz CG , Gomez-Tortosa E , Halliday G , Hansen LA , Hardy J , Iwatsubo T , Kalaria RN , Kaufer D , Kenny RA , Korczyn A , Kosaka K , Lee VMY , Lees A , Litvan I , Londos E , Lopez OL , Minoshima S , Mizuno Y , Molina JA , Mukaetova-Ladinska EB , Pasquier F , Perry RH , Schulz JB , Trojanowski JQ , Yamada M ((2005) ) Diagnosis and management of dementia with Lewy bodies: Third report of the DLB consortium. Neurology 65: , 1863–1872. |
[22] | Cummings JL ((2000) ) Neuropsychiatric inventory questionnaire. J Neuropsychiatry Clin Neurosci 12: , 233–239. |
[23] | Kennedy RE , Cutter GR , Fowler ME , Schneider LS ((2018) ) Association of concomitant use of cholinesterase inhibitors or memantine with cognitive decline in Alzheimer clinical trials. JAMA Netw Open 1: , e184080. |
[24] | Jia J , Gauthier S , Pallotta S , Ji Y , Wei W , Xiao S , Peng D , Guo Q , Wu L , Chen S , Kuang W , Zhang J , Wei C , Tang Y ((2017) ) Consensus-based recommendations for the management of rapid cognitive decline due to Alzheimer’s disease. Alzheimers Dement 13: , 592–597. |
[25] | Lin M , Gong P , Yang T , Ye J , Albin RL , Dodge HH ((2018) ) Big data analytical approaches to the NACC dataset: Aiding preclinical trial enrichment. Alzheimer Dis Assoc Disord 32: , 18–27. |
[26] | Nasreddine ZS , Phillips NA , Bédirian V , Charbonneau S , Whitehead V , Collin I , Cummings JL , Chertkow H ((2005) ) The Montreal Cognitive Assessment, MoCA: A brief screening tool for mild cognitive impairment. J Am Geriatr Soc 53: , 695–699. |
[27] | Bondi MW , Jak AJ , Delano-Wood L , Jacobson MW , Delis DC , Salmon DP ((2008) ) Neuropsychological contributions to the early identification of Alzheimer’s disease. Neuropsychol Rev 18: , 73–90. |


