
A Birth Cohort Analysis of Amnestic Mild Cognitive Impairment Incidence in the Einstein Aging Study (EAS) Cohort
Abstract
Background:
The transition from normal cognition to Alzheimer’s disease is considered a continuum, with amnestic mild cognitive impairment (aMCI) an intermediate clinical cognitive state. Although prior work suggests that dementia incidence rates may be declining, there is little information regarding temporal trends in aMCI incidence.
Objective:
To determine whether age specific rates of aMCI have changed over sequential birth cohorts among individuals included in the population-based Einstein Aging Study (EAS) cohort. A secondary objective was to examine trends in aMCI rates among Blacks and Whites and by sex.
Methods:
Age specific incidence of aMCI was examined by birth year among 1,233 individuals age 70 years and above enrolled in the population-based EAS cohort between November 1, 1993 and February 22, 2016 and who had at least one annual follow-up assessment (5,321 person years of follow-up). Poisson regression was used to determine whether there has been a change in age specific aMCI rates over sequential years of birth.
Results:
No significant change in aMCI rates was identified in the overall cohort, among Blacks or Whites, or among males or females born between 1899 and 1946.
Conclusions:
Despite a trend for decreased dementia incidence in the EAS cohort, rates of incident aMCI have not changed. These apparently conflicting results may indicate a delay or decrease in the rates of transition from aMCI to dementia within the cohort. However, further studies are needed to confirm whether rates of aMCI have changed in other populations, and how aMCI rates are related to secular trends in dementia risk factors.
INTRODUCTION
Although prevalence rates of dementia are projected to rise as the population ages [1], a number of prior studies suggest that incidence of dementia is in fact declining in Western countries [2–5]. Possible reasons for the decline include improved cardiovascular health and increased education levels in later birth cohorts, although neither possibility has been fully substantiated [3]. Regardless, the possibility of decreasing dementia incidence may have significant implications for projections of dementia prevalence in the coming decades.
Mild cognitive impairment (MCI) has been conceptualized as a transitional stage from healthy aging to clinical dementia [6]. Two subtypes of MCI have been defined with amnestic MCI (aMCI) defined by a cognitive deficit in memory, and a non-amnestic form defined based on cognitive deficits in domains other than memory [7]. Of the two subtypes, aMCI has been shown to have a higher likelihood of progression to clinical dementia [8, 9], with the annual rate of conversion estimated to be 10–15% [10]. This clinical definition is consistent with and has significant overlap with the criteria for clinical cognitive staging in the absence of biomarkers, recently put forth by the National Institute on Aging-Alzheimer’s Association Research Framework [11, 12].
There is growing interest in better understanding the early pre-dementia phase of Alzheimer’s disease (AD). Thus, whether the observed decline in dementia rates in the US and European cohorts has been accompanied by declining rates of aMCI is of interest. Declining dementia incidence does not necessarily imply that the rates of conversion from normal cognition to aMCI are also decreasing. For example, increased detection of aMCI, or slower disease progression from aMCI to AD would result in stable aMCI rates concurrent with declining dementia incidence. While slowing of the disease process has been projected to greatly decrease the public health burden of clinical AD [13], the above scenarios would suggest an increasing prevalence of aMCI in the population, despite declining AD incidence. MCI poses a burden to individuals and to society over and above the increased risk of progressing to AD. Individuals affected may be unable to comply with self-management of chronic diseases such as hypertension or diabetes, and further, the condition is associated with emotional, physical, and financial impact on patients and their caregivers [14–16].
There is a paucity of data regarding temporal trends in aMCI incidence within population-based samples. To our knowledge, no studies have reported temporal trends in incident aMCI rates to determine whether they are declining in parallel to the observed declines in dementia incidence. Data regarding sex and race differences in temporal trends in MCI incidence are even more limited [12, 17], despite evidence that females [12, 18] and African Americans [19–21] have a disproportionate burden of AD and dementia.
To examine whether there has been a change in aMCI incidence, it is necessary to study a population where MCI classification and recruitment strategies have been consistent over an extended time period. Diagnostic criteria for MCI and its subtypes have evolved as interest in the pre-dementia phase of AD has increased [6, 8, 11, 17]. A systematic review of the literature has demonstrated wide variation in estimates of aMCI incidence with rates ranging from 8.5 to 25.9 per 1,000 person-years [22]. While many studies have used the revised Petersen criteria to define MCI and its subtypes [7], studies have varied regarding the neuropsychological tests used and the cut points chosen to define cognitive impairment [12, 23]. The impact of these variations in diagnostic criteria has been demonstrated by Sachdev et al. [24] in an analysis of prevalence estimates from eleven longitudinal cohort studies included in the Cohort Studies of Memory in an International Consortium (COSMIC). While published prevalence of MCI (all subtypes combined) in these cohorts ranged from 5 to 36.7%, rates based on application of a standard diagnostic algorithm to harmonized data ranged from only 3–10.8%.
In addition to the availability of standardized recruitment and diagnostic criteria over time, the identification of a temporal trend in aMCI rates requires an approach that separates age and cohort effects. The Einstein Aging Study (EAS), which has systematically recruited and followed a community dwelling cohort of individuals aged 70 and older from Bronx, New York since 1993, provides the opportunity to examine temporal trends in aMCI rates over the past two decades in a population with racial/ethnic diversity [25]. As noted above, we focus specifically on aMCI, given that this subtype of MCI has been shown to have a higher conversion rate to AD. The goal of this study is to examine trends in aMCI incidence within the EAS cohort using a birth cohort analysis to disentangle age and cohort effects. A secondary goal is to examine whether aMCI incidence trends differ for males and females, and for White and African American older adults.
MATERIALS AND METHODS
Study population
The EAS is a longitudinal, population-based study of older adults. Since 1993, the EAS has systematically recruited community residing participants 70 years and older from Bronx County, New York, USA [25]. Between 1993 and 2004, Health Care Financing Administration/Centers for Medicaid and Medicare Service (HCFA/CMS) rosters of Medicare eligible persons 70 and above were used to develop sampling frames for recruitment. Since 2004, New York City Board of Elections registered voter lists for Bronx County have been used due to changes in HCFA/CMS policies [3, 25]. We estimate that the voter lists provide a sampling frame that includes over 90% of community residing individuals over 65 using U.S. Census data as a reference. Overlap of the HCFA/CMS and voter lists is approximately 90%, and the demographic characteristics of participants enrolled using either list are similar. Individuals in the sampling frames were mailed introductory letters, which were followed by brief telephone screening interviews to determine preliminary eligibility [26]. Final screening and enrollment were completed at the EAS research center. Written informed consent was obtained using protocols approved by the Institutional Review Board of the Albert Einstein College of Medicine. Procedures for recruitment, telephone screening, and consenting protocols have remained consistent since 1993, with similar retention rates and duration of follow-up since that time [3].
To be eligible for the EAS cohort, participants were required to be age 70 years or older and fluent in English. Participants who met diagnostic criteria for dementia at the initial study visit were excluded from subsequent follow-up [25]. The cohort is representative of the Bronx County community with respect to sex and educational level based on comparison with US Census data [27].
Annual study assessments
In-person assessments were completed at enrollment and annually [25]. Study visits included a standardized clinical neurologic examination which was adapted from the Unified Parkinson’s Disease Rating Scale [28]. The neurologist assigned a Hachinski Ischemic Score [29], the Clinical Dementia Rating (CDR) [30], and provided a clinical impression of presence or absence of dementia.
The EAS neuropsychological testing battery was completed at each annual visit. Global cognitive performance was assessed using the Blessed Information Memory Concentration test (BIMC) [31]. The battery assessed the cognitive domains of memory, attention, executive function, visuospatial constructions, and language. Memory was measured using the Free and Cued Selective Reminding Test-Free Recall [32, 33] and the Logical Memory I test [34]. Attention was assessed using the Trail Making Test part A [35], and the Digit Span subtest of the WAIS III [36]. Executive function was measured via the Trail Making Test part B [35] and the “FAS” letter fluency test [37]. The Block Design and the Digit Symbol subtests from the WAIS III were used to evaluate visuospatial construction [36]. Language was measured using the Boston Naming Test [38] and the Category Fluency test (animals, vegetables, fruits) [39].
Subjective memory impairment was measured using the self-administered Consortium to Establish a Registry for Alzheimer’s Disease (CERAD) C1-ALT instrument for cognitive/functional impairment [40]. Functional decline was assessed using the Instrumental Activities of Daily Living subscale of the Lawton Brody Activities of Daily Living Scale [41] and the self-administered CERAD C1-ALT [40]. If the informant agreed, informant reports of cognitive impairment and functional decline were also obtained using the informant version of the CERAD C2ALT [40] and the Informant Questionnaire on Cognitive Decline in the Elderly (IQ-CODE) [42]. Functional impairment was based on information from the Lawton Brody Scale [41], clinical evaluation, and informant questionnaires.
All study visits also included standardized assessments of medical history, blood pressure, medication use, anthropometrics, and psychosocial measures [25]. Baseline history of myocardial infarction, stroke, and diabetes were determined using self-report of ever having a physician diagnosis for one of these conditions. Depression was assessed using the Geriatric Depression Scale [43].
Clinical cognitive diagnoses
Clinical diagnoses were assigned at consensus case conferences which included the study neurologist and the study neuropsychologist who comprehensively reviewed cognitive test results, relevant neurological signs and symptoms, and assessments of functional status. For purposes of diagnosis, memory impairment was defined as scores ≥1.5 SDs below the age-adjusted mean for the Logical Memory test [34], or a score of ≤24 for the sum of three trials of free recall on the Free and Cued Selective Reminding Test [32, 33]. Previous work within the EAS has demonstrated the predictive validity of this empirical cut for free recall [44]. Impairment in other cognitive domains was defined as performance 1.5 or more standard deviations below the age-adjusted mean in domains of attention, executive function, visuospatial ability, or language.
Amnestic mild cognitive impairment
Participants were diagnosed with aMCI according to updated Mayo Clinic criteria [7].
EAS criteria for aMCI were: Presence of objective memory impairment as defined above; subjective memory impairment based on responses to self- or informant- CERAD [40] or IQ CODE [42] reports; absence of functional decline as noted above; and absence of clinical dementia diagnosis [25]. For the present analysis, the incident aMCI group included anyone who met criteria for memory impairment regardless of cognitive impairment in other domains, and so encompassed both single and multiple domain aMCI.
Dementia
Dementia diagnosis was based on standardized clinical criteria from the Diagnostic and Statistical Manual, Fourth Edition (DSM-IV)[45] and required impairment in memory plus at least one additional cognitive domain, as well as evidence of functional decline. To ensure consistency of diagnostic criteria over time, all individuals evaluated before release of DSM-IV criteria in 1994 were retrospectively re-conferenced according to DSM-IV [45]. A subset of individuals enrolled in the EAS come to autopsy, providing a measure of diagnostic quality control. We have observed that a clinical diagnosis of dementia within the EAS has a positive predictive value of 96% for significant pathology [25].
Statistical analysis
The primary analyses presented here were for the outcome of incident aMCI. Individuals with dementia or aMCI at study baseline were excluded, and cases of incident dementia were censored from the analyses at the time of diagnosis. As the cognitive stages are conceptualized as existing on a continuum [11], whether aMCI is detected prior to dementia diagnosis may depend on the follow-up interval. Because the EAS follow-up interval is annual, it is possible that individuals converted from normal cognition to dementia without being observed in the aMCI stage. Given a shorter evaluation interval, the intermediate stage may have been detected. Therefore, we conducted secondary analyses in which the outcome of interest was an incident diagnosis of either aMCI or of dementia without antecedent aMCI, to confirm that results were not changed by exclusion of those not detected in the aMCI stage during follow-up.
Exploratory analyses of cohort demographics and crude aMCI incidence as a function of age and date of birth revealed no obvious differences in incidence according to year of birth, and graphical analyses using loess smoothing function did not suggest a trend. Poisson regression was used to model the incidence as a function of age, sex, race, education, and birth year, with change points used to identify the timing of noticeable increases or drops in incidence rates. Profile likelihood [46] was used to estimate the change points, with a change point allowed to possibly fall any time between 1899 and 1946, the range of years in which the EAS participants were born. The possibility of a second change point was considered by fitting a model with two change points and using likelihood ratio tests to select the best model. We have previously reported that similar to national trends in the U.S., the age specific prevalence of myocardial infarction and stroke have declined, while prevalence of diabetes has increased over successive birth cohorts in the EAS since 1915 [3, 47, 48]. To explore whether these temporal trends in cardiovascular comorbidities may have affected our results, we fit additional Poisson models of aMCI incidence by birth year that included adjustment for prevalence of myocardial infarction, stroke, or diabetes. Finally, we calculated relative rates of aMCI by grouping birth years into intervals and fitting Poisson models for the contrasts of rates in the groups. All analyses were performed using SAS 9.4 (SAS Institute, Cary, NC, USA, http:///www.sas.com).
RESULTS
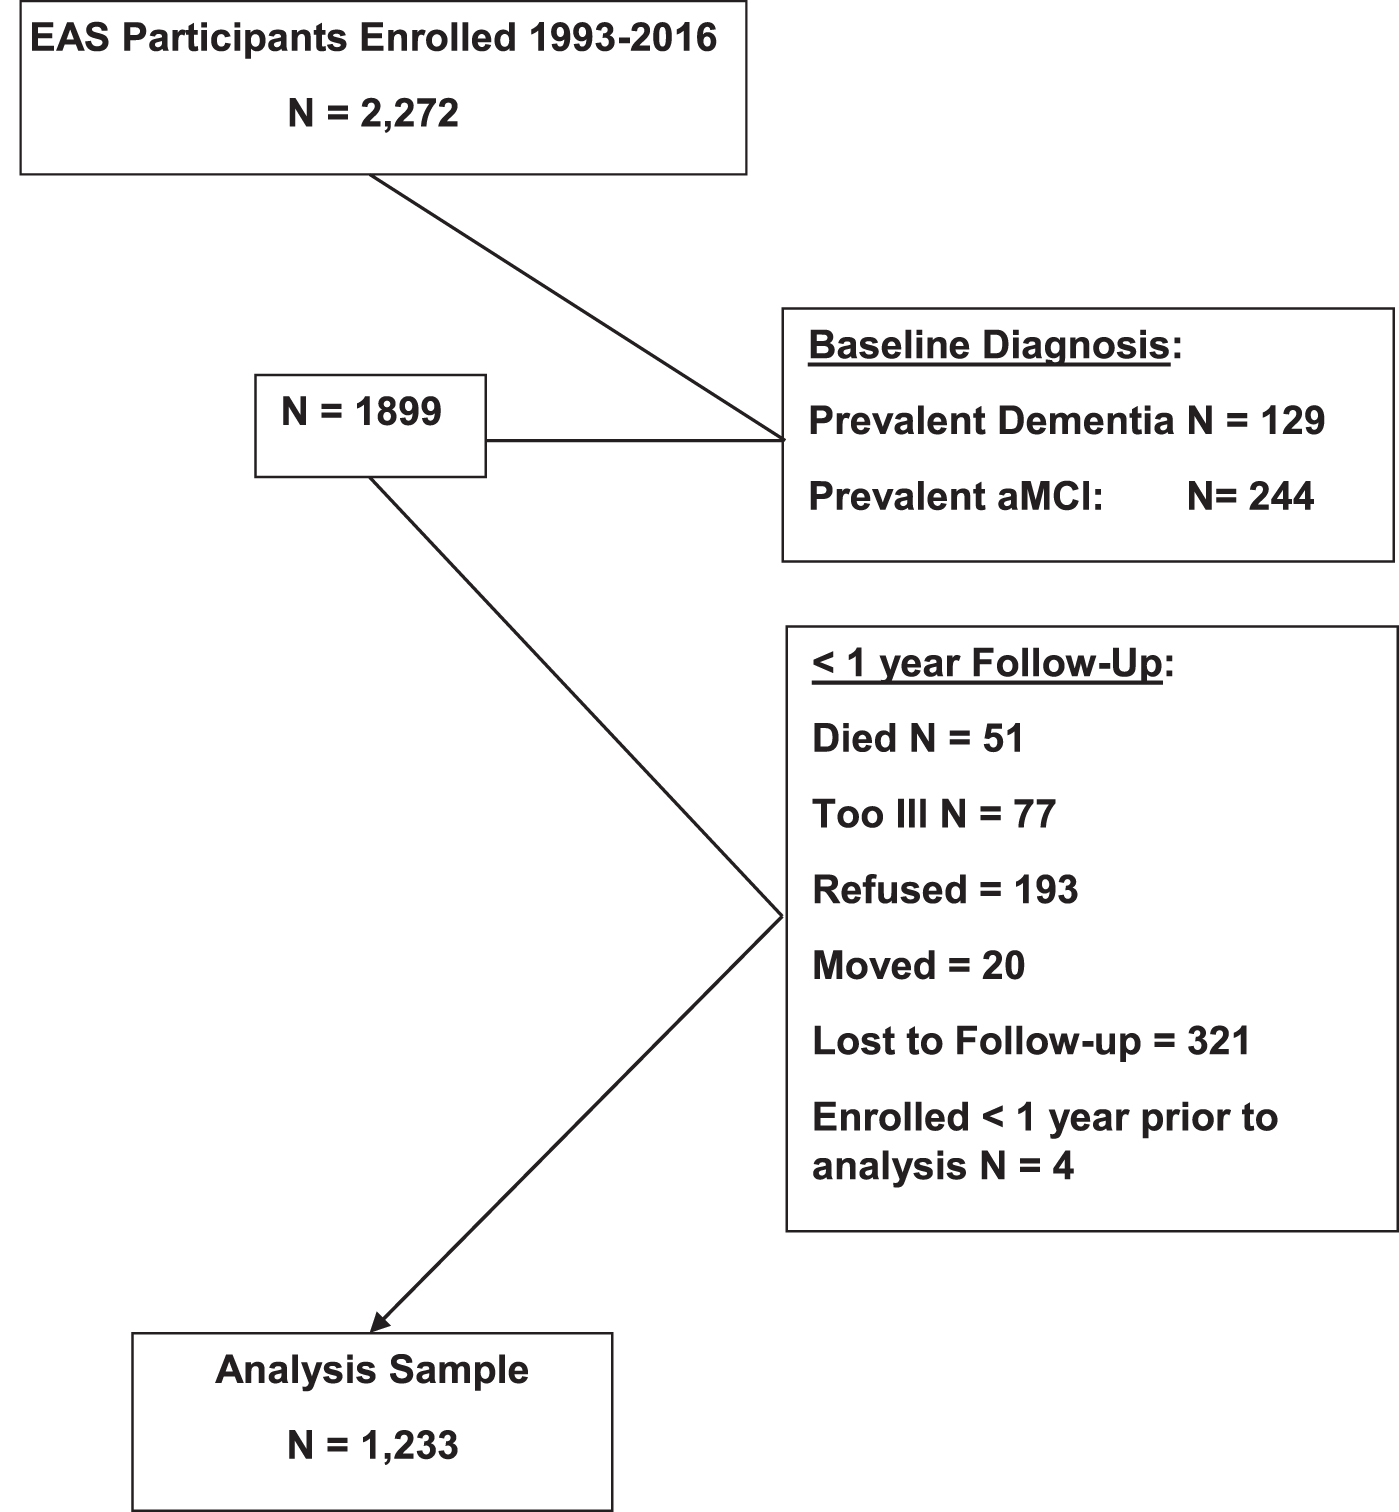
Of the 2,272 EAS participants enrolled since 1993, this analysis excluded 129 who were determined to have clinical dementia and 244 with prevalent aMCI at their baseline assessment. Of the remaining 1,899, 51 individuals died before the first follow-up, and 4 had been enrolled within one year, 77 were too ill to attend follow-up, 193 refused, 20 moved from the area, and 321 were lost to follow-up, leaving an analysis sample of 1,233 individuals enrolled between November 1, 1993 and February 22, 2016, who had at least one annual follow-up (Fig. 1). Those in the analysis sample and those excluded were similar at baseline with regard to sex (female, 62.9% versus 60.9%; χ2 test, p = 0.34), and differed slightly by age (mean 78.2 versus 79.4 years; t test, p < 0.001). The excluded group had worse scores for global cognition based on the Blessed Information Memory Concentration test (2.21 versus 4.37; Mann-Whitney test, p < 0.0001), consistent with the exclusion of those with aMCI and clinical dementia at baseline.
Fig.1
Flow Chart of EAS Participants in the Analysis Sample.
Among the 1,233 individuals in the analysis cohort, there were 224 incident cases of aMCI during 5,321 person-years of follow-up. Baseline characteristics are shown in Table 1. The proportion of African American and Hispanic individuals has increased over successive birth cohorts, reflecting changes in the Bronx community. Mean years of education is slightly higher in the more recent birth cohorts. Baseline global cognitive status defined by the BIMC [31] is consistent with the fact that subjects were free of dementia or aMCI at baseline, and baseline global performance was slightly better among individuals born more recently, consistent with their younger age and somewhat higher level of education. Scores on the FCSRT-free recall [32, 33] also reflect that participants were cognitively normal at baseline, with little difference across successive birth cohorts.
Table 1
Descriptive Characteristics by Birth Cohort, EAS 1,233 Participants Enrolled 1993–2016.
| Year of Birth Category (N) | |||||
| 1899–1920 (372) | 1921–1925 (241) | 1926–1930 (315) | 1931–1946 (305) | Total (1,233) | |
| Mean age at enrollment, y (SD) | 83.1 (4.2) | 79.5 (3.8) | 75.4 (3.9) | 74.2 (2.8) | 78.2 (5.2) |
| Mean Follow-up, y (SD) | 3.8 (2.8) | 4.7 (3.6) | 5.2 (4.1) | 3.7 (2.7) | 4.3 (3.4) |
| % Female | 62.9 | 62.2 | 61.9 | 64.3 | 62.9 |
| % Non-Hispanic White | 78.5 | 67.2 | 65.4 | 54.4 | 67.0 |
| % Non-Hispanic Black | 18.6 | 31.1 | 26.7 | 35.1 | 27.2 |
| % Hispanic | 1.6 | 0.8 | 7.0 | 7.5 | 4.3 |
| Mean Education, y (SD) | 12.7 (3.5) | 13.5 (3.5) | 13.9 (3.4) | 14.6 (3.3) | 13.7 (3.5) |
| Depression: Mean GDS | 2.7 (2.3) | 2.1 (2.2) | 2.4 (2.4) | 1.9 (2.2) | 2.2 (2.3) |
| Global Cognition: Mean BMIC | 2.5 (2.2) | 2.1 (2.1) | 2.3 (2.3) | 1.8 (1.9) | 2.2 (2.1) |
| Memory, FCSRT-Free recall | 30.7 (5.3) | 31.3 (5.0) | 32.4 (5.4) | 33.0 (4.7) | 31.8 (5.2) |
GDS, Geriatric Depression Scale, Range (0–15), with higher scores reflecting depression [43]. BMIC (Blessed Information Memory Concentration Test) Range (0–32) with higher scores reflecting worse cognition) [31]. FCSRT, Free and Cued Selective Reminding Test, Sum of free recall items across three trials Range (0–48), with higher scores reflecting better memory performance [32, 33].
Table 2 shows crude aMCI incidence rates as a function of age and dates of birth. Overall, incidence increased with increasing age within each birth cohort. Within each age stratum, there is no obvious trend in aMCI incidence rates over sequential years of birth.
Table 2
Crude aMCI Incidence Rates by Age at Diagnosis and Year of Birth Category
| Year of Birth Category (N) | ||||||
| Age (y) | 1899–1920 (372) | 1921–1925 (241) | 1926–1930 (315) | 1931–1946 (305) | Total (1,233) | |
| 70–74 | # aMCI Cases | 0 | 12 | 7 | 19 | |
| Person-years (PY) | 23.69 | 336.12 | 380.06 | 739.86 | ||
| Rate/100 PY | 0 | 3.57 | 1.84 | 2.57 | ||
| 75–79 | # aMCI Cases | 0 | 9 | 17 | 18 | 44 |
| Person-years (PY) | 142.32 | 323.07 | 592.32 | 556.14 | 1,613.84 | |
| Rate/100 PY | 0 | 2.79 | 2.87 | 3.24 | 2.73 | |
| 80–84 | # aMCI Cases | 21 | 19 | 13 | 8 | 61 |
| Person-years (PY) | 551.97 | 413.81 | 536.81 | 194.12 | 1,696.71 | |
| Rate/100 PY | 3.81 | 4.59 | 2.42 | 4.12 | 3.60 | |
| 85–89 | # aMCI Cases | 36 | 21 | 12 | 0 | 69 |
| Person-years (PY) | 512.36 | 316.23 | 156.39 | 1.89 | 986.86 | |
| Rate/100 PY | 7.03 | 6.64 | 7.67 | 0 | 7.00 | |
| 90–94 | # aMCI Cases | 17 | 8 | 1 | —— | 26 |
| Person-years (PY) | 195.41 | 57.95 | 0.94 | 254.30 | ||
| Rate/100 PY | 8.70 | 13.81 | 106.80 | 10.22 | ||
| ≥95 | # aMCI Cases | 5 | —— | —— | —— | 5 |
| Person-years (PY) | 29.37 | 29.37 | ||||
| Rate/100 PY | 17.02 | 17.02 | ||||
| Total | # aMCI Cases | 79 | 57 | 55 | 33 | 224 |
| Person-years (PY) | 1,431.43 | 1,134.74 | 1,622.58 | 1,132.21 | 5,320.96 | |
| Rate/100 PY | 5.52 | 5.02 | 3.39 | 2.91 | 4.21 | |
To test for a possible change in aMCI incidence over time, we fit Poisson regression models with change points to identify birth years for which there was a significant change in rates. Models adjusted for age, sex, race, and education did not demonstrate a significant change point over the range of birth years represented by our cohort which spanned 1899 to 1946. Further adjustment of these models for history of myocardial infarction (MI), stroke, or diabetes did not change the results.
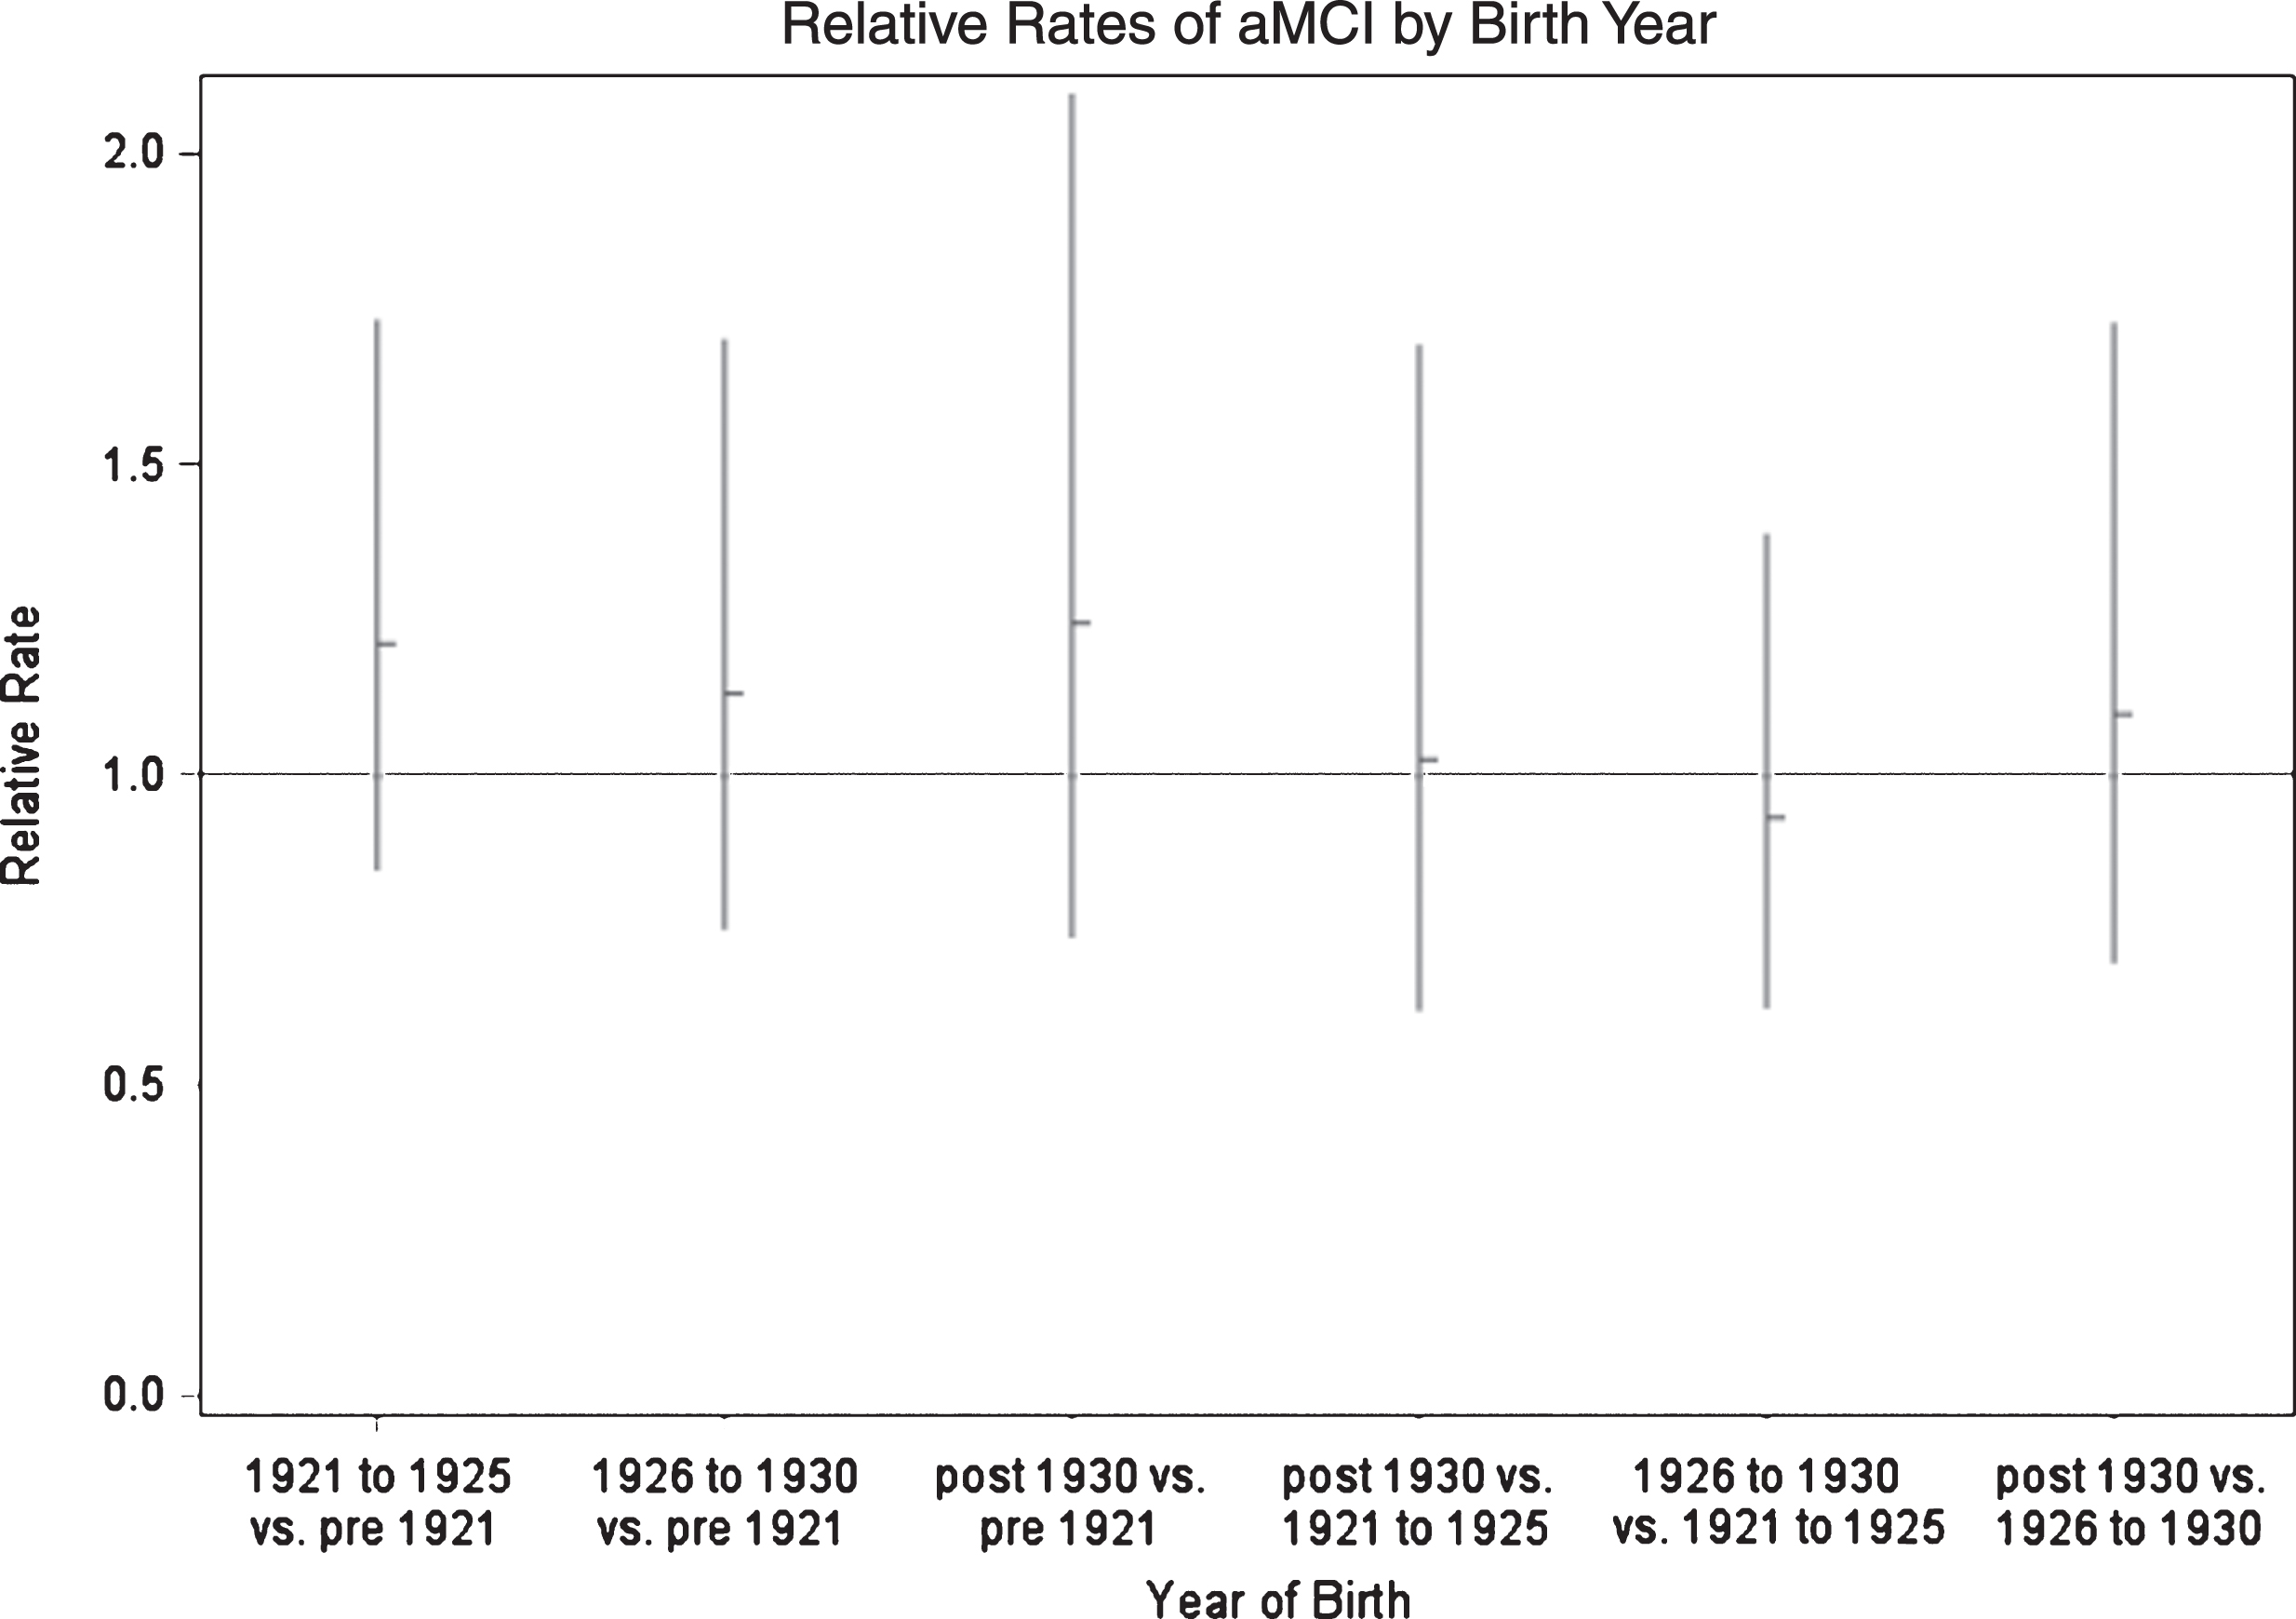
To illustrate the results of the Poisson regression analyses, we fit additional models in which years of birth were grouped into approximately equal periods, with post 1930 as the reference group, and with age, sex, education, and prevalence of MI, stroke, or diabetes included as covariates (Table 3). Using the group born after 1930 as a reference, the relative rates of aMCI were not significantly different from 1.0 for any of the prior birth cohorts. These models also demonstrated that stroke history was a strong predictor of future aMCI (relative rate 1.96, 95% CI 1.32–2.91, p < 0.001.) while history of myocardial infarction or diabetes were not. Finally, model results were used to calculate relative rates for aMCI incidence for all possible contrasts of groups based on year of birth (Fig. 2). The relative rates are not significantly different from 1.0 for any of the contrasts.
Table 3
Relative Rates of Amnestic MCI from Poisson Regression Models
| Parameter | Relative Rate | (95% Confidence Interval) | p |
| Intercept+* | 0.035 | (0.016–0.076) | |
| Birth Years | |||
| Pre 1921 | 0.80 | (0.48–1.35) | 0.72 |
| 1921–1925 | 0.97 | (0.59–1.61) | |
| 1926–1930 | 0.91 | (0.58–1.43) | |
| Post 1930 | —— | ||
| Age (y) | |||
| 70–74 | — | ||
| 75–79 | 1.080 | (0.63–1.87) | <0.0001 |
| 80–84 | 1.47 | (0.84–2.58) | |
| 85–89 | 2.94 | (1.62–5.33) | |
| 90–94 | 4.66 | (2.32–9.35) | |
| 95–99 | 6.92 | (2.18–21.94) | |
| 100+ | 44.83 | (5.72–351.25) | |
| Sex | |||
| Male versus Female | 1.06 | (0.80–1.40) | 0.70 |
| Education (y) | 0.97 | (0.94–1.01) | 0.17 |
| Race/ethnicity | |||
| Non-Hispanic White | — | ||
| Non-Hispanic Black | 1.15 | (0.85–1.57) | 0.26 |
| Hispanic White | 1.53 | (0.74–3.18) | |
| Hispanic Black | 0.00 | — | |
| Asian | 1.01 | (0.14–7.27) | |
| Other | 1.56 | (0.38–6.36) | |
| Co-morbidities (Yes versus No) | |||
| History of MI | 1.23 | (0.78–1.93) | 0.39 |
| History of Diabetes | 0.86 | (0.57–1.29) | 0.45 |
| History of Stroke | 1.92 | (1.32–2.90) | 0.002 |
*Intercept is aMCI incidence rate per person year of follow-up in a non-Hispanic white female, age 70–75, born after 1930, with 12 formal years of education and no history of myocardial infarction, stroke or diabetes.
Fig.2
Age Adjusted Relative Rates of Incident aMCI According to Years of Birth; Einstein Aging Study, Bronx, NY.
Because individuals over age 85 are not represented in the later birth cohorts, we performed a sensitivity analysis restricted to follow-up prior to age 85. Results were unchanged from those in the overall cohort.
Because EAS follow-up assessments are repeated annually, some individuals are diagnosed with dementia without having been assessed in the aMCI stage. To test whether exclusion of these cases from the incident aMCI analysis affected the results, we performed secondary analyses in which the outcome was a diagnosis of either incident aMCI or incident dementia in a person not previously diagnosed with aMCI. Results remained unchanged, with no evidence for a temporal trend in incidence over sequential birth cohorts (data not shown).
Finally, we performed sex and race specific analyses to determine whether there was evidence for a change in aMCI incidence rates within men, women, Black or White individuals. Results within each group were similar to those observed in the overall cohort, with no evidence for a change point, even in models adjusted for cardiovascular comorbidities (Supplementary Tables 1 and 2). It should be noted that these stratified analyses should be considered exploratory, as we had limited power within subgroups.
DISCUSSION
aMCI is a symptomatic, prodromal phase that may precede clinical diagnosis of AD [8]. Although there is increasing evidence that the rates of dementia and AD have declined in Western nations over recent decades [3, 4, 49, 50], previous studies have not described trends in the incidence of this intermediate state. Although dementia rates have declined within the EAS cohort over recent decades [3], this birth cohort analysis in the EAS cohort does not demonstrate evidence for a significant change in age specific aMCI incidence rates among individuals born between 1899 and 1946.
The natural history of AD is conceptualized as a continuum ranging from normal cognition to clinically recognized AD. aMCI is considered to be an intermediate state in this transition. Declining AD incidence could result from decreased rates of transitions from normal cognition to aMCI, from reduced rates of aMCI cases transitioning to AD, or both. Interpretation of trends must also consider that conversion rates from aMCI to dementia range from 10–15% /year [17, 51] with a large proportion of individuals not progressing to AD or reverting to normal cognition with continued follow-up. Finally, depending on the follow-up interval, individuals may transition from normal cognition to AD without being observed in the aMCI state. Below, we consider these possibilities in the interpretation of our results.
A temporal trend toward slowing of the progression from aMCI to dementia could explain our observation of stable aMCI incidence concurrent with declining dementia incidence. This possibility is consistent with the observed decline in cardiovascular comorbidities over recent decades overall [47, 48] and within the EAS cohort [3]. The presence of vascular pathology has been associated with faster rates of cognitive decline and higher probability of dementia diagnosis among those with AD pathology [52–54]. Thus, a decreasing prevalence of vascular disease in the population could contribute to a slowing of cognitive decline due to AD. In the present analyses, adjustment of models for prevalence of myocardial infarction or stroke did not change the results, even though stroke history was a strong predictor of aMCI in our cohort. However, the analysis was limited by only self-reported history of these conditions. Additional work is needed to more fully assess the impact of declining vascular disease rates on the rate of progression of clinical features of AD. Further, future analyses should address trends in the duration of aMCI from onset to clinical AD diagnosis, to determine whether the rates of disease progression have changed over time. This information might inform interventions targeting vascular risk in order to delay the onset of clinical AD. Projections of AD prevalence rates over the coming decades suggest that even a minor delay in AD onset would have a significant impact on the public health burden of the disease [55].
Conversely the present results are not consistent with the fact that vascular disease and vascular risk factors have also been linked to rates of cognitive decline in general [52–54, 56, 57] and with the transition from normal cognition to aMCI [58, 59]. We would expect that the favorable trends in prevalence of cardiovascular disease would be accompanied by a decline in aMCI incidence rates, although this was not observed. Future studies are needed with more robust estimates of vascular risk and comorbidities and in larger cohorts to resolve this issue and to determine whether the effect of vascular risk on onset of aMCI and on the transition from aMCI to AD are of the same magnitude.
Interest in the prodromal phase of AD has increased since clinical criteria for defining the aMCI were introduced [6, 8, 60]. Thus, increased detection of aMCI in more recent periods or changes in diagnostic criteria could potentially mask a true decline in the condition. However, given that diagnostic criteria within the EAS cohort were applied uniformly over the time period studied, this is not a likely explanation for the observed results.
Because there is evidence that females [12, 18] and African Americans [19–21] are disproportionately impacted by AD, we also tested whether trends in aMCI incidence varied by sex or for Black versus White participants. These analyses suggested that there has been no shift in aMCI rates among later birth cohorts in any of these demographic strata. However, it should be noted that our power to detect such trends was limited by small sample size within some birth cohorts in these stratified analyses. Additional studies in cohorts with larger samples are required to fully understand aMCI incidence trends within males and females and by race/ethnicity.
This analysis has a number of strengths. First, the EAS cohort is population based, and individuals were not self-selected based on cognitive symptoms. The cohort is also diverse, with nearly a quarter of participants African American. Thus, our results may be more generalizable than those from studies of clinic based or studies and those within predominantly white cohorts. A critical strength of our approach is that the diagnostic criteria were applied uniformly to the EAS cohort across the entire time frame studied. Further, the EAS diagnostic criteria for aMCI are based on the criteria established criteria by the Mayo Clinic [7, 60], and are consistent with the recently defined classification for MCI due to AD [8, 11, 12]. Finally, the present analytic approach allowed us to separate the effects of age from cohort effects on aMCI incidence rates.
Our study also has some limitations. It is possible that the failure to observe a change in aMCI rates in later birth cohorts is due to limited study power. However, given that we have previously detected a change in dementia incidence rates in more recent birth cohorts, we should have been able to detect a significant change in aMCI incidence, if present. As mentioned above, we had limited power to detect trends within strata defined by sex or race, and the numbers of aMCI rates were low in some birth cohorts.
As noted above, study of aMCI incidence trends is problematic in that individuals may convert to dementia without being observed in the aMCI phase. The EAS follow-up interval is yearly, and individuals who are cognitively normal at one study visit may present with clinical dementia at the next annual follow-up. To address the potential to “miss” incident aMCI cases who rapidly progress to clinical dementia, we conducted sensitivity analyses in which the outcome modeled was diagnosis of either dementia or aMCI, whichever occurred first. These analyses yielded similar results to the primary analyses of aMCI.
Another factor that limits the study of aMCI rates is that individuals diagnosed as aMCI may “back convert”, and no longer meet diagnostic criteria at subsequent follow-ups. A review by Pandya et al. [61] indicates that the reversion rates for MCI may equal or exceed the rates of progression. However, it should be noted that this study did not distinguish MCI subtype and did not report data for aMCI specifically. Our analysis did not account for the stability of the aMCI diagnosis over subsequent visits. Finally, the EAS enrollment included only individuals aged 70 years and above. Thus, we were not able to examine trends for rates of aMCI among younger individuals.
In summary, aMCI is an intermediate stage in the continuum from normal cognitive aging to AD, and there is growing emphasis on intervening early, in the aMCI stage or prior to aMCI in order to curb the increasing burden of AD. Despite a number of studies suggesting that rates of dementia and AD may be declining, temporal trends in aMCI onset have not been reported. Our birth cohort analysis of individuals in the population based EAS cohort who were born between 1899 and 1946 do not suggest a decrease in aMCI incidence in more recent birth cohorts. However, additional studies are required to understand whether decreasing rates of aMCI onset or decreased conversion of aMCI to AD underlie the observed declines AD incidence. The former might indicate that secular trends in AD risk factors have impacted the onset of AD neuropathological changes while the later might indicate that changes in risk factors or comorbidities have slowed the progression of the disease to clinical AD. Better understanding temporal trends in aMCI rates may enhance understanding of the impact of secular trends in modifiable risk factors on the natural history of AD, and may inform targets for early interventions aimed at primary and secondary prevention of AD.
ACKNOWLEDGMENTS
This work was supported by the National Institutes of Health, National Institute on Aging: NIH/NIA AG03949, and by the Sylvia and Leonard Marx Foundation and by the Czap Foundation.
Authors’ disclosures available online (https://www.j-alz.com/manuscript-disclosures/18-1141r2).
SUPPLEMENTARY MATERIAL
[1] The supplementary material is available in the electronic version of this article: http://dx.doi.org/10.3233/JAD-181141.
REFERENCES
[1] | World Health Organization and Alzheimer’s Disease International ((2012) ) Dementia: A Public Health Priority, World Health Organization, Geneva. |
[2] | Rocca WA , Petersen RC , Knopman DS , Hebert LE , Evans DA , Hall KS , Gao S , Unverzagt FW , Langa KM , Larson EB , White LR ((2011) ) Trends in the incidence and prevalence of Alzheimer’s disease, dementia, and cognitive impairment in the United States. Alzheimers Dement 7: , 80–93. |
[3] | Derby CA , Katz MJ , Lipton RB , Hall CB ((2017) ) Trends in dementia incidence in a birth cohort analysis of the Einstein Aging Study. JAMA Neurol 74: , 1345–1351. |
[4] | Satizabal CL , Beiser AS , Chouraki V , Chene G , Dufouil C , Seshadri S ((2016) ) Incidence of dementia over three decades in the Framingham Heart Study. N Engl J Med 374: , 523–532. |
[5] | Schrijvers EM , Verhaaren BF , Koudstaal PJ , Hofman A , Ikram MA , Breteler MM ((2012) ) Is dementia incidence declining? Trends in dementia incidence since 1990 in the Rotterdam Study. Neurology 78: , 1456–1463. |
[6] | Sperling RA , Amariglio RE , Marshall GA , Rentz DM ((2015) ) Establishing clinical relevance in preclinical Alzheimer’s disease. J Prev Alzheimers Dis 2: , 85–87. |
[7] | Artero S , Petersen R , Touchon J , Ritchie K ((2006) ) Revised criteria for mild cognitive impairment: Validation within a longitudinal population study. Dement Geriatr Cogn Disord 22: , 465–470. |
[8] | Albert MS , DeKosky ST , Dickson D , Dubois B , Feldman HH , Fox NC , Gamst A , Holtzman DM , Jagust WJ , Petersen RC , Snyder PJ , Carrillo MC , Thies B , Phelps CH ((2011) ) The diagnosis of mild cognitive impairment due to Alzheimer’s disease: Recommendations from the National Institute on Aging-Alzheimer’s Association workgroups on diagnostic guidelines for Alzheimer’s disease. Alzheimers Dement 7: , 270–279. |
[9] | Schmidtke K , Hermeneit S ((2008) ) High rate of conversion to Alzheimer’s disease in a cohort of amnestic MCI patients. Int Psychogeriatr 20: , 96–108. |
[10] | Petersen RC , Stevens JC , Ganguli M , Tangalos EG , Cummings JL , DeKosky ST ((2001) ) Practice parameter: Early detection of dementia: Mild cognitive impairment (an evidence-based review). Report of the Quality Standards Subcommittee of the American Academy of Neurology. Neurology 56: , 1133–1142. |
[11] | Jack CR Jr , Bennett DA , Blennow K , Carrillo MC , Dunn B , Haeberlein SB , Holtzman DM , Jagust W , Jessen F , Karlawish J , Liu E , Molinuevo JL , Montine T , Phelps C , Rankin KP , Rowe CC , Scheltens P , Siemers E , Snyder HM , Sperling R , Contributors ((2018) ) NIA-AA Research Framework: Toward a biological definition of Alzheimer’s disease. Alzheimers Dement 14: , 535–562. |
[12] | Au B , Dale-McGrath S , Tierney MC ((2017) ) Sex differences in the prevalence and incidence of mild cognitive impairment: A meta-analysis. Ageing Res Rev 35: , 176–199. |
[13] | Brookmeyer R , Abdalla N , Kawas CH , Corrada MM ((2018) ) Forecasting the prevalence of preclinical and clinical Alzheimer’s disease in the United States. Alzheimers Dement 14: , 121–129. |
[14] | Domingues NS , Verreault P , Hudon C ((2018) ) Reducing burden for caregivers of older adults with mild cognitive impairment: A systematic review. Am J Alzheimers Dis Other Demen 33: , 401–414. |
[15] | Lin PJ , Neumann PJ ((2013) ) The economics of mild cognitive impairment. Alzheimers Dement 9: , 58–62. |
[16] | Sachdev PS , Lipnicki DM , Kochan NA , Crawford JD , Thalamuthu A , Andrews G , Brayne C , Matthews FE , Stephan BC , Lipton RB , Katz MJ , Ritchie K , Carriere I , Ancelin ML , Lam LC , Wong CH , Fung AW , Guaita A , Vaccaro R , Davin A , Ganguli M , Dodge H , Hughes T , Anstey KJ , Cherbuin N , Butterworth P , Ng TP , Gao Q , Reppermund S , Brodaty H , Schupf N , Manly J , Stern Y , Lobo A , Lopez-Anton R , Santabarbara J , Cohort Studies of Memory in an International Consortium (COSMIC) ((2015) ) The prevalence of mild cognitive impairment in diverse geographical and ethnocultural regions: The COSMIC Collaboration. PLoS One 10: , e0142388. |
[17] | Manly JJ , Tang MX , Schupf N , Stern Y , Vonsattel JP , Mayeux R ((2008) ) Frequency and course of mild cognitive impairment in a multiethnic community. Ann Neurol 63: , 494–506. |
[18] | Winblad B , Amouyel P , Andrieu S , Ballard C , Brayne C , Brodaty H , Cedazo-Minguez A , Dubois B , Edvardsson D , Feldman H , Fratiglioni L , Frisoni GB , Gauthier S , Georges J , Graff C , Iqbal K , Jessen F , Johansson G , Jonsson L , Kivipelto M , Knapp M , Mangialasche F , Melis R , Nordberg A , Rikkert MO , Qiu C , Sakmar TP , Scheltens P , Schneider LS , Sperling R , Tjernberg LO , Waldemar G , Wimo A , Zetterberg H ((2016) ) Defeating Alzheimer’s disease and other dementias: A priority for European science and society. Lancet Neurol 15: , 455–532. |
[19] | Shadlen MF , Siscovick D , Fitzpatrick AL , Dulberg C , Kuller LH , Jackson S ((2006) ) Education, cognitive test scores, and black-white differences in dementia risk. J Am Geriatr Soc 54: , 898–905. |
[20] | Plassman BL , Langa KM , Fisher GG , Heeringa SG , Weir DR , Ofstedal MB , Burke JR , Hurd MD , Potter GG , Rodgers WL , Steffens DC , Willis RJ , Wallace RB ((2007) ) Prevalence of dementia in the United States: The aging, demographics, and memory study. Neuroepidemiology 29: , 125–132. |
[21] | Tang MX , Cross P , Andrews H , Jacobs DM , Small S , Bell K , Merchant C , Lantigua R , Costa R , Stern Y , Mayeux R ((2001) ) Incidence of AD in African-Americans, Caribbean Hispanics, and Caucasians in northern Manhattan. Neurology 56: , 49–56. |
[22] | Ward A , Arrighi HM , Michels S , Cedarbaum JM ((2012) ) Mild cognitive impairment: Disparity of incidence and prevalence estimates. Alzheimers Dement 8: , 14–21. |
[23] | Gross AL , Hassenstab JJ , Johnson SC , Clark LR , Resnick SM , Kitner-Triolo M , Masters CL , Maruff P , Morris JC , Soldan A , Pettigrew C , Albert MS ((2017) ) A classification algorithm for predicting progression from normal cognition to mild cognitive impairment across five cohorts: The preclinical AD consortium. Alzheimers Dement (Amst) 8: , 147–155. |
[24] | Sachdev PS , Lipnicki DM , Kochan NA , Crawford JD , Thalamuthu A , Andrews G , Brayne C , Matthews FE , Stephan BC , Lipton RB , Katz MJ , Ritchie K , Carriere I , Ancelin ML , Lam LC , Wong CH , Fung AW , Guaita A , Vaccaro R , Davin A , Ganguli M , Dodge H , Hughes T , Anstey KJ , Cherbuin N , Butterworth P , Ng TP , Gao Q , Reppermund S , Brodaty H , Schupf N , Manly J , Stern Y , Lobo A , Lopez-Anton R , Santabarbara J , Cohort Studies of Memory in an International Consortium (COSMIC) ((2015) ) The prevalence of mild cognitive impairment in diverse geographical and ethnocultural regions: The COSMIC Collaboration. PLoS One 10: , e0142388. |
[25] | Katz MJ , Lipton RB , Hall CB , Zimmerman ME , Sanders AE , Verghese J , Dickson DW , Derby CA ((2012) ) Age-specific and sex-specific prevalence and incidence of mild cognitive impairment, dementia, and Alzheimer dementia in blacks and whites: A report from the Einstein Aging Study. Alzheimer Dis Assoc Disord 26: , 335–343. |
[26] | Lipton RB , Katz MJ , Kuslansky G , Sliwinski MJ , Stewart WF , Verghese J , Crystal HA , Buschke H ((2003) ) Screening for dementia by telephone using the memory impairment screen. J Am Geriatr Soc 51: , 1382–1390. |
[27] | United States Census Bureau American Fact Finder, factfinder.census.gov/faces/nav/jsf/pages/index.xhtml?_ts=498596416732. |
[28] | Fahn S , Elton R ((1987) ) Unified Parkinson’s disease rating scale. In Recent Developments in Parkinson’s Disease, Vol.2, Fahn S, Marsden CD, Golstein M, Calne DB, eds. Macmillan Healthcare Information, Florham Park, NJ, pp. 293–304. |
[29] | Hachinski VC , Lassen NA , Marshall J ((1974) ) Multi-infarct dementia. A cause of mental deterioration in the elderly. Lancet 2: , 207–210. |
[30] | Morris JC ((1993) ) The Clinical Dementia Rating (CDR): Current version and scoring rules. Neurology 43: , 2412–2414. |
[31] | Blessed G , Tomlinson BE , Roth M ((1968) ) The association between quantitative measures of dementia and of senile change in the cerebral grey matter of elderly subjects. Br J Psychiatry 114: , 797–811. |
[32] | Buschke H ((1984) ) Cued recall in amnesia. J Clin Neuropsychol 6: , 433–440. |
[33] | Grober E , Lipton RB , Hall C , Crystal H ((2000) ) Memory impairment on free and cued selective reminding predicts dementia. Neurology 54: , 827–832. |
[34] | Wechsler D ((1987) ) Memory Scale - Revised, The Psychological Corporation. |
[35] | Reitan R ((1958) ) Validity of the Trail Making Test as an indicator of organic brain damage. J Comp Physiological Psychol 48: , 474–477. |
[36] | Wechsler D ((1997) ) Adult Intelligence Scale III, San Antonio, TX. |
[37] | Benton AL , Hamsher K ((1989) ) Multilingual Aphasia Examination, Iowa City, IA. |
[38] | Kaplan RF , Goodglass H , Weintraub S ((1983) ) The Boston Naming Test, Lea & Febiger, Philadelphia, PA. |
[39] | Monsch AU , Bondi MW , Butters N , Salmon DP , Katzman R , Thal LJ ((1992) ) Comparisons of verbal fluency tasks in the detection of dementia of the Alzheimer type. Arch Neurol 49: , 1253–1258. |
[40] | Morris JC , Heyman A , Mohs RC , Hughes JP , van Belle G , Fillenbaum G , Mellits ED , Clark C ((1989) ) The Consortium to Establish a Registry for Alzheimer’s Disease (CERAD). Part I. Clinical and neuropsychological assessment of Alzheimer’s disease. Neurology 39: , 1159–1165. |
[41] | Lawton MP , Brody EM ((1969) ) Assessment of older people: Self-maintaining and instrumental activities of daily living. Gerontologist 9: , 179–186. |
[42] | Jorm AF , Jacomb PA ((1989) ) The Informant Questionnaire on Cognitive Decline in the Elderly (IQCODE): Socio-demographic correlates, reliability, validity and some norms. Psychol Med 19: , 1015–1022. |
[43] | Sheikh JI , Yesavage JA ((1986) ) Geriatric depression scale (GDS); recent evidence and development of a shorter version. In Clinical Gerontology: A Guide to Assessment and Intervention, Brink TL, ed. Haworth Press, New York, NY, pp. 165–173. |
[44] | Derby CA , Burns LC , Wang C , Katz MJ , Zimmerman ME , L’italien G , Guo Z , Berman RM , Lipton RB ((2013) ) Screening for predementia AD: Time-dependent operating characteristics of episodic memory tests. Neurology 80: , 1307–1314. |
[45] | Diagnostic and Statistical Manual of Mental Disorders, DSM-IV ((1994) ), American Psychiatric Association, Washington, DC. |
[46] | Hall CB , Lipton RB , Sliwinski M , Stewart WF ((2000) ) A change point model for estimating the onset of cognitive decline in preclinical Alzheimer’s disease. Stat Med 19: , 1555–1566. |
[47] | Koton S , Schneider AL , Rosamond WD , Shahar E , Sang Y , Gottesman RF , Coresh J ((2014) ) Stroke incidence and mortality trends in US communities, 1987 to 2011. JAMA 312: , 259–268. |
[48] | Rosamond W , Flegal K , Furie K , Go A , Greenlund K , Haase N , Hailpern SM , Ho M , Howard V , Kissela B , Kittner S , Lloyd-Jones D , McDermott M , Meigs J , Moy C , Nichol G , O’Donnell C , Roger V , Sorlie P , Steinberger J , Thom T , Wilson M , Hong Y , American Heart Association Statistics Committee and Stroke Statistics Subcommittee ((2008) ) Heart disease and stroke statistics–2008 update: A report from the American Heart Association Statistics Committee and Stroke Statistics Subcommittee. Circulation 117: , e25–146. |
[49] | Schrijvers EM , Verhaaren BF , Koudstaal PJ , Hofman A , Ikram MA , Breteler MM ((2012) ) Is dementia incidence declining? Trends in dementia incidence since 1990 in the Rotterdam Study. Neurology 78: , 1456–1463. |
[50] | Rocca WA , Petersen RC , Knopman DS , Hebert LE , Evans DA , Hall KS , Gao S , Unverzagt FW , Langa KM , Larson EB , White LR ((2011) ) Trends in the incidence and prevalence of Alzheimer’s disease, dementia, and cognitive impairment in the United States. Alzheimers Dement 7: , 80–93. |
[51] | Petersen RC , Doody R , Kurz A , Mohs RC , Morris JC , Rabins PV , Ritchie K , Rossor M , Thal L , Winblad B ((2001) ) Current concepts in mild cognitive impairment. Arch Neurol 58: , 1985–1992. |
[52] | Chui HC , Zarow C , Mack WJ , Ellis WG , Zheng L , Jagust WJ , Mungas D , Reed BR , Kramer JH , Decarli CC , Weiner MW , Vinters HV ((2006) ) Cognitive impact of subcortical vascular and Alzheimer’s disease pathology. Ann Neurol 60: , 677–687. |
[53] | Ezzati A , Wang C , Lipton RB , Altschul D , Katz MJ , Dickson DW , Derby CA ((2017) ) Association between vascular pathology and rate of cognitive decline independent of Alzheimer’s disease pathology. J Am Geriatr Soc 65: , 1836–1841. |
[54] | Schneider JA , Wilson RS , Cochran EJ , Bienias JL , Arnold SE , Evans DA , Bennett DA ((2003) ) Relation of cerebral infarctions to dementia and cognitive function in older persons. Neurology 60: , 1082–1088. |
[55] | Brookmeyer R , Evans DA , Hebert L , Langa KM , Heeringa SG , Plassman BL , Kukull WA ((2011) ) National estimates of the prevalence of Alzheimer’s disease in the United States. Alzheimers Dement 7: , 61–73. |
[56] | Gottesman RF , Schneider AL , Albert M , Alonso A , Bandeen-Roche K , Coker L , Coresh J , Knopman D , Power MC , Rawlings A , Sharrett AR , Wruck LM , Mosley TH ((2014) ) Midlife hypertension and 20-year cognitive change: The atherosclerosis risk in communities neurocognitive study. JAMA Neurol 71: , 1218–1227. |
[57] | Rawlings AM , Sharrett AR , Schneider AL , Coresh J , Albert M , Couper D , Griswold M , Gottesman RF , Wagenknecht LE , Windham BG , Selvin E ((2014) ) Diabetes in midlife and cognitive change over 20 years: A cohort study. Ann Intern Med 161: , 785–793. |
[58] | Pal K , Mukadam N , Petersen I , Cooper C ((2018) ) Mild cognitive impairment and progression to dementia in people with diabetes, prediabetes and metabolic syndrome: A systematic review and meta-analysis. Soc Psychiatry Psychiatr Epidemiol 53: , 1149–1160. |
[59] | Li JQ , Tan L , Wang HF , Tan MS , Tan L , Xu W , Zhao QF , Wang J , Jiang T , Yu JT ((2016) ) Risk factors for predicting progression from mild cognitive impairment to Alzheimer’s disease: A systematic review and meta-analysis of cohort studies. J Neurol Neurosurg Psychiatry 87: , 476–484. |
[60] | Petersen RC ((2004) ) Mild cognitive impairment as a diagnostic entity. J Intern Med 256: , 183–194. |
[61] | Pandya SY , Clem MA , Silva LM , Woon FL ((2016) ) Does mild cognitive impairment always lead to dementia? A review. J Neurol Sci 369: , 57–62. |


