
Connectivity Between Brain Networks Dynamically Reflects Cognitive Status of Parkinson’s Disease: A Longitudinal Study
Abstract
Background:
Cognitive impairment in Parkinson’s disease (PD) is associated with altered connectivity of the resting state networks (RSNs). Longitudinal studies in well cognitively characterized PD subgroups are missing.
Objectives:
To assess changes of the whole-brain connectivity and between-network connectivity (BNC) of large-scale functional networks related to cognition in well characterized PD patients using a longitudinal study design and various analytical methods.
Methods:
We explored the whole-brain connectivity and BNC of the frontoparietal control network (FPCN) and the default mode, dorsal attention, and visual networks in PD with normal cognition (PD-NC, n = 17) and mild cognitive impairment (PD-MCI, n = 22) as compared to 51 healthy controls (HC). We applied regions of interest-based, partial least squares, and graph theory based network analyses. The differences among groups were analyzed at baseline and at the one-year follow-up visit (37 HC, 23 PD all).
Results:
The BNC of the FPCN and other RSNs was reduced, and the whole-brain analysis revealed increased characteristic path length and decreased average node strength, clustering coefficient, and global efficiency in PD-NC compared to HC. Values of all measures in PD-MCI were between that of HC and PD-NC. After one year, the BNC was further increased in the PD-all group; no changes were detected in HC. No cognitive domain z-scores deteriorated in either group.
Conclusion:
As compared to HC, PD-NC patients display a less efficient transfer of information globally and reduced BNC of the visual and frontoparietal control network. The BNC increases with time and MCI status, reflecting compensatory efforts.
INTRODUCTION
Studying the connectivity of large-scale brain networks has enhanced the knowledge about the neural underpinnings of specific Parkinson’s disease (PD) symptoms [1]. Abnormal striatal connectivity within the associate striatal circuitry and frontoparietal network [2, 3] and decreased engagement of the default mode network [4–9] have been major findings in PD with cognitive impairment. However, between-network functional interplay and whole-brain graph measures might provide even deeper insight into the dynamic processes related to brain pathophysiology and brain adaptation to cognitive demands [10–13]. In preclinical Alzheimer’s disease, the earliest accumulation of amyloid-β in yet cerebrospinal fluid (CSF) negative/amyloid-PET negative individuals occurs within the default mode network (DMN) and disrupts the connectivity between the DMN and the frontoparietal network [14]. In PD, the increased connectivity between the right insula (which is part of the frontoparietal control network; FPCN) and the DMN describes both the biological impact of pathophysiological processes (through correlation with CSF biomarkers) and the clinical status (by classification of patient group) [13]. To our knowledge, no study has yet addressed the topic of distinct inter-network connectivity related to cognition in cognitively well-characterized PD subgroups, i.e., in patients with normal cognition (PD-NC) and patients with mild cognitive impairment (PD-MCI) [15] as compared to healthy controls (HC) in a longitudinal prospective study.
We were specifically interested in the between-network connectivity (BNC) between the FPCN and both task-positive cognitive brain networks: the dorsal attention network (DAN) and the visual network (VN), and the only task-negative network: the DMN.
The FPCN plays a central role in decision-making and cognitive task performance control. It engages the anterior prefrontal cortex, insula, anterior cingulate, and anterior inferior parietal lobule, i.e., brain regions that are cortical area projections of the basal ganglia association circuitry and are directly affected by basal ganglia dopaminergic deficits [2, 16, 17]. Cortical dopamine deficits observed in the insula and anterior cingulate cortices, as assessed by [11C]FLB PET (i.e., a cortical D2 dopamine receptor ligand), were linked with attention and memory deficits in PD with mild cognitive impairment (PD-MCI) [18]. These brain regions are particularly involved in conflict monitoring, information integration, and response selection; while the posterior parietal regions are mostly engaged in controlling spatial attention [19]. By being spatially positioned between the DMN and DAN nodes, the FPCN is thought to play a regulatory role in switching between the DMN and task-positive networks [19–22].
The DMN consists of the ventral medial prefrontal cortex, dorsal medial prefrontal cortex, posterior cingulate cortex, precuneus, and posterior inferior parietal lobule. Its activity is suppressed during tasks, and it is prominent in resting-state fMRI [23, 24]. The DMN is involved in mind wandering, and is associated with internally directed cognitions [19]. On the other hand, the DAN is particularly engaged in externally directed top-down visual attention control and it incorporates the dorsolateral prefrontal cortex, frontal eye field, middle temporal motion complex, inferior precentral sulcus, and superior parietal lobule [25]. The abnormal integrity of the DAN and the involvement of its aberrant nodes in working-memory tasks and visual attention in PD has been reported previously (e.g., [26–29]). The VN comprises the calcarine fissure, cuneus, and lateral occipital cortex [19, 30]; its abnormal connection with the DMN was reported in various stages of PD and is associated with impaired visual processing [11, 31, 32] and the misperceptions that are frequent among PD patients [33].
We expected to reveal BNC disruption between the FPCN and all studied cognitive RSNs, especially in the PD-MCI group. Particularly the FPCN-DMN inter-network connectivity in PD patients should be related to cognitive outcomes [4, 5, 18, 27, 34]. On the other hand, the FPCN connectivity with other cognitive RSNs may be already impaired in the PD-NC group as compared to HC due to early attention, executive, and visual disturbances in PD [35, 36].
While applying a hypothesis-driven approach, the inclusion of cognitive brain networks of interest may be suitable for answering specific questions; however, the approach may not be generalizable, and some important and relevant changes in the functional brain connectome and its architecture might be missed. On the other hand, using solely a data-driven approach such as whole-brain graph measures may reveal global brain pathology-related abnormalities [7, 37–39], but the results may be difficult to interpret in terms of clinical relevance. Therefore, we decided to use and combine both approaches and applied three different methods: seed-based BNC analysis, partial least squares analysis (using the ROI approach), and a graph theory-based analysis (using the whole brain as well as ROIs approach). Moreover, studies remain inconsistent with regard to the direction of functional connectivity changes reflecting either pathology-induced within-network or inter-network connection deficits (e.g., [14, 40]), or conversely, connectivity increases due to brain compensatory mechanisms [2, 41, 42], or both [2, 27, 41, 43]. Works approaching the subject from the network neuroscience perspective [44] are even more varied in terms of results and their interpretations in PD with or without cognitive impairment as compared to HC [7, 37–39, 45]. To explain these inconsistences, we applied a longitudinal study design.
METHODS
Study participants
Our cohort consisted of 99 subjects: 58 healthy controls (HC) and 41 PD patients including 17 PD patients with normal cognition (PD-NC) and 24 PD patients with mild cognitive impairment (PD-MCI). The HC and PD cohorts were described previously [2]; see also Table 1. All subjects were examined clinically; they underwent cognitive testing using a detailed neuropsychological test battery covering all cognitive domains and an MRI examination using the 3T Siemens Prisma machine at baseline and at the one-year follow-up visit. Anatomical T1 and fMRI scans were acquired using 3T Siemens Prisma MR scanner (Siemens Corp., Erlangen, Germany). PD subjects were examined in the ON medication state without dyskinesias. Each subject signed an informed consent form and the study was approved by the local ethics committee.
Table 1
Demographic and clinical variables
| Variables | HC, n = 51 | PD-NC, n = 17 | PD-MCI, n = 22 | HC versus PD-NC | HC versus PD-MCI | PD-NC versus PD-MCI |
| Age* [y] | 68 (47 – 80) | 61 (45 – 80) | 68 (43 – 80) | p = 0.01 | p = 0.80 | p = 0.12 |
| Gender [% of male] | 29.4 | 76.5 | 68.2 | p < 0.001 | p < 0.005 | p = 0.57 |
| Education* [y] | 16.0 (12.0 – 21.0) | 17 (11 – 21) | 13 (9 – 21) | p = 0.41 | p = 0.08 | p = 0.01 |
| MMSE* | 29 (26 – 30) | 28 (26 – 30) | 27 (22 – 30) | p = 0.94 | p = 0.01 | p = 0.09 |
| Memory z-score* | 0.5 (–0.3 –1.5) | 0.5 (–0.8 –1.5) | –0.6 (–2.1 –1.5) | p = 0.17 | p < 0.001 | p = 0.01 |
| Attention z-score* | 0.1 (–1.7 –1.2) | –0.1 (–1.6 –1.2) | –1.4 (–3.0 –1.2) | p = 0.70 | p < 0.001 | p = 0.01 |
| Executive functions z-score* | 0.5 (–0.9 –2.1) | 0.5 (–1.0 –2.1) | –0.6 (–2.5 –2.1) | p = 0.86 | p < 0.001 | p < 0.005 |
| Visuospatial functions z-score* | 0.3 (–1.2 –1.6) | 0.6 (–1.3 –1.6) | 0.1 (–2.1 –1.6) | p = 0.99 | p = 0.05 | p = 0.17 |
| Language z-score* | 0.7 (–0.8 –0.7) | 0.7 (–1.9 –0.7) | 0.3 (–2.2 –0.7) | p = 0.46 | p = 0.03 | p = 0.61 |
| FAQ* | 100 (90 – 100) | 97 (93 – 100) | 97 (50 – 100) | p = 0.06 | p = 0.01 | p = 0.97 |
| GDS* | 1.0 (0 – 10) | 3.0 (0 – 10) | 2.5 (0 – 10) | p = 0.53 | p = 0.37 | p = 0.99 |
| LED* | – | 610.0 (160.0 – 1928.0) | 895.0 (160.0 – 1710.0) | – | – | p = 0.48 |
| Disease duration* [y] | – | 4 (1 – 10) | 5 (1 – 20) | – | – | p = 0.59 |
| UPDRS III* | – | 14 (6 – 40) | 14.0 (7.0 – 39.0) | – | – | p = 0.86 |
| Hoehn and Yahr stage* | – | 2.0 (1.0 – 2.5) | 2.0 (1.0 – 2.5) | – | – | p = 0.78 |
*median (min-max); ns, nonsignificant; MMSE, Mini-Mental State Examination; FAQ, Functional Activities Questionnaire; GDS, Geriatric Depression Scale; LED, levodopa equivalent dose; UPDRS III, Unified Parkinson’s disease rating scale Part III (motor examination).
Neuropsychological examination and recruitment of PD subjects based on published criteria
The complex neuropsychological testing evaluated global cognitive functions (Mini-Mental State Examination, MMSE), five cognitive domains [2]: memory (Rey-Osterrieth Complex Figure Test: Immediate Recall, Delayed Recall, Recognition Task; Wechsler Memory Scale III: Word List I, Word List II, Recognition Task); attention (Stroop Color and Word Test: Word, Color parts and Trail-Making Test part A); executive functions (Stroop Color and Word Test: Color-Word part, Trail-Making Test part A, Verbal Fluency Test: semantic, lexical and Clock test); visuospatial functions (Rey-Osterrieth Complex Figure Test: Copy, Visual Object and Space Perception Battery – Silhouettes); language (Mississippi Aphasia Screening Test – Receptive, Expressive, and Total index), activities of daily living (Functional Activities Questionnaire, and depression (Geriatric Depression Scale).
All five cognitive domains were inspected for cognitive decline. Subjects who scored below -1.5 SD in two tests in one domain compared to normative data were categorized as having MCI. In addition, we applied the MCI criteria of Litvan et al. [15], according to which subjects have concerns regarding a change in cognition, impairment in one or more cognitive domains, and preservation of independence in functional abilities. The cognitive domain z-scores were computed as the average z-scores of the tests included in the particular domain [2]. Exclusion criteria for subjects included alcohol/drug abuse, hallucinations or visual misperceptions, and any diagnosed psychiatric disorder. All PD patients were longitudinally followed at the First Department of Neurology, Masaryk University and St Anne’s Hospital, Brno, Czech Republic.
Pearson’s chi-squared test was used to assess differences between groups in gender distribution and Kruskal-Wallis test with post-hoc tests was used in case of cognitive domains, age, education, MMSE, FAQ and GDS. To compare PD-NC and PD-MCI groups in terms of levodopa equivalent dose (LED), disease duration, UPDRS III and HY stage, Mann-Whitney U-test was used. Nonparametric tests were used in all analyses due to non-normal data distribution.
MRI examination
MRI sequences
The following MRI sequences were used: magnetization-prepared rapid gradient-echo (MPRAGE) high-resolution T1-weighted images (240 sagittal slices, slice thickness = 1 mm, TR = 2300 ms, TE = 2.36 ms, FA = 8°, FOV = 256 mm, matrix size 256×256) and gradient-echo echo-planar imaging sequence (200 scans, 39 transversal slices, slice thickness = 3 mm, TR = 2080 ms, TE = 30 ms, FA = 90°, FOV = 192 mm, matrix size 64×64) acquired during resting-state condition (eyes closed, subjects instructed to lie still and not to fall asleep).
Resting-state fMRI data analysis
Resting-state fMRI data were analyzed using MATLAB 2014a (MathWorks, Inc.) and SPM12 software (https://www.fil.ion.ucl.ac.uk/spm/software/spm12/). The pre-processing of the functional data consisted of realignment and unwarping, normalization into standard anatomical space (MNI), and spatial smoothing using gaussian filter kernel with FWHM of 5 mm. We thoroughly checked for motion artefacts using framewise displacement (FD) [46]. Subjects with more than 10% of scans with FD > 0.75 mm or at least one scan with FD > 3 mm were excluded (seven HC, two PD-MCI; the mean FD was equal between groups, p > 0.05, ANOVA). In addition, the functional time series of the remaining subjects were scrubbed [46] (scans that showed FD > 0.75 mm were removed). Volumes preceding or following high-motion volumes were not removed, following the recommendation of Siegel et al. [47]. Moreover, the six-motion parameter time series, FD, and the signals from white matter and cerebrospinal fluid were regressed out of the data in subsequent analyses. The level of motion was also inspected visually during scanning by instructed technicians.
Between-network connectivity (BNC) analysis
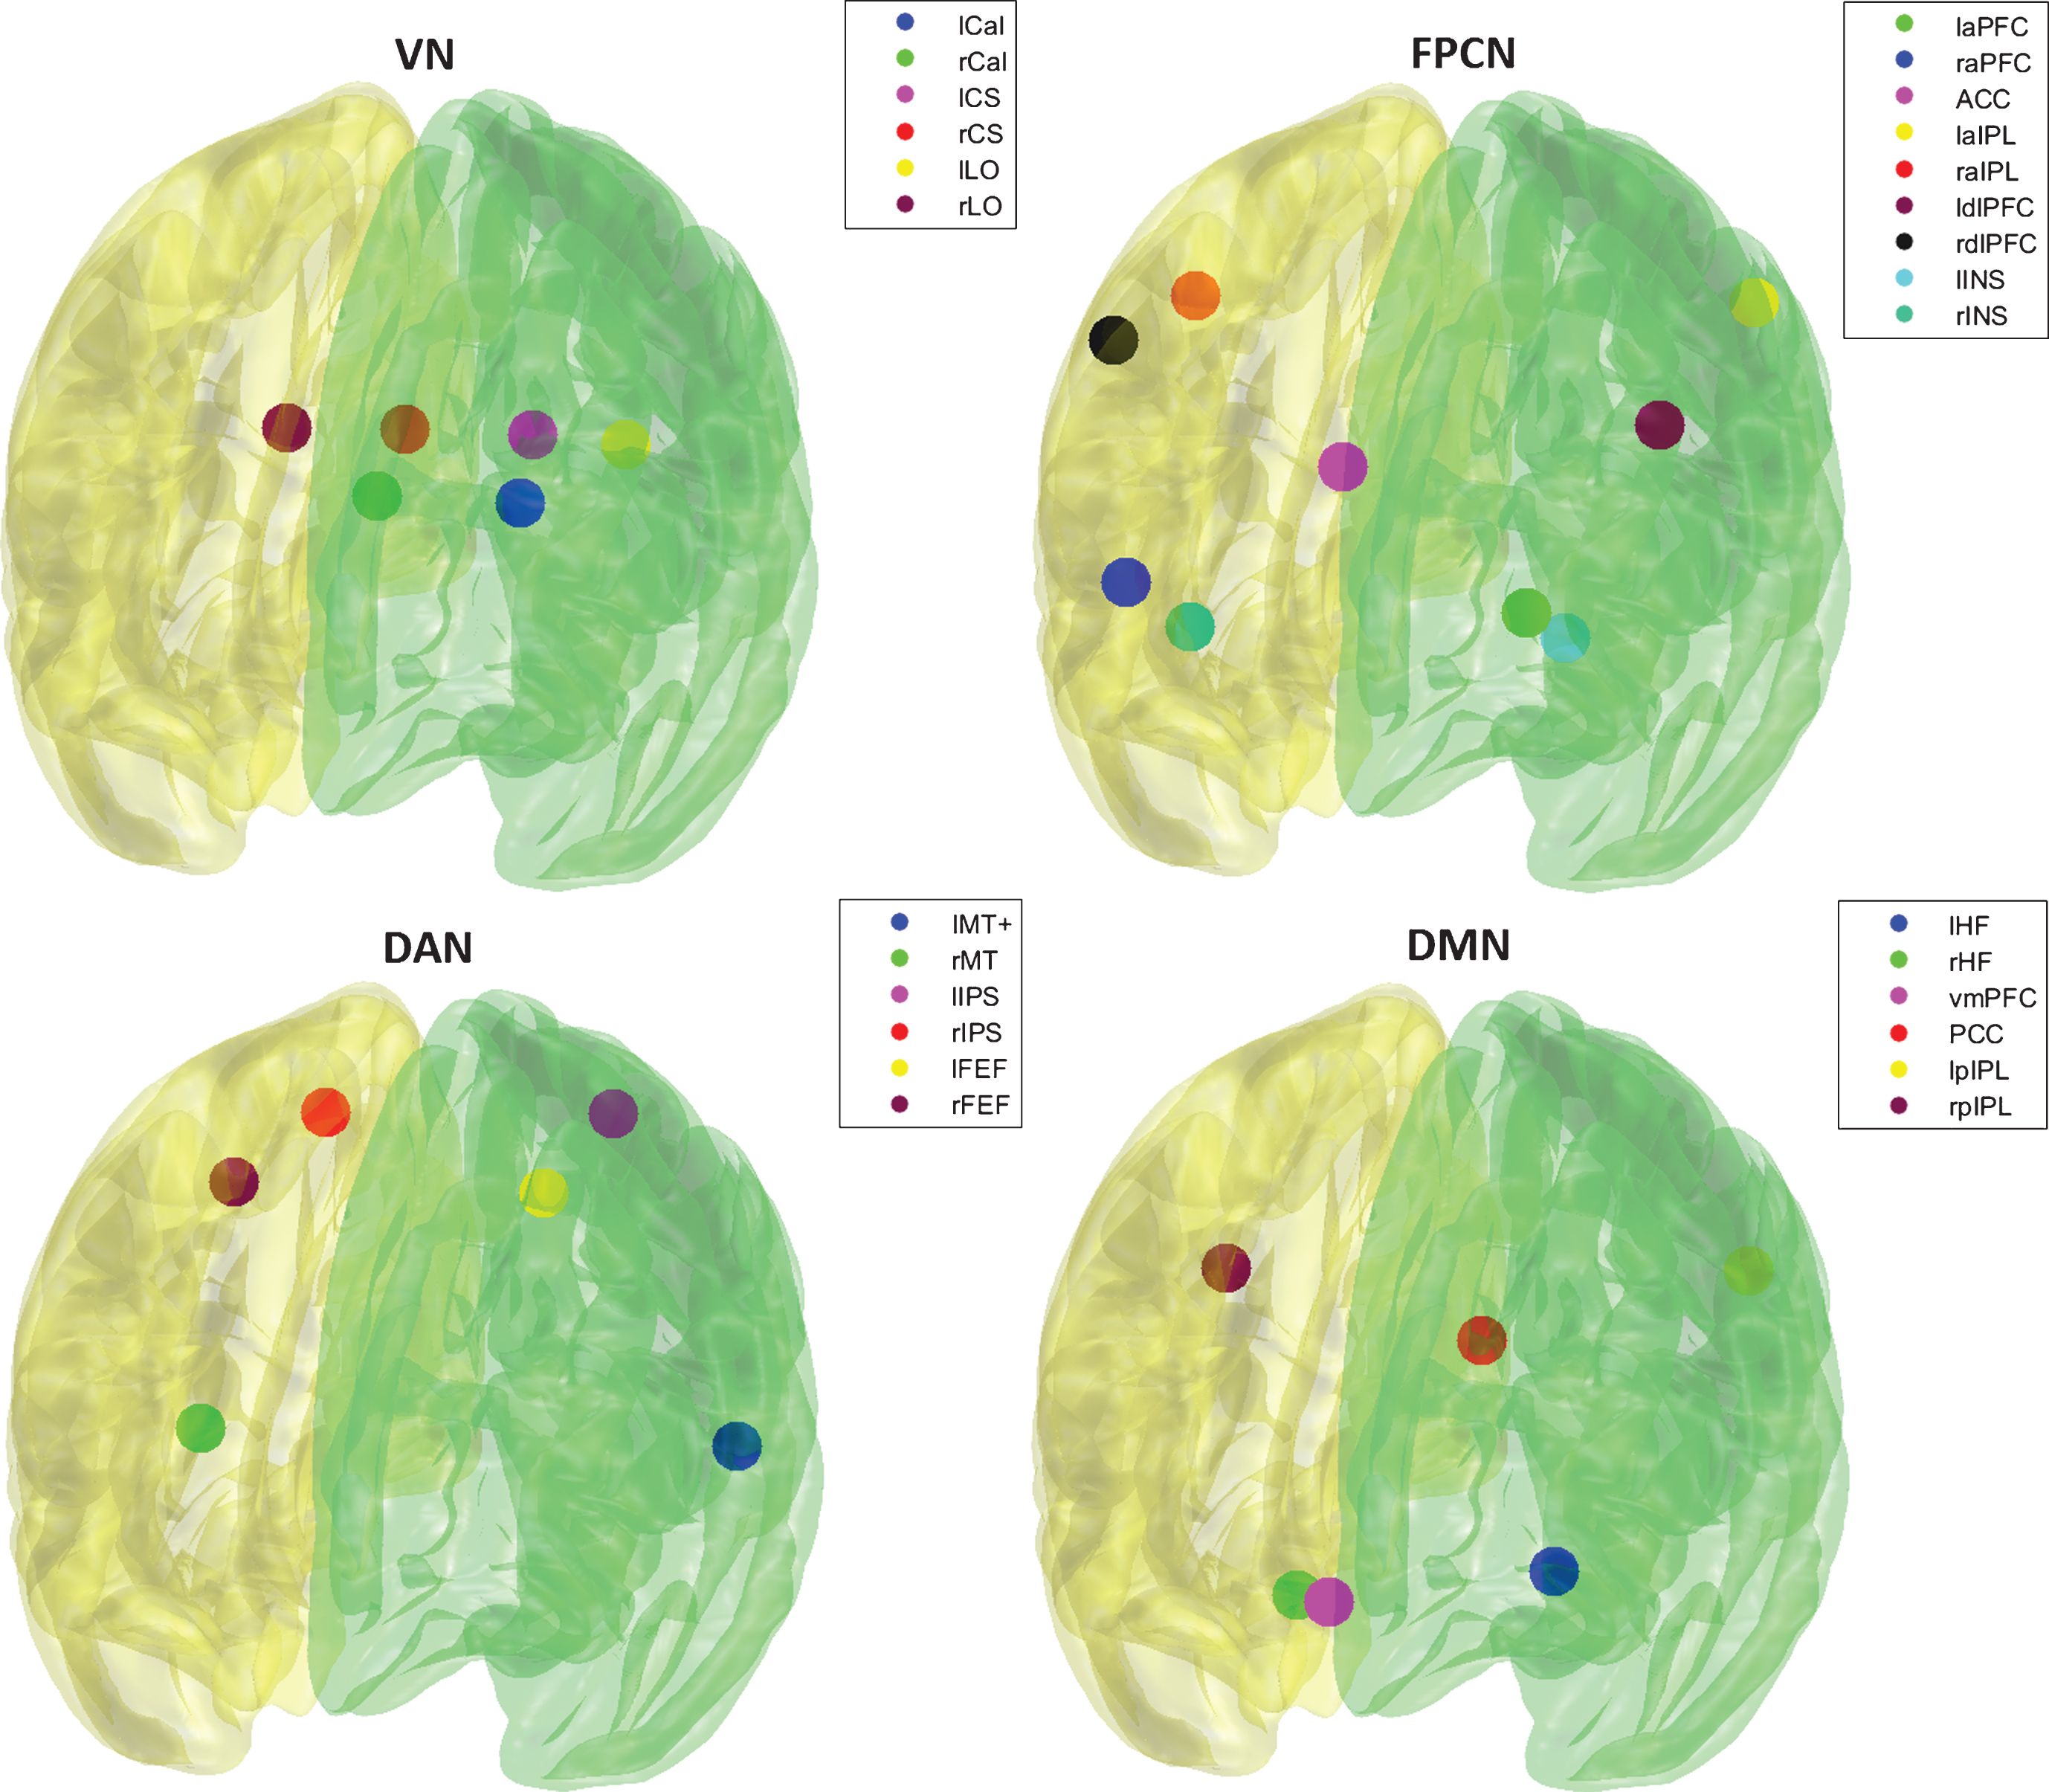
Characteristic seeds (spheres with 6 mm radius) for the FPCN, DMN, DAN, and VN were chosen based on the work of Gao and Lin [19]; see Supplementary Table 1 and Figure 1. The time-series of each seed of the studied networks was averaged and cross-correlated using Pearson’s correlation coefficient to form a correlation matrix for each subject. Pearson’s correlation coefficients were converted into z-values using Fisher’s r-to-z transformation. Representative BNC was calculated as mean of z-values belonging to each pair of networks. Differences in BNC among the HC group and PD subgroups were calculated for the baseline data (Kruskal-Wallis and post-hoc tests). Age, gender, education, and LED [48] were included as covariates of no interest. Covariates were regressed out using general linear model. Spearman’s partial correlations (after regressing out the effects of the covariates of no interest) with cognitive domain z-scores were calculated for each group separately using the baseline data as well as changes in values during the follow-up. The Wilcoxon signed-rank test was used to evaluate changes in cognitive performance and BNC after one year in the HC and PD groups, respectively. The alpha level for abovementioned statistical tests was set to p = 0.05. Effect size (
Fig.1
Visualization of seeds of respective networks.
Partial least squares (PLS) analysis
To assess inter-group differences in resting-state functional connectivity at the baseline between the selected networks, PLS analysis was used [50]. This method was applied to connectivity matrices (adjusted for the abovementioned covariates) based on the AAL atlas, which consisted of a limited number of ROIs that were assigned to our networks of interest; see Supplementary Table 2. Both positive and negative correlations entered the analysis. The correlation matrices were transformed to Z-values by Fisher Z-transform and stacked to form a single input matrix (subjects x edges). We employed the same methodology as described in our previous work [51]. Briefly, the PLS decomposed the input data into three latent variables (LVs), each described by three features: vector v showing group-related differences, singular value s indicating the amount of explained variability in the input matrix, and vector u (saliences), which demonstrates the weighted contributions of individual edges to the effect depicted by v. The significance of the LVs was evaluated using 5000 permutations of group membership and the reliability of saliences was determined by calculating the standard error using bootstrap sampling of group members (1000 iterations), with recalculating the PLS for each permutation and bootstrap. In the end, vector u was reshaped into the matrix resembling the original connectivity matrices, the significant edges (p < 0.05, values obtained using bootstrap steps) were visualized, and FDR correction with critical expected False Discovery Rate set to 0.05 was applied1 .
Graph theory (GT) measures analysis
The whole brain (except cerebellum) was parceled into 90 regions of interest (ROIs) according to the AAL atlas [52]. These ROIs were intersected with previously calculated masks [53] to ensure high signal quality in every subject. ROIs that contained more than 50% of signal dropouts in more than 10% of subjects were removed (12 in total). This threshold should ensure the high representativeness of the extracted time-series. If the same ROI is unaffected by dropouts, the median correlation r of the affected and unaffected ROI time-series should be higher than 0.91 [54]. The time-series of each ROI was averaged and cross-correlated using Pearson’s correlation coefficient to form a 78×78 correlation matrix for each subject. The functional connectivity was described on both global and regional levels. For further analyses, Fisher’s z-transformed Pearson’s correlation coefficients were used. Weighted networks were analyzed so that the useful information about strength of particular connections was preserved. Negative correlations were replaced with zeros2 . To describe the network structure at a global level, average clustering coefficient, characteristic path length, average node strength, global efficiency, and modularity were computed using the Brain Connectivity toolbox [55]. Normalized characteristic path lengthλ and normalized clustering coefficient γ were also calculated. Normalization was achieved by dividing the property value by the average property values of 100 random networks created with preserved weight, strength, and degree distributions.
To investigate the cognitive brain networks of interest, local clustering coefficient, nodal path length, node strength, eigenvector centrality, and betweenness centrality were computed for ROIs of the whole brain. Average value of each measure for four brain networks’ ROIs as depicted in Supplementary Table 2 was computed and used as a representative local measure for these networks. Differences among the HC group and PD subgroups in determined measures were then evaluated for the baseline data using Kruskal-Wallis and post-hoc tests after regressing out the effect of the abovementioned covariates. To assess the change in these measures after one year in the HC and PD groups, the Wilcoxon signed-rank test was used. In terms of multiple comparison correction, False Discovery Rate (FDR) correction with critical expected FDR set to 0.05 was applied. Effect size (
RESULTS
Baseline demographic and behavioral results
After discarding 9 subjects due to motion during scanning, the final cohort comprised 90 subjects (51 HC, 17 PD-NC, 22 PD-MCI). For the demographic, clinical, and cognitive results of the subgroups, see Table 1. None of patients was taking any psychoactive drugs. The PD subgroups differed only in total years of education (higher in PD-NC) and in attention, executive function, and memory domain z-scores (lower in PD-MCI), which therefore became our domains of interest. Both PD groups had a higher proportion of males than the HC group. The PD-NC subjects were younger than the HC subjects. The PD-MCI subjects had lower scores on almost all cognitive evaluations than the HC subjects.
Cognitive changes after one-year follow-up period
During the one-year follow-up period, the groups diminished to 37 HC, 13 PD-NC, and 10 PD-MCI due to loss to follow-up. The PD patients were merged into one group (PD-all, n = 23). Significant increases in memory z-scores were found in both the HC and PD-all groups (p = 0.001 and p = 0.0002, respectively). No cognitive deterioration in any cognitive domain was observed in either group.
fMRI results and associations with cognitive outcomes
Baseline functional connectivity in PD subgroups compared to HC
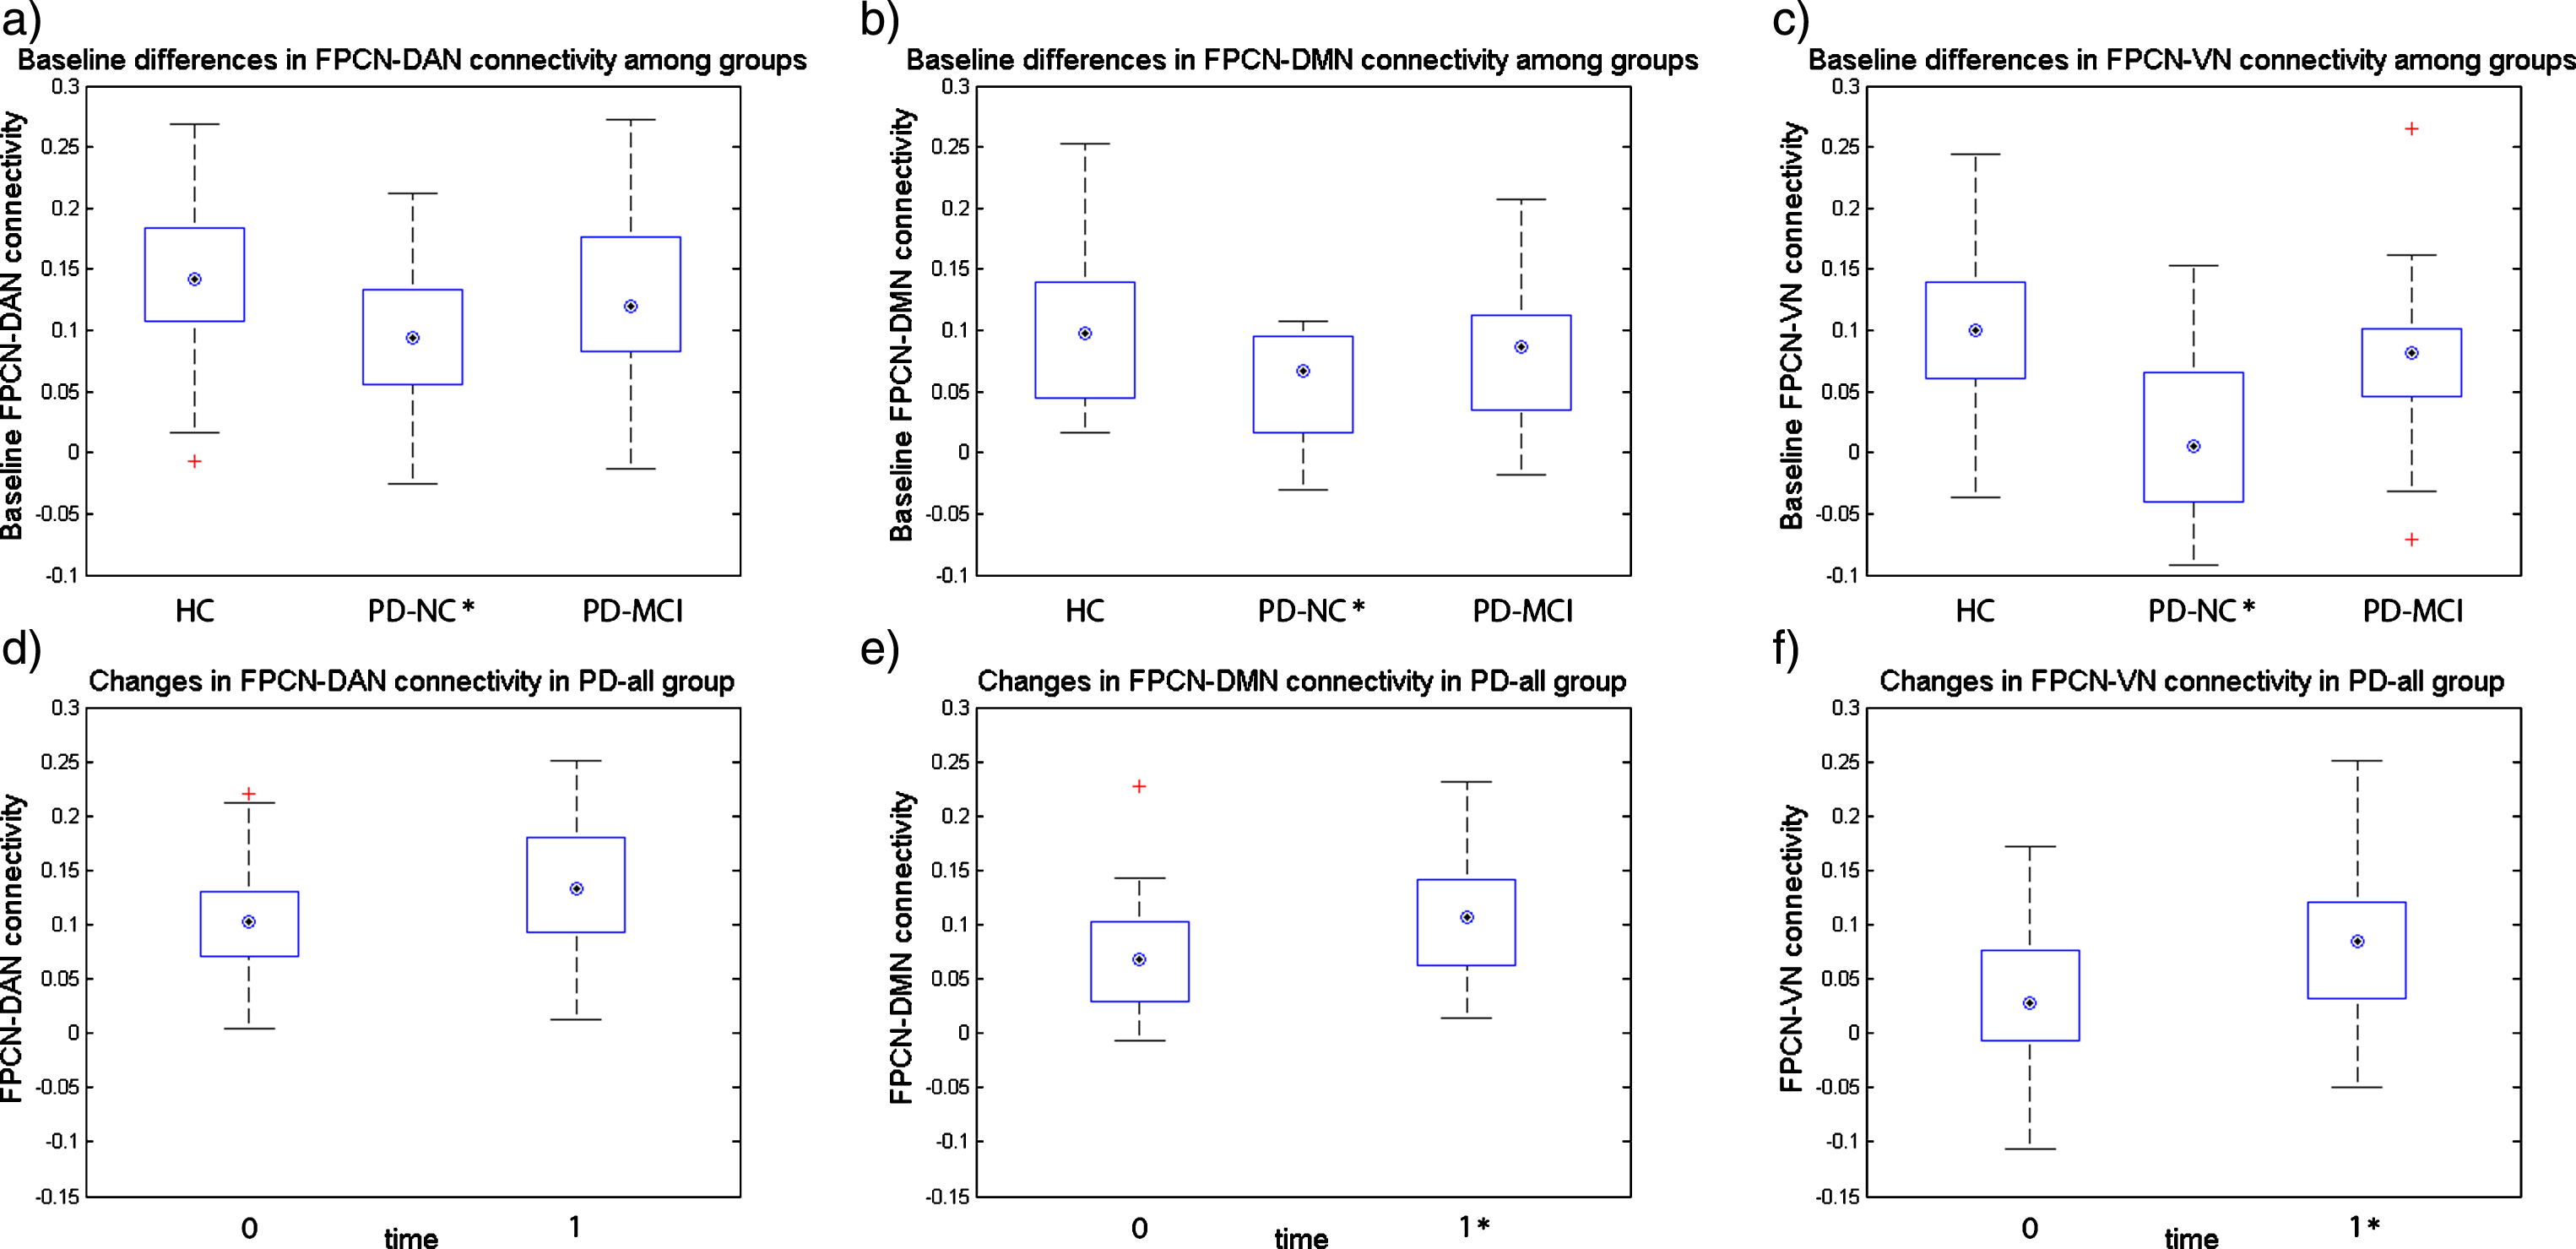
Between-network connectivity (BNC) analysis: The Kruskal-Wallis test revealed significant differences in all three BNC: FPCN-DAN (p = 0.014), FPCN-VN (p = 0.001), and FPCN-DMN (p = 0.033). The FPCN-DAN, FPCN-VN, and FPCN-DMN connectivities were significantly reduced in the PD-NC group as compared to the HC group (p = 0.010,
Fig.2
Baseline inter-network connectivity and longitudinal changes in HC and PD-all groups. Figure 2a-c shows the baseline differences in inter-network connectivity between groups, *marks the groups that significantly differ from the HC group in inter-network connectivity at p < 0.05; Figure 2d-f shows the changes in inter-network connectivity after one year in PD-all group (one-year follow-up visit – baseline visit), *marks the follow-up visit inter-network connectivity that significantly differs from the baseline visit at p < 0.05; on each box the central mark indicates the median, top and bottom box edges indicate the 25th and 75th percentiles, whiskers extend to the most extreme data points not considered outliers, and + marks outliers.
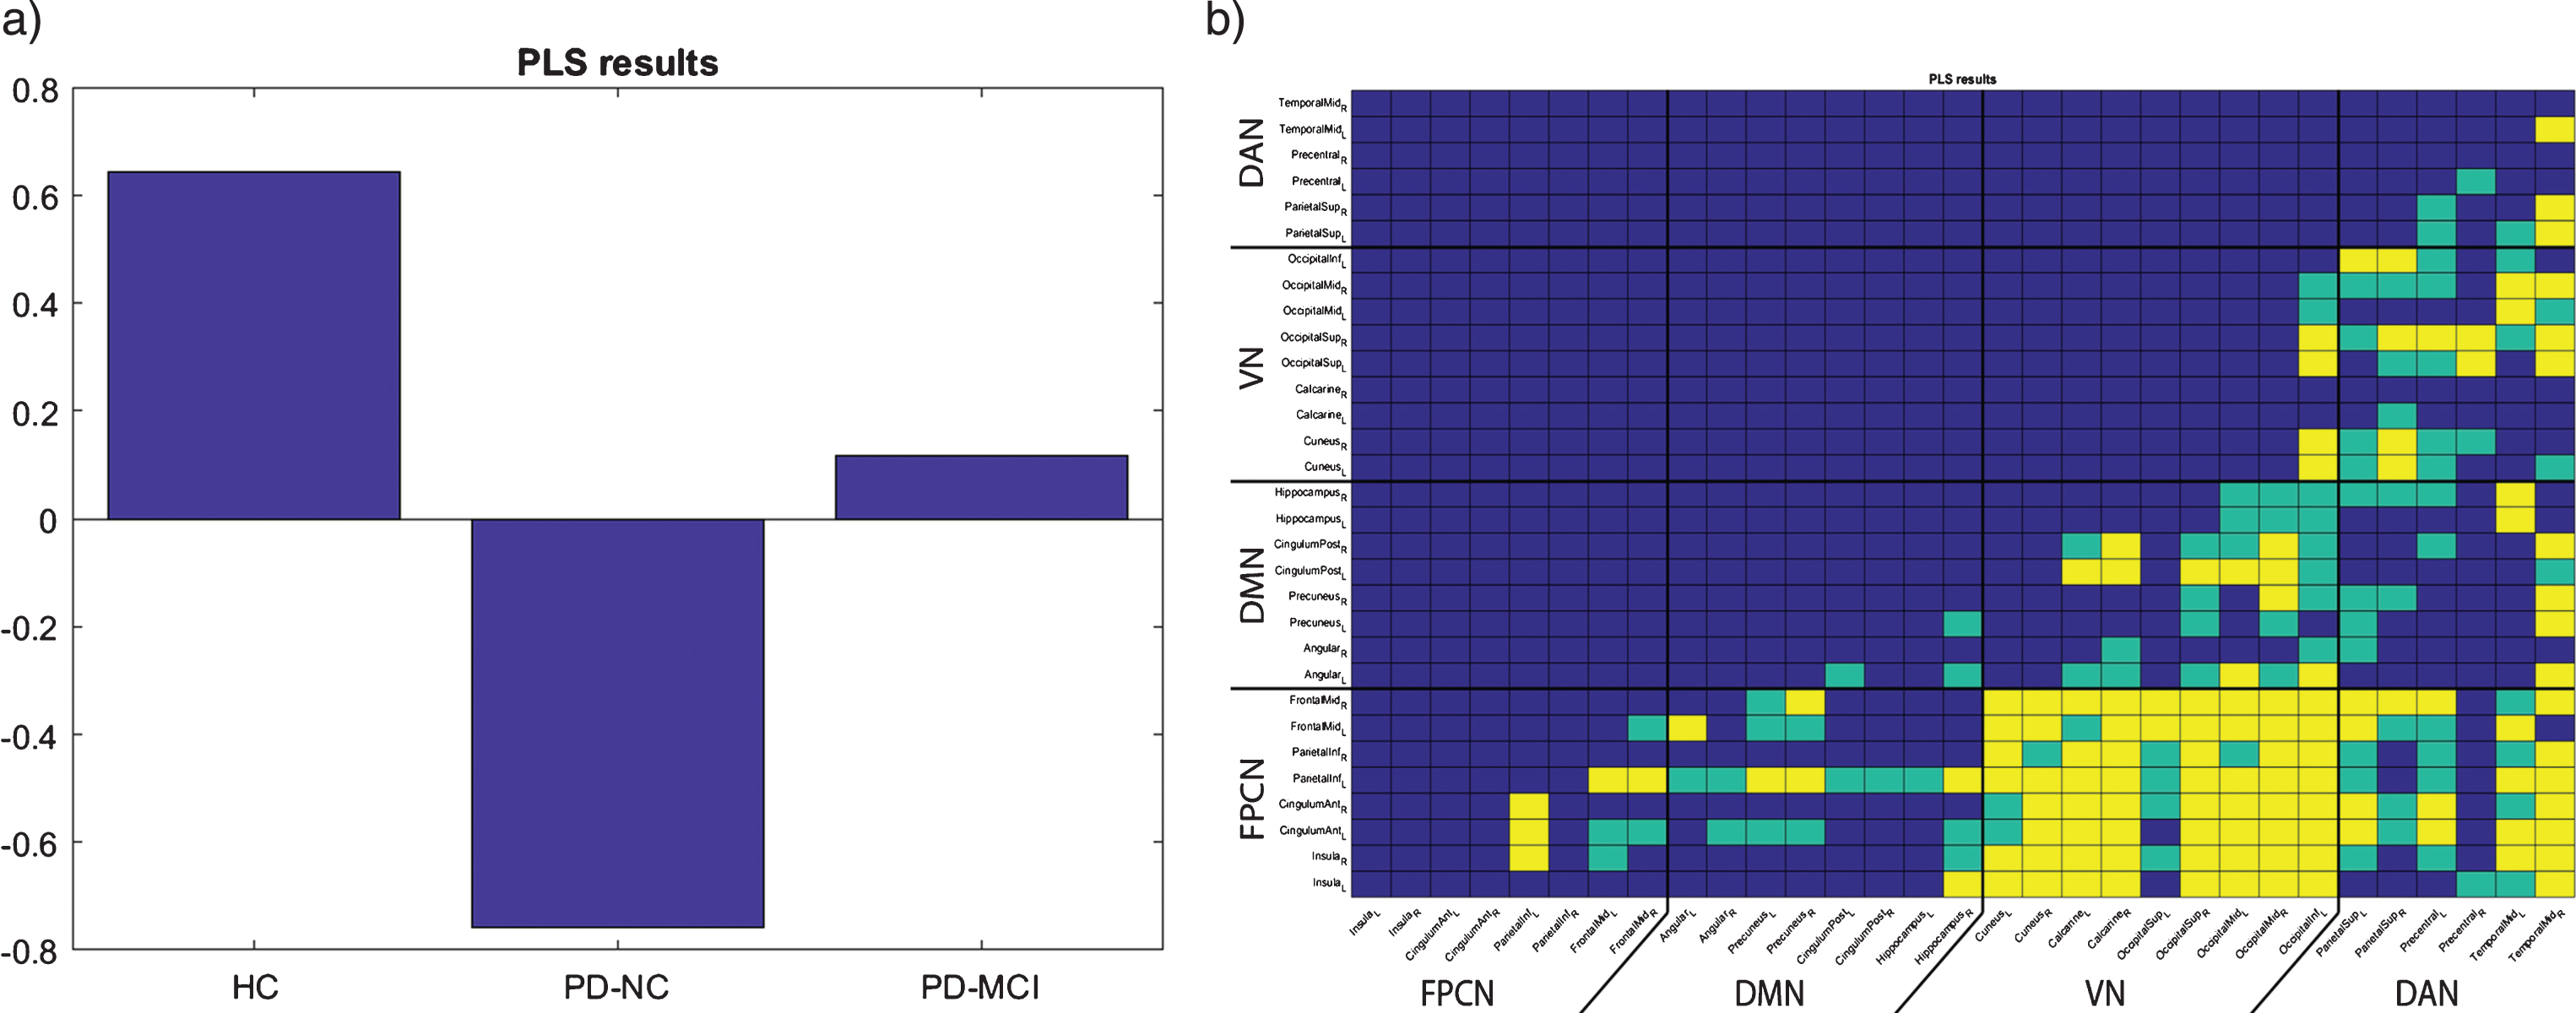
Partial least squares (PLS) analysis: Three latent variables (LV) were obtained. One LV, which explained 68.35% of variance, proved to be significant (p = 0.0038). This LV showed the effect depicted in Fig. 3a, demonstrating the strong difference between HC and PD-NC, with the PD-MCI group being between these two groups, i.e., the BNC and PLS analytical methods provided very similar results. The resulting matrix showing the most contributing edges is visualized in Fig. 3b. From this matrix, it can be concluded that all studied between-network connections contribute to the reported effect, with the FPCN-VN BNC being the most substantial. Of note, the observed effect was markedly depicted also in the DMN-VN and DAN-VN BNC; see Fig. 3b.
Fig.3
Baseline PLS results. a) group-related differences (indicated by vector v of significant LV); b) reshaped matrix of significant saliences contributing correspondingly to the effect depicted in a), green – p < 0.05 uncorrected, yellow – p < 0.05 FDR corrected.
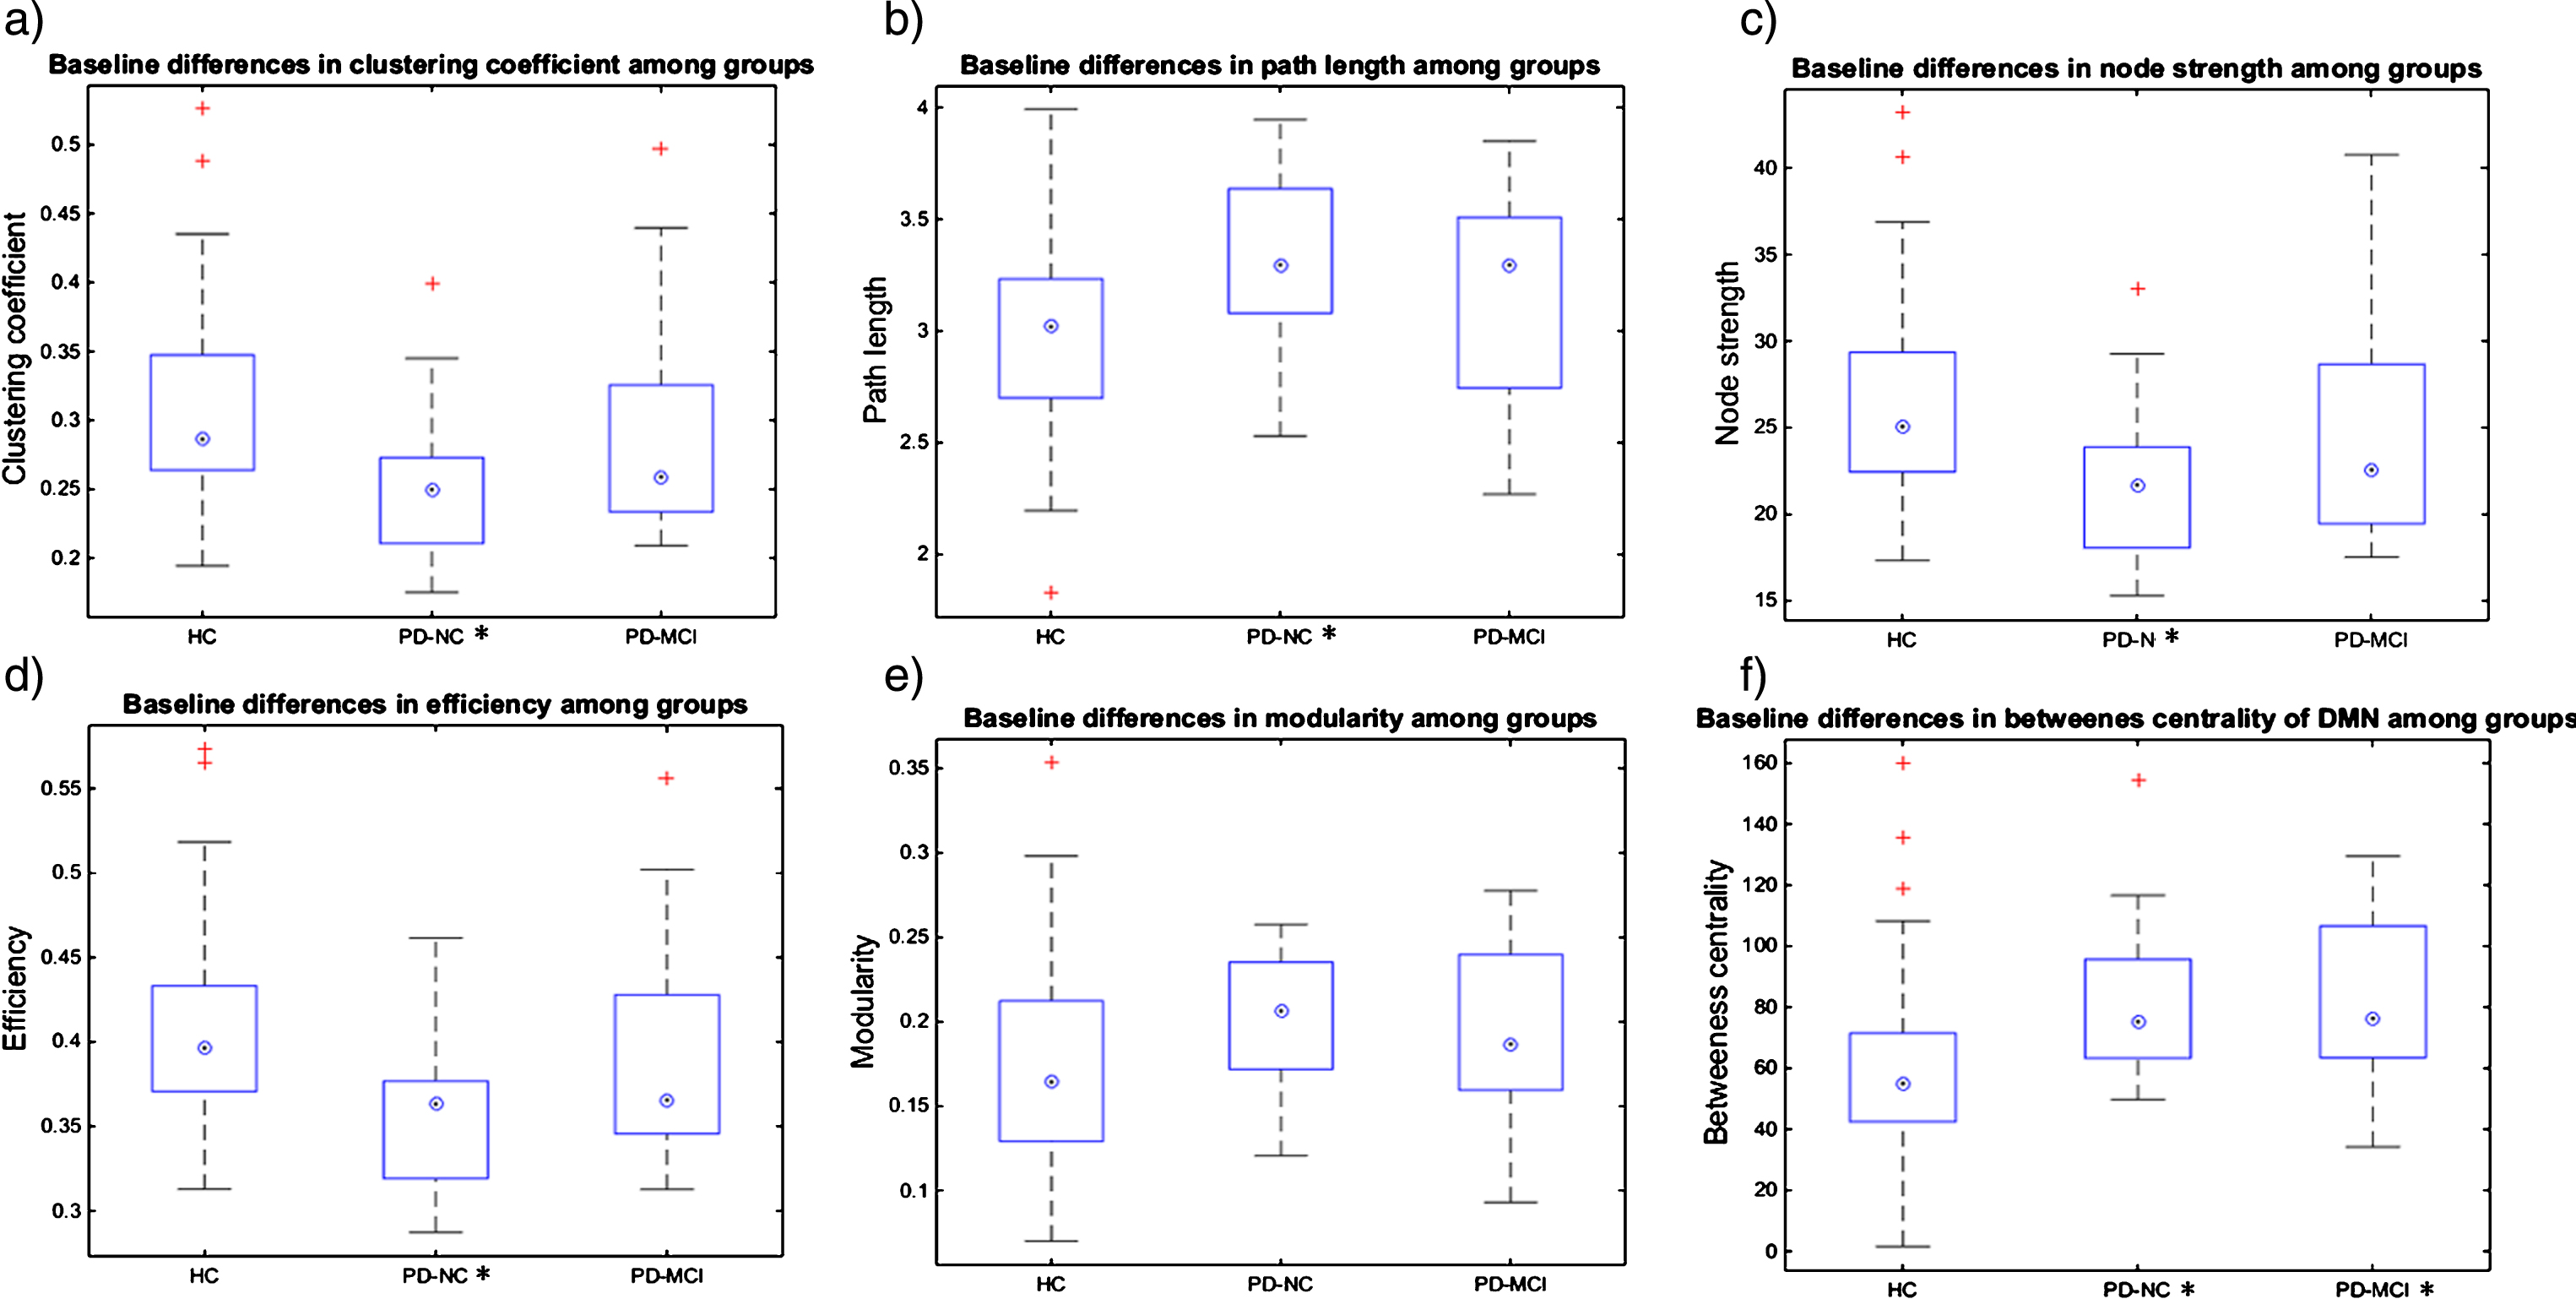
Graph theory (GT) measures analysis: At the global level, average clustering coefficient, average node strength, and global efficiency were significantly reduced in the PD-NC group as compared to HC, and decreases in the graph measures were present in the order: HC > PD-MCI > PD-NC; see Supplementary Table 3 and Figure 4. Characteristic path length was increased in PD-NC as compared to HC, and it increased in the order: HC <PD-MCI <PD-NC; see Supplementary Table 3 and Figure 4. At the local level, all studied cognitive brain networks showed a similar direction of changes across groups as the whole brain analysis for the average clustering coefficient and the average node strength; for details, see Supplementary Table 3. The differences in characteristic path length described at the global level were significant for the FPCN and VN networks, with DAN and DMN showing trends. In addition, for the DMN, increased betweenness centrality was observed in both the PD-NC and PD-MCI groups in comparison to HC. No significant correlations of global GT measures with cognitive domain z-scores were found in any of the groups after FDR correction.
Fig.4
Baseline GT measures and longitudinal changes in HC and PD-all groups. Figure 4a-e shows the baseline differences in global GT measures between groups, *marks the groups that significantly differ from the HC group in a particular GT measure at p < 0.05; Figure 4f shows the baseline differences in local GT measures between groups, *marks the groups that significantly differ from the HC group in a particular GT measure at p < 0.05; on each box the central mark indicates the median, top and bottom box edges indicate the 25th and 75th percentiles, whiskers extend to the most extreme data points not considered outliers and + marks outliers.
Changes in network connectivity in HC and PD-all groups after one-year follow-up period
Between-network connectivity (BNC) analysis
In the PD-all group, significant increases of the FPCN-DMN and FPCN-VN connectivity were observed, with similar trends in the FPCN-DAN connectivity at the one-year follow-up assessment as compared to the baseline assessment (p = 0.03,
Graph theory (GT) measures analysis
Although some trends were visible in the PD-all group, no significant differences were observed in either the PD-all or the HC groups.
DISCUSSION
The current work investigates the BNC of major large-scale brain networks related to cognitive deficits in well-characterized PD groups as compared to HC and its changes related to the short-term disease progression. We studied the BNC of the relevant cognitive task-positive and task-negative RSNs with the FPCN, which is hypothesized to play a central role in cognitive control by switching between them [19]. To enhance our understanding of these complex dynamic interactions related to PD cognitive status and disease progression, we employed three different methods—both hypothesis-driven and data-driven approaches, including the ROIs-based BNC, PLS, and whole-brain GT analyses.
First of all, we found decreased functional connection of the FPCN with all studied cognitive RSNs in PD-NC as compared to age-matched HC. The results of the seed-based BNC analysis were supported by the results of the ROI-based PLS analysis and by both regional and global network changes described by the GT measures. The most significant effect was present for the FPCN-VN connectivity. Of note, the PLS analysis additionally revealed VN-DAN and VN-DMN connectivity decreases, thus highlighting the importance of disrupted occipital node connections in cognitively unimpaired PD patients. Lastly, using the GT measures, both FPCN and VN networks displayed reduced node strength, clustering coefficient, network efficiency, and increased path length, suggesting network disconnection and disturbed inefficient transfer of information through these networks to other distant brain regions. The same pattern of the abovementioned GT measures changes was detected on the whole-brain global level. These findings conclusively show that the connection between FPCN and VN, and between each of them and other large-scale brain networks involved in cognition, are clearly functionally disrupted before any objective clinically relevant cognitive dysfunctions are present in PD.
It has been shown in the literature that abnormal engagement of the extrastriatal visual pathway nodes is characteristic of the early stages of PD [11], for disease progression [40], for PD-MCI [27], and for PD with early dementia [5] and dementia with Lewy bodies [56]. Using GT based approach, Hou et al. [57] described decreased nodal efficiency of the calcarine area; this decrease was positively correlated with visuospatial scores already in cognitively unimpaired drug-naïve PD patients. Decreased interaction of the visual nodes with other brain areas in PD without dementia was also described by Göttlich et al. [32] and Peraza et al. [42]. Baseline posterior-cortical cognitive deficits were shown to be predictive of faster cognitive decline and PD-related dementia [58], and cortical cholinergic deficit as a neurotransmitter marker of PD-dementia [59] was observed in the medial occipital cortex early in the course of PD, even before any cognitive decline was evident [60]. However, functional deficits of the associate occipital cortices resulting from striatal damage [36] may also play a role. In monkeys, experimental destruction of the posterior part of the putamen induced damage to the visual cortices and posterior parietal regions that was followed by a loss of visual attention in these animals [61]. Thus we may speculate that extrastriate visual nodes disconnection in PD-NC might underlie early dopaminergic and cholinergic cortical dysfunction and perhaps also other pathological changes including Lewy bodies and beta amyloid depositions [62, 63], and might predict dementia in PD [58, 59].
Regarding the FPCN-DAN connectivity, Baggio et al. [27] found a connectivity decrease between the DAN and insular areas that are engaged in the FPCN; however, this change was present only in cognitively impaired PD and not in PD-NC as compared to HC. On the other hand, decreased FPCN-DMN connectivity in the PD-NC group was in line with results of Boord et al. [64], who demonstrated that these changes might alter the way in which the executive response is processed in PD. Similar results were reported in other studies (e.g., [11, 27]). Overall, the FPCN-DMN decreases may underlie the typical early impairment of attentional mechanisms in PD.
As for the GT based analysis results, higher characteristic path length and lower global efficiency in PD without dementia compared to HC were also observed in other studies [7, 32, 65], and may refer to the defective global integration and efficiency of the network and to the ‘disconnection syndrome’ concept of PD. The clustering coefficient describes the local connectedness and functional segregation and specialization [66], which also seem to be affected in PD [7]. In contrast to other studies that examined PD patients without dementia, we differentiated between PD-NC and PD-MCI subjects based on a rigorous neuropsychological examination. We found significant differences between PD-NC and HC on both global (whole brain connectome) and local levels (evaluating the abovementioned measures for our networks of interest).
However, the crucial observation relates to the BNC in the PD-MCI group and to the disease progression in the cognitively mixed PD-all group after one-year of follow-up. The BNC strength of the FPCN with all other studied cognitive networks in the PD-MCI group was between that of PD-NC and HC. The most prominent differences between the PD groups based on their cognitive status were again observed in the FPCN-VN connectivity, where a near-significant difference (p = 0.05) was detected between the PD-NC and PD-MCI groups (with higher connectivity strength in the PD-MCI group which almost reached that of the HC group). Regarding the FPCN-DMN and the FPCN-DAN connections, the pattern was similar, i.e., the BNC at baseline examination did not significantly differ between PD-MCI and HC, while it was significantly decreased in PD-NC as compared to HC; see Fig. 2. Moreover, the same pattern was significant according to the PLS analysis, with a major contribution of the FPCN-VN connectivity; the results were further supported by the GT measures findings. This could mean that the PD-MCI status triggers the resting-state BNC upregulation in an attempt to increase the brain network efficiency and compensate for cognitive deficits and increasing amounts of underlying brain pathology.
The finding of the BNC increases in PD-MCI is not completely novel. Similar results of increases in functional connectivity between the insula and lateral occipital cortices in PD-MCI as compared to PD-NC were reported by Peraza et al. [42]. The authors speculated about a potential association of this finding with an increased risk of hallucinations in the PD-MCI cohort despite the fact that none of their subjects had a history of hallucinations. Studies of PD patients with hallucinations report decreased interaction of the VN with other brain modules [32] and decreased FPCN-DAN connectivity [67]. The issue of functional brain reorganization and the associated risk of hallucinations should be further examined in studies with a longer follow-up period. Nevertheless, none of our subjects experienced hallucinations or visual misperceptions at the time of examination and none of them had a history of hallucination or psychosis.
Of note, one work reported that increased BNC may even lead to malfunction [13]. In that study, the authors showed that the right insula was more highly correlated with both the frontoparietal and DMN networks in a mixed PD group (with and without cognitive impairment) than in HC and these changes were related to the amount of brain amyloid pathology as assessed by CSF (decreased levels of Aβ42) but also to lower attentional accuracy in the PD group. However, unlike Madhyastha et al. [13] we did not find higher FPCN-DMN/ FPCN-DAN connections in the PD-MCI group as compared to HC (note that the BNC strength in PD-MCI was between that of PD-NC and HC). In comparison to the abovementioned works, we had an advantage of at least short-term follow-up of the same subjects. We demonstrated for the first time that the BNC increases, particularly of the FPCN-VN and the FPCN-DMN connectivity, occurred after one year of follow-up in the mixed PD group with and without MCI; while no such changes were present in the HC group. Regarding cognitive outcomes, no deterioration occurred in any of the cognitive domain z-scores in the PD-all group or in the HC group over time; moreover, the significant increase of memory domain z-scores was present in both HC and PD-all groups, probably due to practice effects [68]. This result is in accord with the notion that increases in functional connectivity reveal efficient compensatory recruitment of cognitive resources to maintain task performance [32, 38].
Thus, based on our own results and the results of others, we suggest that in PD patients, the functional brain network reorganization dynamically reflects cognitive status and disease progression. There are evident early synaptic brain plasticity changes caused particularly by alpha-synuclein aggregates at the presynapses and by dopamine depletions [69–71] that occur within distinct cognitive brain networks in PD-NC and precede changes in the brain structure [7, 39] and function (in this case, cognitive impairment). These changes are reflected in BNC decreases within the major cognitive RSNs, occipital node disconnection, and decreased global efficiency and impaired information transfer and processing on both global and local levels. With time, the gradual accumulation of disease pathology and neurodegeneration [7, 39, 62, 63], and progressing cognitive decline drive the upregulation of resting-state BNC of cognitive RSNs and increase information processing throughout the whole-brain connectome in order to provide efficient (or at least partially efficient) compensation. Similar results (increases of connectivity in a network involving mainly the frontoparietal nodes) were observed by Serra et al. [72] in patients in the early phase of AD (amnestic MCI). The authors interpreted these specific changes as fitting with the existence of a ‘neural reserve’. At a certain point in time, the amount of brain pathology and degeneration leads to a brain reserve disruption that may vary in individual subjects [73–75] and to either more pronounced connectivity disruptions (e.g., [27, 37, 42]) or further BNC overshoots which may even add to cognitive malfunction [13]. The latter notion has to be explored by longitudinal studies with longer follow-up periods.
Another important finding relates to the result of increased betweenness centrality of the DMN nodes in both PD-NC and PD-MCI as compared to HC. Nodes with high betweenness centrality play a controlling role in the passage of information through the network [76], and may be perceived as network hubs [39]. Therefore, it can be hypothesized that in PD (both with and without MCI), the DMN still plays a central role in information flow control despite its altered intra-network and BNC [4, 6–8, 11, 34].
In conclusion, we found decreased BNC of major brain networks (and of the FPCN-VN connectivity in particular) related to cognition in the PD-NC subjects as compared to age-matched HC. With cognitive deterioration and time, the BNC of the FPCN increased, probably in an attempt to compensate [2, 13, 42, 77]. Of note, all the analytical methods employed produced a similar direction of changes across the studied groups and highlighted the importance of the FPCN-VN connectivity changes and of the connectivity of the FPCN and VN with other cognitive brain networks. Moreover, the GT results emphasized the importance of the DMN nodes to control the information flow in PD both with and without cognitive impairment. The one-year follow-up revealed that the distinct functional BNC upregulation in the cognitively mixed PD group was clinically efficient in terms of the short-term preservation of global cognitive performance and even of practice effects for memory tasks.
A limitation of the study was that 4 PD-NC and 12 PD-MCI subjects were lost to follow-up; the PD-NC and PD-MCI groups therefore had to be combined for further analyses. Our population was not screened with validated scales for anxiety or impulsive behaviors which might have had effect on the connectivity within and between cognitive networks. However, none of our subjects met criteria for any co-existing major psychiatric disorder (see exclusion criteria) and none of them took any psychoactive medication. We did not find significant correlations between our fMRI results and the numerous cognitive outcome measures in specific patient groups after correction for multiple testing. However, we were able to describe distinct underlying pathophysiological mechanisms occurring in cognitively well characterized PD subpopulations. Longitudinal studies with longer follow-up periods might show whether distinct inter-network connectivity patterns may predict dementia conversion in PD. Understanding the temporal dynamics of functional interplay between major cognitive brain networks may help monitor potential cognitive treatment effects including effects of invasive and non-invasive brain stimulation.
Notes
1 Only edges showing corresponding effect to Figure 3a are visualized and discussed; there were no significant edges showing the adverse effect.
2 We also calculated GT measures with absolute values of correlation coefficients; the results were essentially the same, and therefore we are reporting just the first variant.
ACKNOWLEDGMENTS
The study was supported by the EU Joint Programming initiative within Neurodegenerative Diseases, funded by the Norwegian Strategic Research Council (APGeM—Preclinical genotype-phenotype predictors of Alzheimer’s disease and other dementias, grant agreement number 3056-00001) and by the grant project of the Agency of Health Research AZV 15-33854A. The work was supported from European Regional Development Fund-Project “National infrastructure for biological and medical imaging” (No. CZ.02.1.01/0.0/0.0/16_013/0001775).
We acknowledge the core facility MAFIL of CEITEC supported by the MEYS CR (LM2015062 Czech-BioImaging). Thanks to Anne Johnson for English language editing.
Authors’ disclosures available online (https://www.j-alz.com/manuscript-disclosures/18-0834r1).
SUPPLEMENTARY MATERIAL
{ label (or @symbol) needed for fn } The supplementary material is available in the electronic version of this article: http://dx.doi.org/10.3233/JAD-180834.
REFERENCES
[1] | Lehericy S , Vaillancourt DE , Seppi K , Monchi O , Rektorova I , Antonini A , McKeown MJ , Masellis M , Berg D , Rowe JB , Lewis SJG , Williams-Gray CH , Tessitore A , Siebner HR ((2017) ) The role of high-field magnetic resonance imaging in parkinsonian disorders: Pushing the boundaries forward. Mov Disord 32: , 510–252. |
[2] | Anderkova L , Barton M , Rektorova I ((2017) ) Striato-cortical connections in Parkinson’s and Alzheimer’s diseases: Relation to cognition. Mov Disord 32: , 917–922. |
[3] | Amboni M , Tessitore A , Esposito F , Santangelo G , Picillo M , Vitale C , Giordano A , Erro R , de Micco R , Corbo D , Tedeschi G , Barone P ((2014) ) Resting-state functional connectivity associated with mild cognitive impairment in Parkinson’s disease. J Neurol 262: , 425–434. |
[4] | Tessitore A , Esposito F , Vitale C , Santangelo G , Amboni M , Russo A , Corbo D , Cirillo G , Barone P , Tedeschi G ((2012) ) Default-mode network connectivity in cognitively unimpaired patients with Parkinson disease. Neurology 79: , 2226–2232. |
[5] | Rektorova I , Krajcovicova L , Marecek R , Mikl M ((2012) ) Default mode network and extrastriate visual resting state network in patients with Parkinson’s disease dementia. Neurodegener Dis 10: , 232–237. |
[6] | Yao N , Shek-Kwan Chang R , Cheung C , Pang S , Lau KK , Suckling J , Rowe JB , Yu K , Ka-Fung Mak H , Chua SE , Ho SL , Mcalonan GM ((2014) ) The default mode network is disrupted in parkinson’s disease with visual hallucinations. Hum Brain Mapp 35: , 5658–5666. |
[7] | Tinaz S , Lauro PM , Ghosh P , Lungu C , Horovitz SG ((2017) ) Changes in functional organization and white matter integrity in the connectome in Parkinson’s disease. Neuroimage Clin 13: , 395–404. |
[8] | Mak E , Su L , Williams GB , O’Brien JT ((2015) ) Neuroimaging correlates of cognitive impairment and dementia in Parkinson’s disease. Parkinsonism Relat Disord 21: , 862–870. |
[9] | Van Eimeren T , Monchi O , Ballanger B , Strafella AP ((2009) ) Dysfunction of the default mode network in Parkinson disease: A functional magnetic resonance imaging study. Arch Neurol 66: , 877–883. |
[10] | Kelly AMC , Di Martino A , Uddin LQ , Shehzad Z , Gee DG , Reiss PT , Margulies DS , Castellanos FX , Milham MP ((2009) ) Development of anterior cingulate functional connectivity from late childhood to early adulthood. Cereb Cortex 19: , 640–657. |
[11] | Rektorova I , Krajcovicova L , Marecek R , Novakova M , Mikl M ((2014) ) Default mode network connectivity patterns associated with visual processing at different stages of Parkinson’s disease. J Alzheimers Dis 42: , S217–S228. |
[12] | Gorges M , Müller HP , Lulé D , Pinkhardt EH , Ludolph AC , Kassubek J ((2015) ) To rise and to fall: Functional connectivity in cognitively normal and cognitively impaired patients with Parkinson’s disease. Neurobiol Aging 36: , 1727–1735. |
[13] | Madhyastha TM , Askren MK , Zhang J , Leverenz JB , Montine TJ , Grabowski TJ ((2015) ) Group comparison of spatiotemporal dynamics of intrinsic networks in Parkinson’s disease. Brain 138: , 2672–2686. |
[14] | Palmqvist S , Schöll M , Strandberg O , Mattsson N , Stomrud E , Zetterberg H , Blennow K , Landau S , Jagust W , Hansson O ((2017) ) Earliest accumulation of β-amyloid occurs within the default-mode network and concurrently affects brain connectivity. Nat Commun 8: , 1214. |
[15] | Litvan I , Goldman JG , Tröster AI , Schmand BA , Weintraub D , Petersen RC , Mollenhauer B , Adler CH , Marder K , Williams-Gray CH , Aarsland D , Kulisevsky J , Rodriguez-Oroz MC , Burn DJ , Barker RA , Emre M ((2012) ) Diagnostic criteria for mild cognitive impairment in Parkinson’s disease: Movement Disorder Society Task Force guidelines. Mov Disord 27: , 349–356. |
[16] | Lebedev AV , Westman E , Simmons A , Lebedeva A , Siepel FJ , Pereira JB , Aarsland D ((2014) ) Large-scale resting state network correlates of cognitive impairment in Parkinson’s disease and related dopaminergic deficits. Front Syst Neurosci 8: , 45. |
[17] | Helmich RC , Derikx LC , Bakker M , Scheeringa R , Bloem BR , Toni I ((2010) ) Spatial remapping of cortico-striatal connectivity in parkinson’s disease. Cereb Cortex 20: , 1175–1186. |
[18] | Christopher L , Marras C , Duff-Canning S , Koshimori Y , Chen R , Boileau I , Segura B , Monchi O , Lang AE , Rusjan P , Houle S , Strafella AP ((2014) ) Combined insular and striatal dopamine dysfunction are associated with executive deficits in Parkinson’s disease with mild cognitive impairment. Brain 137: , 565–575. |
[19] | Gao W , Lin W ((2012) ) Frontal parietal control nework regulates the anti-correlated default and dorsal attention networks. Hum Brain Mapp 33: , 192–202. |
[20] | Vincent JL , Kahn I , Snyder AZ , Raichle ME , Buckner RL ((2008) ) Evidence for a frontoparietal control system revealed by intrinsic functional connectivity. J Neurophysiol 100: , 3328–3342. |
[21] | Sridharan D , Levitin DJ , Menon V ((2008) ) A critical role for the right fronto-insular cortex in switching between central-executive and default-mode networks. Proc Natl Acad Sci U S A 105: , 12569–12574. |
[22] | Spreng RN , Stevens WD , Chamberlain JP , Gilmore AW , Schacter DL ((2010) ) Default network activity, coupled with the frontoparietal control network, supports goal-directed cognition. Neuroimage 53: , 303–317. |
[23] | Shulman GL , Fiez JA , Corbetta M , Buckner RL , Miezin FM , Raichle ME , Petersen SE ((1997) ) Common blood flow changes across visual tasks: II. Decreases in cerebral cortex. J Cogn Neurosci 9: , 648–663. |
[24] | Raichle ME ((2015) ) The brain’s default mode network. Annu Rev Neurosci 38: , 433–447. |
[25] | Fox MD , Snyder AZ , Vincent JL , Corbetta M , Van Essen DC , Raichle ME ((2005) ) From The Cover: The human brain is intrinsically organized into dynamic, anticorrelated functional networks. Proc Natl Acad Sci U S A 102: , 9673–9678. |
[26] | Lewis SJG , Dove A , Robbins TW , Barker RA , Owen AM ((2003) ) Cognitive impairments in early Parkinson’s disease are accompanied by reductions in activity in frontostriatal neural circuitry. J Neurosci 23: , 6351–6356. |
[27] | Baggio HC , Segura B , Sala-Llonch R , Marti MJ , Valldeoriola F , Compta Y , Tolosa E , Junqué C ((2015) ) Cognitive impairment and resting-state network connectivity in Parkinson’s disease. Hum Brain Mapp 36: , 199–212. |
[28] | Nemcova Elfmarkova N , Gajdos M , Rektorova I , Marecek R , Rapcsak S ((2017) ) Neural evidence for defective top-down control of visual processing in Parkinson’s and Alzheimer’s disease. Neuropsychologia 106: , 236–244. |
[29] | Bezdicek O , Ballarini T , Růžička F , Roth J , Mueller K , Jech R , Schroeter ML ((2018) ) Mild cognitive impairment disrupts attention network connectivity in Parkinson’s disease: A combined multimodal MRI and meta-analytical study. Neuropsychologia 112: , 105–115. |
[30] | Lowe MJ , Mock BJ , Sorenson JA ((1998) ) Functional connectivity in single and multislice echoplanar imaging using resting-state fluctuations. Neuroimage 7: , 119–132. |
[31] | Seibert TM , Murphy EA , Kaestner EJ , Brewer JB ((2012) ) Interregional correlations in Parkinson disease and Parkinson-related dementia with resting functional MR imaging. Radiology 263: , 226–234. |
[32] | Göttlich M , Münte TF , Heldmann M , Kasten M , Hagenah J , Krämer UM ((2013) ) Altered resting state brain networks in Parkinson’s disease. PLoS One 8: , e77336. |
[33] | Archibald NK , Clarke MP , Mosimann UP , Burn DJ ((2011) ) Visual symptoms in Parkinson’s disease and Parkinson’s disease dementia. Mov Disord 26: , 2387–2395. |
[34] | Krajcovicova L , Mikl M , Marecek R , Rektorova I ((2012) ) The default mode network integrity in patients with Parkinson’s disease is levodopa equivalent dose-dependent. J Neural Transm 119: , 443–454. |
[35] | Cools R ((2001) ) Mechanisms of cognitive set flexibility in Parkinson’s disease. Brain 124: , 2503–2512. |
[36] | Archibald NK , Hutton SB , Clarke MP , Mosimann UP , Burn DJ ((2013) ) Visual exploration in Parkinson’s disease and Parkinson’s disease dementia. Brain 136: , 739–750. |
[37] | Lopes R , Delmaire C , Defebvre L , Moonen AJ , Duits AA , Hofman P , Leentjens AFG , Dujardin K ((2017) ) Cognitive phenotypes in parkinson’s disease differ in terms of brain-network organization and connectivity. Hum Brain Mapp 38: , 1604–1621. |
[38] | Lou Y , Huang P , Li D , Cen Z , Wang B , Gao J , Xuan M , Yu H , Zhang M , Luo W ((2015) ) Altered brain network centrality in depressed Parkinson’s disease patients. Mov Disord 30: , 1777–1784. |
[39] | Pereira JB , Aarsland D , Ginestet CE , Lebedev AV , Wahlund LO , Simmons A , Volpe G , Westman E ((2015) ) Aberrant cerebral network topology and mild cognitive impairment in early Parkinson’s disease. Hum Brain Mapp 36: , 2980–2995. |
[40] | Dubbelink KTEO , Hillebrand A , Twisk JWR , Deijen JB , Stoffers D , Schmand BA , Stam CJ , Berendse HW ((2014) ) Predicting dementia in Parkinson disease by combining neurophysiologic and cognitive markers. Neurology 82: , 263–270. |
[41] | Manza P , Zhang S , Li CSR , Leung HC ((2016) ) Resting-state functional connectivity of the striatum in early-stage Parkinson’s disease: Cognitive decline and motor symptomatology. Hum Brain Mapp 37: , 648–662. |
[42] | Peraza LR , Nesbitt D , Lawson RA , Duncan GW , Yarnall AJ , Khoo TK , Kaiser M , Firbank MJ , O’Brien JT , Barker RA , Brooks DJ , Burn DJ , Taylor JP ((2017) ) Intra- and inter-network functional alterations in Parkinson’s disease with mild cognitive impairment. Hum Brain Mapp 38: , 1702–1715. |
[43] | de Schipper LJ , Hafkemeijer A , van der Grond J , Marinus J , Henselmans JML , van Hilten JJ ((2018) ) Altered whole-brain and network-based functional connectivity in Parkinson’s disease. Front Neurol 9: , 419. |
[44] | Bassett DS , Sporns O ((2017) ) Network neuroscience. Nat Neurosci 20: , 353–364. |
[45] | Baggio HC , Sala-Llonch R , Segura B , Marti MJ , Valldeoriola F , Compta Y , Tolosa E , Junqué C ((2014) ) Functional brain networks and cognitive deficits in Parkinson’s disease. Hum Brain Mapp 35: , 4620–4634. |
[46] | Power JD , Barnes KA , Snyder AZ , Schlaggar BL , Petersen SE ((2012) ) Spurious but systematic correlations in functional connectivity MRI networks arise from subject motion. Neuroimage 59: , 2142–2154. |
[47] | Siegel JS , Power JD , Dubis JW , Vogel AC , Church JA , Schlaggar BL , Petersen SE ((2014) ) Statistical improvements in functional magnetic resonance imaging analyses produced by censoring high-motion data points. Hum Brain Mapp 35: , 1981–1996. |
[48] | Tomlinson CL , Stowe R , Patel S , Rick C , Gray R , Clarke CE ((2010) ) Systematic review of levodopa dose equivalency reporting in Parkinson’s disease. Mov Disord 25: , 2649–2653. |
[49] | Grissom RJ , Kim JJ ((2012) ), Effect sizes for research: Univariate and multivariate applications, second edition. |
[50] | McIntosh AR , Lobaugh NJ ((2004) ) Partial least squares analysis of neuroimaging data: Applications and advances. Neuroimage 23: , S250–S263. |
[51] | Výtvarová E , Mareček R , Fousek J , Strýček O , Rektor I ((2017) ) Large-scale cortico-subcortical functional networks in focal epilepsies: The role of the basal ganglia. Neuroimage Clin 14: , 28–36. |
[52] | Tzourio-Mazoyer N , Landeau B , Papathanassiou D , Crivello F , Etard O , Delcroix N , Mazoyer B , Joliot M ((2002) ) Automated anatomical labeling of activations in SPM using a macroscopic anatomical parcellation of the MNI MRI single-subject brain. Neuroimage 15: , 273–289. |
[53] | Gajdoč M , Mikl M , Mareček R ((2016) ) Mask_explorer: A tool for exploring brain masks in fMRI group analysis. Comput Methods Programs Biomed 134: , 155–163. |
[54] | Gajdoš M , Výtvarová E , Fousek J , Lamoš M , Mikl M ((2018) ) Robustness of representative signals relative to data loss using atlas-based parcellations. Brain Topogr 31: , 767–779. |
[55] | Rubinov M , Sporns O ((2010) ) Complex network measures of brain connectivity: Uses and interpretations. Neuroimage 52: , 1059–1069. |
[56] | Mosimann UP , Mather G , Wesnes KA , O’Brien JT , Burn DJ , McKeith IG ((2004) ) Visual perception in Parkinson disease dementia and dementia with Lewy bodies. Neurology 63: , 2091–2096. |
[57] | Hou Y , Wei Q , Ou R , Yang J , Song W , Gong Q , Shang H ((2018) ) Impaired topographic organization in cognitively unimpaired drug-naïve patients with rigidity-dominant Parkinson’s disease. Parkinsonism Relat Disord 56: , 52–57. |
[58] | Williams-Gray CH , Mason SL , Evans JR , Foltynie T , Brayne C , Robbins TW , Barker RA ((2013) ) The CamPaIGN study of Parkinson’s disease: 10-year outlook in an incident population-based cohort. J Neurol Neurosurg Psychiatry 84: , 1258–1264. |
[59] | Hilker R , Thomas AV , Klein JC , Weisenbach S , Kalbe E , Burghaus L , Jacobs AH , Herholz K , Heiss WD ((2005) ) Dementia in Parkinson disease: Functional imaging of cholinergic and dopaminergic pathways. Neurology 65: , 1716–1722. |
[60] | Shimada H , Hirano S , Shinotoh H , Aotsuka A , Sato K , Tanaka N , Ota T , Asahina M , Fukushi K , Kuwabara S , Hattori T , Suhara T , Irie T ((2009) ) Mapping of brain acetylcholinesterase alterations in Lewy body disease by PET. Neurology 73: , 273–278. |
[61] | Denny-Brown D , Yanagisawa N , Kirk EJ ((1975) ) The localization of hemispheric mechanisms of visually directed reaching and grasping. In Cerebral Localization. An Ottfried Foerster Symposium. Springer, Berlin, Heidelberg, pp. 62–75. |
[62] | Irwin DJ , White MT , Toledo JB , Xie SX , Robinson JL , Van Deerlin V , Lee VMY , Leverenz JB , Montine TJ , Duda JE , Hurtig HI , Trojanowski JQ ((2012) ) Neuropathologic substrates of Parkinson disease dementia. Ann Neurol 72: , 587–598. |
[63] | Halliday GM , McCann H ((2010) ) The progression of pathology in Parkinson’s disease. Ann N Y Acad Sci 1184: , 188–195. |
[64] | Boord P , Madhyastha TM , Askren MK , Grabowski TJ ((2017) ) Executive attention networks show altered relationship with default mode network in PD. Neuroimage Clin 13: , 1–8. |
[65] | Skidmore F , Korenkevych D , Liu Y , He G , Bullmore E , Pardalos PM ((2011) ) Connectivity brain networks based on wavelet correlation analysis in Parkinson fMRI data. Neurosci Lett 499: , 47–51. |
[66] | Fornito A , Zalesky A , Bullmore ET ((2016) ), Fundamentals of brain network analysis. Academic Press. |
[67] | Shine JM , Halliday GM , Gilat M , Matar E , Bolitho SJ , Carlos M , Naismith SL , Lewis SJG ((2014) ) The role of dysfunctional attentional control networks in visual misperceptions in Parkinson’s disease. Hum Brain Mapp 35: , 2206–2219. |
[68] | Gavett BE , Gurnani AS , Saurman JL , Chapman KR , Steinberg EG , Martin B , Chaisson CE , Mez J , Tripodis Y , Stern RA ((2016) ) Practice effects on story memory and list learning tests in the neuropsychological assessment of older adults. PLoS One 11: , e0164492. |
[69] | Bellucci A , Mercuri NB , Venneri A , Faustini G , Longhena F , Pizzi M , Missale C , Spano P ((2016) ) Parkinson’s disease: From synaptic loss to connectome dysfunction. Neuropathol Appl Neurobiol 42: , 77–94. |
[70] | Picconi B , Piccoli G , Calabresi P ((2012) ) Synaptic dysfunction in Parkinson’s disease. Adv Exp Med Biol 970: , 553–572. |
[71] | Schulz-Schaeffer WJ ((2010) ) The synaptic pathology of α-synuclein aggregation in dementia with Lewy bodies, Parkinson’s disease and Parkinson’s disease dementia. Acta Neuropathol 120: , 131–143. |
[72] | Serra L , Mancini M , Cercignani M , Di Domenico C , Spanò B , Giulietti G , Koch G , Marra C , Bozzali M ((2016) ) Network-based substrate of cognitive reserve in Alzheimer’s disease. J Alzheimers Dis 55: , 421–430. |
[73] | Biundo R , Calabrese M , Weis L , Facchini S , Ricchieri G , Gallo P , Antonini A ((2013) ) Anatomical correlates of cognitive functions in early Parkinson’s disease patients. PLoS One 8: , e64222. |
[74] | Hindle JV , Martyr A , Clare L ((2014) ) Cognitive reserve in Parkinson’s disease: A systematic review and meta-analysis. Parkinsonism Relat Disord 20: , 1–7. |
[75] | Martínez JH , López ME , Ariza P , Chavez M , Pineda-Pardo JA , López-Sanz D , Gil P , Maestú F , Buldú JM ((2018) ) Functional brain networks reveal the existence of cognitive reserve and the interplay between network topology and dynamics. Sci Rep 8: , 10525. |
[76] | Freeman LC ((1978) ) Centrality in social networks conceptual clarification. Soc Networks 1: , 215–239. |
[77] | Tahmasian M , Eickhoff SB , Giehl K , Schwartz F , Herz DM , Drzezga A , van Eimeren T , Laird AR , Fox PT , Khazaie H , Zarei M , Eggers C , Eickhoff CR ((2017) ) Resting-state functional reorganization in Parkinson’s disease: An activation likelihood estimation meta-analysis. Cortex 92: , 119–138. |


