
Default Mode Network Lateralization and Memory in Healthy Aging and Alzheimer’s Disease
Abstract
Lateralization of default mode network (DMN) functioning has been shown to change with age. Similarly, lateralization of frontal lobe function has been shown to decline in age. The impact of amyloid pathology and the progression of Alzheimer’s disease (AD) on resting state lateralization has not been investigated. Due to the preferential involvement of the left hemisphere in verbal tasks, there may be a benefit to higher levels of left-lateralization in the performance of verbal memory tasks. Here we compared functional lateralization of the anterior and posterior DMN between four groups of participants: amyloid negative (Aβ-) and amyloid positive (Aβ+) groups with normal cognition (NC), and Aβ+ groups with mild cognitive impairment (Aβ+MCI) or dementia (Aβ+AD). Differences were evident between groups in posterior DMN; the Aβ-NC group was more left-lateralized than both cognitively impaired Aβ+ groups. There was no difference in anterior DMN. No differences in overall network connectivity between groups were observed, suggesting that the functional lateralization finding is not secondary to general changes in connectivity. Left-lateralization of both networks was associated with better verbal recall performance. Older subjects, overall, had less left functional lateralization of the anterior DMN.
INTRODUCTION
Sixteen years ago resting state functional magnetic resonance imaging (rsfMRI) was found to demonstrate the existence of functional networks in the brain, including the default mode network (DMN) which has since been found to be particularly vulnerable to processes such as aging and Alzheimer’s disease (AD) [1]. rsfMRI refers to the study of blood oxygenation level dependent (BOLD) patterns in the brain at rest. Assessing brain function in this way is especially advantageous as there is no dependence on tasks, which would tax the cognitive ability of this group who are defined by memory loss; many patients would not be able to complete memory tasks in the scanner. While rsfMRI offers an easier way to collect functional imaging data from this population, the relationship between resting state networks and disease severity is not fully elucidated, and further understanding of how rsfMRI networks change depending on disease status is warranted if they are to be useful in studying AD. Further, since function is affected earlier in the disease process than the manifestation of episodic memory impairment [2], rsfMRI holds promise as a biomarker of preclinical changes in AD, when intervention might have the best chance of impacting disease course.
The putative importance of rsfMRI was brought to light in the early 2000 s when Greicius and colleagues analyzed the coherence of the DMN, a group of regions that were less active during attention demanding tasks in positron emission tomography (PET) and fMRI studies [3]. Fractionations within the DMN have also been identified, most commonly the anterior and posterior DMNs [4]. The pDMN consists of posterior cingulate cortex, posterior inferior parietal lobule, angular, hippocampal and temporal lobe, whereas the aDMN contains the medial prefrontal cortex, dorsomedial prefrontal cortex, anterior and posterior cingulate cortex, anterior temporal lobe, inferior frontal gyrus, and lateral parietal cortex [4–6]. Compared with healthy individuals, patients with AD have been shown to have enhanced connectivity of the aDMN and reduced connectivity of the pDMN, with eventual disintegration of connectivity throughout the network [7]. In addition, recent work has demonstrated a shift in functional lateralization of several components of the DMN with age [8].
Brain lateralization has been studied in aging, with the hemispheric asymmetry reduction in older adults (HAROLD) model positing a reduction in asymmetric activation in response to specific tasks in older individuals compared with younger individuals. This has been studied more extensively using non-MRI techniques. For example, a fludeoxyglucose (FDG) PET study analyzing responses of older adults compared with younger adults during verbal and spatial memory tasks demonstrated bilateral prefrontal involvement during both tasks in older participants, whereas younger participants demonstrated unilateral involvement, suggesting a loss of anterior lateralization with age [9]. Some argue that this is due to compensation [10], whereas others argue that it is due to dedifferentiation [11, 12].
Amyloid imaging was not yet available when models such as HAROLD were developed, and thus we do not know what percentage of the older participants may have had incipient AD changes in their brains. Therefore, it is unknown if the early disease process itself could have had a role in reduction in functional lateralization. This is important since even before clinical symptoms are apparent for amyloid-β positive (Aβ+) individuals, they may show subtle cognitive changes (e.g., [13]), and changes in connectivity seem to precede better understood biomarkers, such as atrophy [14]. Furthermore, the early spread of amyloid in the brain follows the same regions which are involved in the DMN [15], thus early amyloid deposition may differentially effect this network [16]. Understanding how functional lateralization at rest differs between cognitively normal aging with and without amyloid, and how that differs from early AD (Aβ+ mild cognitive impairment (MCI)) will help in elucidating the impact of aging on both normal and pathological brain functions.
Lateralization is particularly important for cognitive functions as shown by different hemispheric dominance in different cognitive domains. Most people have language dominance in their left hemisphere, which extends to dominance for verbal memory [17]. Other forms of memory, such as that for spatial memory, are often considered to be more right hemisphere dominant [17]. Identifying and tracking memory change is important in both diagnosis and monitoring disease progression and in assessing the efficacy of medication in clinical trial. In trials and research studies, the modality of memory testing tends to be verbal, thus it might be expected that the tests are more sensitive to reduction in function in the left hemisphere.
At the same time that our understanding of resting state networks has evolved, new radioligands for PET have been developed, which identify Aβ deposition in the brain in vivo. This has allowed for a paradigm shift in research on AD, since this disorder is diagnosed clinically with low accuracy, especially in the very early stages. Use of amyloid-tagging radioligands has allowed for the use of PET imaging to confidently identify preclinical and very early stages of AD [18]. This amyloid PET technology allows us to differentiate healthy brain aging (amyloid negative normal controls Aβ-NC), those with no cognitive symptoms but elevated brain amyloid (Aβ+NC), and those with clinical symptoms due to AD with (Aβ+AD) or without impairment in their day-to-day lives (mild cognitive impairment due to Alzheimer’s disease; Aβ+MCI).
Using the Alzheimer’s Disease Neuroimaging Initiative (ADNI) dataset, we aimed to test the hypothesis that amyloid burden in aging would impact connectivity within the DMN. Using amyloid PET, specifically the radioligand florbetapir, we differentiated individuals with and without levels of florbetapir uptake suggestive of underlying AD [19] and of later cognitive decline [20]. To compare against prior work and to understand the distinction between functional lateralization and overall connectivity we felt it important to replicate the DMN connectivity analyses of Damoiseaux and colleagues [7] in order to assess for group differences in the overall connectivity within each network. We also aimed to investigate how the functional lateralization shift in DMN with age relates more specifically to amyloid as a biomarker for AD. We then assessed the differences between these groups in lateralization of rsfMRI and the relevance of the findings to cognition hypothesizing that lateralized connectivity favoring the left hemisphere would be advantageous, when considering a verbal memory measure. Although lateralization has been widely studied, functional connectivity lateralization in specific brain networks during resting state has yet to be extensively investigated. Given the changes in DMN connectivity in aging, we aimed to investigate whether lateralization changes also occur in aging and amyloid deposition.
MATERIALS AND METHODS
Participants
Data used in the preparation of this article were obtained from the Alzheimer’s Disease Neuroimaging Initiative (ADNI) database (http://adni.loni.usc.edu). The ADNI was launched in 2003 as a public-private partnership, led by Principal Investigator Michael W. Weiner, MD. The primary goal of ADNI has been to test whether serial MRI, PET, other biological markers, and clinical and neuropsychological assessment can be combined to measure the progression of MCI and early AD. For up-to-date information, see http://www.adni-info.org.
Participants were defined clinically by ADNI. Normal controls (NC) showed no signs of depression, MCI or dementia. MCI participants reported subjective memory concern either by themselves or via an informant or clinician in addition to memory loss as determined by Wechsler Memory Scale Logical Memory II test. There were no significant impairment in other cognitive domains, and activities of daily living were preserved. AD participants met the NINCDS/ADRDA criteria for possible AD. For more details on the specifics of diagnostics used in ADNI, please see http://adni.loni.usc.edu/study-design/background-rationale/.
Inclusion criteria were availability of a florbetapir (AV45) PET scan, rsfMRI, cognitive assessment, and right handedness. Only amyloid positive MCI and AD patients were included as determined by increased AV-45 PET binding using the cerebellar reference region (standard uptake value ratio (SUVR)>1.1) [21]. Four participant groups were formed based on amyloid positivity and clinical diagnosis; NC with and without positive amyloid scan (i.e., Aβ-NC, Aβ+NC), Aβ+MCI, and Aβ+AD. Based on these criteria we included 123 individuals in total; 32 Aβ-NC, 20 Aβ+NC, 44 Aβ+MCI, and 27 Aβ+AD. All participants had provided informed consents at the participating sites, consistent with that site’s institutional review board (IRB) approval procedures.
Verbal learning and memory
Total learning over five trials and the delayed recall measure from the Rey Auditory Verbal Learning Test (RAVLT) [22] was assessed for verbal learning and memory. RAVLT was completed no more than 6 months before or after the MRI visit. The mean interval between visits was 61 days, with a standard deviation of 24 days. The mean interval between RAVLT and PET visit was 52 days, with a standard deviation of 97 days.
Imaging data acquisition
AV45 PET acquisition details, along with all the MRI parameters, are listed on the ADNI website (http://www.adni.loni.usc.edu). Structural MRI data, obtained from 3T MPRAGE scans, were acquired as part of ADNI 2 or ADNI Grand Opportunity. The best available scan for each subject was selected based on the Mayo Quality Control Ratings. fMRI scans were acquired on Phillips Medical Systems 3T scanners using the protocol specifically from ADNI 2, and restricted to “Resting State Eyes Open”. For fMRI we used gradiant-echo, T2 weighted echoplanar imaging (EPI) with the following parameters; TR/TE = 3000/30 ms; flip angle = 80° slice thickness 3.313, in–plane resolution/voxel size = 3.313mm3. A total of 140 volumes were acquired.
Imaging data processing
AV45 PET data processing
We used the UC Berkeley AV45 dataset which provides a processed set of AV45 PET data for a subset of ADNI participants, with SUVR calculations completed by the Jagust Lab at University of California, Berkeley (https://adni.bitbucket.io/reference/docs/UCBERKELEYAV45/ADNI_AV45_Methods_JagustLab_06.25.15.pdf). The florberatapir scans were divided into five reference regions (frontal, anterior/posterior cingulate, lateral parietal, lateral temporal, cerebellum) as defined by Freesurfer parcellations of native-space MRI to which the PET scans was coregistered. The mean florbetapir uptake was then calculated for each cortical (frontal, anterior/posterior cingulate, lateral parietal, lateral temporal) and reference region (cerebellum). Standard SUVR cutoff of 1.1 with cerebellar reference region was used to denote amyloid positivity [19]. SUVR value was also used as a continuous variable to denote overall amyloid load.
fMRI data processing
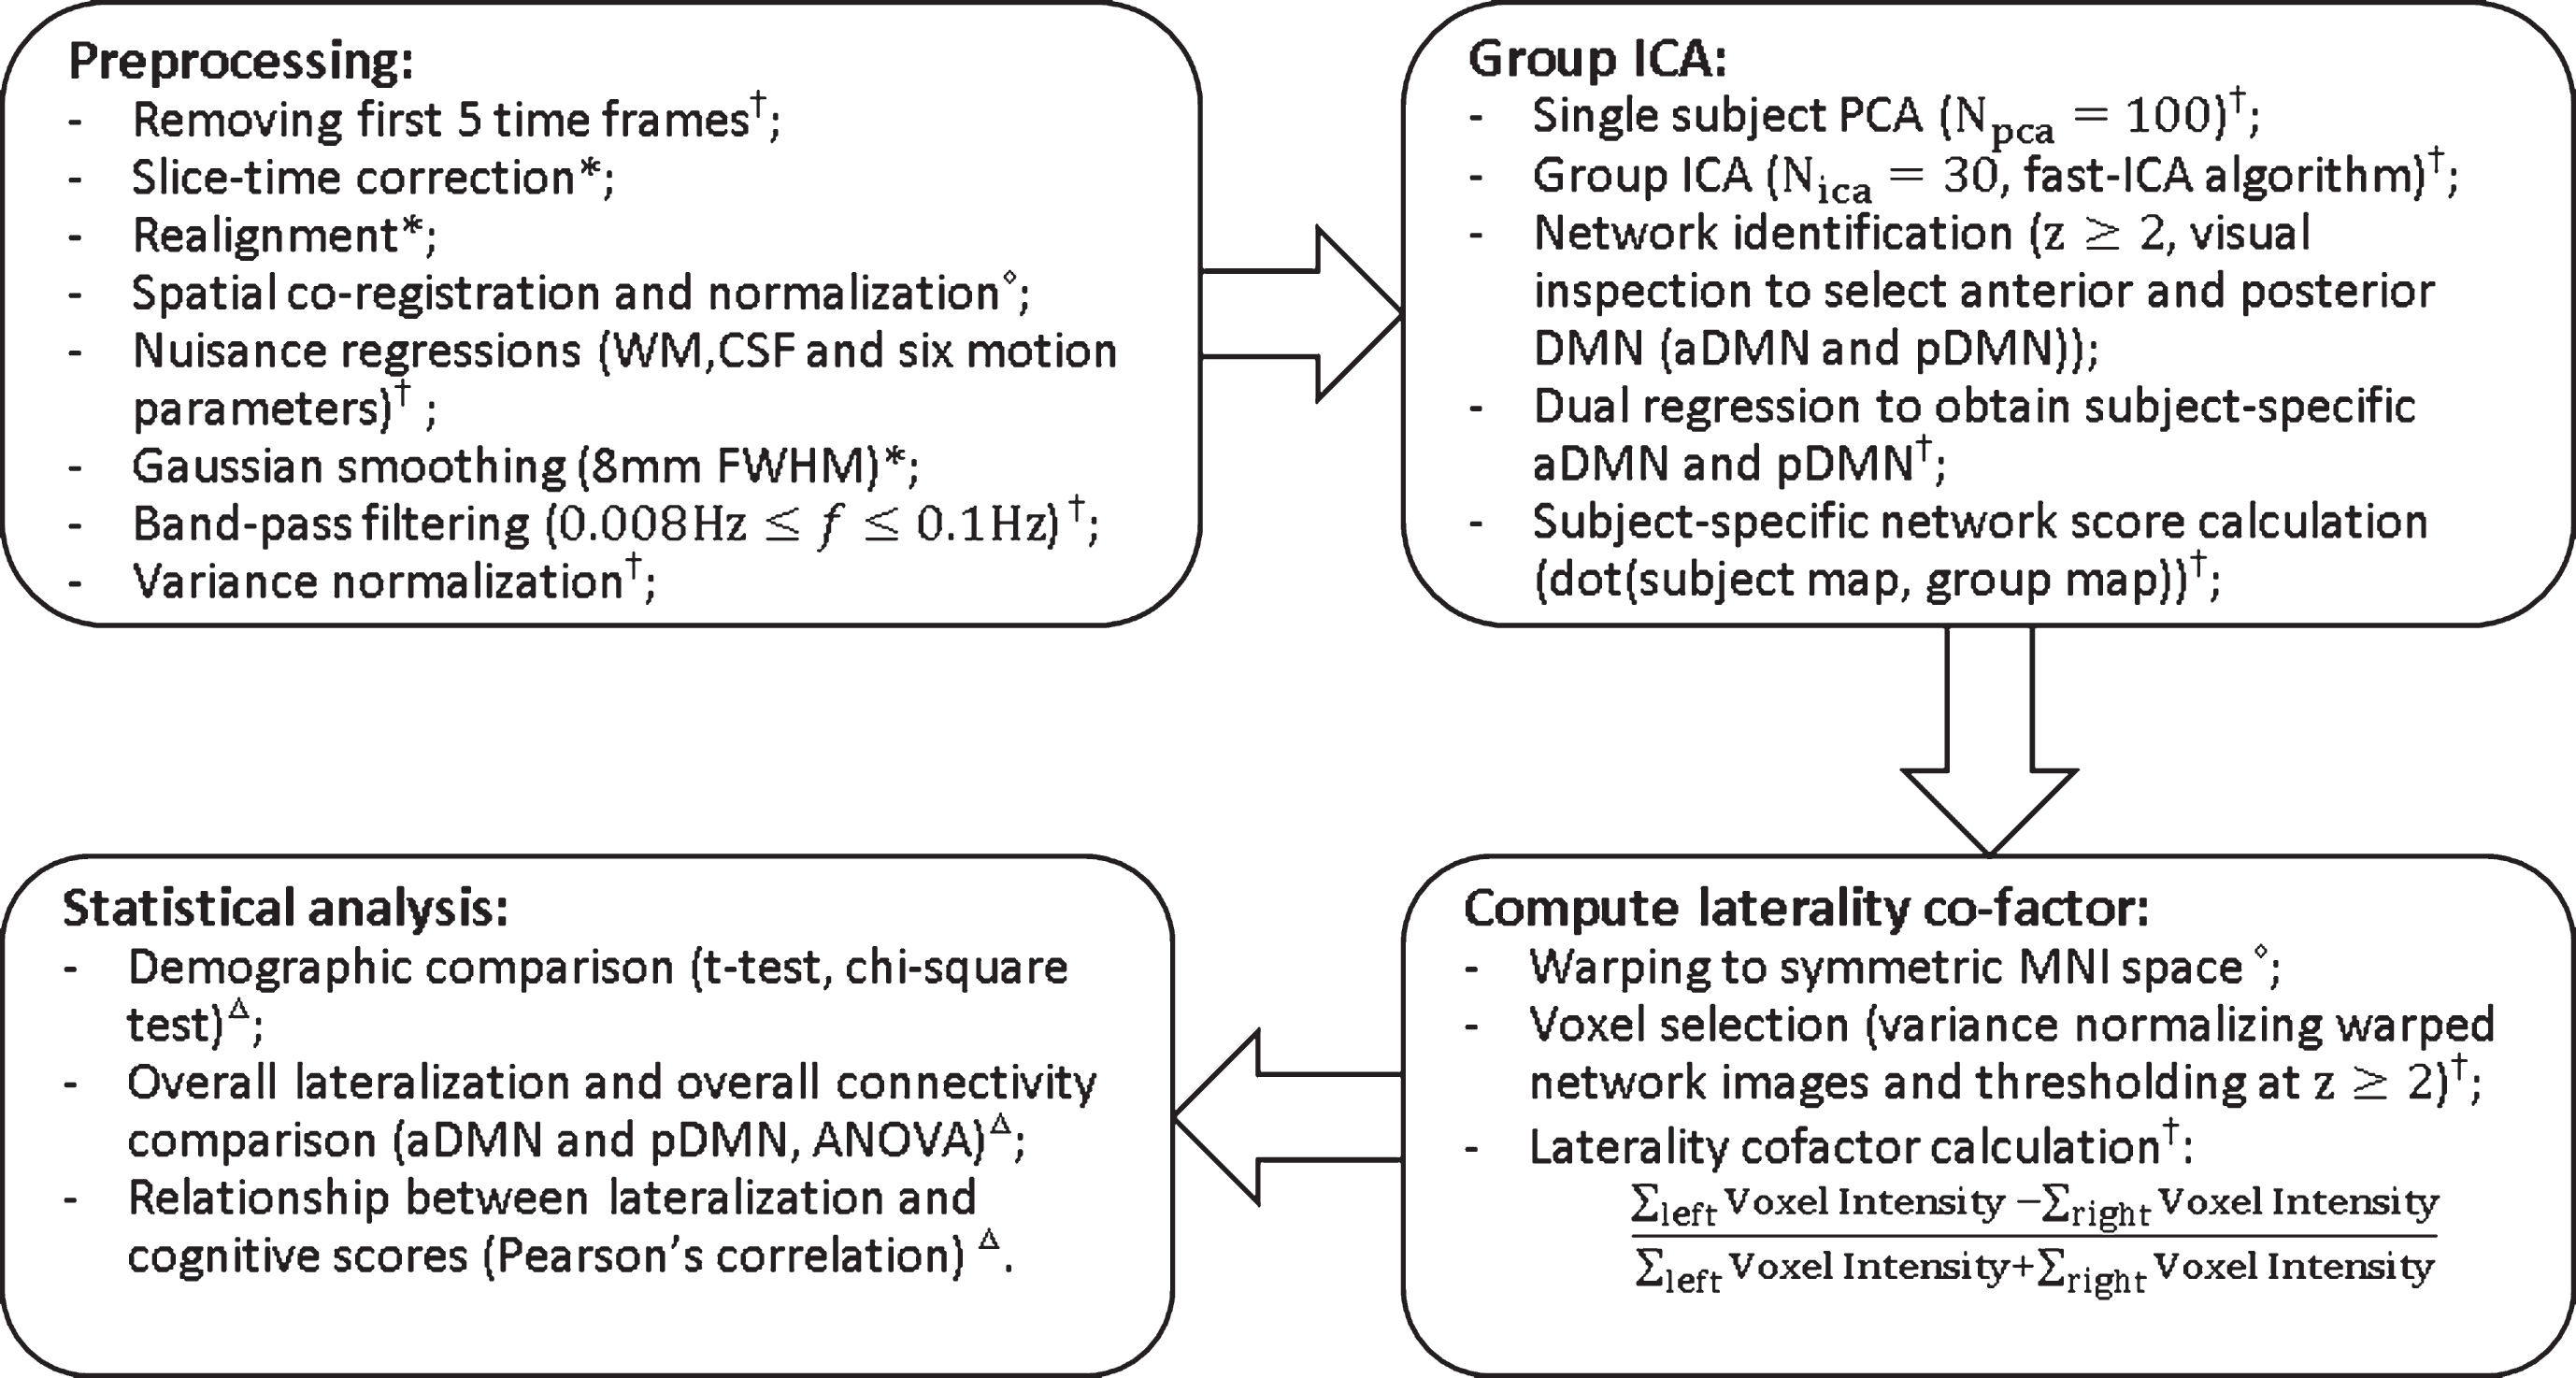
The fMRI imaging analysis steps are outlined in Fig. 1 The first 5 time frames (15 s) were removed to allow the MR signal to achieve T1 equilibrium. Time frames were slice-timing corrected, realigned to the mean echo-planar image using SPM12 (http://www.fil.ion.ucl.ac.uk/spm/), co-registered to the subject T1 space and then normalized to the standard MNI-152 2mm-template using Advanced Normalization Tools software (http://stnava.github.io/ANTs/). Signals from subject white matter and cerebrospinal fluid (3-mm cubes centered at Montreal Neurological Institute coordinates (MNI) (26, –12, 35) and (19, –33, 18) as these locations are away from the grey matter [23]), as well as six head motion parameters were regressed out from each dataset. Global signal regression was not performed as it is controversial in resting state fMRI data preprocessing [24, 25]. Correction for global signal fluctuations with regression has a significant impact on resting state functional connectivity results [26] and can further introduce “artifactual” anti-correlations. Furthermore, global signal includes both neural and non-neural variabilities and therefore makes the result difficult to interpret. FMRI data were spatially smoothed using an 8 mm 3D-Gaussian filter. All voxel time courses were band pass filtered (0.008 Hz<f<0.1 Hz) and variance normalized. The mean signal noise ratio, an indicator of fMRI data quality, was not different between groups (F(3,120) = 2.04, p = 0.11).
Fig. 1.
Flowchart of data processing. Superscripts at the end of each step indicate the software used. *statistical parametric mapping (SPM12); †in house matlab script; △advanced normalization tools; ΔSPSS.
Motion assessment was completed following Power and colleagues [27]. Specifically, we computed root-mean-square (RMS) head motion for each subject. Rotational displacements were converted to translational displacements by projection to a surface of a 50 mm radius sphere and RMS head motion was then computed from both the original translational displacements and the converted rotational displacements. The framewise displacement was calculated as indicated by Power and colleagues [28]. All subjects had less than 0.5 mm (0.18±0.07 mm on average) RMS head motion and RMS head motion was not significantly different between the four groups (F(3,120) = 2.21, p = 0.09). Given the motion was within an acceptable range, we did not use scrubbing or other techniques to remove problematic scans from the time series, which may have introduced further noise in the data. Concerns about scrubbing are that: 1) degrees of freedom, i.e., number of remaining time points is different between subjects; 2) correlation estimates may become excessively noisy if data is removed; 3) censoring may bias the sampling of brain “states” [29]. In addition, removing time points with large motions prior to computing functional connectivity is a destructive procedure that may violate analytic assumptions (e.g., temporal contiguity) [30]. We followed the earlier work of Agcaoglu and colleagues [8] to calculate the global laterality cofactors for each subject. First, preprocessed fMRI data from all subjects were concatenated in time and input to a spatial group ICA. The ICA was carried out with in-house MATLAB scripts using fast-ICA algorithm [31]. Thirty ICA components were obtained. Spatial maps of each ICA component were converted to a z-score map and thresholded at z≥2 to count only the most functionally active part of the component. Each subject-specific ICA map was computed and one-sample t-tests were conducted for each component to test the significance of every voxel in that component. The statistic maps were thresholded at p < 0.05 (corrected). Next, we visually inspected both thresholded spatial maps as spatial maps of a resting-state network should exhibit peak activations in gray matter, and low spatial overlap with known vascular, ventricular motion, and susceptibility artifacts [32]. Based on the above criteria, we selected components that overlap with major grey matter regions. We further compared the selected thresholded spatial maps with Smith and colleagues [33] and Beckmann and colleagues [34] to determine the final 17 components for the resting state networks. A power spectrum of the time signature of each ICA component was also computed. Spectra of resting state networks should be dominated by low frequency fluctuations. Since the TR in our study is 3 seconds, the maximum frequency resolved with our data was 0.17 Hz, which was already in the low frequency range. Therefore, we did not further exclude any selected resting state networks based on this criteria. Subject-specific spatial maps of the seventeen RSNs were then obtained using dual regression [35]. A subject-specific network score was calculated for each component by taking the dot product of the group ICA map with the subject-specific spatial map using only functionally active voxels (z≥2) in the group ICA map following the procedure completed by Vo and colleagues [36].
Next, the subject-specific ICA maps were warped to a symmetric Montreal Neurological Institute (MNI) template to overcome hemispheric asymmetries. Following Agcaoglu and colleagues, we obtained the symmetric MNI template by averaging the template itself and its mirror image [8]. The warped subject-specific ICA maps were then converted to z-score maps. In order to count only the most functionally active part of the component in each subject, a mask was generated with only z≥2 voxels retained. The laterality cofactor was then calculated by taking the differences between the sum of all within-mask voxel intensities on the right and left hemispheres with respect to the sum of all within-mask voxel intensities over the brain, as explained in Fig. 1 More negative values thus represented more left-lateralized network connectivity. Out of the seventeen RSNs obtained from ICA, we were particularly interested in the DMN. DMN was evaluated further as aDMN and pDMN.
Structural MRI processing
In order to ensure that fMRI findings were not the result of underlying structural asymmetries, we completed a similar analysis with the structural scans. Specifically, we calculated laterality cofactors of the voxel-based morphometry (VBM) results from each subject. Initially, we ran DARTEL (within SPM12) on each subject in order to obtain a smoothed and modulated grey matter density map. This map was then normalized to symmetric MNI space. Each symmetric grey matter density map was thresholded at 0.1 to restrict analysis to the grey matter. We then created masks of the aDMN and pDMN generated using the fMRI results above and normalized to the symmetric MNI space. These masks were applied to the grey matter density map, which was then used to compute the structural lateralization cofactor:
Replication of prior DMN analyses
To assess for group differences in the overall connectivity within each network we replicated the DMN connectivity analyses of Damoiseaux and colleagues [7]. Using the preprocessed data (as described above) we compared groups with a t-test applied to the Threshold Free Cluster Enhancement (TFCE [37]), using PALM in FSL software (https://fsl.fmrib.ox.ac.uk/fsl/fslwiki/PALM) [38, 39], applying a mask of the group ICA component in question. Significance was determined by p < 0.05 family wise error correction.
Statistical analysis
All statistical analyses were done in IBM SPSS version 23 (Armonk, NY). Demographics between groups were compared by analysis of variance (ANOVA) with post-hoc comparisons and Chi squared tests. Pearson’s correlations were used for the relationship between functional lateralization and age. Overall functional lateralization and overall connectivity within the networks of interest were compared using ANOVA with post-hoc comparisons when the omnibus test was found to be significant. We further analyzed the effect of overall amyloid load as a continuous variable on functional lateralization of each of the DMN subnetworks by linear regression adjusted for age. Structural laterality cofactors obtained from the VBM analysis were compared between groups using ANOVA. Relationship between structural and functional lateralization, between aDMN and pDMN functional lateralization were assessed by Pearson’s correlations. Gender effect on cognitive test scores was assessed by t test. Relationship between cognitive test scores and functional lateralization, as well as overall SUVR was further assessed with partial correlations controlling for the effect of demographic factors which were associated with RAVLT scores. Further, we wanted to investigate whether the effect of lateralization on cognitive test scores (for scores significantly correlating with lateralization) is impacted by the presence of amyloid. Therefore we ran a medication analysis with amyloid SUVR as the mediator, cognition as the outcome and DMN lateralization as the predictor. Demographics were included as covariates and the PROCESS macro for SPSS was used [40]. The indirect effects were tested using a bootstrap estimation approach with 1000 samples. Statistical significance was defined as p < 0.05.
RESULTS
Participants
Demographic details are provided in Table 1. Education differed between groups (F(3,119) = 2.724, p = 0.047), with Aβ-NC being significantly more highly educated than the Aβ+AD group (p = 0.031).
Table 1
Group demographics
| Aβ–NC | Aβ+NC | Aβ+MCI | Aβ+AD | Group comparisons | |
| Age | 72.72 (5.76) | 74.91 (6.92) | 73.21 (7.00) | 74.17 (6.73) | ns |
| Years of education | 17.03 (1.82) | 16.70 (2.45) | 15.90 (2.71) | 15.40 (2.50) | Aβ-NC>Aβ+AD |
| % women | 62.5 | 50 | 47.7 | 51.9 | ns |
| % Caucasian | 93.8 | 95 | 95.5 | 92.6 | ns |
All variables are stated as mean (standard deviation) or percentage. Aβ-NC, amyloid negative normal controls; Aβ+NC, amyloid positive normal controls; Aβ+MCI, amyloid positive mild cognitive impairment patients; Aβ+AD, amyloid positive Alzheimer’s disease patients; ns, nonsignificant.
Default mode network connectivity
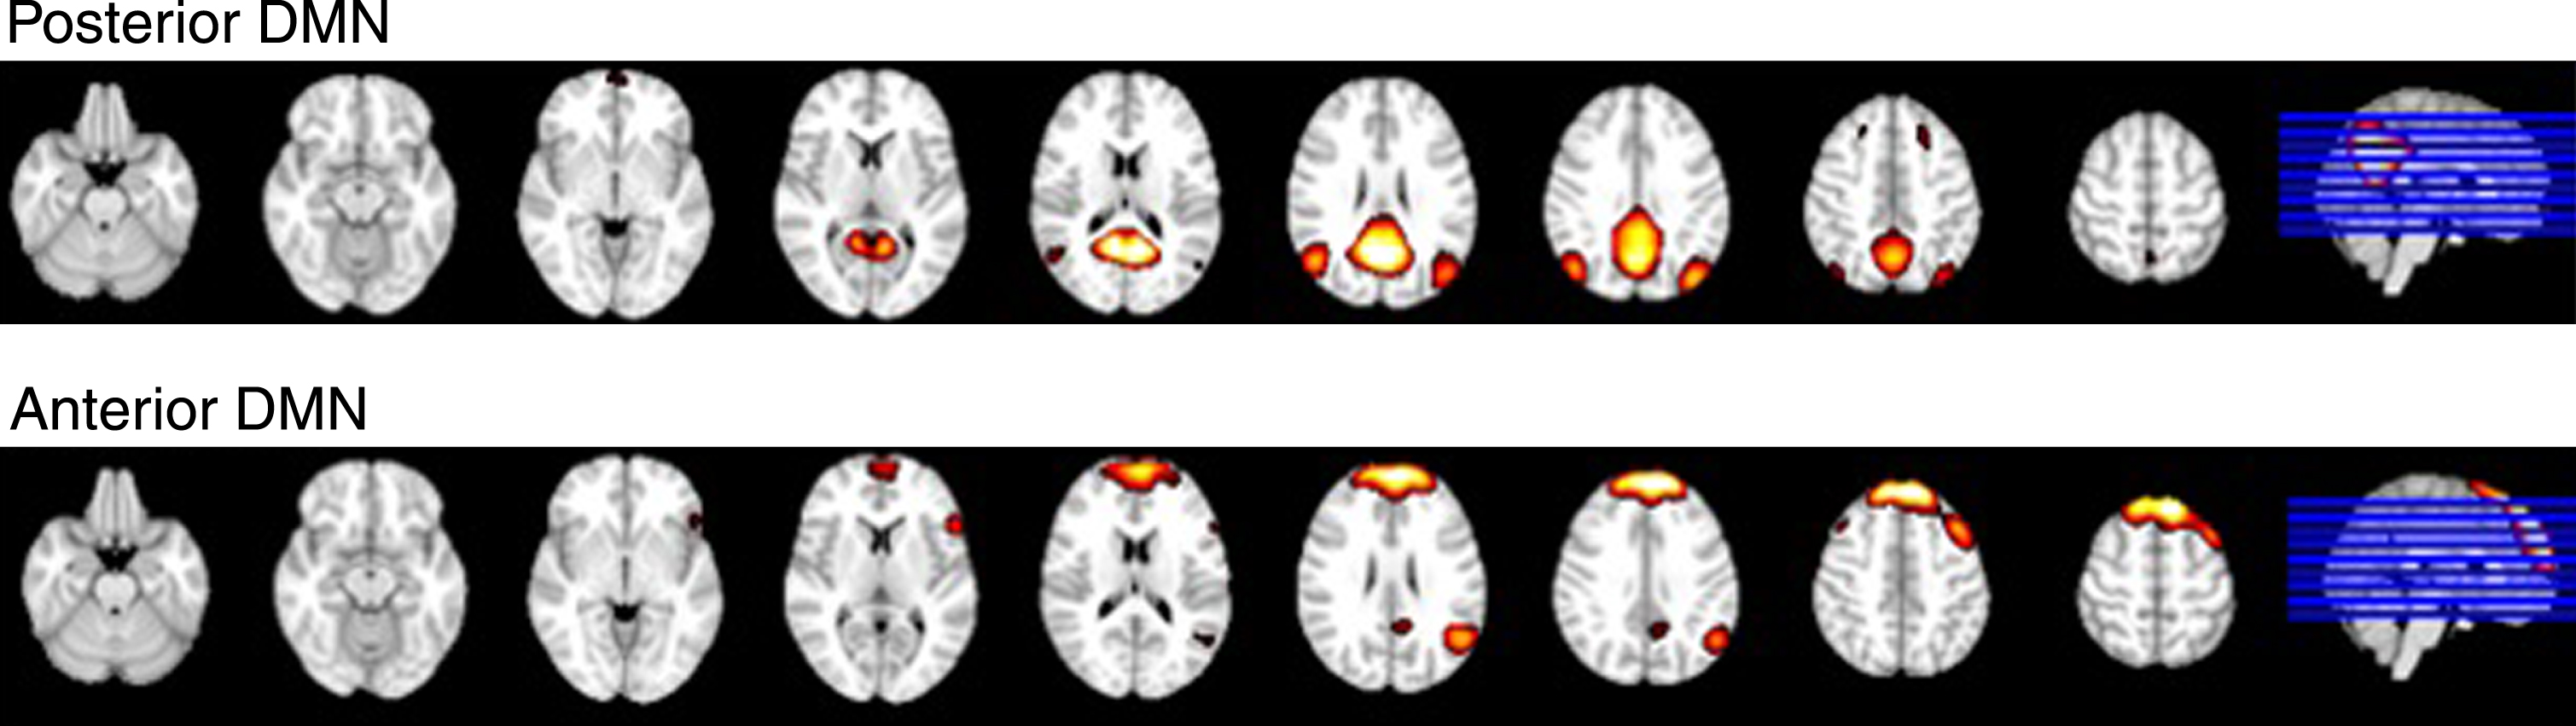
Group maps of the aDMN and pDMN are displayed in Fig. 2 There was no difference between groups for overall connectivity within the aDMN or pDMN using the subject-specific network score approach. There was also no difference between groups within either network using previously-applied functional connectivity (TFCE) analysis.
Fig. 2.
Spatial maps of the pDMN and aDMN.
Functional lateralization and age
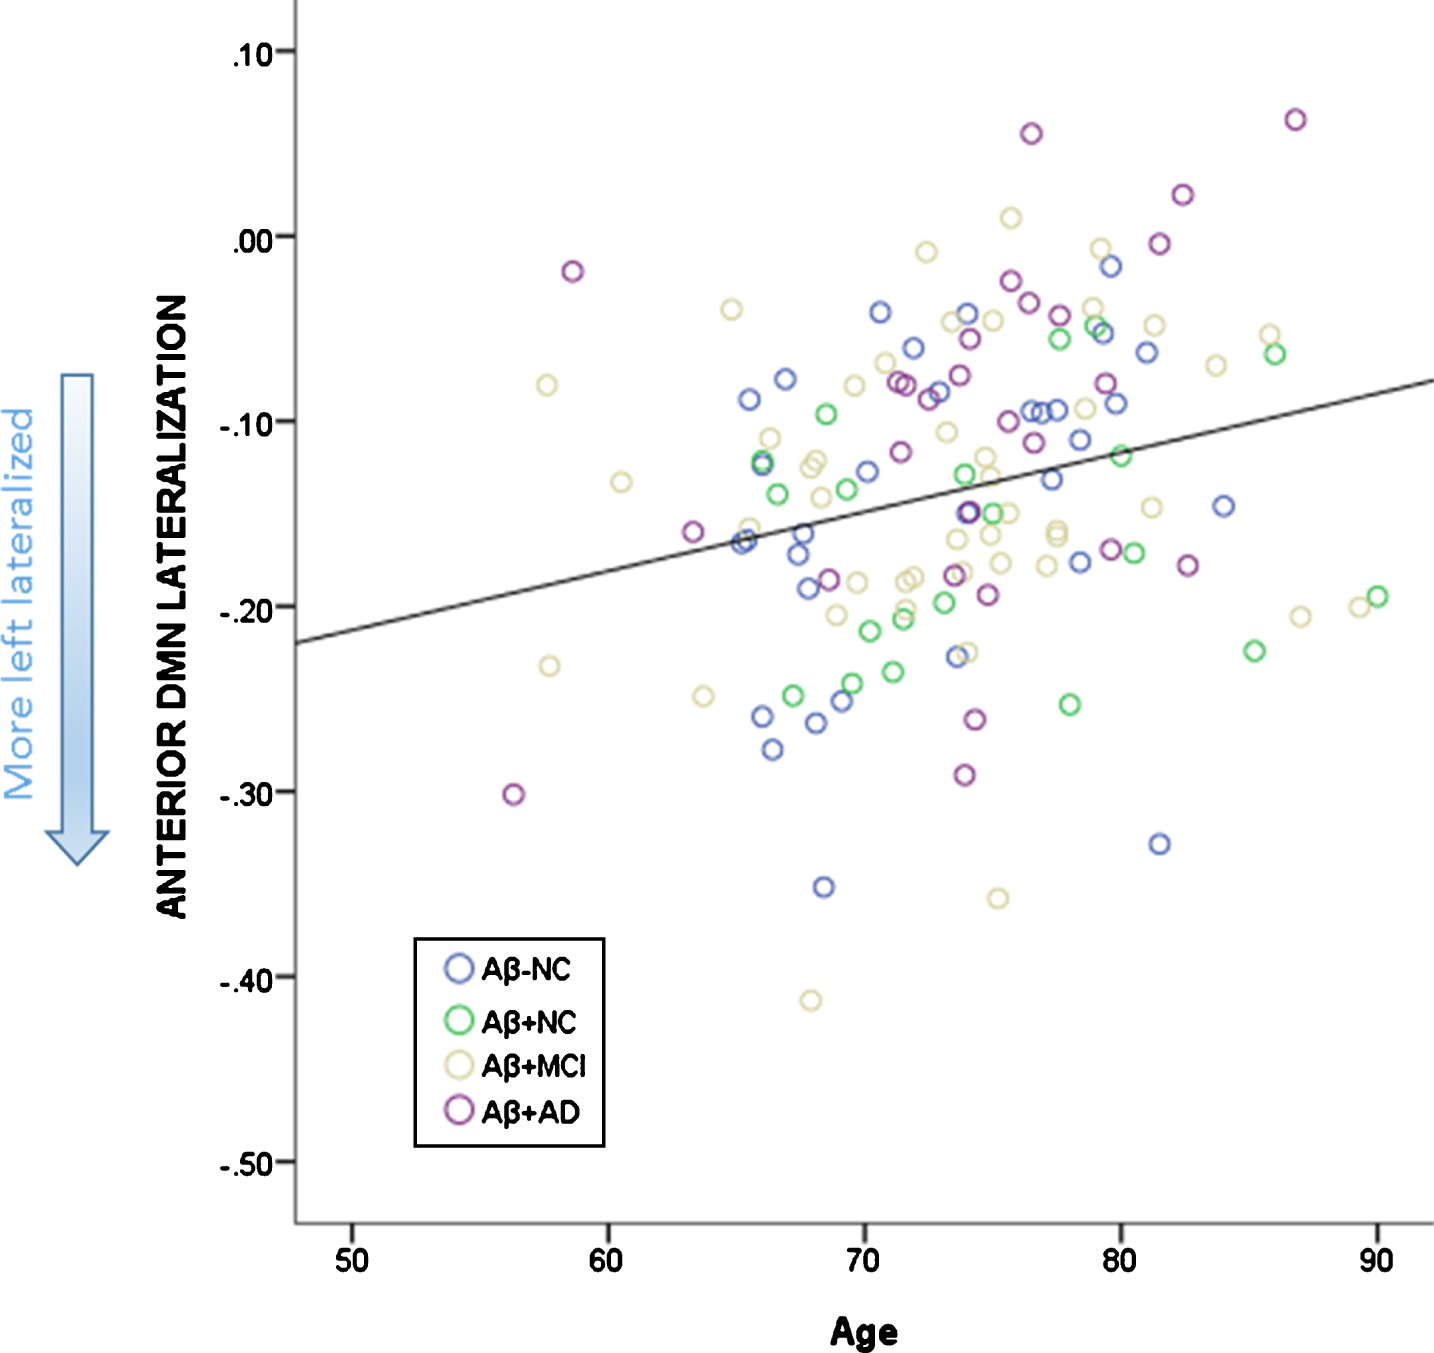
When all groups were combined, there was a significant correlation between age and aDMN lateralization (r = 0.244, p = 0.006), with less left lateralization seen in older participants. When the groups were separated, this relationship remained significant only for Aβ+AD (r = 0.417, p = 0.030). PDMN lateralization showed no correlation by age either with the combined group or within each group.
Functional lateralization between groups
The aDMN lateralization did not differ significantly between groups at the omnibus level (F(3,120) = 1.96, p = 0.123).
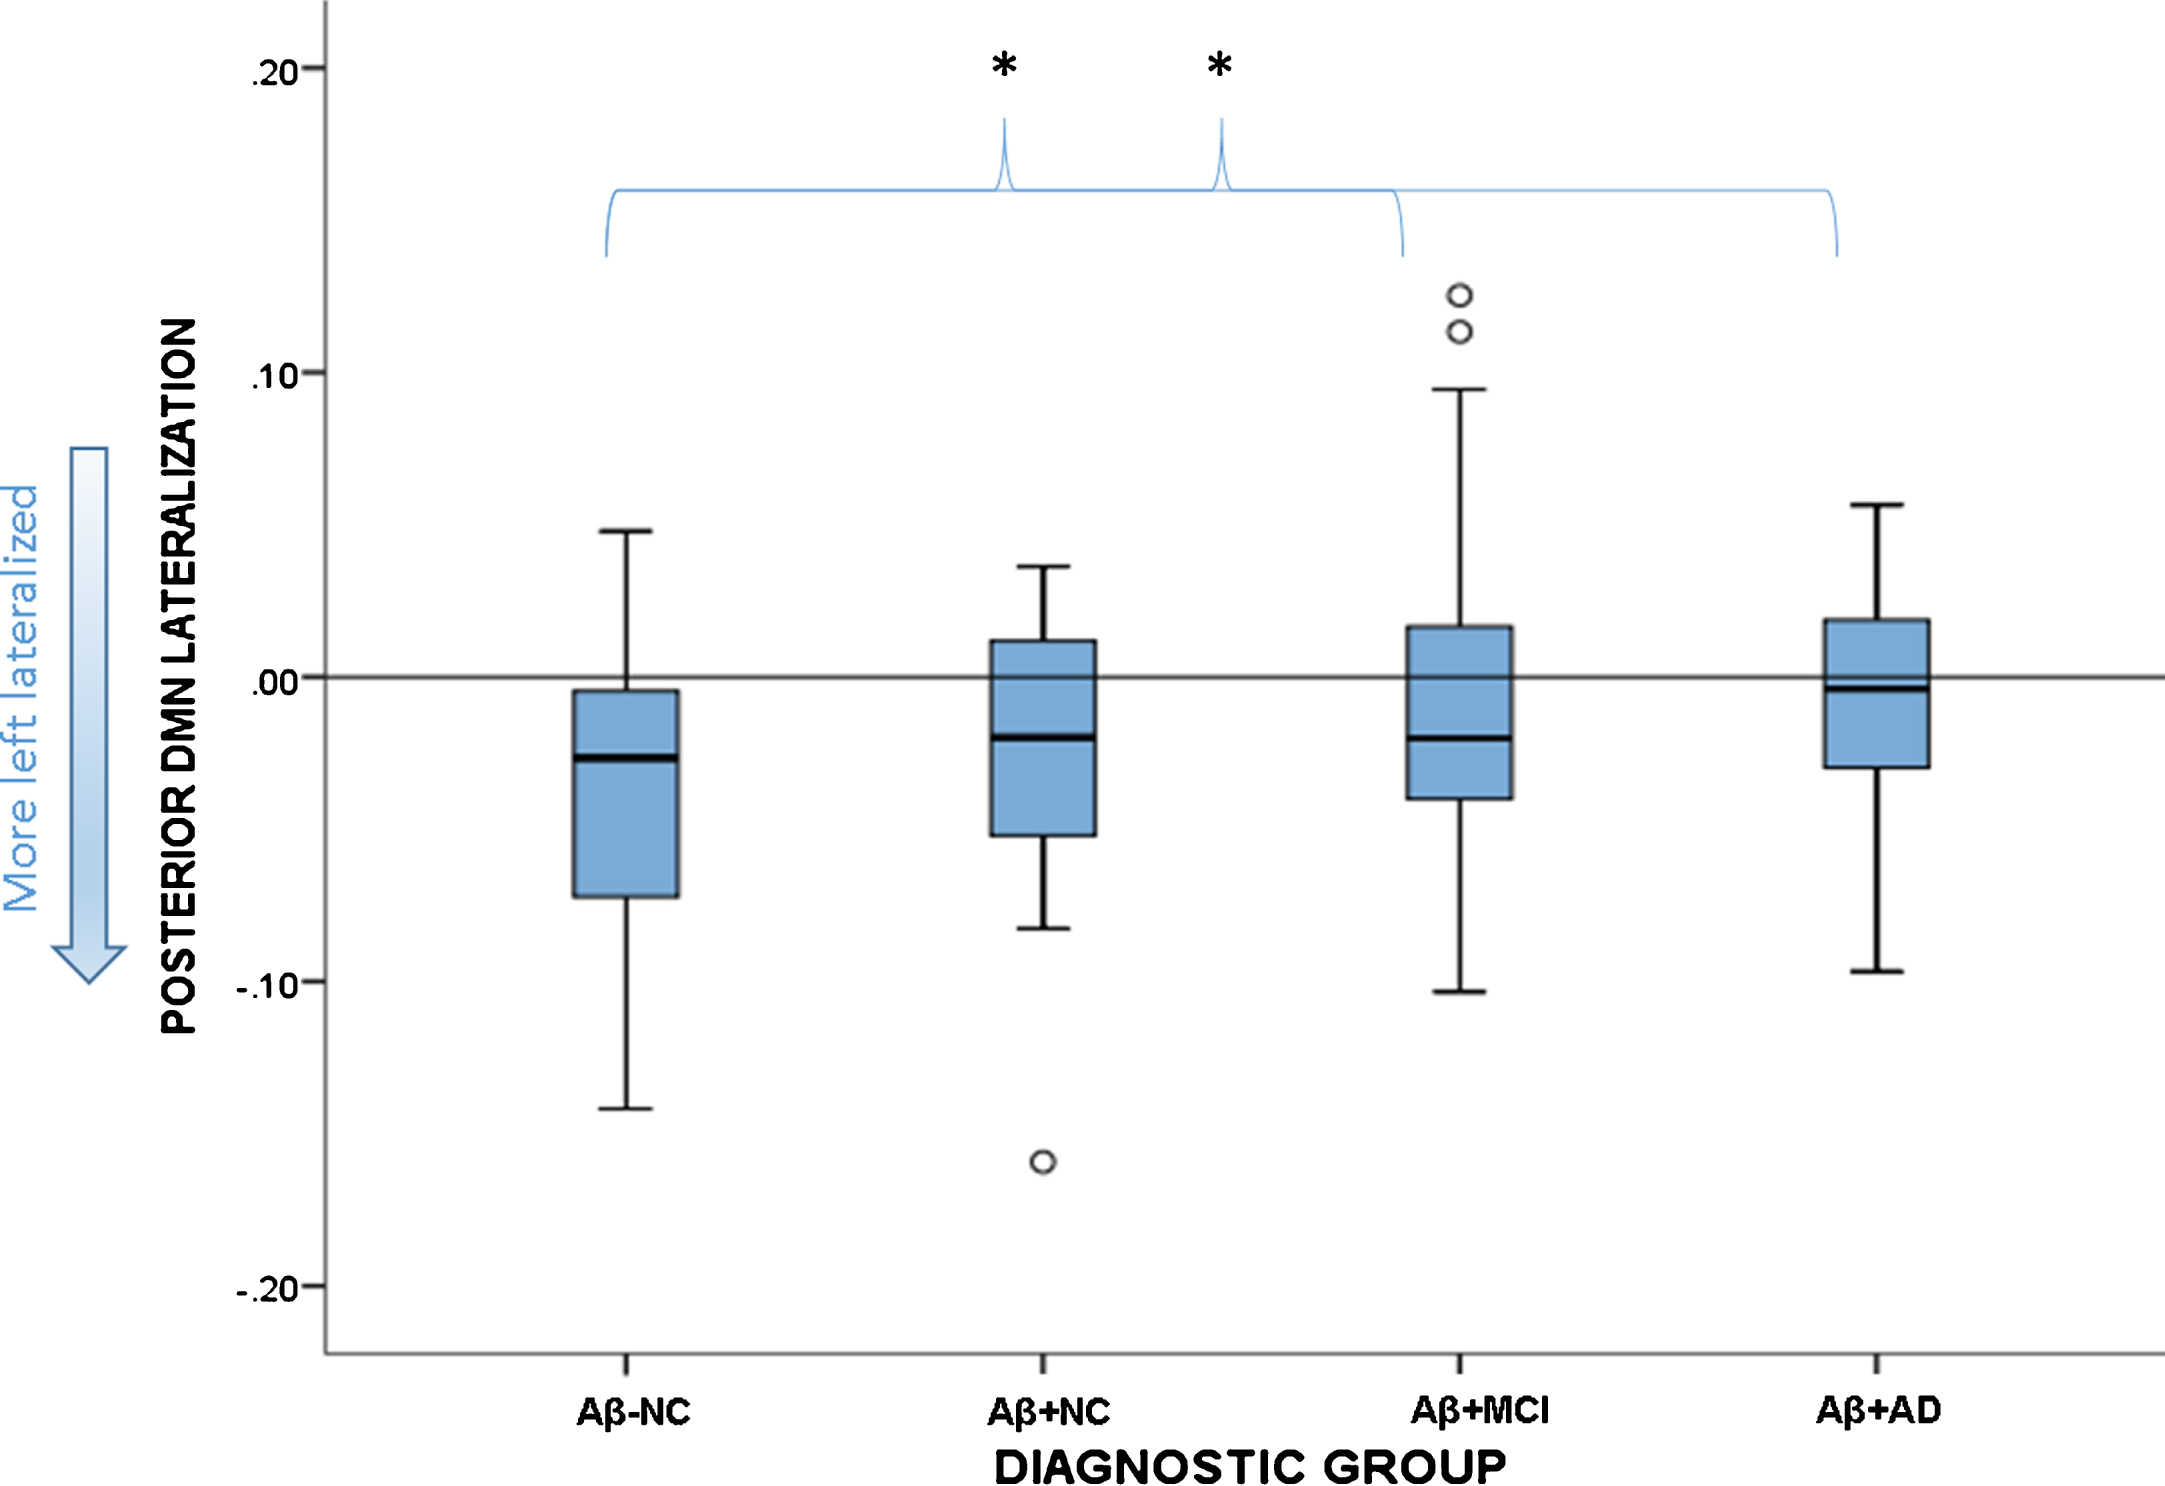
There was a significant group effect on the lateralization of the pDMN (F(3,119) = 2.75, p = 0.046). Group-wise comparisons identified that the Aβ-NC were more left-lateralized than either the Aβ+MCI (p = 0.014) or Aβ+AD (p = 0.020) groups, and did not differ significantly from Aβ+NC. None of the Aβ+groups differed from each other. The spread of scores in each group is depicted in Fig. 3.
Fig. 3.
Boxplot showing spread of functional lateralization scores for the pDMN in each diagnostic group. The reference line at zero signifies no lateralization, anything below this is left lateralized. The Aβ-NC group differed significantly from the Aβ+MCI and Aβ+AD groups, but not the Aβ+NC group. *signifies statistically significant group differences.
The linear regression with overall SUVR as a predictor and age as a regressor in the whole cohort revealed that the model predicted pDMN lateralization (R2 = 0.077, p = 0.008). Age was not a significant predictor (p = 0.897) whereas SUVR was (p = 0.002). The model was also significant for the aDMN lateralization (R2 = 0.061, p = 0.024). For aDMN, SUVR was not a significant predictor (p = 0.740), whereas age was (p = 0.006). The association between SUVR and pDMN; between age and aDMN are depicted in Figs. 4 and 5.
Fig. 4.
Relationship between SUVR and lateralization of the pDMN. More left lateralized is depicted by more negative scores.
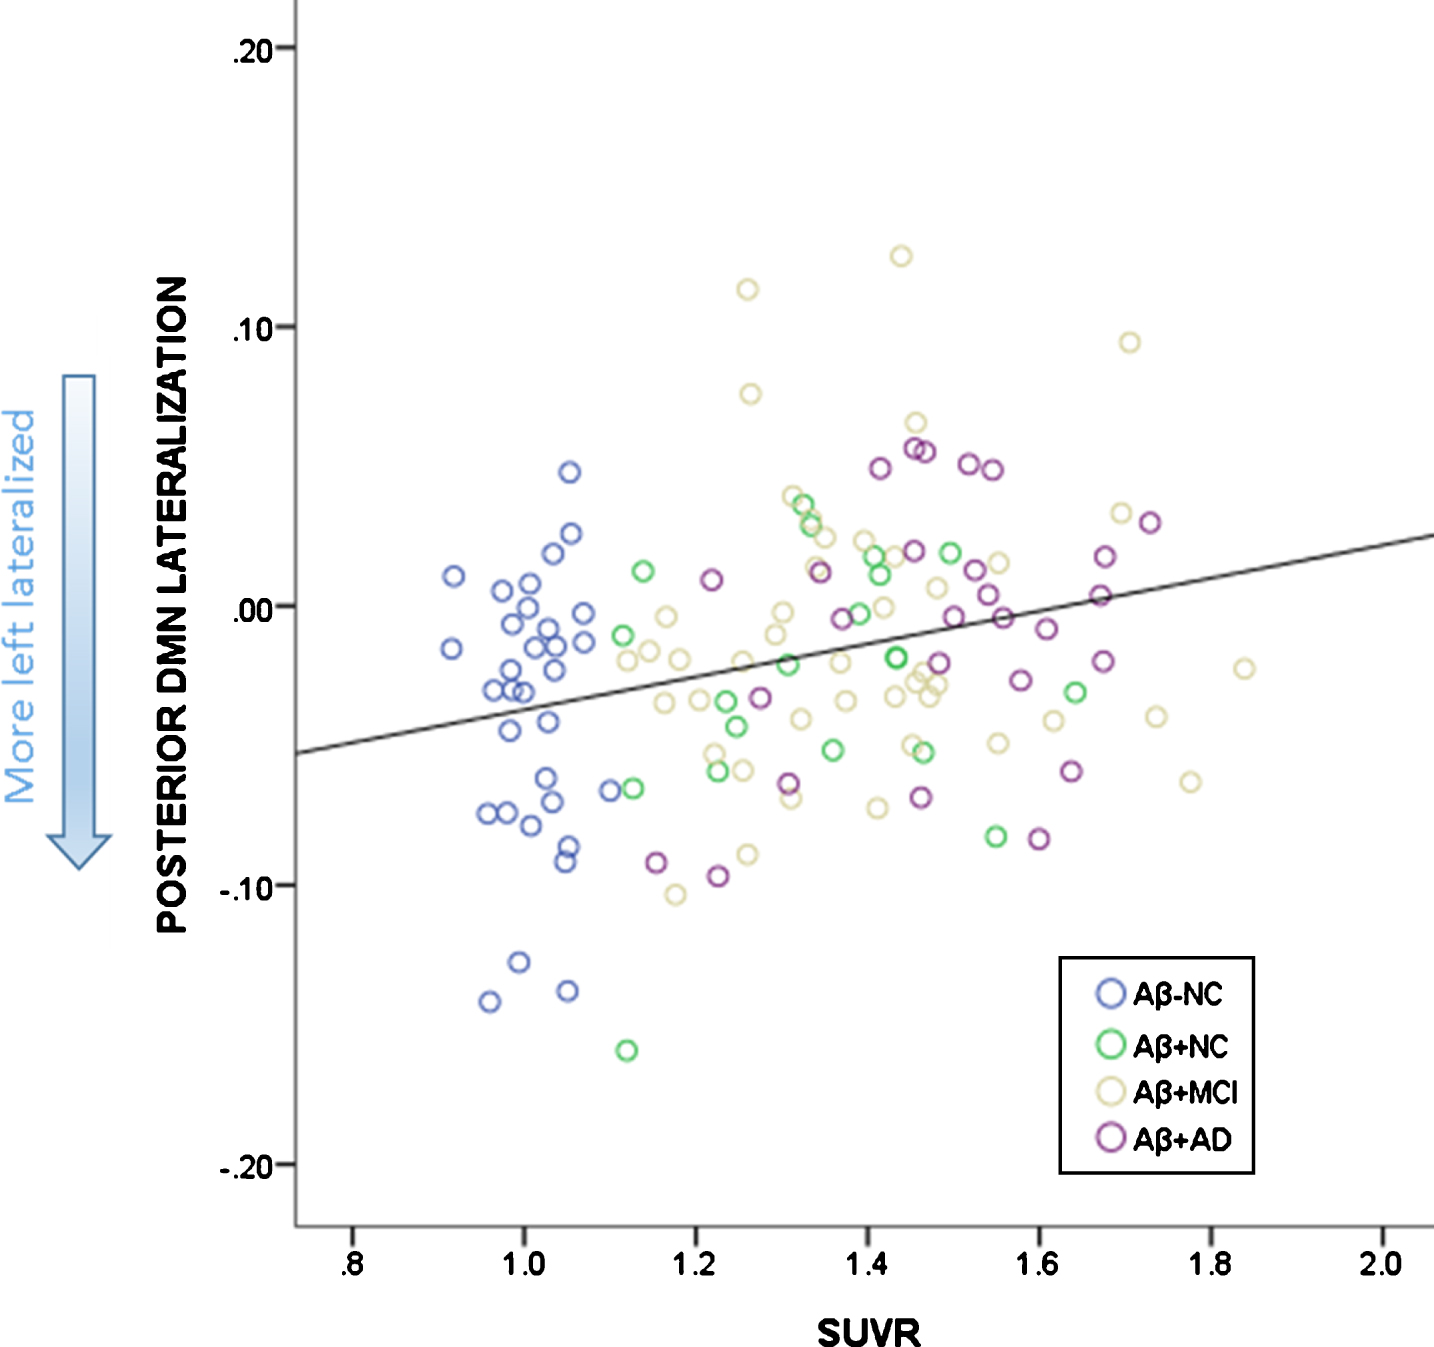
Fig. 5.
Relationship between age and lateralization of the aDMN. More left lateralized is depicted by more negative scores.
Lateralization of volumetric findings
The VBM analysis showed no group differences for either the aDMN (F(3, 120) = 2.319, p = 0.079) or pDMN (F(3,120) = 0.557, p = 0.645), indicating that asymmetry in atrophy within these networks was not evident. There was no significant correlation between structural and functional lateralization within either the aDMN (r = –0.021, p = 0.819) or pDMN (r = –0.066, p = 0.465).
Relationship between networks
aDMN and pDMN functional lateralization were not correlated with each other (r = 0.011, p = 0.908).
Functional lateralization and cognition
Mean total learning score was 4.91 (3.38) for females, and 4.29 (2.81) for males without any significant differences between the two genders (t(33) = 0.567, p = 0.575). Females had a significantly higher delayed recall score (mean score for females: 5.03 (4.45), mean score for males 3.48 (3.75); t(121) = 2.071 p = 0.041).
Age was negatively correlated with RAVLT scores (r = –0.401, p = 0.017 for total learning; r = –0.262, p = 0.003 delayed recall); years of education was positively correlated with RAVLT scores (r = 0.416, p = 0.013 for total learning; r = 0.272, p = 0.002 for delayed recall).
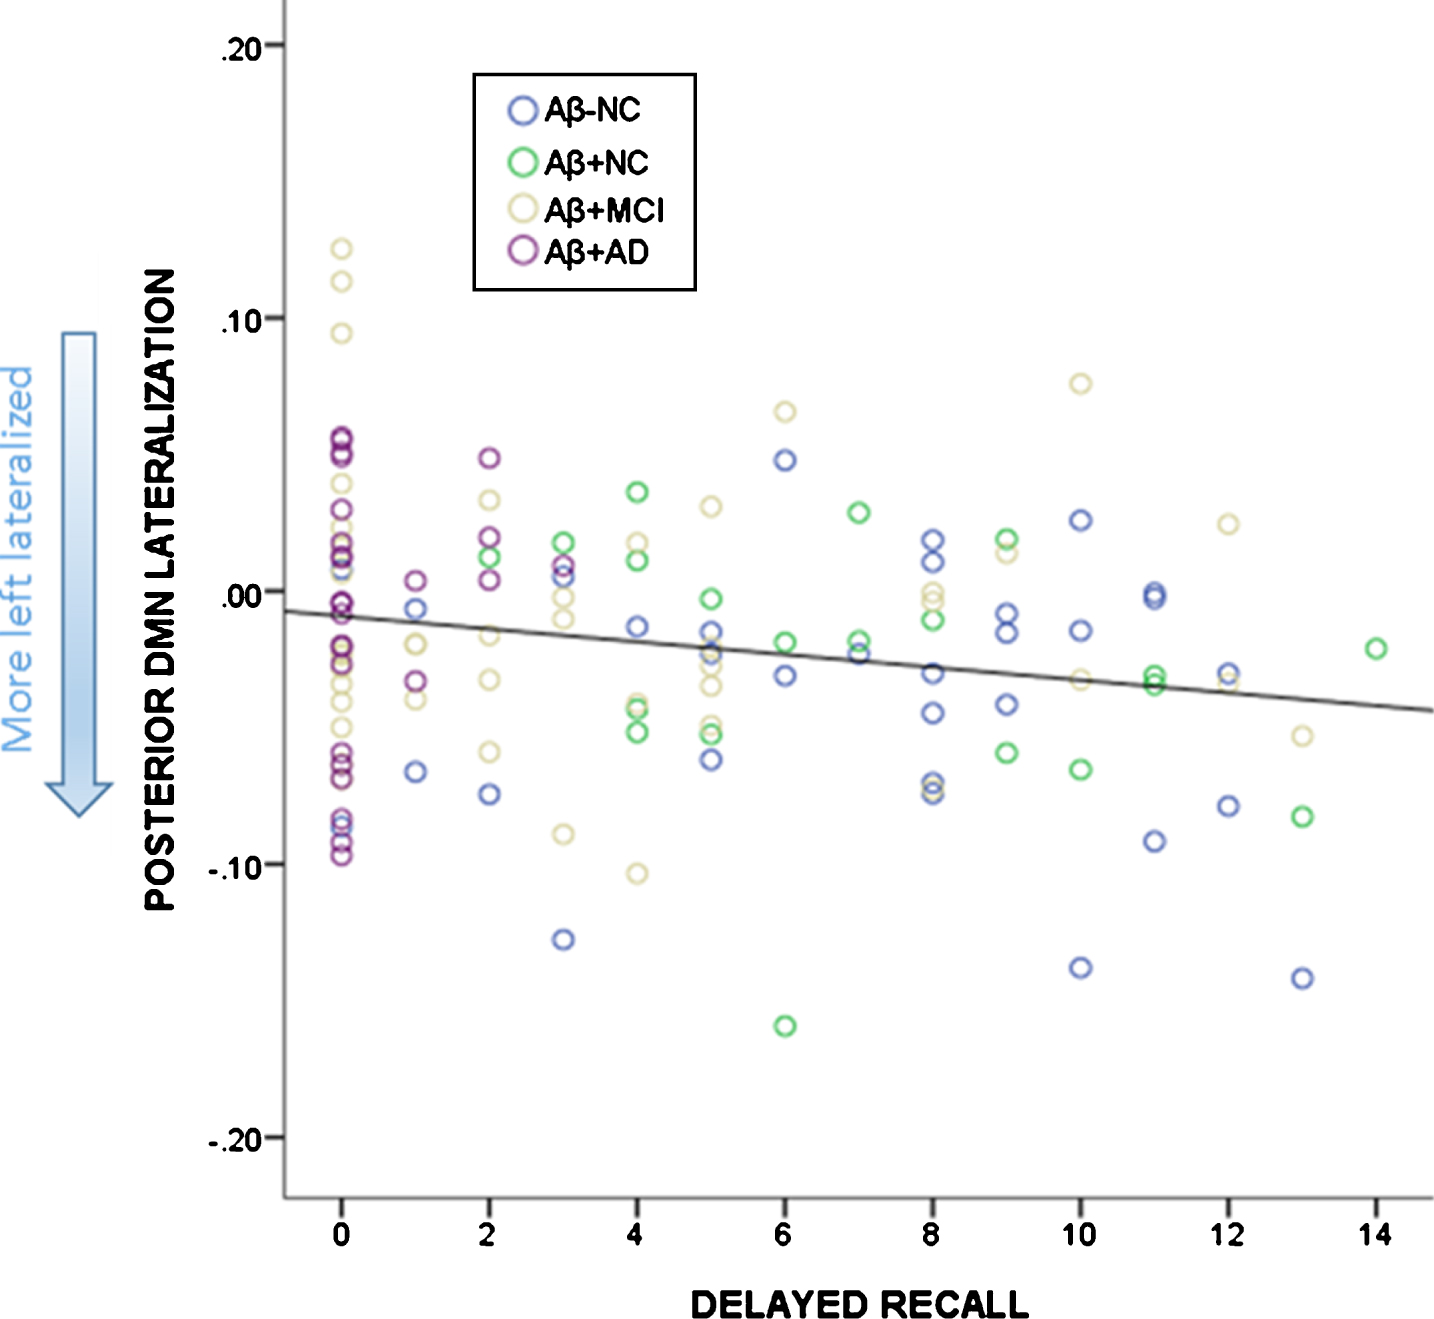
There were no significant correlations between total learning and functional lateralization of DMN lateralization (aDMN (r = –0.325, p = 0.065) and pDMN (r = –0.224, p = 0.211)) or amyloid (SUVR r = –0.284, p = 0.110)) controlling for age and years of education. Higher delayed recall scores were associated with a greater degree of left functional lateralization in (aDMN (r = –0.231, p = 0.011)) and pDMN (r = –0.246, p = 0.007); and lower SUVR (r = –0.424, p = 0.000) (controlling for age, gender, and years of education). Given the significant relationships between both SUVR and DMN functional lateralization with delayed recall, we wanted to ascertain whether SUVR mediated the relationship between lateralization of DMN function and delayed recall including age, gender, and years of education as covariates. Analysis with aDMN lateralization as the predictor and SUVR as the mediator revealed that aDMN lateralization was not a significant predictor of SUVR (b = –0.077, SE = 0.249, p = 0.759). Both aDMN lateralization and SUVR were predictors of delayed recall scores (b = –10.746, SE = 4.161, p = 0.011; b = –7.390, SE = 1.385, p = 0.000). After controlling for the mediator, aDMN lateralization was still a significant predictor of delayed recall (b = –11.312, SE = 3.749, p = 0.003). SUVR did not have a mediating effect as indirect coefficient was not significant (b = 0.567, SE = 1.980, 95% CI –3.166, 4.712). Analysis with pDMN lateralization as the predictor and SUVR as the mediator revealed that pDMN lateralization was a significant predictor of SUVR (b = 1.441, SE = 0.0411, p = 0.001). Both pDMN lateralization and SUVR were predictors of delayed recall (b = –19.318, SE = 7.189, p = 0.007; b = –6.598, SE = 1.496, p = 0.000). After controlling for the mediator, pDMN lateralization did not significantly predict delayed recall (b = –10.305, SE = 7.024, p = 0.145). SUVR was a mediator of the pDMN lateralization effects on delayed recall scores (b = –9.507, SE = 3.331, 95% CI –17.206, –3.885). Association between the delayed recall scores and pDMN lateralization is depicted in Fig. 6.
Fig. 6.
Relationship between delayed recall (number of words) on the RAVLT and lateralization of the pDMN. More left lateralized is depicted by more negative scores.
When separated by group, the Aβ+MCI group showed more left functional lateralization of the pDMN to be associated with higher learning scores (r = –0.634, p = 0.049) (controlled for age, and years of education), and higher delayed recall scores (r = –0.314, p = 0.045) (controlled for age, years of education, and gender). Whereas in the Aβ+AD group, higher delayed recall scores were associated with more left lateralization of the aDMN (r = –0.422, p = 0.036) (controlled for age, years of education, and gender).
DISCUSSION
In this study, we addressed how functional lateralization of the DMN differs across the AD spectrum. Functional lateralization of the pDMN appears to be related to presence of cognitive impairment and amyloid load, while functional lateralization of the aDMN was related to age. Reduction in anterior functional lateralization is consistent with the idea that the frontal lobes become less specialized with age or are required to be more bilaterally active in order to compensate for reductions in efficiency, as suggested by the authors of the HAROLD model [41]. The cognitively unimpaired groups did not differ on aDMN or pDMN lateralization, suggesting that the presence of amyloid in the brain may, by itself, not be related to reduced lateralization. However, when amyloid is assessed as a continuous variable, higher levels were associated with reduced left-functional lateralization across the cohort in the pDMN, whereas only age was associated with reduced functional lateralization in the aDMN.
The DMN is a resting state network which deactivates during tasks and interaction with external stimuli [42, 43]. Many intrinsic brain networks are lateralized, including the DMN [8]. In healthy controls, the DMN was found to be mostly left lateralized with age shifting this lateralization to the right side [8]. Our findings suggest that reductions in left-functional lateralization occur beyond overall connectivity change within either DMN, thus left-functional lateralization is impacted by aging and/or the advancement of AD. Previously, dementia severity in AD has been associated with DMN atrophy and this atrophy showed a lateralized pattern [44]. As our findings were not explained by differences in lateralization of volume within the DMN, we were able to exclude the effect of DMN volume on the association between functional lateralization and AD in our sample.
The relationship between lateralization and cognition differed by group and subnetwork. Whereas left-functional lateralization of the pDMN was associated with better performance in learning and recall in the MCI group; left-functional lateralization of the aDMN was related to better recall performance in AD group. Thus, the pDMN lateralization may have more of a compensatory role, while aDMN lateralization may reflect lack of specialization. Only a small component of the variance in verbal learning and memory was explained by functional asymmetry, thus the clinical significance of these findings is questionable, but warrants further study.
Deposition of Aβ in the brain is considered to be the first pathological mechanism of AD [45], which can precede the onset of symptoms by up to 15 years [46]. While it has traditionally been thought to be diffuse very early in the preclinical phase of AD, a recent study by Palmqvist and colleagues, early stage Aβ deposition was found to be located within DMN regions alongside hypoconnectivity within the network [47]. Interestingly, the deposition and hypoconnectivity were not coupled with any metabolic or structural changes. This suggests that early Aβ deposition is an important reflection of network disruption, occurring before hypometabolism or atrophy. In our study, amyloid did not specifically relate to functional lateralization in the two unimpaired groups when analyzed separately, although it was a significant predictor of reduced functional lateralization of the pDMN when the groups were combined. It seems likely, given information about the cascade of biological changes seen in AD [48], that reduction in pDMN functional lateralization is related to either the very early deposition of amyloid, which impacts the cortical regions of the pDMN [49] or it may be due to later processes such as tau deposition or changes in the integrity of the underlying brain networks (atrophy, reduced structural connectivity or functional capacity of networks). Indeed, the mediation analysis in the current study showed that only with the additional impact of amyloid was pDMN lateralization predictive of cognitive decline, suggesting that the decline in lateralization may be related to amyloid-fueled network disruption which is characteristic of AD. Application of other imaging modalities, such as diffusion tensor imaging and other structural methods, as well as tau PET imaging, may help elucidate the etiology and pathological stage at which reduced functional lateralization becomes relevant.
Our results on overall connectivity within each DMN differed from earlier results by Damoiseaux and colleagues [7], who showed lower pDMN connectivity in AD patients, and enhancement in aDMN connectivity compared with healthy controls, but reduction in both networks with progression of the disease. The groups in the current study were larger and characterized with amyloid imaging, thus providing greater diagnostic accuracy. However, the participants in the current study were on average a decade older than those in the earlier study, perhaps accounting for some of the difference. On the other hand, ICA, a data-driven method for imaging analysis was used in both studies. As DMN was identified based on our overall sample, which includes more diseased brains than healthy brains, our findings may have differed from the study by Damoiseaux and colleagues, which included a similar number of individuals with AD and healthy controls [7].
The current study highlights the potential role of functional lateralization of the DMN in understanding changes in brain activity with aging and AD. However, the study was limited to the tests completed during ADNI visits, where memory is assessed only through the verbal modality (word lists and stories). Using an extensive cognitive battery including both verbal and nonverbal memory measures, Royall and colleagues (2014) found that non-verbal decline, rather than verbal change was associated with aging [50]. Thus, future research using nonverbal memory measures will be important in understanding the role of lateralization of these networks in memory more widely. It is possible that the use of verbally mediated memory tests in diagnosis and tracking of AD is biased toward patients with reduced left hemisphere functional integrity. It might be that functional lateralization is not a sign of amyloid deposition or AD, but a sign of poor performance on verbal memory measures. It will be important to investigate nonverbal and spatial memory measures to see if performance on these tests is equally related to reduction in functional lateralization.
While the RAVLT results are not used in the definition of MCI status, ADNI relies heavily on a verbal memory task (Logical Memory) to define the cognitive impairment group which may add a tautology to the current results. Importantly, our results pertained to resting state data, it is unclear how this will map on to task-positive findings. While the results suggest lateralization changes in those with markers of AD while at rest, further studies are required to determine the implications during verbal and nonverbal tasks. As we only analyzed cross-sectional data, our results do not speak to causality or temporal ordering of changes in amyloid and lateralization, which could be further investigated with a longitudinal design. While the group level findings showing that better verbal performance is associated with more left-functional lateralization among the cognitively impaired participants, longitudinal data could help elucidate whether functional lateralization plays an active role in cognitive impairment. The current study indicates that functional lateralization may be an important, and currently neglected, facet of default mode network research. Limitations of the present study that could be surmounted in future studies include the relatively small size of each group, and the lack of extensive neuropsychological testing which might have allowed for more thorough exploration of the impact of lateralization on different aspects of memory and other cognitive functions.
In sum, this study points to the potential importance of examining not only connectivity of the DMN, but also functional lateralization of the DMN, in understanding the early changes in preclinical AD. There appears to be distinct relationships between functional lateralization with age and amyloid, depending on which subnetwork of the DMN we assess. Given the overlaps between early amyloid deposition and spread with the DMN, there may be a mechanistic relationship between changes in functional lateralization and the progression of amyloid in the brain.
ACKNOWLEDGMENTS
Research reported in this publication was supported by an institutional development award (IDeA) from the National Institute of General Medical Sciences of the National Institutes of Health under grant number 5P20GM109025.
Data collection and sharing for this project was funded by the Alzheimer’s Disease Neuroimaging Initiative (ADNI) (National Institutes of Health Grant U01 AG024904) and DOD ADNI (Department of Defense award number W81XWH-12-2-0012). ADNI is funded by the National Institute on Aging, the National Institute of Biomedical Imaging and Bioengineering, and through generous contributions from the following: AbbVie, Alzheimer’s Association; Alzheimer’s Drug Discovery Foundation; Araclon Biotech; BioClinica, Inc.; Biogen; Bristol-Myers Squibb Company; CereSpir, Inc.; Cogstate; Eisai Inc.; Elan Pharmaceuticals, Inc.; Eli Lilly and Company; EuroImmun; F. Hoffmann-La Roche Ltd and its affiliated company Genentech, Inc.; Fujirebio; GE Healthcare; IXICO Ltd.; Janssen Alzheimer Immunotherapy Research & Development, LLC.; Johnson & Johnson Pharmaceutical Research & Development LLC.; Lumosity; Lundbeck; Merck & Co., Inc.; Meso Scale Diagnostics, LLC.; NeuroRx Research; Neurotrack Technologies; Novartis Pharmaceuticals Corporation; Pfizer Inc.; Piramal Imaging; Servier; Takeda Pharmaceutical Company; and Transition Therapeutics. The Canadian Institutes of Health Research is providing funds to support ADNI clinical sites in Canada. Private sector contributions are facilitated by the Foundation for the National Institutes of Health (http://www.fnih.org). The grantee organization is the Northern California Institute for Research and Education, and the study is coordinated by the Alzheimer’s Therapeutic Research Institute at the University of Southern California. ADNI data are disseminated by the Laboratory for Neuro Imaging at the University of Southern California.
Authors’ disclosures available online (https://www.j-alz.com/manuscript-disclosures/18-0541r1).
REFERENCES
[1] | Raichle ME , MacLeod AM , Snyder AZ , Powers WJ , Gus-nard DA , Shulman GL ((2001) ) A default mode of brain function. Proc Natl Acad Sci USA 98: , 676–682. |
[2] | Sperling RA , Dickerson BC , Pihlajamaki M , Vannini P , LaViolette PS , Vitolo OV , Hedden T , Becker JA , Rentz DM , Selkoe DJ , Johnson KA ((2010) ) Functional alterations in memory networks in early Alzheimer’s disease. Neuromolecular Med 12: , 27–43. |
[3] | Greicius MD , Krasnow B , Reiss AL , Menon V ((2003) ) Functional connectivity in the resting brain: A network analysis of the default mode hypothesis. Proc Natl Acad Sci USA 100: , 253–258. |
[4] | Damoiseaux JS , Beckmann CF , Arigita EJS , Barkhof F , Scheltens P , Stam CJ , Smith SM , Rombouts SARB ((2008) ) Reduced resting-state brain activity in the "default network" in normal aging. Cereb Cortex 18: , 1856–1864. |
[5] | Xu X , Yuan H , Lei X ((2016) ) Activation and connectivity within the default mode network contribute independently to future-oriented thought. Sci Rep 6: , 1–10. |
[6] | Lei X , Wang Y , Yuan H , Mantini D ((2014) ) Neuronal oscillations and functional interactions between resting state networks: Effects of alcohol intoxication Neuronal oscillations and functional interactions between resting state networks. Hum Brain Mapp 35: , 3517–3528. |
[7] | Damoiseaux JS , Prater KE , Miller BL , Greicius MD ((2012) ) Functional connectivity tracks clinical deterioration in Alzheimer’s disease. Neurobiol Aging 33: , 828. e19–30. |
[8] | Agcaoglu O , Miller R , Mayer AR , Hugdahl K , Calhoun VD ((2015) ) Lateralization of resting state networks and relationship to age and gender. Neuroimage 104: , 310–325. |
[9] | Reuter-Lorenz PA , Jonides J , Smith EE , Hartley A , Miller A , Marshuetz C , Koeppe RA ((2000) ) Age differences in the frontal lateralization of verbal and spatial working memory revealed by PET. J Cogn Neurosci 12: , 174–187. |
[10] | Cabeza R , Grady CL , Nyberg L , Mcintosh AR , Tulving E , Kapur S , Jennings JM , Houle S , Craik FI ((1997) ) Age-related differences in neural activity during memory encoding and retrieval: A positron emission tomography study. J Neurosci 17: , 391–400. |
[11] | Baltes PB , Lindenberger U ((1997) ) Emergence of a powerful connection between sensory and cognitive functions across the adult life span: A new window to the study of cognitive aging? Psychol Aging 12: , 12–21. |
[12] | Lindenberger U , Baltes PB ((1997) ) Intellectual functioning in old and very old age: Cross-Sectional results from the Berlin Aging Study. Psychol Aging 12: , 410–432. |
[13] | Rentz DM , Amariglio RE , Becker JA , Frey M , Olson LE , Frishe K , Carmasin J , Maye JE , Johnson KA , Sperling RA ((2011) ) Face-name associative memory performance is related to amyloid burden in normal elderly. Neuropsychologia 49: , 2776–2783. |
[14] | Gili T , Cercignani M , Serra L , Perri R , Giove F , Maraviglia B , Caltagirone C , Bozzali M ((2011) ) Regional brain atrophy and functional disconnection across Alzheimer’s disease evolution. J Neurol Neurosurg Psychiatry 82: , 58–66. |
[15] | Jagust WJ , Mormino EC ((2011) ) Lifespan brain activity, beta-amyloid, and Alzheimer’s disease. Trends Cogn Sci 15: , 520–526. |
[16] | Hedden T , Van Dijk KRA , Becker JA , Mehta A , Sperling RA , Johnson KA , Buckner RL ((2009) ) Disruption of functional connectivity in clinically normal older adults harboring amyloid burden. J Neurosci 29: , 12686–94. |
[17] | Smith E , Jonides J , Koeppe R ((1996) ) Dissociating verbal and spatial working. Cereb Cortex 6: , 11–20. |
[18] | Pike KE , Savage G , Villemagne VL , Ng S , Moss SA , Maruff P , Mathis CA , Klunk WE , Masters CL , Rowe CC ((2007) ) ß-amyloid imaging and memory in non-demented individuals: Evidence for preclinical Alzheimer’s disease. Brain 130: , 2837–2844. |
[19] | Joshi AD , Pontecorvo MJ , Clark CM , Carpenter AP , Jennings DL , Sadowsky CH , Adler LP , Kovnat KD , Seibyl JP , Arora A , Saha K , Burns JD , Lowrey MJ , Mintun MA , Skovronsky DM ((2012) ) Performance characteristics of amyloid PET with florbetapir F 18 in patients with Alzheimer’s disease and cognitively normal subjects. JNucl Med 53: , 378–384. |
[20] | Doraiswamy PM , Sperling RA , Coleman RE , Johnson KA , Reiman EM , Davis MD , Grundman M , Sabbagh MN , Sad-owsky CH , Fleisher AS , Carpenter A , Clark CM , Joshi AD , Mintun MA , Skovronsky DM , Pontecorvo MJ ((2012) ) Amyloid-ß assessed by florbetapir F 18 PET and 18-month cognitive decline: A multicenter study. Neurology 79: , 1636–1644. |
[21] | Sevigny J , Suhy J , Chiao P , Chen T , Klein G , Purcell D , Oh J , Verma A , Sampat M , Barakos J ((2016) ) Amyloid PET screening for enrichment of early-stage Alzheimer disease clinical trials: Experience in a phase 1b clinical trial. Alzheimer Dis Assoc Disord 30: , 1–7. |
[22] | Rey A ((1964) ) L'examen clinique en psychologie. |
[23] | Chen JE , Chang C , Greicius MD , Glover GH ((2015) ) Introducing co-activation pattern metrics to quantify spontaneous brain network dynamics. Neuroimage 111: , 476–488. |
[24] | Fox MD , Zhang D , Snyder AZ , Raichle ME ((2009) ) The global signal and observed anticorrelated resting state brain networks. JNeurophysiol 101: , 3270–3283. |
[25] | Murphy K , Birn RM , Handwerker DA , Jones TB , Bandettini PA ((2009) ) The impact of global signal regression on resting state correlations: Are anti-correlated networks introduced? Neuroimage 44: , 893–905. |
[26] | Murphy K , Fox MD ((2017) ) Towards a consensus regarding global signal regression for resting state functional connectivity MRI. Neuroimage 154: , 169–173. |
[27] | Power JD , Mitra A , Laumann TO , Snyder AZ , Schlaggar BL , Petersen SE ((2014) ) Methods to detect, characterize, and remove motion artifact in resting state fMRI. Neuroimage 84: , 320–341. |
[28] | Power JD , Barnes KA , Snyder AZ , Schlaggar BL , Petersen SE ((2012) ) Spurious but systematic correlations in functional connectivity MRI networks arise from subject motion. Neuroimage 59: , 2142–2154. |
[29] | Power JD , Schlaggar BL , Petersen SE ((2015) ) Recent progress and outstanding issues in motion correction in resting state fMRI. Neuroimage 105: , 536–551. |
[30] | Kelly C , Biswal BB , Craddock RC , Castellanos FX , Mil-ham MP ((2012) ) Characterizing variation in the functional connectome: Promise and pitfalls. Trends Cogn Sci 16: , 181–188. |
[31] | Hyvarinen A , Hoyer PO , Inki M ((2001) ) Topographic independent component analysis. Neural Comput 13: , 1527–1558. |
[32] | Allen EA , Erhardt EB , Damaraju E , Gruner W , Segall JM , Silva RF , Havlicek M , Rachakonda S , Fries J , Kalyanam R , Michael AM , Caprihan A , Turner JA , Eichele T , Adelsheim S , Bryan AD , Bustillo J , Clark VP , Feldstein Ewing SW , Filbey F , Ford CC , Hutchison K , Jung RE , Kiehl KA , Kodi-tuwakku P , Komesu YM , Mayer AR , Pearlson GD , Phillips JP , Sadek JR , Stevens M , Teuscher U , Thoma RJ , Calhoun VD ((2011) ) A Baseline for the multivariate comparison of resting-state networks. Front Syst Neurosci 5: , 2. |
[33] | Smith SM , Fox PT , Miller KL , Glahn DC , Fox PM , Mackay CE , Filippini N , Watkins KE , Toro R , Laird AR , Beckmann CF ((2009) ) Correspondence of the brain’s functional architecture during activation and rest. Proc Natl Acad Sci USA 106: , 13040–13045. |
[34] | Beckmann CF , DeLuca M , Devlin JT , Smith SM ((2005) ) Investigations into resting-state connectivity using independent component analysis. Philos Trans R Soc Lond B Biol Sci 360: , 1001–1013. |
[35] | Beckmann CF ((2012) ) Modelling with independent components. Neuroimage 62: , 891–901. |
[36] | Vo A , Sako W , Fujita K , Peng S , Mattis PJ , Skidmore FM , Ma Y , Ulug AM , Eidelberg D ((2017) ) Parkinson’s disease-related network topographies characterized with resting state functional MRI. Hum Brain Mapp 38: , 617–630. |
[37] | Smith SM , Nichols TE ((2009) ) Threshold-free cluster enhancement: Addressing problems of smoothing, threshold dependence and localisation in cluster inference. Neuroimage 44: , 83–98. |
[38] | Winkler AM , Ridgway GR , Webster MA , Smith SM , Nichols TE ((2014) ) Permutation inference for the general linear model. Neuroimage 92: , 381–397. |
[39] | Winkler AM , Webster MA , Brooks JC , Tracey I , Smith SM , Nichols TE ((2016) ) Non-parametric combination and related permutation tests for neuroimaging. Hum Brain Mapp 37: , 1486–1511. |
[40] | Hayes A ((2013) ) Introduction to mediation, moderation, and conditional process analysis. Guilford, New York, pp. 3–4. |
[41] | Cabeza R ((2002) ) Hemispheric asymmetry reduction in older adults: The HAROLD model. Psychol Aging 17: , 85–100. |
[42] | Greicius MD , Kiviniemi V , Tervonen O , Vainionpaa V , Alahuhta S , Reiss AL , Menon V ((2008) ) Persistent default-mode network connectivity during light sedation. Hum Brain Mapp 29: , 839–847. |
[43] | Raichle ME ((2015) ) The brain’s default mode network Raichle ME. The brain’s default mode network. Annu Rev Neurosci 38: , 433–447. |
[44] | Royall DR , Palmer RF , Vidoni ED , Honea RA , Burns JM ((2012) ) The default mode network and related right hemisphere structures may be the key substrates of dementia. J Alzheimers Dis 32: , 467–478. |
[45] | Jack CR , Knopman DS , Jagust WJ , Petersen RC , Weiner MW , Aisen PS , Shaw LM , Vemuri P , Wiste HJ , Weigand SD , Lesnick TG , Pankratz VS , Donohue MC , Trojanowski JQ ((2013) ) Update on hypothetical model of Alzheimer’s disease biomarkers. Lancet Neurol 12: , 207–216. |
[46] | Benzinger TLS , Blazey T , Jack CR , Koeppe RA , Su Y , Xiong C , Raichle ME , Snyder AZ , Ances BM , Bateman RJ , Cairns NJ , Fagan AM , Goate A , Marcus DS , Aisen PS , Christensen JJ , Ercole L , Hornbeck RC , Farrar AM , Aldea P , Jasielec MS , Owen CJ , Xie X , Mayeux R , Brickman A , McDade E , Klunk W , Mathis CA , Ringman J , Thompson PM , Ghetti B , Saykin AJ , Sperling RA , Johnson KA , Sal-øloway S , Correia S , Schofield PR , Masters CL , Rowe C , Villemagne VL , Martins R , Ourselin S , Rossor MN , Fox NC , Cash DM , Weiner MW , Holtzman DM , Buckles VD , Moulder K , Morris JC ((2013) ) Regional variability of imaging biomarkers in autosomal dominant Alzheimer’s disease. Proc Natl Acad Sci USA 110: , E4502–9. |
[47] | Palmqvist S , Scholl M , Strandberg O , Mattsson N , Stomrud E , Zetterberg H , Blennow K , Landau S , Jagust W , Hans-son O ((2017) ) Earliest accumulation of ß-amyloid occurs within the default-mode network and concurrently affects brain connectivity. Nat Commun 8: , 1214. |
[48] | Jack CR , Knopman DS , Jagust WJ , Petersen RC , Weiner MW , Aisen PS , Shaw LM , Vemuri P , Wiste HJ , Weigand SD , Lesnick TG , Pankratz VS , Donohue MC , Tro-janowski JQ ((2013) ) Tracking pathophysiological processes in Alzheimer’s disease: An updated hypothetical model of dynamic biomarkers. Lancet Neurol 12: , 207–216. |
[49] | Buckner RL ((2005) ) Molecular, structural, and functional characterization of Alzheimer’s disease: Evidence for a relationship between default activity, amyloid, and memory. J Neurosci 25: , 7709–7717. |
[50] | Royall DR , Palmer RF , Chiodo LK , Polk MJ ((2014) ) Towards an aging-specific cognitive phenotype: The freedom house study. Exp Aging Res 40: , 245–265. |


