
Association between Peripheral Leptin and Adiponectin Levels and Cognitive Decline in Patients with Neurocognitive Disorders ≥65 Years
Abstract
Background:
There is evidence that adipokines have roles in brain functioning and cognitive decline.
Objective:
Assess the role of leptin and adiponectin levels in predicting changes in neuro-cognitive disorders (NCD).
Methods:
The study included 205 patients over 65 years of age presenting for a one-day hospitalization for current assessment of cognitive function. Peripheral blood leptin and adiponectin levels were measured at admission. Demographic variables, body mass index (BMI), and history of hypertension were also recorded. Cognitive function was assessed by the Mini-Mental State Examination (MMSE) at admission and at later scheduled visits over a median follow-up period of 14.5 months. Conventional univariate comparisons were made between diagnosis groups (Alzheimer’s disease (AD), mild NCD, vascular/mixed dementia). Changes in MMSE scores over time were examined with regard to the above variables using a linear mixed model.
Results:
The mean BMI was significantly lower (by 2 kg/m2, p = 0.01) in patients with AD than in patients with either mild-NCD or vascular/mixed dementia. Leptin levels were significantly higher (p = 0.043) and adiponectin levels significantly lower (p = 0.045) in patients with mild-NCD than in patients with major-NCD (AD or vascular/mixed dementia). However, the mixed model suggested no influence of the baseline levels of these two biomarkers on the course of cognitive decline.
Conclusion:
The present study confirms the associations between leptin and adiponectin and AD or AD-related disorders but did not confirm that these peptides may be used as predictive biomarkers of cognitive decline.
INTRODUCTION
The prevalence of Alzheimer’s disease (AD) and related disorders is increasing together with the increase in life expectancy [1]. At the same time, in developed countries, metabolic syndrome and obesity are reaching epidemic proportions and contribute to multiple comorbidities [2]. However, a recent epidemiological survey of patients from the Framingham cohort followed-up since the 1970 s has suggested that the incidence of dementia is decreasing. This finding was only partly explained by a better control of most cardiovascular risk factors, with the exception of obesity and diabetes whose prevalences continue to increase over time [3].
The association between body composition and the risk of dementia is complex and has raised many questions, especially with regards to obesity and the risk of cognitive decline. Central obesity and metabolic syndrome have been associated with changes in brain structure [4], cognitive deficits [5], and AD [6]. However, while higher adiposity in middle age seems to be associated with a higher risk of dementia [7], a recent epidemiological study did not find this association [8], which was also unclear in late-life obesity [9]. Moreover, late-life overweight and obesity could even be protective against the risk of dementia [10]. This is sometimes referred to as “the obesity paradox” [11].
Conversely, weight-loss and under-nutrition are clearly associated with an increased risk of AD and related disorders [12]. Individuals with AD have low body weight [13]. However, even though AD can be accompanied by disturbed eating behaviors, it appears that a reduction in bodyweight may be seen nearly two decades before the diagnosis of AD [14], or the expected onset of AD in patients with autosomal dominant mutations [15].
These findings have led researchers to explore the possible mechanisms by which body composition can have an influence on the brain, as well as the neurological effects of diverse cell-signaling peptides implicated in the regulation of appetite and food intake [16]. Within this context, numerous studies have focused on adipokines in search for possible biomarkers of AD and therapeutic targets. The endocrine function of white adipose tissue (WAT) might provide clues to understanding the mechanisms that link adipose tissue with many aging-related neurodegenerative and vascular diseases [17]. WAT secretes hundreds of cell-signaling molecules known as adipokines among which we may cite leptin, adiponectin, inflammation cytokines (IL-6, TNFα), and plasminogen activator-inhibitor 1 (PAI-1) [4].
Among these adipokines, leptin (a fat-derived hormone secreted by adipocytes that regulates appetite and energy intake via hypothalamic signaling) has been the most studied [18]. There is growing evidence that leptin could have a role in the development and evolution of dementia [19]. In animal models, leptin has been shown to promote synaptogenesis and neurogenesis in the hippocampus [20], reduce tau pathologies [21], and promote memory performance tasks in mice [22]. Several studies in humans have suggested a possible association between leptin, dementia, and cognitive decline [23], but their results are less consistent [24].
Adiponectin is a hormone derived from visceral fat that influences the metabolism of glucose and lipids and sensitizes the body to insulin [25]. It has anti-inflammatory and anti-atherogenic properties [26]. Unlike leptin, adiponectin secretion is inversely correlated with the body fat mass [17]. In vitro studies have shown a neuro-protective role for adiponectin [27]. However, adiponectin levels are inversely correlated with leptin [17]. Studies on the involvement of adiponectin in AD or its prodromal stages are only a few and had conflicting results [28], but there is evidence that adiponectin levels are higher in patients with AD than in healthy controls [29], especially in women.
Given the apparent complexity of energy intake regulation and its possible links with brain function and cognitive decline, it is important to better understand the way these elements interact with the brain and with each other. In this exploratory study carried out in current practice, we aimed to evaluate the predictive value of clinical and biological markers of body composition and nutritional status in establishing a final diagnosis of neuro-cognitive diseases and predicting the speed of cognitive decline, with a particular focus on leptin and adiponectin.
METHODS
Participants and setting
GERIOX cohort is an observational prospective monocentric study started in 2010 with the aim to evaluate the influence of oxidative stress and nutritional biomarkers on cognitive decline [30]. This study was conducted in current care at Lyon-Sud university hospital (France) between March 2010 and February 2016. After an initial screening medical consultation, 205 patients with either cognitive decline or complaint of memory loss were referred to a day clinic for assessment of cognitive function as part of the usual routine. On this day, leptin and adiponectin levels were measured in addition to the standard blood tests usually required for such assessment in accordance with national guidelines [31]. The patients were then followed-up by regular visits at the memory clinic at approximately six-month intervals. Patients over 65 years of age at initial consultation and with at least one follow-up administration of Folstein’s Mini-Mental State Examination (MMSE) [32] were considered and only patients with low French language proficiency were excluded.
Study design and data collection
This study was designed in two phases: 1) a final diagnosis study; 2) a longitudinal study of cognitive decline over all steps of follow-up.
The potential predictive factors considered in the two phases of the study were identical and limited to the factors accessible at initial clinical evaluation. These factors were: personal characteristics at admission (age, sex, weight, height, body mass index (BMI), history of hypertension, and leptin and adiponectin levels) and MMSE score at admission and at each further visit.
Blood sampling for leptin and adiponectin
The usual procedure consists in a peripheral venous puncture carried out between 8 and 9 AM after a 12-h overnight fast. Additional blood vials were collected for the purpose of measuring leptin and total adiponectin levels in serum. These measurements were by enzyme-linked immunosorbent assay (ELISA) using kits from BioVendor (Eurobio, Courtaboeuf, France) and R&D systems (Lille, France), respectively.
Study outcomes
For the final diagnosis study, each patient diagnosis was established by a panel of experts on the basis of all medical notes available at the last visit. The diagnosis made by the clinician in charge of each patient was retrieved from the medical files and analyzed retrospectively by a medical expert (TG or MHB) and a neuropsychologist (JYB). Divergent opinions were resolved by consensus.
The diagnosis of neuro-cognitive disorders (NCD) was based on the Diagnosis and Statistical Manual of Mental Disorders, fifth edition (DSM-V) [33]. Seven diagnosis groups were initially considered: “no NCD”, “mild NCD”, “Alzheimer disease”, “mixed dementia” (i.e., Alzheimer disease with vascular involvement), “vascular dementia”, Lewy bodies disease or Parkinson-disease-related dementia (“LBD or PD”), and “other or non-determined causes of NCD”. The diagnosis of mild NCD was made according to the DSM-V criteria, irrespective of a possible etiology of cognitive impairment, when the patient showed mild cognitive impairment (MCI) as assessed by cognitive tests but remained independent in everyday activities as assessed by Katz and Lawton scales. This was extracted from the medical reports by the panel of experts.
In the second phase, differences in cognitive status (cognitive decline) with respect to each potential predictive factor was determined by successive MMSEs taken at each step of follow-up. The analysis considered the MMSE scores obtained at first consultation and at each further visit (together with the dates).
Statistical analysis
The baseline subject characteristics (collected at first consultation) were summarized as mean, standard deviation, minimum, maximum, and quartiles (quantitative variables) or as frequencies and percentages (qualitative variables).
For the final diagnosis study, each potential predictive factor was described in terms of means or proportions of each considered outcome and each diagnosis group. In univariate analyses, a homogeneity Chi-squared test was used for qualitative variables and a non-parametric Kruskal-Wallis test for quantitative variables.
For the longitudinal study of cognitive function during follow-up, a linear mixed model was used. This allowed taking into account the within-patient correlation between MMSE scores and the variability of MMSE score changes over time (the model used a random intercept and a random slope). The explanatory factors were: time elapsed since baseline consultation (expressed in six-month period) and six potential predictive factors as assessed at baseline: sex, age, history of hypertension, BMI, leptin level, and adiponectin level.
The introduction in the model of interaction terms between the time elapsed since baseline consultation and each of the two biomarkers made it possible to study differences in MMSE slopes at various biomarker levels. To ease interpretation, the values of quantitative variables were subtracted from the closest round number to their mean and divided by a convenient constant. Thus, the study used (age –80) divided by 10, (BMI - 25) divided by 1, (leptin level –15) divided by 10, and (adiponectin level –15) divided by 5. All analyses were made with SAS software version 9.3. All statistical tests were bilateral and a 5% level of statistical significance was applied.
Ethics and funding source
All patients agreed to participate. This study was approved by the local ethics committee (CPP: Comité de Protection des Personnes) and declared to the CNIL (Commission Nationale Informatique et Libertés) to ensure protection and confidentiality of data. The reference number on http://www.clinicaltrials.gov is NCT02800395.
Biochemical assays were carried out with funds from Université Claude Bernard, Lyon 1. This study received no other funding.
RESULTS
The general characteristics of the study population are shown in Table 1. The data concerned 205 participants: 134 women (65.4%) and 71 men. The mean age was close to 81 years and 61.6% (125/203) had history of hypertension. During follow-up, the median number of MMSE was 3 (mean 3.31; range: 1 to 10, 29 patients had only 1 MMSE). The median follow-up period for the 176 patients who had two MMSEs was 14.5 months (range: 2 days to 5 years).
Table 1
Baseline characteristics, quantitative variables
| Variable | n | Mean | SD | Min | Max | 25th pctl | 50th pctl | 75th pctl |
| Age | 205 | 80.56 | 6.16 | 65.20 | 97.43 | 75.97 | 80.93 | 85.19 |
| BMI | 182 | 24.82 | 4.48 | 16.23 | 40.06 | 21.30 | 24.39 | 27.34 |
| MMSE | 203* | 22.36 | 4.67 | 10 | 30 | 19.57 | 23.08 | 26.00 |
| Leptin (ng/mL) | 197† | 16.53 | 18.02 | 1.00 | 136.87 | 5.02 | 11.47 | 19.86 |
| Adiponectin (μg/mL) | 202† | 15.63 | 8.99 | 1.17 | 48.49 | 8.70 | 14.75 | 19.10 |
*Two patients had no MMSE at baseline but several MMSEs during follow-up. †Only values above the detection threshold for biomarkers are presented here; eight and three patients had levels below the detection limit of the dosage technique for leptin (<1 ng/mL) and adiponectin (<1μg/mL), respectively.
The patients were divided into groups according to their final diagnosis: no NCD (11 cases), mild NCD (41 cases), AD (85 cases), mixed dementia (45 cases), vascular dementia (12 cases), LBD or PD (7 cases) and “other/non determined” (4 cases). Given the small sample sizes, “no NCD”, “LBD or PD”, and “other/non determined” groups were not considered in the analyses. In addition, groups “mixed dementia” and “vascular dementia” were merged into a “vascular/mixed dementia” group (57 cases). Thus, 183 patients were kept for analysis.
Relationships between final diagnosis and patient characteristics at baseline
The results of the final diagnosis study are shown in Table 2. Patient with mild NCD or vascular/mixed dementia were more likely to have had hypertension than patients with AD of whom only 49% have had hypertension (p = 0.0001). The mean BMI was lower (by 2 kg/m2) in patients with AD than in patients with either mild-NCD or vascular/mixed dementia (p = 0.01). There was no statistical difference between the groups regarding sex or age.
Table 2
Results of the univariate analysis of the influence of predictive factors on the final diagnosis
| Major NCD | |||||
| Characteristic | All cases | Mild NCD | Alzheimer’s disease | Vascular or mixed dementia | p-value* |
| Women, n (%) | 183 | 24 (58.6) | 60 (70.6) | 35 (61.4) | 0.33 |
| History of hypertension, n (%) | 182 | 31 (75.6) | 41 (48.8) | 46 (80.70) | 0.0001 |
| Age, mean (SD) | 183 | 80.16 (5.51) | 81.36 (6.47) | 80.75 (5.92) | 0.46 |
| BMI in kg/m2, mean (SD) | 162 | 25.76 (4.58) | 23.64 (3.83) | 25.80 (4.57) | 0.011 |
| Leptin in ng/mL, mean (SD) | 176 | 20.75 (18.51) | 16.24 (21.16) | 15.71 (14.43) | 0.043 |
| Adiponectin in μg/mL, mean (SD) | 181 | 13.22 (8.86) | 17.04 (9.24) | 15.25 (9.14) | 0.045 |
*The p-values correspond to the results of the Chi-square test for two qualitative variables (sex and hypertension) and the results of the Kruskal-Wallis test for quantitative variables.
Concerning the biomarkers, the mean leptin level was nearly the same in patients with AD and in those with vascular/mixed dementia (around 16 ng/mL) but was lower in patients in either of these two major NCDs than in patients with mild NCD (20.75 ng/mL) (p = 0.043). The mean adiponectin level was higher in patients with either AD or vascular/mixed dementia than in patients with mild NCD (p = 0.045). Furthermore, adiponectin levels were slightly higher in patients with AD than in patients with vascular/mixed dementia. Nevertheless, after adjustment on BMI, the differences in leptin levels between diagnostic groups were not significant (p = 0.43) and the differences in adiponectin levels were close to significance (p = 0.08).
Relationships between biomarker levels and cognitive decline over time
The results of the longitudinal study are shown in Table 3. The effect of age was found statistically significant (p < 0.0001) and its size effect was not negligible. On average, the MMSE score decreased by 0.52 points per six-month period (Table 3); i.e., a 1.04 point decrease over a year. Besides, ten-year ageing relative to the age at inclusion was associated with a 1.52 point score reduction. Thus, past three years, a subject aged 65 years at inclusion will lose 3.12 (3x1.04) points and a subject aged 85 years at inclusion will lose 6.16 points; that is, 3.04 points (2x1.52) due to baseline age and 3.12 additional points due to 3-year ageing.
Table 3
Impact of leptin and adiponectin on the progress of the MMSE
| Covariate | Regression Coeff [95% CI] | p value |
| Time since inclusion | –0.52 [–0.70 –0.34] | <0.0001 |
| Leptin level | 0.02 [–0.47 0.51] | 0.93 |
| Adiponectin level | –0.02 [–0.39 0.35] | 0.91 |
| Time since inclusion * leptin level | 0.04 [–0.06 0.14] | 0.45 |
| Time since inclusion * adiponectin level | –0.01 [–0.11 0.08] | 0.76 |
| Women (vs. men) | 0.11 [–1.63 1.86] | 0.90 |
| Age at baseline (per ten-year increment) | –1.52 [–2.50 –0.55] | 0.002 |
| Hypertension (versus no hypertension) | 0.11 [–1.35 1.57] | 0.88 |
| BMI at baseline (per one-unit increment) | 0.05 [–0.15 0.24] | 0.65 |
| MMSE score at baseline in men (versus women)† | 22.55 [20.83 24.27] | <0.0001 |
*Interaction. †MMSE at baseline is in men aged 80 years with BMI = 25, leptin = 15, adiponectin = 15 and no history of hypertension - Time since inclusion is considered per 6-month increments. Leptin is considered per 10-unit increments. Adiponectin is considered per 5-unit increments.
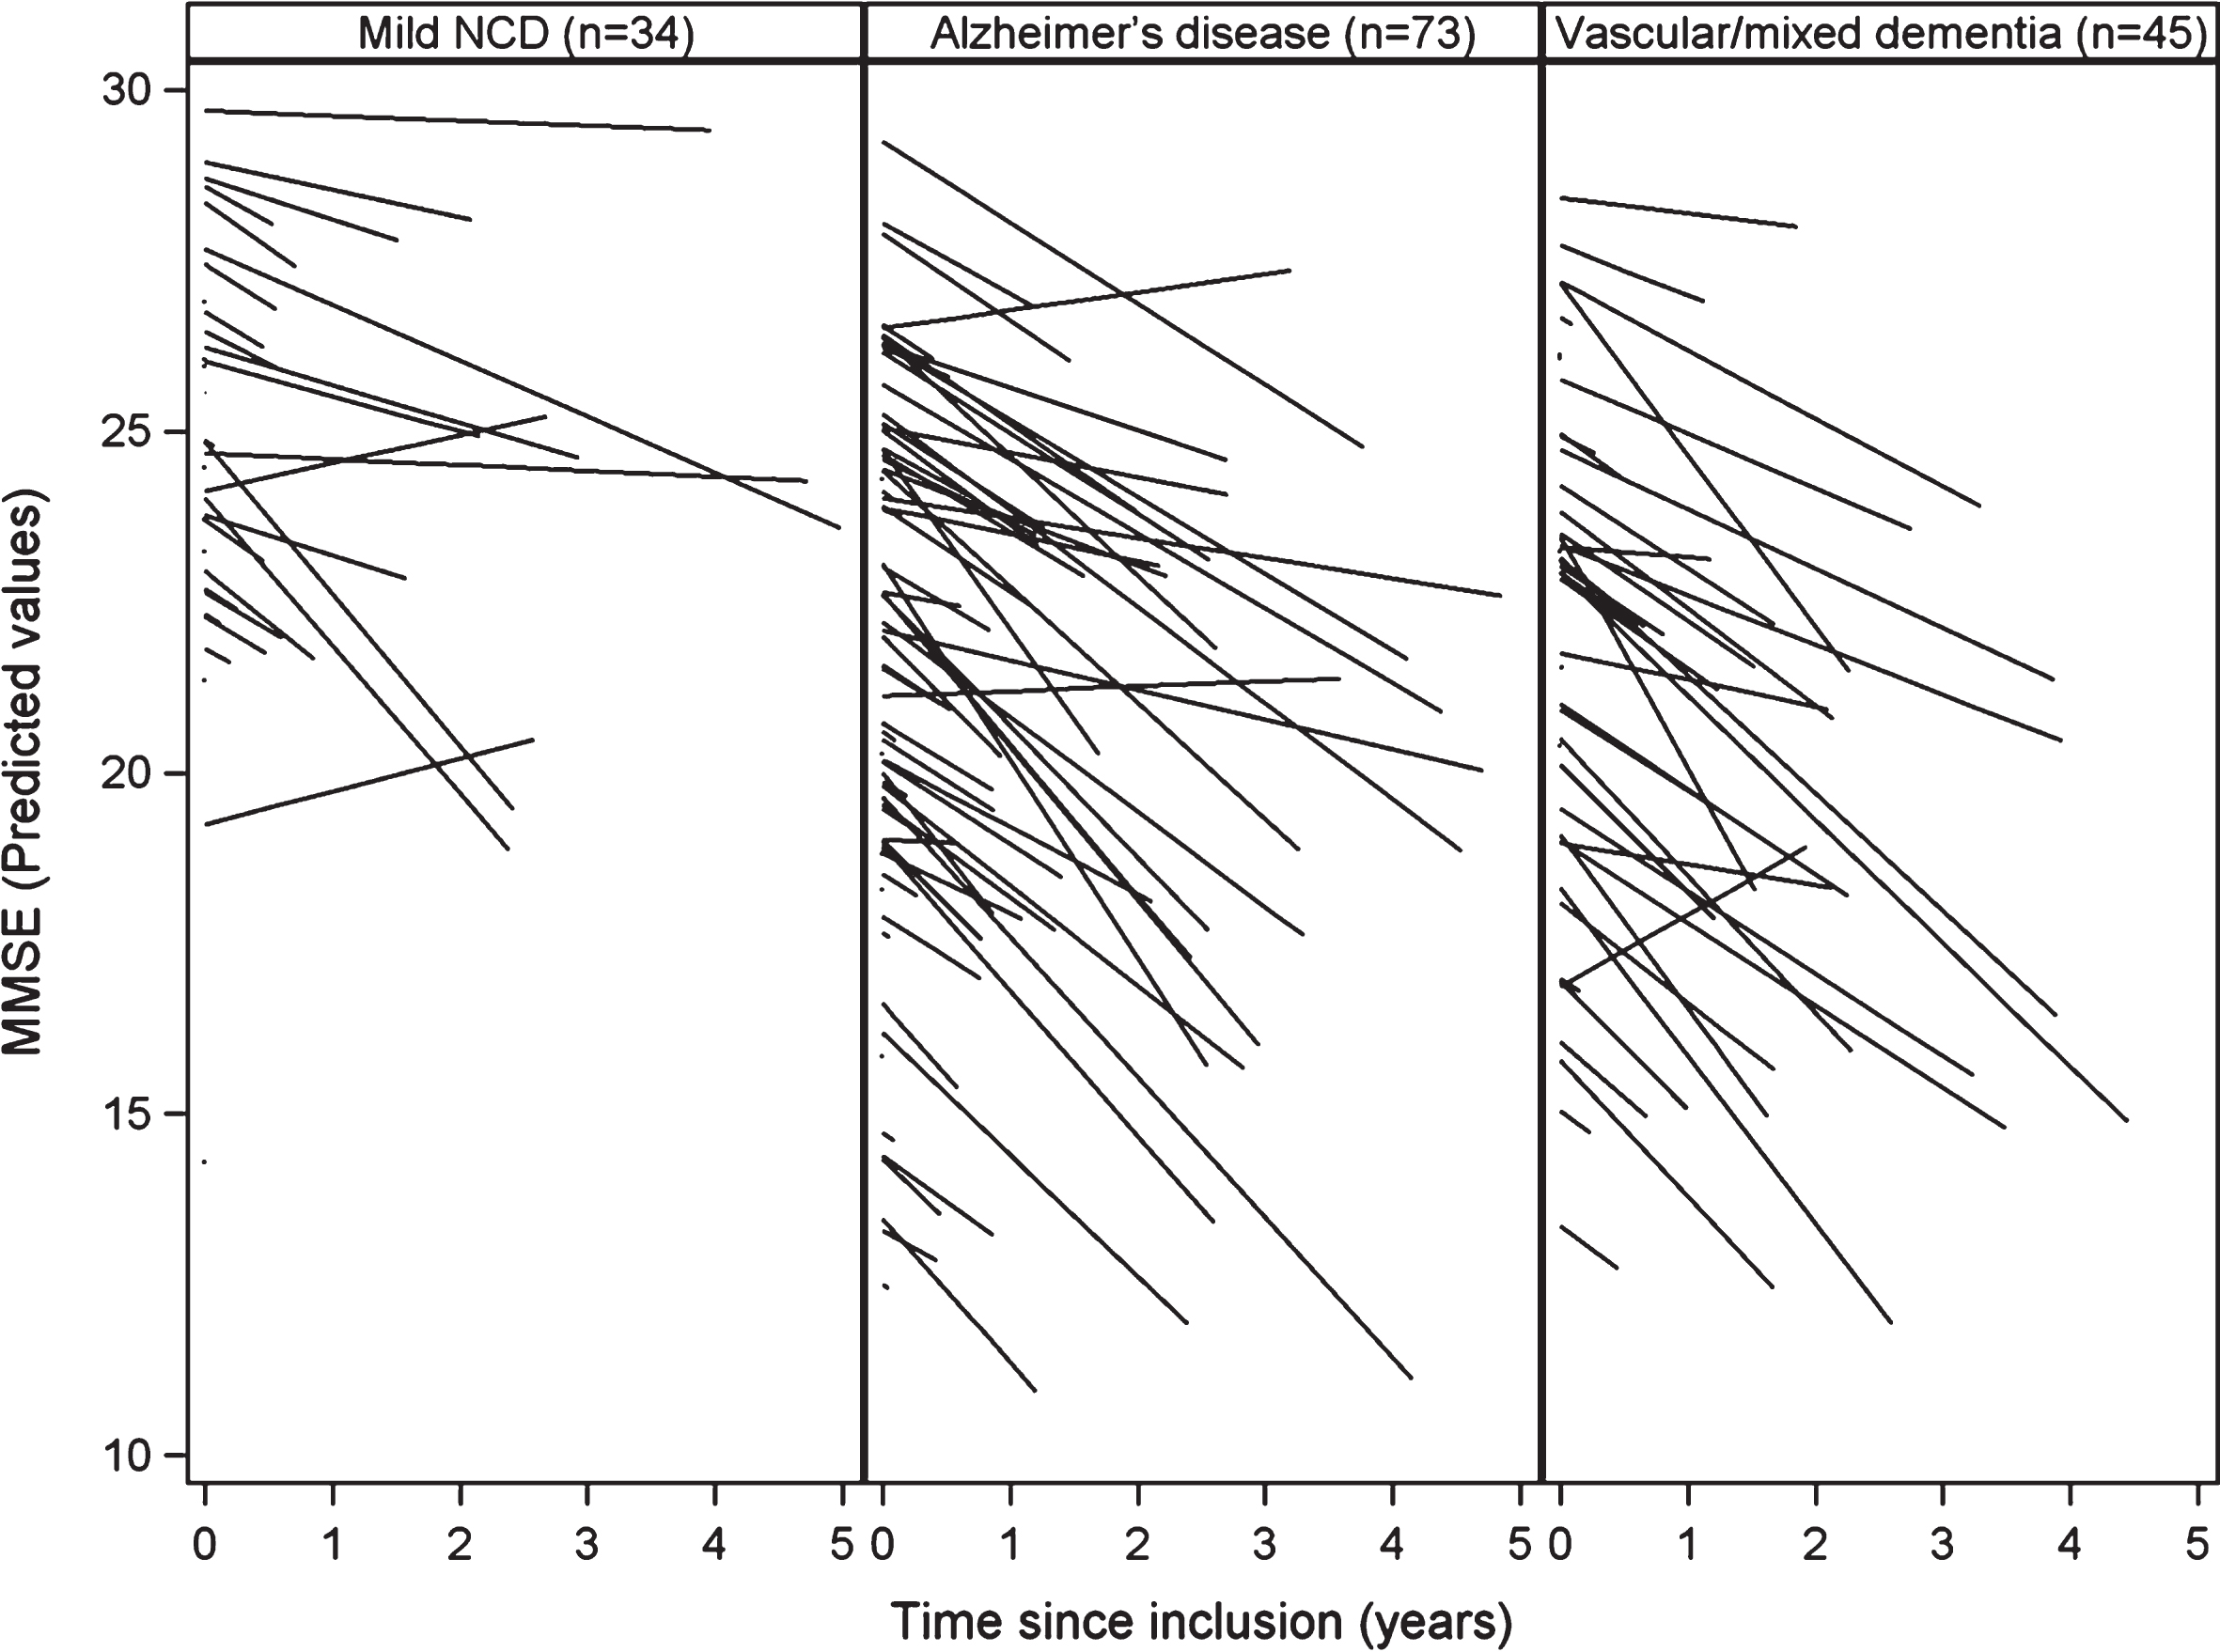
The levels of leptin and adiponectin at baseline had no effect on the MMSE score: leptin and adiponectin levels had no statistically significant impact on the decline of the MMSE score (resp., p = 0.45 and p = 0.76 in Table 3). However, the study of MMSE trajectories showed a wide variability between subjects regarding baseline MMSE score and MMSE score change over time. The plot of the predicted MMSE scores by patient according to the diagnosis at end of follow-up (based on the results of the mixed model) (Fig. 1) shows this strong variability. More precisely, the standard deviation (4.18) of the random intercept of the MMSE score at baseline was not negligible compared to the mean (22.55) MMSE score at baseline. In addition, the standard deviation (0.58) of the random slope of decrease of the MMSE was close to the mean slope of MMSE (–0.52). This implies that the coefficient of variation (0.58/–0.52) of the slope of the MMSE was close to –1.
Fig. 1.
Cognitive decline during follow-up by diagnosis group.
DISCUSSION
In this study, we aimed to evaluate the influence of clinical and biological indicators of body composition and nutritional status on the diagnosis and evolution of cognitive decline of older patients consulting or referred for cognitive decline. Considering an ultimate diagnosis made by medical and neuropsychological experts at the end of a follow-up period, we found higher leptin levels in patients with mild than with either of major NCDs and adiponectin lower either of major NCDs than in mild NCD. BMI was lower in the AD group than in mild-NCD and vascular/mixed dementia groups and there were no significant effects of baseline adipokine levels and BMI on MMSE scores during follow-up.
Body composition
The link between body composition and AD or related disorders has been widely studied in recent years. Individuals with AD tend to have low body-weights [13]. Furthermore, AD can be associated with changes in eating behaviors (usually anorexia) and weight loss can precede cognitive impairment [14]. Weight loss is primarily due to sarcopenia and not to loss of fat. Although BMI presents the advantage of being simple to assess, it may not be a valid surrogate for obesity in older patients so that other measures of body composition should be considered [34]. Using the waist-to-hip ratio as measure of central obesity, Luchsinger et al. found that obesity is associated with a 2.5 HR of developing AD, whereas, in the same cohort of aged individuals, BMI was not associated with AD [35]. Waist-to-hip ratio would have helped interpreting adipokine levels which depend strongly on body composition and the level of fat mass. Unfortunately, we could not consider this ratio in our study because it is rarely documented in current care.
Central obesity and metabolic syndrome have been associated with changes in brain structure, cognitive deficits, and AD [4]. People with high midlife BMI or central adiposity measures have a two-fold higher risk of dementia in later life [7]. However, recent epidemiological studies conducted in older patients have shown conflicting results [36] and suggested even a lower risk of dementia with late-life increased BMI [10]. Evidence is now accumulating that late-life overweight and obesity could even be protective against the risk of dementia [11].
In the present study, hypertension and BMI were the main cardiovascular risk factors examined. As expected, we found a strong association between hypertension and major-NCDs. This link was strong both in dementia with vascular involvement and AD, which corroborates the important influence of cardiovascular risk factors on the occurrence of AD [37]. Interestingly, we found that BMI at baseline was significantly lower (by 2 kg/m2) in patients with a final diagnosis of AD than in those with final diagnosis of vascular/mixed dementia or mild-NCD. This suggests that body composition influences the pathogenesis of AD with complex underlying mechanisms that are not just related to cardiovascular risk.
Insulin resistance and inflammation are important hallmarks of type 2 diabetes and may explain the association between diabetes and dementia [17]. Furthermore, the fact that obesity confers increased risk for AD during its preclinical stage suggests that obesity may modulate biological pathways early in the pathogenesis of AD [38]. Thus, adipokines and food-intake regulating hormones could help understanding the complex association between body composition and the pathogenesis of AD or related dementias. Various mechanisms have been put forward such as inflammatory cascades, insulin-resistance, hyper-insulinism or even the formation of amyloid plaques in the brain [16].
Leptin
Among various adipokines, the most studied is undoubtedly leptin. Leptin is mostly secreted by adipocytes and is able to cross the blood-brain barrier [19]. Leptin regulates body weight by modulating leptin-receptor-expressing neurons in the central nervous system, particularly within the hypothalamus and the brainstem [39]. However, leptin has pleiotropic metabolic effects. It regulates energy expenditure, feeding behavior, locomotor activity, bone mass, growth, thermogenesis, fertility, life span, adrenal function, and thyroid function (Reviewed in [38]). Leptin receptors are present in the hippocampus and the cerebral cortex [40]. In vitro, leptin promotes neurogenesis in the hippocampus and reduces amyloid-β accumulation and Tau phosphorylation [41]. It has been also shown that leptin is able to reverse neuro-cognitive deficits and structural abnormalities in humans with congenital leptin deficiency [42]. Furthermore, animal models suggest that high leptin levels are associated with better memory task performance [22].
Evidence from previous human studies suggests that leptin could play a protective role against dementia in patients with normal or high BMI but not in patients with low BMI in late life [19]. However, the type and distribution of fat mass are also important because high levels of leptin could be associated with better cognition only in subjects without central obesity [23].
Leptin levels have been reported to be lower in individuals with AD than in age-matched healthy individuals [43]. This finding is difficult to interpret because weight loss is a familiar symptom of AD. In a prospective study of 785 participants, Lieb and colleagues showed that high circulating levels of leptin were associated with low incidence of dementia (except in individuals with BMI > 30) and associated with high total brain volume in the subset of participants who underwent MRI [44].
In 2015, Oania and McEvoy studied baseline leptin levels in 352 American participants with MCI and found that leptin level was strongly correlated with BMI but not predictive of incident dementia over a 3-year follow-up period [24]. They concluded that leptin level, alone, might not be a robust identifier of patients at high risk of developing dementia and that associations of biomarkers might be needed [24]. Yet, a recently published replication study and meta-analysis supported the hypothesis that AD patients display lower levels of leptin and higher levels of adiponectin than controls [45].
In the present study, even though the number of patients with no-NCD was too low to allow comparisons with healthy controls, we were able to show that leptin levels were also significantly higher in mild-NCD patients than in AD or vascular/mixed dementia patients.
The results that support a role for leptin in predicting the evolution of cognitive decline are still conflicting. Littlejohns et al. have recently released convincing results of a cohort study conducted on 809 aged patients free from dementia [46]. They found that high leptin levels at baseline were related with low risk of global cognitive decline. The results remained consistent after adjustment for potential confounders, including demographic variables, vascular risk factors and mid-life BMI. Furthermore, the association was the strongest in overweight participants with BMI between 25 and 30 kg/m2 [46]. The present study was not able to confirm these findings because strong variations in patients’ cognitive decline may have concealed the difference between fast decliners and more stable patients.
Finally, leptin levels may vary with sex (higher levels are usually found in women [47]) or hour of the day (leptin is secreted in a pulsatile and circadian rhythm; the highest levels are found at midnight [19]). These variations may have strong impacts on all studies that use leptin as indicator and contribute to result discrepancies, even though most of them (including ours) have measured leptin at a regular time of day for each included patient (i.e., early morning, fasting). Nevertheless, the major determinant of circulating leptin level remains the mass of adipose tissue mass; typically, hyperleptinemia is associated with obesity and central leptin resistance [39]. In rodents, it was established that ageing results in increased leptin secretion and adiposity [48]. The maintenance of increased fat indicates that obesity and ageing are both states of leptin resistance [38]. Thus, leptin levels alone may be insufficient to assess this adipokine effects in patients.
Adiponectin
In a recent study, Bednarska and colleagues reported significantly increased levels of adiponectin in all-cause dementia patients versus controls [29]. Here, the levels of adiponectin were significantly lower in mild than in major-NCD patients; no comparison was possible with healthy controls. Other studies have not reported such results [49] or have reported conflicting results [50]; overall, the current literature is in favor of higher adiponectin levels in AD patients than in controls [45]. However, the role of adiponectin levels in predicting incident dementia or the speed of cognitive decline remains poor [17]; the present study could not address this issue satisfactorily.
Circulating concentrations of adiponectin are inversely correlated with insulin resistance, metabolic syndrome, obesity, type 2 diabetes, and cardiovascular diseases [51]. Adiponectin would be a visceral adiposity marker [52]. Its levels were only moderately correlated with BMI and blood-brain barrier mechanisms are still unclear [16]. High levels of adiponectin have been shown to reduce the risk of type 2 diabetes [25] and increase the risk of all-cause and cardiovascular mortality in those with heart failure and those free of CVD [53].
High-molecular-weight adiponectin is the main form of adiponectin but it is difficult to isolate [54]. This is why most studies have used total adiponectin assays. Kitagawa et al. have shown a weak association between high-molecular-weight adiponectin levels and later dementia [55]. Adiponectin receptors (AdipoR1 and R2) are widely found throughout the brain microvessels, hippocampus, hypothalamus, and brainstem [16]. However, high-molecular-weight adiponectin is not found in the cerebrospinal fluid [56]. This means that only the small molecular forms are able to cross the blood-brain barrier; this puts into question the relevance of peripheral adiponectin levels. Une et al. compared peripheral and cerebrospinal-fluid levels of total adiponectin in patients with MCI and AD and found that cerebrospinal-fluid adiponectin levels were higher in patients with MCI patients than in controls and that blood levels were higher in AD or MCI subjects than in controls [57].
Predicting the speed of cognitive decline
For clinicians, one of the most important issues is to make a reliable prognosis regarding the speed of cognitive decline, for which our current assessment remains imprecise [58]. Age at dementia onset and vascular factors have notably shown to influence the speed of cognitive decline [59]. In our study, even though the mean speed of decline was consistent with previous findings [60], we were unable to show differences between series of MMSE scores over time according to several predictive factors.
One main limitation of the present study is the very important variability between patients and slopes of cognitive decline. In the current care context, the patients admitted to the initial day-hospitalization assessment had strong heterogeneity at baseline with regards to cognitive status (MMSE ranging from 10 to 30). This made it difficult to observe specific trends in evolution of cognitive decline in any patient group.
Conclusion
This study shows that leptin and adiponectin have distinct levels in mild-NCD and major-NCD patients (respectively, lower and higher levels in major-NCDs). However, it does not support the hypothesis that these biomarkers could be predictors of progress of cognitive decline. The correlations between these two biomarkers and BMI are still not definitely established. Complementary data (e.g., on waist-to-hip ratio) and a better understanding of the regulation of body composition may help interpreting the role of adipokine levels within the context of neuro-cognitive disorders.
ACKNOWLEDGMENTS
The authors thank Drs. Anne Mialon, Murielle Lemoine, Ludivine Aujas, Lorine Cailler, Thomas Biel, Marie-Anne Bourquard, and Maël Roojee for their participation to this work. They also thank Jean Iwaz (Hospices Civils de Lyon) for the revision of the final draft of the manuscript.
Authors’ disclosures available online (https://www.j-alz.com/manuscript-disclosures/18-0533r2).
REFERENCES
[1] | Prince M , Bryce R , Albanese E , Wimo A , Ribeiro W , Ferri CP ((2013) ) The global prevalence of dementia: a systematic review and metaanalysis. Alzheimers Dement 9: , 63–75.e2. |
[2] | Stevens GA , Singh GM , Lu Y , Danaei G , Lin JK , Finucane MM , Bahalim AN , McIntire RK , Gutierrez HR , Cowan M , Paciorek CJ , Farzadfar F , Riley L , Ezzati M , Global Burden of Metabolic Risk Factors of Chronic Diseases Collaborating Group (Body Mass Index) (2012) National, regional, and global trends in adult overweight and obesity prevalences. Popul Health Metr 10: , 22. |
[3] | Satizabal CL , Beiser AS , Chouraki V , Chene G , Dufouil C , Seshadri S ((2016) ) Incidence of dementia over three decades in the Framingham Heart Study. N Engl J Med 374: , 523–532. |
[4] | Arnoldussen IAC , Kiliaan AJ , Gustafson DR ((2014) ) Obesity and dementia: Adipokines interact with the brain. Eur Neuropsychopharmacol 24: , 1982–1999. |
[5] | Businaro R , Ippoliti F , Ricci S , Canitano N , Fuso A ((2012) ) Alzheimer’s disease promotion by obesity: induced mechanisms-molecular links and perspectives. Curr Gerontol GeriatrRes 2012: , 986823. |
[6] | Letra L , Santana I , Seica R ((2014) ) Obesity as a risk factor for Alzheimer’s disease: the role of adipocytokines. Metab Brain Dis 29: , 563–568. |
[7] | Anstey KJ , Cherbuin N , Budge M , Young J ((2011) ) Body mass index in midlife and late-life as a risk factor for dementia: a meta-analysis of prospective studies. Obes Rev 12: , e426–437. |
[8] | Qizilbash N , Gregson J , Pocock S ((2015) ) Does midlife obesity really lower dementia risk? - Authors’ reply. Lancet Diabetes Endocrinol 3: , 501–502. |
[9] | Dahl AK , Lopponen M , Isoaho R , Berg S , Kivela SL ((2008) ) Overweight and obesity in old age are not associated with greater dementia risk. J Am Geriatr Soc 56: , 2261–2266. |
[10] | Fitzpatrick AL , Kuller LH , Lopez OL , Diehr P , O'Meara ES , Longstreth WT , Luchsinger JA ((2009) ) Midlife and late-life obesity and the risk of dementia: cardiovascular health study. Arch Neurol 66: , 336–342. |
[11] | Emmerzaal TL , Kiliaan AJ , Gustafson DR ((2015) ) 20032013: a decade of body mass index, Alzheimer’s disease, and dementia. J Alzheimers Dis 43: , 739–755. |
[12] | Sergi G , De Rui M , Coin A , Inelmen EM , Manzato E ((2013) ) Weight loss and Alzheimer’s disease: temporal and aetio-logic connections. Proc Nutr Soc 72: , 160–165. |
[13] | Gillette Guyonnet S , Abellan Van Kan G , Alix E , Andrieu S , Belmin J , Berrut G , Bonnefoy M , Brocker P , Constans T , Ferry M , Ghisolfi-Marque A , Girard L , Gonthier R , Guerin O , Hervy M-P , Jouanny P , Laurain M-C , Lechowski L , Nourhashemi F , Raynaud-Simon A , Ritz P , Roche J , Rolland Y , Salva T , Vellas B , International Academy on Nutrition and Aging Expert Group (2007) IANA (International Academy on Nutrition and Aging) Expert Group: weight loss and Alzheimer’s disease. J Nutr Health Aging 11: , 38–48. |
[14] | Barrett-Connor E , Edelstein S , Corey-Bloom J , Wiederholt W ((1998) ) Weight loss precedes dementia in community-dwelling older adults. J Nutr Health Aging 2: , 113–114. |
[15] | Müller S , Preische O , Sohrabi HR , Graber S , Jucker M , Diet-zsch J , Ringman JM , Martins RN , McDade E , Schofield PR , Ghetti B , Rossor M , Graff-Radford NR , Levin J , Galasko D , Quaid KA , Salloway S , Xiong C , Benzinger T , Buckles V , Masters CL , Sperling R , Bateman RJ , Morris JC , Laske C ((2017) ) Decreased body mass index in the preclinical stage of autosomal dominant Alzheimer’s disease. Sci Rep 7: , 1225. |
[16] | Kiliaan AJ , Arnoldussen IAC , Gustafson DR ((2014) ) Adipokines: a link between obesity and dementia? Lancet Neurol 13: , 913–923. |
[17] | Van Himbergen TM , Beiser AS , Ai M , Seshadri S , Otokozawa S , Au R , Thongtang N , Wolf PA , Schaefer EJ ((2012) ) Biomarkers for insulin resistance and inflammation and the risk for all-cause dementia and Alzheimer disease: results from the Framingham Heart Study. Arch Neurol 69: , 594–600. |
[18] | Beccano-Kelly D , Harvey J ((2012) ) Leptin: a novel therapeutic target in Alzheimer’s disease? Int J Alzheimers Dis 2012: , 594137. |
[19] | McGuire MJ , Ishii M ((2016) ) Leptin dysfunction and Alzheimer’s disease: evidence from cellular, animal, and human studies. Cell Mol Neurobiol 36: , 203–217. |
[20] | Doherty GH ((2011) ) Obesity and the ageing brain: could leptin play a role in neurodegeneration? Curr Gerontol Geriatr Res 2011: , 708154. |
[21] | Greco SJ , Sarkar S , Johnston JM , Zhu X , Su B , Casadesus G , Ashford JW , Smith MA , Tezapsidis N ((2008) ) Leptin reduces Alzheimer’s disease-related tau phosphorylation in neuronal cells. Biochem Biophys Res Commun 376: , 536–541. |
[22] | Perez-Gonzalez R , Antequera D , Vargas T , Spuch C , Bolos M , Carro E ((2011) ) Leptin induces proliferation of neuronal progenitors and neuroprotection in a mouse model of Alzheimer’s disease. J Alzheimers Dis 24 Suppl 2: , 17–25. |
[23] | Zeki Al Hazzouri A , Stone KL , Haan MN , Yaffe K ((2013) ) Leptin, mild cognitive impairment, and dementia among elderly women. J Gerontol A Biol Sci Med Sci 68: , 175–180. |
[24] | Oania R , McEvoy LK ((2015) ) Plasma leptin levels are not predictive of dementia in patients with mild cognitive impairment. Age Ageing 44: , 53–58. |
[25] | Li S , Shin HJ , Ding EL , van Dam RM ((2009) ) Adiponectin levels and risk of type 2 diabetes: a systematic review and meta-analysis. JAMA 302: , 179–188. |
[26] | Gustafson DR ((2010) ) Adiposity hormones and dementia. J Neurol Sci 299: , 30–34. |
[27] | Qiu G , Wan R , Hu J , Mattson MP , Spangler E , Liu S , Yau S-Y , Lee TMC , Gleichmann M , Ingram DK , So K-F , Zou S ((2011) ) Adiponectin protects rat hippocampal neurons against excitotoxicity. Age (Dordr) 33: , 155–165. |
[28] | Warren MW , Hynan LS , Weiner MF ((2012) ) Lipids and adipokines as risk factors for Alzheimer’s disease. J Alzheimers Dis 29: , 151–157. |
[29] | Bednarska-Makaruk M , Graban A , Wisniewska A , Lojkowska W , Bochyiiska A , Gugala-Iwaniuk M , Slawrnska K , Lugowska A , Ryglewicz D , Wehr H ((2017) ) Association of adiponectin, leptin and resistin with inflammatory markers and obesity in dementia. Biogerontology 18: , 561–580. |
[30] | Revel F , Gilbert T , Roche S , Drai J , Blond E , Ecochard R , Bonnefoy M ((2015) ) Influence of oxidative stress biomarkers on cognitive decline. J Alzheimers Dis 45: , 553–560. |
[31] | HAS: Haute Autorite de Sante (2011) Maladie d'Alzheimer et maladies apparentees: diagnostic et prise en charge. [Internet] Accessible from: http://www.has-sante.fr/portail/jcms/c_1148883/fr/maladie-d-alzheimer-et-maladies-apparentees-diagnostic-et-prise-en-charge. |
[32] | Folstein MF , Folstein SE , McHugh PR ((1975) ) “Mini-mental state”: a practical method for grading the cognitive state of patients for the clinician. J Psychiatr Res 12: , 189–198. |
[33] | Simpson JR ((2014) ) DSM-5 and neurocognitive disorders. J Am Acad Psychiatry Law 42: , 159–164. |
[34] | Burns JM , Johnson DK , Watts A , Swerdlow RH , Brooks WM ((2010) ) Reduced lean mass in early Alzheimer disease and its association with brain atrophy. Arch Neurol 67: , 428–433. |
[35] | Luchsinger JA , Cheng D , Tang MX , Schupf N , Mayeux R ((2012) ) Central obesity in the elderly is related to late-onset Alzheimer disease. Alzheimer Dis Assoc Disord 26: , 101–105. |
[36] | Qizilbash N , Gregson J , Johnson ME , Pearce N , Douglas I , Wing K , Evans SJW , Pocock SJ ((2015) ) BMI and risk of dementia in two million people over two decades: a retrospective cohort study. Lancet Diabetes Endocrinol 3: , 431–436. |
[37] | Besser LM , Alosco ML , Ramirez Gomez L , Zhou X-H , McKee AC , Stern RA , Gunstad J , Schneider JA , Chui H , Kukull WA ((2016) ) Late-life vascular risk factors and Alzheimer disease neuropathology in individuals with normal cognition. J Neuropathol Exp Neurol 75: , 955–962. |
[38] | Lee EB ((2011) ) Obesity, leptin, and Alzheimer’s disease. Ann N Y Acad Sci 1243: , 15–29. |
[39] | Myers MG , Cowley MA , Munzberg H ((2008) ) Mechanisms of leptin action and leptin resistance. Annu Rev Physiol 70: , 537–556. |
[40] | Garza JC , Guo M , Zhang W , Lu X-Y ((2008) ) Leptin increases adult hippocampal neurogenesis in vivo and in vitro. J Biol Chem 283: , 18238–18247. |
[41] | Marwarha G , Dasari B , Prasanthi JRP , Schommer J , Ghribi O ((2010) ) Leptin reduces the accumulation of Abeta and phosphorylated tau induced by 27-hydroxycholesterol in rabbit organotypic slices. J Alzheimers Dis 19: ,1007–1019. |
[42] | Matochik JA , London ED , Yildiz BO , Ozata M , Caglayan S , DePaoli AM , Wong M-L , Licinio J ((2005) ) Effect of leptin replacement on brain structure in genetically leptin-deficient adults. J Clin Endocrinol Metab 90: , 2851–2854. |
[43] | Khemka VK , Bagchi D , Bandyopadhyay K , Bir A , Chat-topadhyay M , Biswas A , Basu D , Chakrabarti S ((2014) ) Altered serum levels of adipokines and insulin in probable Alzheimer’s disease. J Alzheimers Dis 41: , 525–533. |
[44] | Lieb W , Beiser AS , Vasan RS , Tan ZS , Au R , Harris TB , Roubenoff R , Auerbach S , DeCarli C , Wolf PA , Seshadri S ((2009) ) Association of plasma leptin levels with incident Alzheimer disease and MRI measures of brain aging. JAMA 302: , 2565–2572. |
[45] | Ma J , Zhang W , Wang H-F , Wang Z-X , Jiang T , Tan M-S , Yu J-T , Tan L ((2016) ) Peripheral blood adipokines and insulin levels in patients with Alzheimer’s disease: a replication study and meta-analysis. Curr Alzheimer Res 13: , 223–233. |
[46] | Littlejohns TJ , Kos K , Henley WE , Cherubini A , Ferrucci L , Lang IA , Langa KM , Melzer D , Llewellyn DJ ((2015) ) Serum leptin and risk of cognitive decline in elderly italians. J Alzheimers Dis 44: , 1231–1239. |
[47] | Johnston JM , Hu WT , Fardo DW , Greco SJ , Perry G , Montine TJ , Trojanowski JQ , Shaw LM , Ashford JW , Tezapsidis N , Alzheimer’s Disease Neuroimaging Initiative (2014) Low plasma leptin in cognitively impaired ADNI subjects: gender differences and diagnostic and therapeutic potential. Curr Alzheimer Res 11: , 165–174. |
[48] | Ahren B , Mansson S , Gingerich RL , Havel PJ ((1997) ) Regulation of plasma leptin in mice: influence of age, high-fat diet, and fasting. Am J Physiol 273: , R113–120. |
[49] | Kamogawa K , Kohara K , Tabara Y , Uetani E , Nagai T , Yamamoto M , Igase M , Miki T ((2010) ) Abdominal fat, adipose-derived hormones and mild cognitive impairment: the J-SHIPP study. Dement Geriatr Cogn Disord 30: , 432–439. |
[50] | Teixeira AL , Diniz BS , Campos AC , Miranda AS , Rocha NP , Talib LL , Gattaz WF , Forlenza OV ((2013) ) Decreased levels of circulating adiponectin in mild cognitive impairment and Alzheimer’s disease. Neuromolecular Med 15: , 115–121. |
[51] | Chandran M , Phillips SA , Ciaraldi T , Henry RR ((2003) ) Adiponectin: more than just another fat cell hormone? Diabetes Care 26: , 2442–2450. |
[52] | Ryan AS , Berman DM , Nicklas BJ , Sinha M , Gingerich RL , Meneilly GS , Egan JM , Elahi D ((2003) ) Plasma adiponectin and leptin levels, body composition, and glucose utilization in adult women with wide ranges of age and obesity. Diabetes Care 26: , 2383–2388. |
[53] | Wannamethee SG , Whincup PH , Lennon L , Sattar N ((2007) ) Circulating adiponectin levels and mortality in elderly men with and without cardiovascular disease and heart failure. Arch Intern Med 167: , 1510–1517. |
[54] | Sinha MK , Songer T , Xiao Q , Sloan JH , Wang J , Ji S , Alborn WE , Davis RA , Swarbrick MM , Stanhope KL , Wolfe BM , Havel PJ , Schraw T , Konrad RJ , Scherer PE , Mistry JS ((2007) ) Analytical validation and biological evaluation of a high molecular-weight adiponectin ELISA. Clin Chem 53: , 2144–2151. |
[55] | Kitagawa K , Miwa K , Okazaki S , Sakaguchi M , Mochizuki H ((2016) ) Serum high-molecular-weight adiponectin level and incident dementia in patients with vascular risk factors. Eur J Neurol 23: , 641–647. |
[56] | Kusminski CM , McTernan PG , Schraw T , Kos K , O'Hare JP , Ahima R , Kumar S , Scherer PE ((2007) ) Adiponectin complexes in human cerebrospinal fluid: distinct complex distribution from serum. Diabetologia 50: , 634–642. |
[57] | Une K , Takei YA , Tomita N , Asamura T , Ohrui T , Furukawa K , Arai H ((2011) ) Adiponectin in plasma and cerebrospinal fluid in MCI and Alzheimer’s disease. Eur J Neurol 18: , 1006–1009. |
[58] | Canevelli M , Kelaiditi E , Del Campo N , Bruno G , Vellas B , Cesari M , ICTUSDSA group ((2016) ) Predicting the rate of cognitive decline in Alzheimer disease: data from the ICTUS Study. Alzheimer Dis Assoc Disord 30: , 237–242. |
[59] | Musicco M , Palmer K , Salamone G , Lupo F , Perri R , Mosti S , Spalletta G , di Iulio F , Pettenati C , Cravello L , Caltagirone C ((2009) ) Predictors of progression of cognitive decline in Alzheimer’s disease: the role of vascular and sociodemographic factors. J Neurol 256: , 1288–1295. |
[60] | Carcaillon L , Berrut G , Sellal F , Dartigues JF , Gillette S , Pere JJ , Bourdeix I ((2011) ) Diagnosis of Alzheimer’s disease patients with rapid cognitive decline in clinical practice: interest of the Deco questionnaire. J Nutr Health Aging 15: , 361–366. |


