
Change of Amyloid-β 1-42 Toxic Conformer Ratio After Cerebrospinal Fluid Diversion Predicts Long-Term Cognitive Outcome in Patients with Idiopathic Normal Pressure Hydrocephalus
Abstract
Background:
Alzheimer’s disease (AD) pathology in idiopathic normal pressure hydrocephalus (iNPH) contributes to poor shunt responses. Amyloid-β 1– 42 (Aβ42) toxic conformer was recently identified with features of rapid oligomerization, strong neurotoxicity and synaptotoxicity.
Objective:
This observational study points to Aβ42 toxic conformer as a biomarker for AD pathology and for poor postoperative prognosis in patients with iNPH.
Methods:
The first cohort consisted of patients with AD (n = 17) and iNPH (n = 17), and cognitively normal individuals (CN, n = 12). The second cohort, consisted of 51 patients with iNPH, was divided into two groups according to phosphorylated Tau (pTau) level (low- and high-pTau groups); the low-pTau group was further subdivided according to one-year postoperative change in Aβ42 toxic conformer ratio (%) [Aβ42 toxic conformer/Aβ42×100] (decreased- and increased-conformer subgroups). Enzyme-linked immunosorbent assay was used to measure pTau, Aβ42, and Aβ42 toxic conformer in cerebrospinal fluid. Outcomes were evaluated using neuropsychological tests one- and two-years postoperatively.
Results:
In the first cohort, Aβ42 toxic conformer ratio in the iNPH group (10.8%) was significantly higher than that in the CN group (6.3%) and significantly lower than that in the AD group (17.2%). In the second cohort, the high-pTau group showed cognitive decline two-years postoperatively compared to baseline. However, the low-pTau group showed favorable outcomes one-year postoperatively; furthermore, the increased-conformer subgroup showed cognitive decline two-years postoperatively while the decreased-conformer subgroup maintained the improvement.
Conclusions:
Change in Aβ42 toxic conformer ratio predicts long-term cognitive outcome in iNPH, even in the low-pTau group.
INTRODUCTION
Idiopathic normal pressure hydrocephalus (iNPH) is a neurodegenerative disease characterized by gait disturbance, dementia, and urinary incontinence [1]. Selected patients benefit from cerebrospinal fluid (CSF) shunting [2, 3]. Several studies have revealed the coexistence of an Alzheimer’s disease (AD) pathology in patients with iNPH [4–6], suggesting that AD leads to poor shunt responses [4, 7]. It is well established that Aβ42 CSF concentrations are reduced in patients with iNPH, as seen in AD, while pTau levels in patients with iNPH are within the range of normal controls or even lower [8–10]. The similar value of Aβ42 in AD and iNPH often presents a dilemma for clinicians in the differential diagnosis of these two diseases and in detection of AD pathology coexistence in iNPH [6, 10, 11]. This is especially true in the early phase of AD pathology during which pTau levels remain in low [12]. A reliable prognostic biomarker for long-term cognitive outcomes in iNPH is variable; however, it has not yet been fully identified [13]. Thus, the aim of the current study was to identify a novel, predictive biomarker of long-term postoperative outcome in patients with iNPH by assessing the coexistence of early AD pathology.
Accumulating evidence suggests that Aβ oligomerization contributes to neurotoxicity, synaptic loss, and behavioral disorders [14, 15], in addition, accumulation of Aβ oligomers is one of the earliest phenomena during the progression of AD pathology [16]. Thus, Aβ oligomers are followed with interest as a new potential therapeutic target of early stage AD. Notably, Aβ42 shows strong neurotoxicity and the ability to oligomerize [17]. Aβ42 oligomers are held in equilibrium between the toxic- and non-toxic conformers, acting at different intermolecular sites and different oligomerization tendencies [18]. Aβ42 toxic conformer has a turn structure at positions 22-23 [19] and induces quick β-sheet formation [18, 19], potent neurotoxicity [20, 21], and strong synaptotoxicity [22]. Aβ42 toxic conformer analysis in human CSF will hopefully aid its development as a novel therapeutic target of AD [23].
In the present study, we evaluated Aβ42 toxic conformer as a novel diagnostic and prognostic biomarker of iNPH.
MATERIALS AND METHODS
Patients
The present study comprised two cohorts. The first cohort included patients with AD (n = 17), iNPH (n = 17), and cognitively normal individuals (CN, n = 12), from whom pTau, Aβ42, and Aβ42 toxic conformer in CSF were obtained. The three groups were age adjusted. Patients with AD had been diagnosed at the Department of Neurology, Juntendo University in Tokyo, Japan, between October 2008 and December 2014, according to the criteria of the National Institute of Neurological Disease and Communicative Disorders and the Stroke/Alzheimer’s Disease and Related Disorders Association (NINCDS/ADRDA); patients with iNPH had received a definite iNPH diagnoses established at the Department of Neurosurgery, Juntendo University in Tokyo, Japan, between May 2013 and November 2015, based on an existing guideline [24]; the CN group comprised elderly individuals without dementia/any known brain disease and with no subjective cognitive, with a Mini-Mental State Examination (MMSE) score [25] of >25, who consented to a lumbar puncture at Juntendo University Hospital in Tokyo, Japan, between April 2009 and July 2012 (Table 1).
Table 1
Characteristics of patients with AD, definite iNPH, and cognitively normal controls
| AD (n = 17) | iNPH (n = 17) | CN (n = 12) | P-valuep1 = AD versus iNPH,p2 = iNPH versus CN,p3 = AD versus CN | |
| Age: mean ± SD | 75.9 ± 7.8 | 74.6 ± 6.3 | 74.9 ± 5.8 | p1 = 1.000, p2 = 1.000, p3 = 1.000 |
| Sex: Male (number(%)) | 6 (35%) | 14 (82%) | 6 (50%) | **p1 = 0.005, p2 = 0.064, p3 = 0.428 |
| MMSE score Median [min-max] | 22 [9–28] | 22 [10–30] | 29 [25–30] | p1 = 1.000, **p2 = 0.001, **p3 = 0.002 |
| Biomarkers (mean ± SD) | ||||
| pTau (pg/ml) | 103.5 ± 34.7 | 20.7 ± 8.0 | 21.3 ± 6.6 | ***p1 < 0.001, p2 = 0.992, ***p3 < 0.001 |
| Aβ42 (pg/ml) | 378.7 ± 151.1 | 422.4 ± 148.6 | 627.7 ± 212.3 | p1 = 0.779, *p2 = 0.029, **p3 = 0.008 |
| Aβ42 toxic conformer (pg/ml) | 60.1 ± 19.2 | 41.6 ± 11.5 | 36.3 ± 7.8 | **p1 = 0.006, p2 = 0.388, ***p3 < 0.001 |
| Aβ42 toxic conformer ratio (%) | 17.2 ± 6.0 | 10.8 ± 3.2 | 6.3 ± 2.5 | **p1 = 0.002, **p2 = 0.001, ***p3 < 0.001 |
Results are shown as the median [minimum and maximum], or as the mean ± SD. Pearson’s chi-squared test for sex and Dunnett’s test for all other domains were conducted, followed by one-way analysis of variance. *p < 0.05, **p < 0.01, and ***p < 0.001 were considered to be statistically significant. AD: Alzheimer’s disease; iNPH: idiopathic normal pressure hydrocephalus; CN: cognitively normal; MMSE: Mini-Mental State Examination.
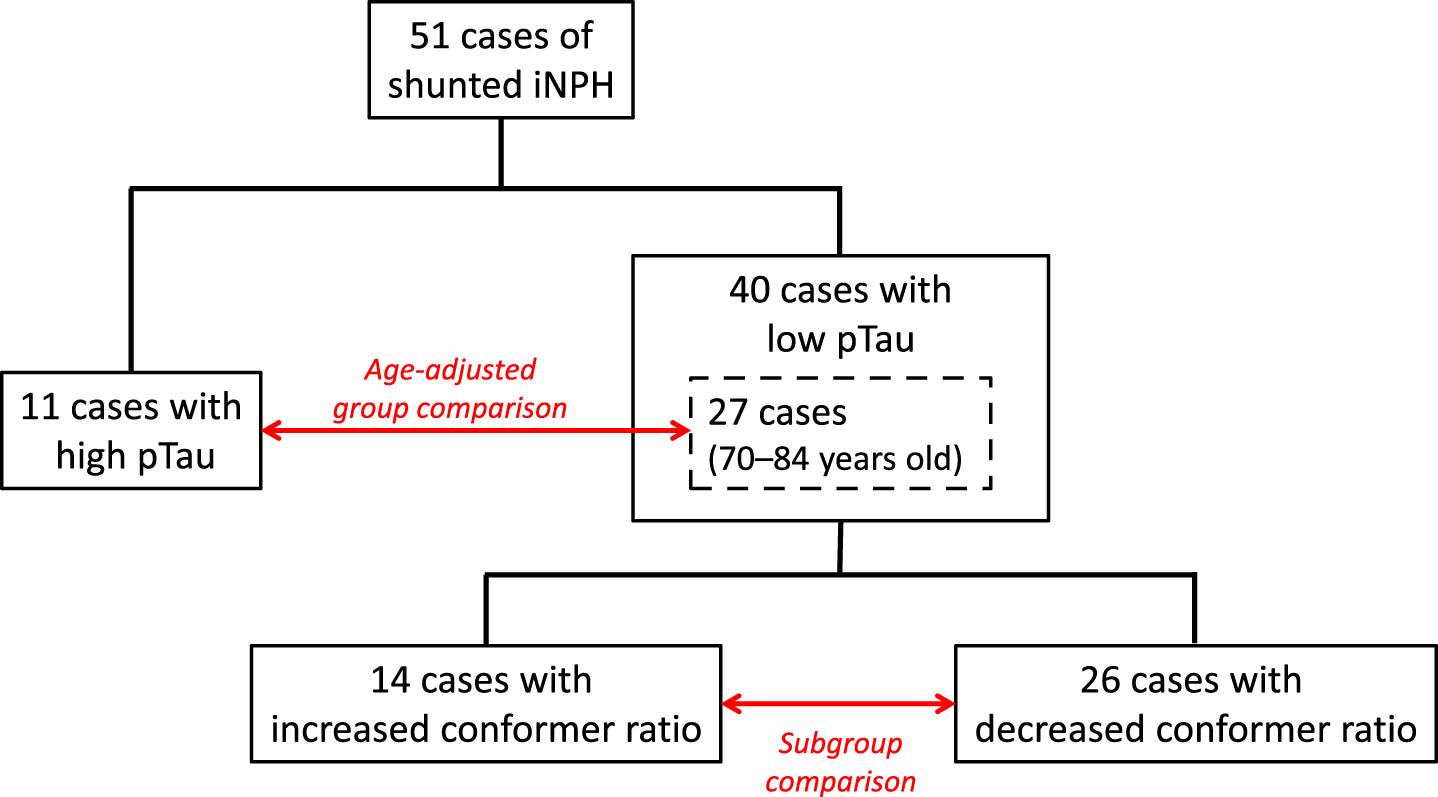
The second cohort comprised 51 consecutive patients with a diagnosis of possible iNPH according to the existing guideline [24] and who had undergone CSF shunting at the Department of Neurosurgery, Juntendo University in Tokyo, Japan, between October 2009 and April 2016. Patients were divided into two groups according to CSF pTau levels; this included 40 patients with pTau levels <30 pg/ml and 11 patients with pTau levels >30 pg/ml. After adjustment for age (range 70–84 years old), 27 patients were categorized as the low-pTau group and 11 patients were categorized as the high-pTau group. The cut-off value was taken from a previous study that analyzed pTau levels in patients with mild cognitive impairment [26]. Consequently, 40 patients in the low-pTau group were divided into two subgroups according to the postoperative change in Aβ42 toxic conformer ratio (%) [Aβ42 toxic conformer/ Aβ42×100] 1 year after CSF shunting; 26 patients with postoperatively decreased or unchanged Aβ42 toxic conformer ratio were classified into the decreased-conformer subgroup and 14 patients with postoperatively increased Aβ42 toxic conformer ratio were classified into the increased-conformer subgroup (Fig. 1). Because the Aβ42 toxic conformer ratio was not correlated with age, no age-adjustment was performed (range 60–84 years old).
Fig.1
The flow chart of patient division. 51 consecutive patients with a diagnosis of possible iNPH who had undergone CSF shunting were divided into two groups according to CSF pTau levels; 40 patients with pTau levels <30 pg/ml and 11 patients with pTau levels >30 pg/ml. After adjustment for age (range 70–84 years old), 27 patients were categorized as the low-pTau group and 11 patients were categorized as the high-pTau group. Consequently, 40 patients in the low-pTau group were divided into two subgroups according to the postoperative change in Aβ42 toxic conformer ratio 1 year after CSF shunting; 26 patients with postoperatively decreased or unchanged Aβ42 toxic conformer ratio were classified into the decreased-conformer subgroup and 14 patients with postoperatively increased Aβ42 toxic conformer ratio were classified into the increased-conformer subgroup.
Clinical status was evaluated using the MMSE, the Frontal Assessment Battery (FAB) [27], the modified Rankin Scale (mRS) [28], and the Japanese iNPH grading scale (INPHGS) [24]. Clinical findings were compared between the low- and high-pTau groups, and between the increased- and decreased-conformer subgroups. The study was approved by the Ethics Committee of Juntendo University. All patients included in the study, or, where appropriate, their relatives, gave informed consent for their participation. Written informed consent was also obtained from all patients and families prior to the CSF shunting.
CSF analysis
Lumbo-peritoneal shunts and lumbar punctures were performed following the method we previously reported [29]. In brief, we used an adjustable valve in all patients with a small lumen catheter (Medtronic Neurosurgery, Goleta, CA). CSF samples were collected by lumbar puncture performed in the L3–L4 or L4–L5 interspace through an 18-gauge spinal needle in all patients preoperatively. As a postoperative follow-up, proper shunt function was monitored by CSF withdrawal through the valve puncture using a 27-gauge needle. Additionally, symptoms and clinical features, including magnetic resonance imaging (MRI) findings, were observed frequently; the valve pressure was set to a lower level when no improvement in symptoms was seen and to a higher level when signs of over-drainage appeared, such as headache or an asymptomatic subdural hematoma in MRI [29]. No infection was reported following the lumbar puncture or valve puncture. All CSF samples were centrifuged at 4°C and 1690G for 10 min to remove cells and debris, aliquoted, and stored in polypropylene tubes at –80°C until biochemical analysis. The CSF biomarkers— pTau, Aβ42, and Aβ42 toxic conformer— were analyzed using enzyme-linked immunosorbent assay. Antibodies used were Innotest phospho tau-181p (Innogenetics, Belgium) for pTau, Innotest beta-amyloid 1–42 (Innogenetics) for Aβ42, and Human Amyloid β Toxic Oligomer (No. 27709, IBL, Japan) for Aβ42 toxic conformer [30]. The bicinchoninic acid method was used for total protein measurement.
Statistics
Non-parametric statistics were used for all analyses. Between-group comparisons for the three groups in the first cohort were performed using the Dunnett’s T3 test following a one-way analysis of variance. Between-group comparisons for the two groups/subgroups in the second cohort were performed using the Mann–Whitney U test for age, clinical findings, and CSF biomarkers, using the Pearson’s chi-squared test for sex, and the Wilcoxon signed-rank test for the time series data. Correlations revealed by scatter plots were calculated using Pearson’s correlation coefficient. All statistical analyses were performed with IBM Statistical Package of the Social Sciences Version 18.0 (SPSS, Cary, NC) for Windows. Results are shown as mean ± SD for age, value of CSF biomarkers, and Evans index, and as median, minimum, and maximum for the scoring of clinical evaluation batteries. p < 0.05 are considered to be statistically significant.
RESULTS
Aβ42 toxic conformer ratio differentiates between AD, iNPH, and CN
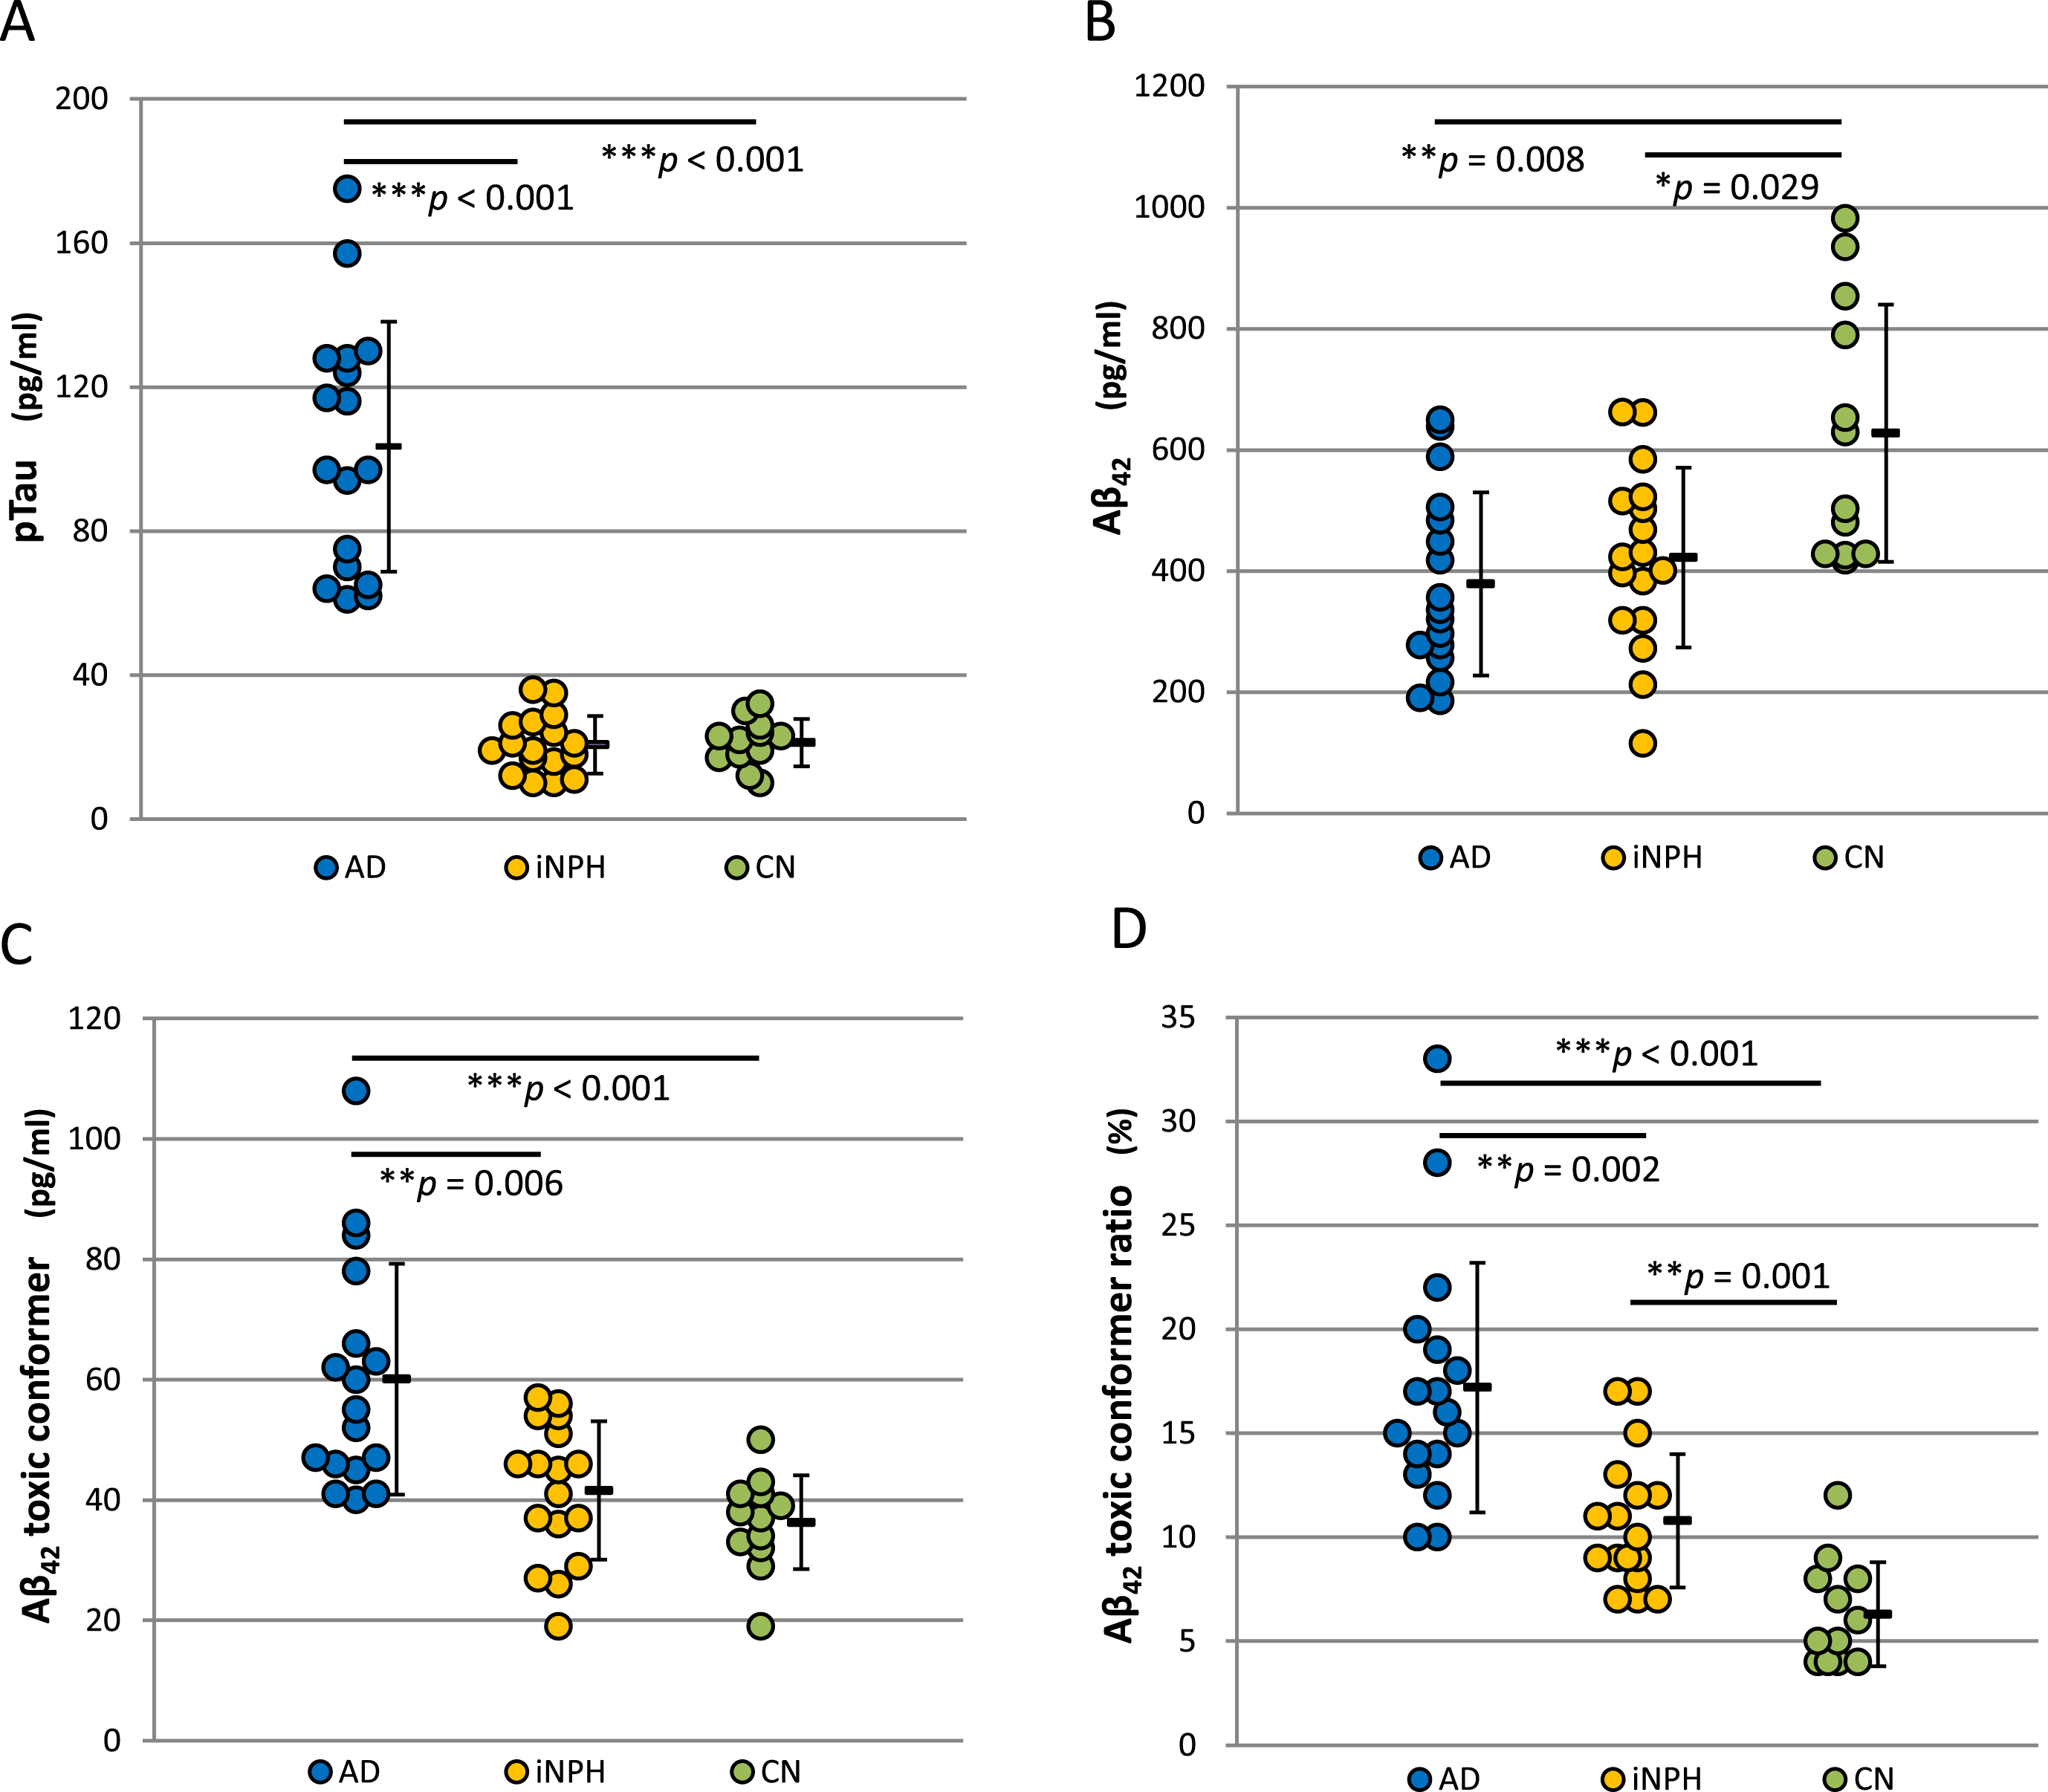
pTau in the AD group (103.5 pg/ml) was significantly higher than that of both the iNPH group (20.7 pg/ml) (p < 0.001) and the CN group (21.3 pg/ml) (p < 0.001). There was no significant difference in pTau between the iNPH and CN groups (Fig. 2A, Table 1). Aβ42 in the AD group (378.8 pg/ml) was significantly lower than that of the CN group (627.7 pg/ml) (p = 0.008), but not significantly different from the iNPH group (422.4 pg/ml). Aβ42 in the iNPH group was significantly lower than that of the CN group (p = 0.029) (Fig. 2B, Table 1). Aβ42 toxic conformer in the AD group (60.1 pg/ml) was significantly higher than that in both the iNPH group (41.6 pg/ml) (p = 0.006) and the CN group (36.3 pg/ml) (p < 0.001). There was no significant difference in Aβ42 toxic conformer between the iNPH group and the CN group (Fig. 2C, Table 1). The percentage of Aβ42 toxic conformer to Aβ42 indicated as Aβ42 toxic conformer ratio (%) [Aβ42 toxic conformer/Aβ42×100] was 17.2 ± 6.0% in the AD group, 10.8 ± 3.2% in the iNPH group, and 6.3 ± 2.5% in the CN group; significant differences were shown between the AD and iNPH group (p = 0.002), between the iNPH and CN group (p = 0.001), and between the AD and CN group (p < 0.001) (Fig. 2D, Table 1).
Fig.2
The analyses of cerebrospinal fluid markers in the three patient groups. A) pTau was significantly higher in the AD group compared to the iNPH group (p < 0.001), or the CN group (p < 0.001). No significant difference was seen between the iNPH and CN groups. B) Aβ42 was significantly low in the AD group (p = 0.008) and the iNPH group (p = 0.029) compared to the CN group. No significant difference was seen between the AD and iNPH groups. C) Aβ42 toxic conformer was high in the AD group compared to the iNPH group (p = 0.006), compared to the CN group (p < 0.001). No significant difference was seen between the iNPH and CN groups. D) Aβ42 toxic conformer ratio, indicating the percentage of Aβ42 toxic conformer to total Aβ42, was highest in the AD group, followed by the iNPH group, and lowest in the CN group (AD versus iNPH: p = 0.002; iNPH versus CN: p = 0.001; AD versus CN: p < 0.001).
Higher pTau levels were associated with unfavorable long-term outcomes
For the possible iNPH patients of the second cohort, we compared cognitive function between the two age-adjusted groups (Fig. 3A) that had been divided according to CSF pTau level at baseline. There was a group difference in sex (p = 0.03), and no between-group differences in the rate of disproportionately enlarged subarachnoid-space hydrocephalus (DESH) presence, tap-test responses, grade of white matter changes evaluated by the age-related white matter change (ARWMC) scale [31], preoperative Evans index, comorbidities, or preoperative medication for dementia (Table 2).
Fig.3
Postoperative transitions in MMSE score in the low- and high-pTau groups. A) A scatter plot showing a significant correlation between pTau and age (Pearson’s coefficient 0.289, p = 0.04). B) Postoperative transitions in MMSE scores in the low-pTau group showing significant improvement at 1 year after CSF shunting compared to baseline (p = 0.001). The consequent transitions until 2 years after CSF shunting varied widely, which resulted in no significant change from 1 year after CSF shunting. C) Postoperative transitions in the MMSE scores in the high-pTau group. No significant change in MMSE score was revealed between the baseline and 1 year after CSF shunting; however, the MMSE score 2 years after CSF shunting was significantly lower (p = 0.005) than that of 1 year postoperatively. D) A distribution of 2 years postoperative changes in the MMSE score showing that 9/11 patients (81.8%) of the high-pTau group declined 2 years after CSF shunting, while 9/27 patients (33.3%) of the low-pTau group declined. The right side of a dotted line indicates the improvement in MMSE score.
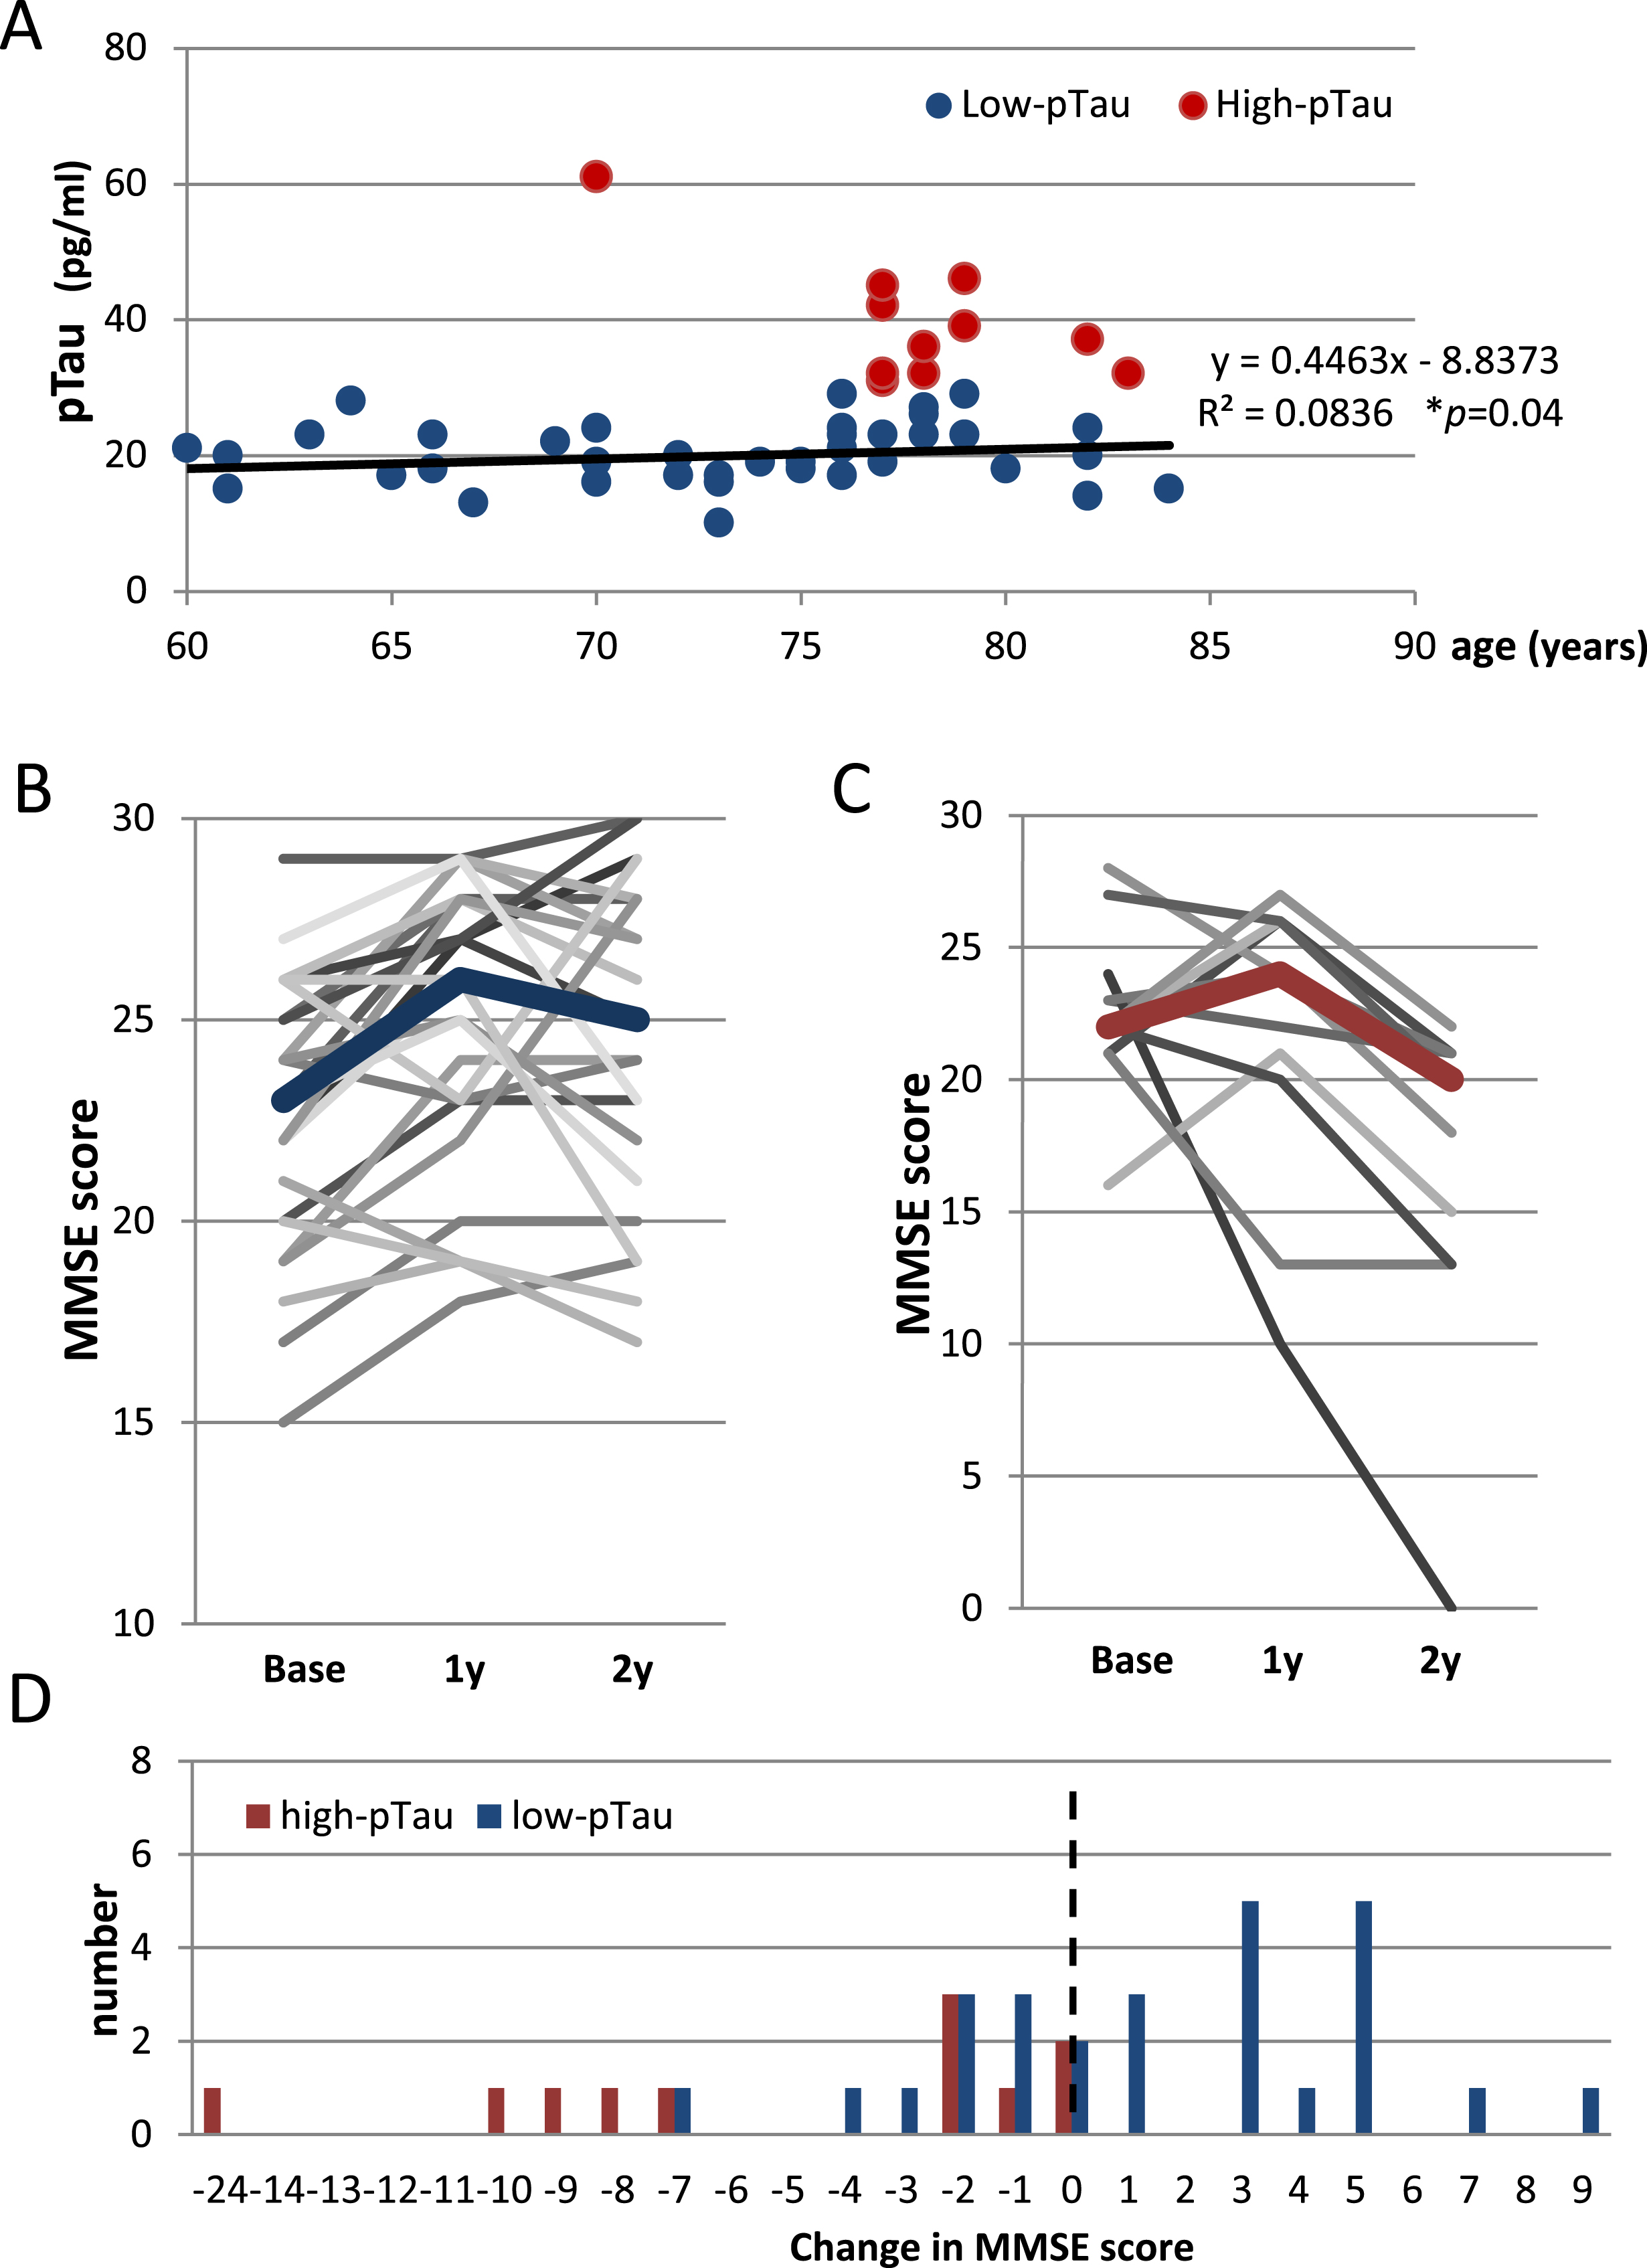
Table 2
Characteristics of the possible iNPH patients
| All | Analyzed total (low + high) | Low-pTau | High-pTau | Low- versus High-pTau | Pre- versus postoperative | |
| Patients: number (%) | 51 | 38 (75%) | 27 (71%) | 11 (29%) | ||
| Age: mean ± SD | 73.8 ± 6.4 | 76.9 ± 3.5 | 76.5 ± 3.5 | 77.9 ± 3.3 | 0.141 | |
| Sex: Male (number (%)) | 36 (71%) | 25 (66%) | 15 (56%) | 10 (91%) | *0.03 | |
| DESH: number/total number (%) | 45 (88%) | 34/37 (92%) | 24/26 (92%) | 10/11 (91%) | 0.636 | |
| Tap-test: number of positive/total number (%) | 35 (78%) | 26/34 (76%) | 18/24 (75%) | 8/10 (80%) | 0.754 | |
| White matter change: number of ARWMC score 0-1/total number (%) | 32 (63%) | 23/38 (61%) | 15/27 (56%) | 8/11 (73%) | 0.661 | |
| Evans Index: mean ± SD | ||||||
| preoperative | 0.34 ± 0.03 | 0.34 ± 0.031 | 0.33 ± 0.033 | 0.206 | 1 versus 2: *0.022 | |
| postoperative | 0.32 ± 0.03 | 0.32 ± 0.042 | 0.31 ± 0.044 | 0.430 | 3 versus 4: 0.244 | |
| Comorbidities: number/total number (%) | ||||||
| Hypertension | 28 (55%) | 22/36 (61%) | 14/25 (56%) | 8/11 (73%) | 0.343 | |
| Diabetes | 10 (21%) | 7/35 (20%) | 5/25 (20%) | 2/10 (20%) | 1.000 | |
| Dyslipidemia | 19 (40%) | 15/35 (43%) | 12/25 (48%) | 3/10 (30%) | 0.331 | |
| Cardiac diseases | 1 (2%) | 0/38 (0%) | 0/23 (0%) | 0/15 (0%) | NA | |
| Stroke | 5 (10%) | 3/38 (8%) | 3/27 (11%) | 0/11 (0%) | 0.249 | |
| Medication for dementia: number/total number (%) | ||||||
| preoperative | 9 (18%) | 7/38 (18%) | 3/27 (11%)5 | 4/11 (36%)6 | 0.069 | 5 versus 6: **0.006 |
Values are shown as number or mean ± SD. Mann-Whitney U tests were conducted for age, and Evans index and Pearson’s chi-squared test for all other domains. *p < 0.05 and **p < 0.01 were considered to be statistically significant. DESH, Disproportionately enlarged subarachnoid-space hydrocephalus; ARWMC, Age-related white matter change.
MMSE scores 2 years postoperatively were significantly higher in the low-pTau group compared to that of the high-pTau group (p = 0.001). In the low-pTau group, the MMSE score significantly improved from a median value of 23 at the baseline to 26 at 1 year after CSF shunting (p = 0.001) (Fig. 3B, Table 3). However, the consequent MMSE score changes until 2 years after CSF shunting varied; 18/27 patients (66.7%) showed improved or unchanged scores, and 9/27 (33.3%) showed lower MMSE scores 2 years postoperatively compared to 1 year after CSF shunting (Fig. 3D). Thus, the total postoperative change for the whole low-pTau group 2 years after CSF shunting became non-significant (Fig. 3B, Table 3). On the other hand, in the high-pTau group, median MMSE scores showed no significant change at 1 year after CSF shunting compared to baseline (22 versus 24); however, median MMSE scores were significantly lower 2 years after CSF shunting compared to baseline score (22 versus 20, p = 0.007) (Fig. 3C, Table 3). Indeed, 9/11 patients (81.8%) showed a decline, and scores of 2/11 (18.2%) patients remained unchanged 2 years after CSF shunting compared to the baseline score (Fig. 3D). The FAB scores in the low-pTau group showed a significant improvement two years postoperatively when compared to baseline score (p = 0.039), while that of the high-pTau group showed no statistical postoperative improvement (Table 3).
Table 3
Pre- and postoperative features in patients with iNPH
| Low-pTau | High-pTau | Low-pTau versus High-pTau | |||||||||||||
| Baseline (B) | 1 year after (1 y) | 2 years after (2 y) | p-value | Baseline (B) | 1 year after (1 y) | 2 years after (2 y) | p-value | p-value | |||||||
| B versus 1 y | B versus 2 y | 1 versus 2 y | B versus 1 y | B versus 2 y | 1 versus 2 y | B | 1y | 2y | |||||||
| Neuropsychological test: median [min-max] | |||||||||||||||
| MMSE | 23 [15–29] | 26 [18–29] | 25 [17–30] | **0.001 | 0.079 | 0.104 | 22 [16–28] | 24 [10–27] | 20 [0–22] | 0.893 | **0.007 | **0.005 | 0.698 | 0.052 | **0.001 |
| FAB | 11.5 [4–17] | 12 [7–18] | 12.5 [6–17] | **0.005 | *0.039 | 0.284 | 9 [4–15] | 11 [3–16] | 11 [3–15] | 0.944 | 0.943 | 0.783 | 0.404 | 0.139 | 0.247 |
| Clinical findings: median [min-max] | |||||||||||||||
| mRS | 3 [1–4] | 3 [1–4] | 2 [1–4] | *0.017 | **0.001 | 0.285 | 3 [2–4] | 2 [1–4] | 3 [1–4] | 0.157 | 0.608 | *0.038 | 0.555 | 0.445 | 0.063 |
| INPHGS | |||||||||||||||
| Gait disturbance | 2 [1–4] | 2 [0–3] | 2 [0–3] | ***<0.001 | ***<0.001 | 0.166 | 2 [2–3] | 2 [1–4] | 3 [1–4] | 0.480 | 0.739 | 0.083 | 0.655 | 0.879 | 0.163 |
| Dementia | 2 [0–3] | 1 [0–3] | 1 [0–3] | **0.005 | **0.003 | 1.000 | 2 [1–3] | 2 [1–4] | 3 [1–4] | 0.414 | 0.305 | 0.058 | 0.608 | 0.219 | **0.006 |
| Urinary incontinence | 2 [0–3] | 1 [0–3] | 1 [0–3] | ** 0.001 | **0.003 | 0.193 | 2 [1–3] | 1 [1–4] | 2 [1–4] | 0.550 | 0.319 | *0.023 | 0.937 | 0.496 | **0.002 |
| Biomarkers: mean ± SD | Baseline (B) | 1 year after (1 y) | 1 y/B | B versus 1 y | Baseline (B) | 1 year after (1 y) | 1 y/B | B versus 1 y | Low- versus High-pTau (B) | Low- versus High-pTau (B) | |||||
| pTau (pg/ml) | 20.1 ± 4.7 | 55.0 ± 29.7 | 2.73 | ***<0.001 | 39.4 ± 8.9 | 93.6 ± 53.2 | 2.38 | *0.019 | ***<0.001 | *0.037 | |||||
| Aβ42 (pg/ml) | 487.1 ± 227.6 | 786.2 ± 265.7 | 1.61 | ***<0.001 | 496.8 ± 300.3 | 507.6 ± 348.6 | 1.02 | 0.534 | 0.735 | *0.014 | |||||
| Aβ42 toxic conformer (pg/ml) | 53.4 ± 18.2 | 69.7 ± 17.0 | 1.31 | ***<0.001 | 62.3 ± 18.4 | 66.6 ± 26.4 | 1.12 | 0.423 | 0.203 | 0.252 | |||||
| Aβ42 toxic conformer ratio (%) | 13.3 ± 9.4 | 10.3 ± 5.5 | 0.77 | 0.116 | 15.2 ± 7.3 | 15.7 ± 6.1 | 1.03 | 0.107 | 0.770 | **0.002 | |||||
Results are shown as the median [minimum-maximum] or mean ± SD. Mann-Whitney U tests were used to compare low-pTau versus high-pTau groups and Wilcoxon signed-rank tests were used for all other comparisons. *p < 0.05, **p < 0.01, and ***p < 0.001 were considered to be statistically significant. MMSE, Mini-Mental State Examination; FAB, frontal assessment battery; mRS, modified Rankin scale; INPHGS, iNPH grading scale.
In the analyses of CSF biomarkers (Table 3), 1 year after CSF shunting, Aβ42 was markedly increased in the low-pTau group compared to baseline (p < 0.001) and was significantly higher than that of the high-pTau group (p = 0.014) which showed an insignificant increase. Aβ42 toxic conformer in the low-pTau group was increased significantly 1 year after CSF shunting compared to baseline (p < 0.001) while the high-pTau group showed no statistical change in Aβ42 toxic conformer 1 year postoperatively compared to baseline. No difference was seen in Aβ42 toxic conformer 1 year after CSF shunting in the low- versus high- pTau groups. As a result of the postoperative changes of these two biomarkers, the Aβ42 toxic conformer ratio was significantly lower in the low-pTau group compared to the high-pTau group 1 year postoperatively (p = 0.002).
Postoperative changes in Aβ42 toxic conformer ratio predict cognitive outcome
We consequently analyzed the change in Aβ42 toxic conformer ratio in the low-pTau group by dividing patients into two subgroups (decreased-conformer and increased-conformer subgroups) according to the 1 year postoperative change in the Aβ42 toxic conformer ratio (Fig. 1, Table 4). No age adjustment was performed because there was no correlation between Aβ42 toxic conformer ratio and age (Fig. 4A). No between-subgroup differences were found in sex, rate of DESH presence, tap-test responses, the grade of white matter changes evaluated by the ARWMC scale, the preoperative Evans index, comorbidities, or preoperative use of medication for dementia (Table 4).
Fig.4
Postoperative transitions of MMSE scores in the decreased- and increased-conformer group. A) A scatter plot showing no correlation between Aβ42 toxic conformer ratio and age (Pearson’s coefficient 0.026, p = 0.873). B) Postoperative transitions of MMSE scores in the decreased-conformer group showing significant improvement from the baseline at both 1- and 2 years after CSF shunting (both: p < 0.001). C) Postoperative transitions of MMSE scores in the increased-conformer group showing no significant change between the baseline and 1 year after CSF shunting; however, a significant decline was revealed between 1- and 2 years after CSF shunting (p = 0.036). D) A distribution of 2 tears postoperative changes in MMSE scores showing that scores of 11/14 patients (78.6%) of the increased-conformer group declined 2 years after CSF shunting, while scores of only 2/26 patients (7.7%) of the decreased-conformer group declined. The right side of the dotted line indicates an improvement in MMSE score.
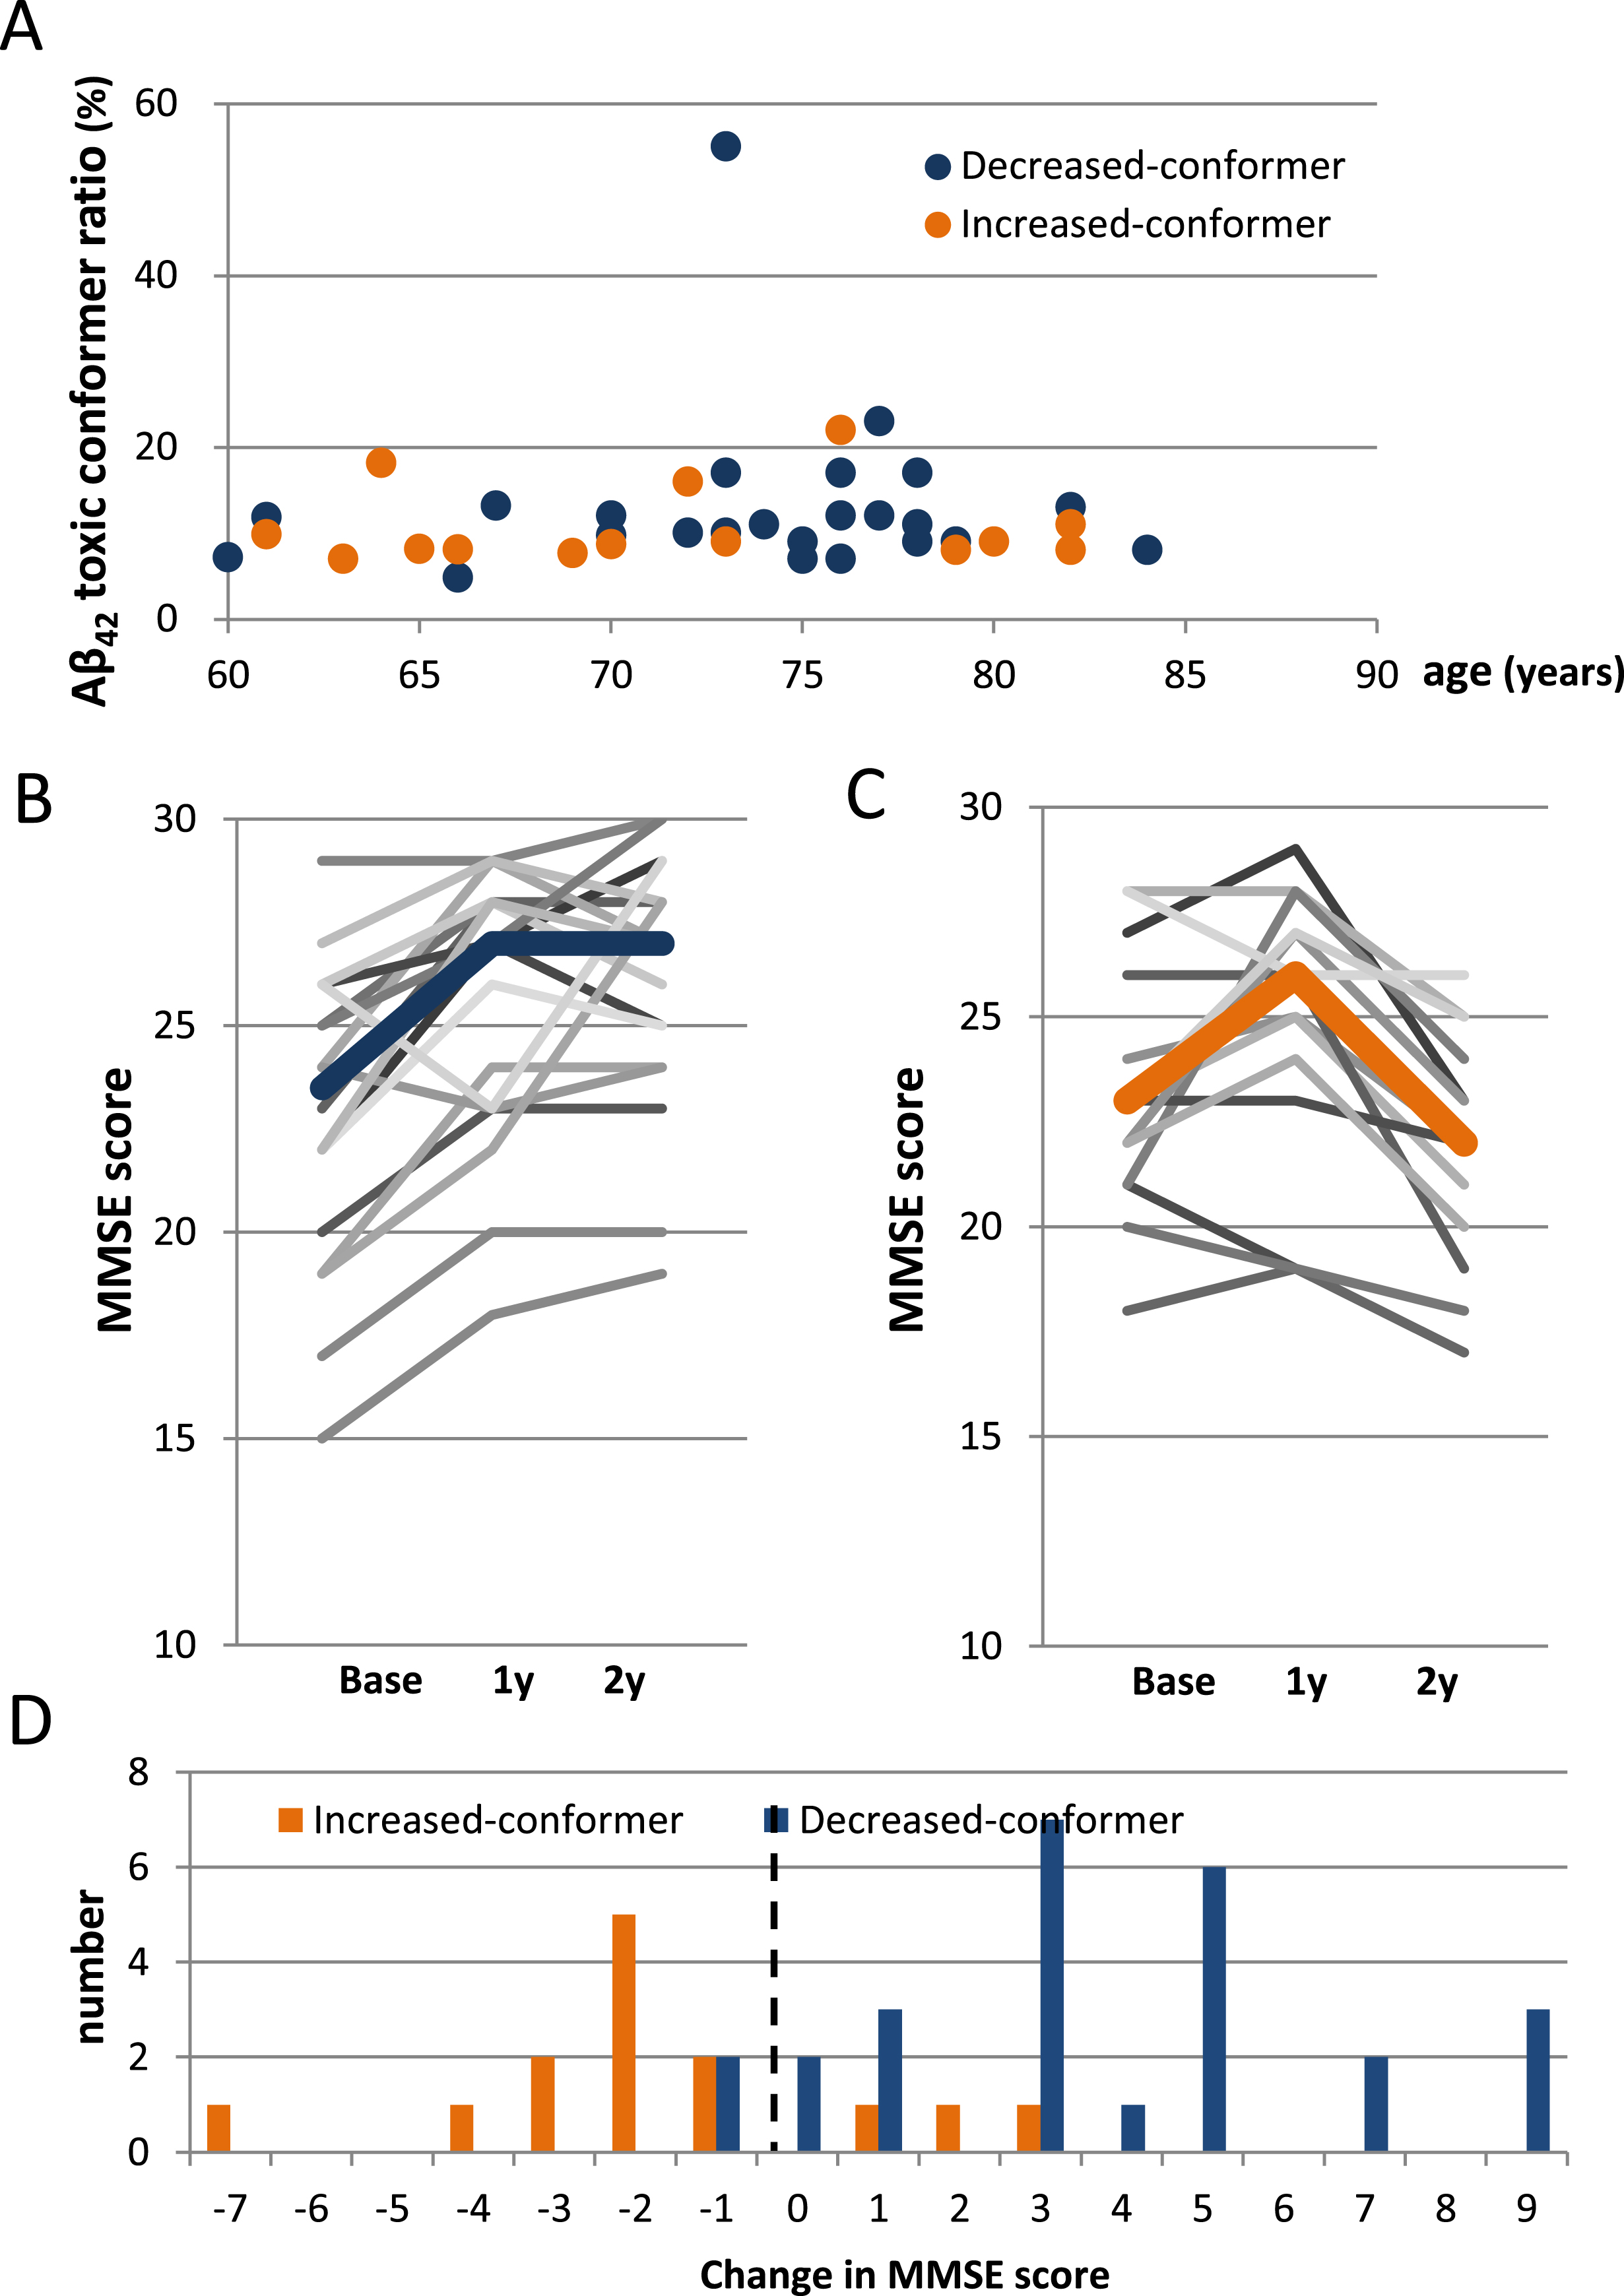
Table 4
Characteristics of the decreased- and increased-conformer group
| Decreased- conformer group | Increased- conformer group | Decreased- versus increased | Pre- versus postoperative | |
| Patients: number | 26 | 14 | p-value | |
| Age: mean ± SD | 73.3 ± 6.3 | 71.4 ± 7.4 | 0.434 | |
| Sex: Male (number (%)) | 19 (73%) | 9 (64%) | 0.563 | |
| DESH: number (%) | 22/26 (85%) | 12/13 (92%) | 0.498 | |
| Tap-test: number of positive (%) | 18/24 (75%) | 9/11 (82%) | 0.656 | |
| White matter change: number of ARWMC score 0-1 (%) | 16/24 (67%) | 8/14 (57%) | 0.557 | |
| Evans Index: mean ± SD | ||||
| preoperative | 0.34 ± 0.031 | 0.36 ± 0.043 | 0.538 | 1 versus 2: *0.044 |
| postoperative | 0.33 ± 0.042 | 0.33 ± 0.034 | 0.777 | 3 versus 4: *0.047 |
| Comorbidities: number (%) | ||||
| Hypertension | 13/26 (50%) | 7/14 (50%) | 1.000 | |
| Diabetes | 6/24 (25%) | 1/14 (7%) | 0.171 | |
| Dyslipidemia | 9/24 (38%) | 7/14 (50%) | 0.452 | |
| Cardiac diseases | 1/26 (4%) | 0/14 (0%) | 0.457 | |
| Stroke | 3/26 (12%) | 2/14 (14%) | 0.802 | |
| Medication for dementia: number (%) | ||||
| preoperative | 3/26 (12%)5 | 2/14 (14%)6 | 0.802 | 5 versus 6: *0.048 |
Values are shown as the number or mean ± SD. Mann-Whitney U test was used for age, and Evans index and, Pearson’s chi-squared tests were used for all other domains. *p < 0.05 was considered to be statistically significant. DESH, Disproportionately enlarged subarachnoid-space hydrocephalus; ARWMC, Age-related white matter change.
Focusing on the MMSE score, a significant improvement in the decreased-conformer subgroup was shown over the two years after CSF shunting compared to the baseline score (p < 0.001) (Fig. 4B, Table 5), while a significant decline was shown in the increased-conformer subgroup 2 years postoperatively compared to baseline score (p = 0.036) (Fig. 4C, Table 5). The data also reveal that 24/26 patients (92.3%) in the decreased-conformer subgroup showed improvement in MMSE scores 2 years after CSF shunting compared to baseline score (Fig. 4D). On the other hand, although 11/14 patients (78.6%) in the increased-conformer subgroup showed improvement in MMSE scores 1 year after CSF shunting compared to baseline score (data not shown), 13/14 patients (92.9%) showed a decline in MMSE scores 2 years after CSF shunting compared to baseline score (Fig. 4D). As a result, a significant between-subgroup difference was shown in MMSE score 2 years after CSF shunting (p < 0.001) (Table 5). FAB scores showed significant improvement in the decreased-conformer subgroup over the two years after CSF shunting compared to baseline scores (p = 0.029), while the increased-conformer subgroup showed no postoperative change. As a result, postoperative MMSE and FAB scores at 2 years were significantly higher in the decreased-conformer subgroup than the increased-conformer subgroup (MMSE: p < 0.001; FAB: p = 0.010) (Table 5).
Table 5
Pre- and postoperative findings in the decreased- and increased-conformer groups
| Decreased-conformer ratio | Increased-conformer ratio | Decreased versus increased | |||||||||||||
| Baseline (B) | 1 year after (1 y) | 2 years after (2 y) | p-value | Baseline (B) | 1 year after (1 y) | 2 years after (2 y) | p-value | p-value | |||||||
| B versus 1 y | B versus 2 y | 1 versus 2 y | B versus 1 y | B versus 2 y | 1 versus | B | 1y | 2y | |||||||
| Neuropsychological test: median [min-max] | |||||||||||||||
| MMSE | 23 [13–29] | 27 [18–29] | 27 [19–30] | ***<0.001 | ***<0.001 | 0.804 | 23 [18–28] | 26 [19–29] | 22 [17–26] | 0.087 | *0.036 | ** 0.001 | 0.820 | 0.156 | *** 0.000 |
| FAB | 12 [4–17] | 14 [7–18] | 14 [18-17] | ** 0.003 | *0.029 | 0.246 | 10 [3–14] | 11 [9–14] | 10 [6–15] | 0.260 | 0.964 | 0.094 | 0.302 | *0.016 | *0.010 |
| Clinical findings: median [min-max] | |||||||||||||||
| mRS | 3 [1–4] | 2 [1–4] | 2 [0–4] | ** 0.007 | ***<0.001 | 0.071 | 3 [2–4] | 3 [1–4] | 3 [1–4] | ** 0.008 | ** 0.005 | 0.564 | *0.039 | *0.028 | ** 0.006 |
| iNPHGS | |||||||||||||||
| Gait disturbance | 2 [1–4] | 1 [0–3] | 1 [0–3] | ***<0.001 | ***<0.001 | 0.248 | 2 [1–4] | 2 [0–3] | 2 [0–3] | *0.011 | 0.107 | 0.414 | 0.555 | 0.155 | *0.024 |
| Dementia | 2 [1–3] | 1 [0–3] | 1 [0–3] | ** 0.003 | ***<0.001 | 0.248 | 2 [1–3] | 2 [0–3] | 2 [0–3] | *0.023 | 0.206 | 0.102 | 0.128 | *0.028 | ** 0.001 |
| Urinary incontinence | 2 [0–3] | 1 [0–3] | 1 [0–3] | ** 0.001 | ***<0.001 | 0.083 | 2 [0–3] | 2 [0–3] | 1 [0–3] | *0.014 | *0.030 | 0.334 | *0.002 | *0.025 | *0.046 |
| Biomarkers: mean ± SD | Baseline (B) | 1 year after (1 y) | 1 y/B | B versus 1 y | Baseline (B) | 1 year after (1 y) | Decreased versus Increased (B) | Decreased versus Increased (1 y) | ||
| pTau (pg/ml) | 19.9 ± 5.0 | 56.4 ± 26.0 | 2.83 | ***<0.001 | 20.0 ± 4.0 | 56.3 ± 35.2 | 2.82 | ***<0.001 | 0.977 | 0.660 |
| Aβ42 (pg/ml) | 458.4 ± 225.7 | 850.3 ± 188.3 | 1.85 | ***<0.001 | 503.9 ± 219.3 | 564.7 ± 275.6 | 1.12 | 0.466 | 0.523 | **0.003 |
| Aβ42 toxic conformer (pg/ml) | 49.0 ± 19.6 | 65.4 ± 15.4 | 1.33 | ***<0.001 | 48.4 ± 13.3 | 70.5 ± 20.9 | 1.46 | ***<0.001 | 0.809 | 0.701 |
| Aβ42 toxic conformer ratio (%) | 13.1 ± 9.5 | 8.0 ± 2.5 | 0.61 | ***<0.001 | 10.8 ± 4.5 | 15.1 ± 6.4 | 1.40 | ** 0.001 | 0.285 | ***<0.001 |
Results are shown as the median [minimum-maximum] or mean ± SD. Mann-Whitney U tests were used for the comparison of the decreased-conformer versus increased-conformer groups, and Wilcoxon signed-rank tests for all other comparisons. *p < 0.05, **p < 0.01, and ***p < 0.001 were considered to be statistically significant. MMSE, Mini-Mental State Examination; FAB, frontal assessment battery; mRS, modified Rankin scale; INPHGS, iNPH grading scale.
In the CSF analyses, pTau increased significantly 1 year postoperatively compared to baseline within both subgroups (p < 0.001 and p = 0.003), resulting in no subgroup differences (Table 5). The decreased-conformer subgroup showed a significant increase in Aβ42 1 year postoperatively compared to baseline (p < 0.001), while that in the increased-conformer subgroup showed no significant increase, resulting in a significant between-subgroup difference 1 year after CSF shunting (p = 0.003) (Table 5). Aβ42 toxic conformer showed a significant postoperative increase 1 year after CSF shunting compared to baseline within both subgroups (both: p < 0.001), resulting in no significant between-subgroup difference 1 year postoperatively (Table 5). Aβ42 toxic conformer ratio was significantly different between subgroups 1 year after CSF shunting (p < 0.001) (Table 5).
In addition to careful postoperative observations, proper shunt function was confirmed by postoperative improvements in mRS or INPHGS scores or by a decrease in the Evans index or improvement of high convexity tightness, even in cases where Aβ42 did not increase postoperatively, such as the high-pTau group and the increased-conformer subgroup (Tables 2 and 4).
DISCUSSION
In the current study, in order to assess the effect of coexistence of early AD pathology in iNPH, we analyzed Aβ42 toxic conformer in CSF obtained from patients with iNPH. We found that changes in Aβ42 toxic conformer ratio after CSF shunting, with the alteration of Aβ42 clearance to CSF predict, postoperative long-term cognitive outcome.
In the first cohort, Aβ42 was significantly lower in both the AD and iNPH groups compared to the CN group. On the other hand, Aβ42 toxic conformer and Aβ42 toxic conformer ratio were significantly higher in the AD group than in the iNPH group, which clearly differentiates the two groups. In the second cohort, we assessed the effect of pTau level on cognitive function over time and found that the high-pTau group showed significantly lower MMSE scores 2 years after CSF shunting compared to the low-pTau group. By contrast, the low-pTau group had favorable outcomes 1 year postoperatively; however, 33.3% consequently showed a decline in cognitive functioning at 2 years. On further subdividing the low-pTau group according to the postoperative change in Aβ42 toxic conformer ratio, we found that the decreased-conformer subgroup, of which the Aβ42 toxic conformer ratio postoperatively decreased to be close to the range of the NC group, showed a significant improvement in MMSE scores over the two years postoperatively, while the increased-conformer subgroup, of which Aβ42 toxic conformer ratio postoperatively increased to be close to the range of the AD group, showed a decline in MMSE between 1 year and 2 years postoperatively, resulting in a significant between-subgroup difference 2 years after CSF shunting.
Our results have important implications for determining postoperative cognitive outcomes in patients with iNPH. First, the high-pTau group was related to a long-term cognitive decline (2 years in the current study) following CSF shunting. This is likely to be because the preoperative high pTau levels are indicative of a coexistence of AD pathology [5] which may progress during the 2 years, or a severe neurodegeneration that is irreversible due to a longer clinical course [32]. Some studies have also suggested that the prolonged suffering from iNPH might be associated with neural destruction, which is supported by findings of increased levels of total Tau and pTau in CSF [11, 33]. More recently, one traditional amyloid cascade hypothesis [34] is being replaced by the idea that Aβ and tau may be initiated independently in AD [35]. Together with these reports, our results suggest that higher pTau levels in iNPH predict unfavorable postoperative outcomes. The second important clinical implication relates to the findings that Aβ42 toxic conformer ratio was higher in the AD group followed by the iNPH group compared to the CN group, and that a decrease in Aβ42 toxic conformer ratio at 1 year after CSF shunting was due to the increase (recovery) in Aβ42 clearance to CSF, which was correlated with the subsequent favorable cognitive outcomes. Graff-Radford reported that the low CSF Aβ42 observed in patients with iNPH could be due to an impaired clearance from interstitial fluid (ISF) to CSF [9]. Jeppsson et al. also reported that iNPH is characterized by reduced brain metabolism in the periventricular zone, which leads to a decrease in Aβ42 production and reduced Aβ42 clearance from extracellular fluid due to reduced centripetal flow to CSF caused by the retrograde CSF dynamic, and further, that CSF shunting may create a novel escape route for CSF allowing for normal extracellular fluid clearance and a normalization of extracellular fluid flow dynamics [36]. Similarly, Herukka and colleagues reported that ISF Aβ42, which was within similar range in CSF, tended to be lower in patients with Aβ deposition detected in the brain biopsy [37]. Interestingly, it is reported that Global neurological status was better correlated with brain ISF Aβ measurements than with ventricular CSF Aβ [38]. Moreover, another report has suggested that low CSF Aβ42 level in AD can be best explained by a significant decrease in Aβ42 clearance rather than an increase in Aβ42 production [39]. From these perspectives, our results might also indicate that the higher Aβ42 toxic conformer ratio in AD and iNPH is due to a decreased clearance of Aβ42 in CSF, which may lead to Aβ42 oligomerization inthe brain.
There is increasing evidence that soluble oligomeric assemblies of Aβ can induce neurotoxicity and synaptotoxicity in AD pathology [15], whereas mature plaques composed of insoluble fibrils are not always consistent with neuronal degeneration [8, 40]. In a review of conformation-specific antibodies targeting Aβ oligomers, Murakami also posited that Aβ oligomers can exist in a toxic form (such as Aβ-derived diffusible ligands and amylospheroid), and in a non-toxic form (such as amyloid fibrils, which comprise senile plaques). The minimum unit in both of these toxic and non-toxic oligomers exists as a dimer or/and trimer, which is also classified as a toxic conformer with a turn at positions 22 and 23, and as a non-toxic conformer with a turn at positions 25 and 26 [41]. The antibody we used in this study recognizes this specific “toxic” turn at positions 22 and 23, and thus, the measured Aβ42 toxic conformer potentially forms Aβ42 toxic oligomer, which expresses neurotoxicity and synaptotoxicity [23]. In the current study, the factor dividing the favorable and unfavorable cognitive outcomes was the postoperative change in Aβ42 toxic conformer ratio, which was due to the change in Aβ42, but not Aβ42 toxic conformer. The measured “total” Aβ42 mayinclude both Aβ42 toxic conformer and Aβ42 non-toxic conformer, and, since the value of Aβ42 toxic conformer was not changed postoperatively, the significant postoperative increase in Aβ42 mainly reflects the increase in Aβ42 non-toxic conformer in CSF. Izuo and colleagues have reported that the non-toxic Aβ42 conformer suppresses the process of β-sheet formation for Aβ42 aggregation and inhibits the toxic oligomer formation [42]. These studies support our hypothesis that the postoperative decrease in Aβ42 toxic conformer ratio due to the increase in Aβ42 in CSF may protect cognitive function from neurotoxicity and synaptotoxicity induced by Aβ42 toxic oligomer.
The present study has some limitations that should be noted. First, the sample size was small, thus increasing the probability of type II errors. A consequent research study with a larger cohort is required. Second, AD pathology was not confirmed by biopsy or autopsy. Alternatively, another diagnostic tool for AD pathology, such as amyloid positron emission tomography, may be used in future studies. Third, we were unable to account for effects caused by other dementia-related diseases. Finally, the postoperative observational period was two years, and so future, longer-term studies will be necessary to verify our results.
Since CSF Aβ42 level is low in both patients with AD and with iNPH, it is difficult to detect the coexistence of early AD in iNPH without a corresponding increase in pTau. Thus, we can conclude that the change of Aβ42 toxic conformer ratio is a useful CSF biomarker to predict the long-term cognitive outcomes in patients with iNPH through detecting the coexistence of early AD pathology.
ACKNOWLEDGMENTS
The authors would like to thank Kostadin L. Karagiozov (Department of Neurosurgery, Juntendo University Graduate School of Medicine) and Editage (http://www.editage.jp) for English language editing, Hiroharu Suzuki (Department of Neurosurgery, Juntendo University Graduate School of Medicine) for helping us in data collecting. This work was supported in part by the Ministry of Health, Labor and Welfare of Japan (2018-Nanchi-General-052); in part by Agency for Research and Medical Development (AMED) Grant Number 16dk0207030h0001 to T. Tokuda; in part by a Grant-in-Aid for Scientific Research Grant Number 16KK0187 and 17K10908 to M. Nakajima, and 26221202 to K. Irie from the Japan Society for the Promotion of Science; and in part by a Grant-in-Aid for Encouragement of Scientists from Juntendo University Research Institute for Diseases of Old Age (Tokyo, Japan).
Authors’ disclosures available online (https://www.j-alz.com/manuscript-disclosures/18-0059r1).
REFERENCES
[1] | Adams RD , Fisher CM , Hakim S , Ojemann RG , Sweet WH ((1965) ) Symptomatic occult hydrocephalus with normal cerebrospinal-fluid pressure. A treatable syndrome. N Engl J Med 273: , 117–126. |
[2] | Malm J , Kristensen B , Stegmayr B , Fagerlund M , Koskinen LO ((2000) ) Three-year survival and functional outcome of patients with idiopathic adult hydrocephalus syndrome. Neurology 55: , 576–578. |
[3] | Aygok G , Marmarou A , Young HF ((2005) ) Three-year outcome of shunted idiopathic NPH patients. Acta Neurochir Suppl 95: , 241–245. |
[4] | Hamilton R , Patel S , Lee EB , Jackson EM , Lopinto J , Arnold SE , Clark CM , Basil A , Shaw LM , Xie SX , Grady MS , Trojanowski JQ ((2010) ) Lack of shunt response in suspected idiopathic normal pressure hydrocephalus with Alzheimer disease pathology. Ann Neurol 68: , 535–540. |
[5] | Elobeid A , Laurell K , Cesarini KG , Alafuzoff I ((2015) ) Correlations between mini-mental state examination score, cerebrospinal fluid biomarkers, and pathology observed in brain biopsies of patients with normal-pressure hydrocephalus. J Neuropathol Exp Neurol 74: , 470–479. |
[6] | Lim TS , Choi JY , Park SA , Youn YC , Lee HY , Kim BG , Joo IS , Huh K , Moon SY ((2014) ) Evaluation of coexistence of Alzheimer’s disease in idiopathic normal pressure hydrocephalus using ELISA analyses for CSF biomarkers. BMC Neurol 14: , 66. |
[7] | Patel S , Lee EB , Xie SX , Law A , Jackson EM , Arnold SE , Clark CM , Shaw LM , Grady MS , Trojanowski JQ , Hamilton RH ((2012) ) Phosphorylated tau/amyloid beta 1-42 ratio in ventricular cerebrospinal fluid reflects outcome in idiopathic normal pressure hydrocephalus. Fluids Barriers CNS 9: , 7. |
[8] | Santangeloa R , Cecchettia G , Bernasconia MP , Cardamonea R , Barbieria A , Pintob P , Passerinic G , Scomazzonid F , Comia G , Magnani G ((2017) ) Cerebrospinal fluid amyloid-β 42, total Tau and phosphorylated Tau are low in patients with normal pressure hydrocephalus: Analogies and differences with Alzheimer’s disease. J Alzheimers Dis 60: , 183–200. |
[9] | Graff-Radford NR ((2014) ) Alzheimer CSF biomarkers may be misleading in normal-pressure hydrocephalus. Neurology 83: , 1573–1575. |
[10] | Kapaki EN , Paraskevas GP , Tzerakis NG , Sfagos C , Seretis A , Kararizou E , Vassilopoulos D ((2007) ) Cerebrospinal fluid tau, phospho-tau181 and beta-amyloid1-42 in idiopathic normal pressure hydrocephalus: A discrimination from Alzheimer’s disease. Eur J Neurol 14: , 168–173. |
[11] | Chen Z , Liu C , Zhang J , Relkin N , Xing Y , Li Y ((2017) ) Cerebrospinal fluid Aβ42, t-tau, and p-tau levels in the differential diagnosis of idiopathic normal-pressure hydrocephalus: A systematic review and meta-analysis. Fluids Barriers CNS 14: , 13. |
[12] | van Harten AC , Visser PJ , Pijnenburg YA , Teunissen CE , Blankenstein MA , Scheltens P , van der Flier WM ((2013) ) Cerebrospinal fluid Aβ42 is the best predictor of clinical progression in patients with subjective complaints. Alzheimers Dement 9: , 481–487. |
[13] | Nakajima M , Miyajima M , Ogino I , Akiba C , Sugano H , Hara T , Fusegi K , Karagiozov KL , Arai H ((2015) ) Cerebrospinal fluid biomarkers for prognosis of long-term cognitive treatment outcomes in patients with idiopathic normal pressure hydrocephalus. J Neurol Sci 357: , 88–95. |
[14] | Lambert MP , Barlow AK , Chromy BA , Edwards C , Freed R , Liosatos M , Morgan TE , Rozovsky I , Trommer B , Viola KL , Wals P , Zhang C , Finch CE , Krafft GA , Klein WL ((1998) ) Diffusible, nonfibrillar ligands derived from Aβ1-42 are potent central nervous system neurotoxins. Proc Natl Acad Sci U S A 95: , 6448–6453. |
[15] | Walsh DM , Klyubin I , Fadeeva JV , Cullen WK , Anwyl R , Wolfe MS , Rowan MJ , Selkoe DJ ((2002) ) Naturally secreted oligomers of amyloid β protein potently inhibit hippocampal long-term potentiation in vivo. Nature 416: , 535–539. |
[16] | Aisen PS , Petersen RC , Donohue MC , Gamst A , Raman R , Thomas RG , Walter S , Trojanowski JQ , Shaw LM , Beckett LA , Jack CRJr , Jagust W , Toga AW , Saykin AJ , Morris JC , Green RC , Weiner MW ((2010) ) Clinical core of the Alzheimer’s disease neuroimaging initiative: Progress and plans. Alzheimers Dement 6: , 239–246. |
[17] | Haass C , Selkoe DJ ((2007) ) Soluble protein oligomers in neurodegeneration: Lessons from the Alzheimer’s amyloid β-peptide. Nat Rev Mol Cell Biol 8: , 101–112. |
[18] | Masuda Y , Uemura S , Ohashi R , Nakanishi A , Takegoshi K , Shimizu T , Shirasawa T , Irie K ((2009) ) Identification of physiological and toxic conformations in Aβ42 aggregates. ChemBioChem 10: , 287–295. |
[19] | Morimoto A , Irie K , Murakami K , Masuda Y , Ohigashi H , Nagao M , Fukuda H , Shimizu T , Shirasawa T ((2004) ) Analysis of the secondary structure of β-amyloid (Aβ42) fibrils by systematic proline replacement. J Biol Chem 279: , 52781–52788. |
[20] | Murakami K , Irie K , Morimoto A , Ohigashi H , Shindo M , Nagao M , Shimizu T , Shirasawa T ((2003) ) Neurotoxicity and physicochemical properties of Aβ mutant peptides from cerebral amyloid angiopathy: Implication for the pathogenesis of cerebral amyloid angiopathy and Alzheimer’s disease. J Biol Chem 278: , 46179–46187. |
[21] | Izuo N , Kume T , Sato M , Murakami K , Irie K , Izumi Y , Akaike A ((2012) ) Toxicity in rat primary neurons through the cellular oxidative stress induced by the turn formation at positions 22 and 23 of Aβ42. ACS Chem Neurosci 3: , 674–681. |
[22] | Suzuki T , Murakami K , Izuo N , Kume T , Akaike A , Nagata T , Nishizaki T , Tomiyama T , Takuma H , Mori H , Irie K ((2010) ) E22Δ mutation in amyloid β-protein promotes β-sheet transformation, radical production, and synaptotoxicity, but not neurotoxicity. Int J Alzheimers Dis 2011: , 431320. |
[23] | Izuo N , Kasahara C , Murakami K , Kume T , Maeda M , Irie K , Yokote K , Shimizu T ((2017) ) A toxic conformer of Aβ42 with a turn at 22-23 is a novel therapeutic target for Alzheimer’s disease. Sci Rep 7: , 11811. |
[24] | Mori E , Ishikawa M , Kato T , Kazui H , Miyake H , Miyajima M , Nakajima M , Hashimoto M , Kuriyama N , Tokuda T , Ishii K , Kaijima M , Hirata Y , Saito M , Arai H ((2012) ) Guidelines for management of idiopathic normal pressure hydrocephalus: Second edition. Neurol Med Chir (Tokyo) 52: , 775–809. |
[25] | Folstein MF , Folstein SE , McHugh PR ((1975) ) Mini-mental state. A practical method for grading the cognitive state of patients for the clinician. J Psychiatr Res 12: , 189–198. |
[26] | Vemuri P , Wiste HJ , Weigand SD , Shaw LM , Trojanowski JQ , Weiner MW , Knopman DS , Peterson RC , Jack CR Jr ((2009) ) MRI and CSF biomarkers in normal, MCI, and AD subjects. Predicting future clinical change. Neurology 73: , 294–301. |
[27] | Dubois B , Slachevsky A , Litvan I , Pillon B ((2000) ) The FAB: A Frontal Assessment Battery at bedside. Neurology 55: , 1621–1626. |
[28] | van Swieten JC , Koudstall PJ , Visser MC , Schouten HJ , van Gijn J ((1988) ) Interobserver agreement for the assessment of handicap in stroke patients. Stroke 19: , 604–607. |
[29] | Nakajima M , Miyajima M , Ogino I , Sugano H , Akiba C , Domon N , Karagiozov KL , Arai H ((2015) ) Use of external lumbar cerebrospinal fluid drainage and lumboperitoneal shunts with Strata NSC valves in idiopathic normal pressure hydrocephalus: A single-center experience. World Neurosurg 83: , 387–393. |
[30] | Murakami K , Tokuda M , Suzuki T , Irie Y , Hanaki M , Izuo N , Monobe Y , Akagi K , Ishii R , Tatebe H , Tokuda T , Maeda M , Kume T , Shimizu T , Irie K ((2016) ) Monoclonal antibody with conformational specificity for a toxic conformer of amyloid β42 and its application toward the Alzheimer’s disease diagnosis. Sci Rep 6: , 29038. |
[31] | Wahlund LO , Barkhof F , Fazekas F , Bronge L , Augustin M , Sjögren M , Wallin A , Ader H , Leys D , Pantoni L , Pasquier F , Erkinjuntti T , Scheltens P ((2001) ) A new rating scale for age-related white matter changes applicable to MRI and CT. Stroke 32: , 1318–1322. |
[32] | Jingami N , Asada-Utsugi M , Uemura K , Noto R , Takahashi M , Ozaki A , Kihara T , Kageyama T , Takahashi R , Shimohama S , Kinoshita A ((2015) ) Idiopathic normal pressure hydrocephalus has a different cerebrpspinal fluid biomarker profile from Alzeheimer’s disease. J Alzheimers Dis 45: , 109–115. |
[33] | Ray B , Reyes PF , Lahiri DK ((2011) ) Biochemical studies in normal pressure hydrocephalus (NPH) patients: Change in CSF levels of amyloid precursor protein (APP), amyloid-beta (Aβ) peptide and phospho-tau. J Psychiatr Res 45: , 539–547. |
[34] | Jack CRJr , Knopman DS , Jagust WJ , Shaw LM , Aisen PS , Weiner MW , Petersen RC , Trojanowski JQ ((2010) ) Hypothetical model of dynamic biomarkers of the Alzheimer’s pathological cascade. Lancet Neurol 9: , 119–128. |
[35] | Jack CRJr , Knopman DS , Jagust WJ , Petersen RC , Weiner MW , Aisen PS , Shaw LM , Vemuri P , Wiste HJ , Weigand SD , Lesnick TG , Pankratz VS , Donohue MC , Trojanowski JQ ((2013) ) Tracking pathophysiological processes in Alzheimer’s disease: An updated hypothetical model of dynamic biomarkers. Lancet Neurol 12: , 207–216. |
[36] | Jeppsson A , Zetterberg H , Blennow K , Wikkelso C ((2013) ) Idiopathic normal-pressure hydrocephalus: Pathophysiology and diagnosis by CSF biomarkers. Neurology 80: , 1385–1392. |
[37] | Herukka SK , Rummukainen, Ihalainen J , von und zu Fraunberg M , Koivisto AM , Nerg O , Puli LK , Seppälä TT , Zetterberg H , Pyykkö OT , Helisalmi S , Tanila H , Alafuzoff I , Hiltunen M , Rinne J , Soininen H , Jääskeläinen JE , Leinonen V ((2015) ) Amyloid-β and tau dynamics in human brain interstitial fluid in patients with suspected normal pressure hydrocephalus. J Alzheimers Dis 46: , 261–269. |
[38] | Brody DL , Magnoni S , Schwetye KE , Spinner ML , Esparza TJ , Stocchetti N , Zipfel GJ , Holtzman DM ((2008) ) Amyloid-β dynamics correlate with neurological status in the injured human brain. Science 321: , 1221–1224. |
[39] | Mawuenyega KG , Sigurdson W , Ovod V , Munsell L , Kasten T , Morris JC , Yarasheski KE , Bateman RJ ((2011) ) Decreased clearance of CNS beta-amyloid in Alzheimer’s disease. Science 330: , 1774. |
[40] | Gomez-Isla T , Hollister R , West H , Mui S , Growdon JH , Petersen RC , Parisi JE , Hyman BT ((1997) ) Neuronal loss correlates with but exceeds neurofibrillary tangles in Alzheimer’s disease. Ann Neurol 41: , 17–24. |
[41] | Murakami K ((2014) ) Conformation-specific antibodies to target amyloid β oligomers and their application to immunotherapy for Alzheimer’s disease. Biosci Biotech Biochem 78: , 1293–1305. |
[42] | Izuo N , Murakami K , Sato M , Iwasaki M , Izumi Y , Shimizu T , Akaike A , Irie K , Kume T ((2013) ) Non-toxic conformer of amyloid β may suppress amyloid β-induced toxicity in rat primary neurons: Implications for a novel therapeutic strategy for Alzheimer’s disease. Biochem Biophys Res Commun 438: , 1–5. |


