
Sex Moderates the Impact of Diagnosis and Amyloid PET Positivity on Hippocampal Subfield Volume
Abstract
We examined moderation effects of sex and diagnosis on the effect of positive florbetapir positron emission tomography (PET) amyloid-β (Aβ) scan (A+) on hippocampus subfield volumes in 526 normal control (NC) and early mild cognitive impairment (eMCI) participants from the Alzheimer’s Disease Neuroimaging Initiative (ADNI2; ADNI-GO). Regression moderation models showed that women— but not men— with NC designation did not show reduced subiculum volumes despite A+. At the eMCI stage, A+ was detrimental across sexes. Findings were significant while accounting for the effects of age, cognition at screening, education, and APOE4 carrier status. These findings suggest that women with A+ have early neural resistance to Alzheimer’s disease-related amyloid burden.
INTRODUCTION
Sex differences have been established in prevalence and rates of decline in Alzheimer’s disease (AD) [1–8], and a growing body of literature shows that sex differences also exist in early resilience to the neural burden of AD. Specifically, researchers have shown that women’s established verbal memory advantage over men [9–12] functions as a form of sex-specific cognitive reserve, affording women equal or better memory performances when compared to men despite positive neuroimaging biomarkers for AD, including mild to moderate levels of hippocampal atrophy [9], hypometabolism on fluorodeoxyglucose (FDG) positive emission tomography (PET) [10], and brain amyloid burden as measured by a positive florbetapir PET (A+) [11, 12].
Beyond cognitive reserve, recent research by our group suggests women may have neural reserve in the face of early AD pathology as indicated by biomarkers. Specifically, we have demonstrated that women— and not men— with A+ and normal cognition (NC) show right hippocampal volumes comparable to women with NC and a negative florbetapir PET study (A–); however, this sex-specific advantage is lost in early mild cognitive impairment (eMCI) [12]. Mechanisms of this proposed sex-based hippocampal reserve remain unclear, but may include a complex host of interactive factors including lifetime neuroprotective effects of estrogen [13, 14], and sex differences in genetic [5, 15], inflammatory [16], metabolic [17], and psychosocial factors [18].
Given the known route of progression of AD pathology through the hippocampus [19], researchers have emphasized the potential importance of examining hippocampal subfield volumes (SV). In particular, Cornu Ammonis 1 (CA1) and subiculum show pathology related to AD first, and changes in these regions also predict conversion to symptomatic AD [20–25]. In addition, subiculum changes have been correlated with cortical amyloid burden [26], and CA1 changes have been linked to memory encoding and retrieval deficits [20, 26–28]. Recent comprehensive reviews show CA1 as most consistently implicated in AD, and CA1 and subiculum in eMCI and individuals at risk for AD; however, findings are not fully consistent across methodologies, and other regions, including CA2, 3, 4, and dentate gyrus, have also been implicated in early disease [29].
The current study extends our previous work with whole hippocampal volumes [12]. In addition to replicating prior whole hippocampus findings with advanced segmentation technology and methods for controlling confounding factors [30–32], we examined whether sex and diagnosis moderate the effects of A+ on hippocampal SV. Specifically, we hypothesized that NC women with A+ would show CA1 and subiculum volumes comparable to NC women with A−. Although the literature has shown more tenuous support for AD-related changes in CA3, CA4, and dentate gyrus, such findings are nonetheless present, and as such we hypothesized that NC women with A+ would also show volumes in these regions comparable to NC women with A−. We hypothesized that this sex-based hippocampal subfield advantage would be lost in eMCI, with A+ effects being detrimental across sexes.
MATERIALS AND METHODS
Participants
ADNI is a longitudinal, multi-site AD biomarkers study. This study was conducted in accordance with guidelines on human experimentation and ethical standards of the Committee on Human Experimentation and approved by local Institutional Review Boards at each participating ADNI site. Participants from ADNI2 (NC n = 178; MCI n = 232) and ADNIGO (MCI n = 110) were selected as described previously [11]. The Alzheimer’s Disease Neuroimaging Initiative (ADNI) required NC participants to have Mini-Mental State Examination (MMSE) [33] scores of 24–30, Clinical Dementia Rating (CDR) [34] of 0, and no memory complaints. ADNI defined early eMCI as including MMSE score of 24–30, CDR of 0.5, CDR memory box score of 0.5 or greater, objective memory loss as assessed by education-adjusted scores on the Wechsler Memory Scale Logical Memory II test (Raw scores = 9–11 for >16 years education; 8–15 for 5–9 years education; 0–7 for 3–6 years education), subjective memory complaint, and not meeting criteria for dementia [35]. ADNI data methodology and associated neuroimaging quality control procedures can be found at http://www.adni-info.org.
Hippocampal image processing
MRI scans were obtained at baseline according to standardized protocol (http://adni.loni.usc.edu/methods/mri-analysis/mri-acquisition/). T1-weighted images (Multiplanar Reconstruction (MPR) or Inversion Recovery-Spoiled Grass (IR-SPGR)) were downloaded from ADNI in Neuroimaging Informatics Technology Initiative (NiFTI) format and were selected among scans within six months of screening. Images were inspected manually for quality assurance, and also met Mayo Clinic quality control documentation guidelines (as described at http://adni.loni.usc.edu/). Hippocampal volume and subfield segmentation and determination of total intracranial volume (TIV) was performed in-house using Freesurfer 6.0 (documented and freely available for download online: http://surfer.nmr.mgh.harvard.edu/) [30, 36–44]. Freesurfer was employed for automated Talairach transformation, removal of non-brain tissue using a hybrid watershed/surface deformation procedure [37], intensity normalization [40], segmentation of the subcortical white matter and deep gray matter volumetric structures (including hippocampus and subfields) [30, 38, 39], tessellation of the gray matter white matter boundary, automated topology correction [42, 45], and surface deformation following intensity gradients to optimally place the gray/white and gray/cerebrospinal fluid borders [44, 46]. Note that subfields of interest available from Freesurfer 6.0 included CA1, subiculum, CA3, CA4, and granule cell/molecular layer/dentate gyrus (latter referred to as dentate gyrus in manuscript).
Present analyses examined left and right total hippocampal volumes (HV) and right subfield volumes (SV), based on significant hemisphere by sex by amyloid status interactions found previously [12]. We adjusted HV and SV for TIV as described previously [12].
Florbetapir PET image processing
We downloaded fully processed baseline visit, 18-F PET binary positivity/negativity images (4×5 minute frames; 50–70 minutes post-injection) from ADNI [47–49]. As described by other research groups, prior to download, images were realigned, averaged, resliced to 1.5 mm3 voxel size, smoothed to 8 mm full width at half maximum, and co-registered to baseline native-space structural MRI scans, which were segmented and parcellated with Freesurfer (Version 5.3.0) to define cortical grey matter regions of interest (frontal, anterior/posterior cingulate, lateral parietal, lateral temporal) [31, 48]. Amyloid positivity was determined by extracting weighted cortical retention means (regional standardized uptake value or SUVRs) from these regions, calculating average SUVR, and dividing by the cerebellum SUVR as a reference (1.11 SUVR ratio threshold) [48, 49].
APOE carrier status
We downloaded fully processed APOE genotype data from ADNI. A binary variable was created, coding individuals as APOE4 carriers (heterozygotes, n = 169; homozygotes, n = 37) or non-carriers.
Clinical measures
We included modified total score on the Montreal Cognitive Assessment (MoCA) [50] as a measure of baseline cognition. In order to create a measure unbiased by memory deficits, points earned for delayed list word recall were excluded, resulting in a maximum score of 25.
Statistical methods
All analyses were performed using Statistical Package for the Social Sciences (SPSS) and the Process Macro [51, 52]. Six participants either failed the Mayo Clinic quality control standards or were not successfully segmented with Freesurfer 6.0, and were excluded, resulting in 520 total participants.
Mann-Whitney U tests examined group differences in demographic control variables. Two moderation regression analyses examined whether sex and diagnosis moderated effects of amyloid status on left and right HV, respectively, in order to replicate prior findings with the latest version of Freesurfer. Based on prior findings showing effects on the right, but not left hippocampus [12], five additional regressions examined moderating effects of sex and diagnosis on amyloid impact on right CA1, CA3, CA4, subiculum, and dentate gyrus. For all analyses, A+ was treated as an independent variable, diagnosis as a moderator, and sex as a secondary moderator. Modified MoCA scores, age at screening, education, and APOE4 carrier status were included as covariates. Continuous covariates were mean-centered; dichotomous covariates were zero-centered.
Statistical model equation for each outcome Y is presented as:
For each of the moderation analyses, outlying and influential data points were defined as those that failed two of three thresholds: 1) Cook’s D, D > 4 / (n – k – 1), where n = number of participants in the analysis, and k = number of predictors; 2) leverage as defined by (2k+2)/n, where n = number of participants in the analysis, and k = number of predictors; and 3) Maholonobis value greater than Chi-square cutoff at p < 0.001 (degrees of freedom = 6).
RESULTS
Demographics
Of 520 participants, 48.3% were women, 232 had A+, 204 were APOE4 carriers, and 342 were diagnosed with eMCI. The average age was 71.3 years (SD = 6.9) and ranged from 55–89 years. Additional demographics and brain volume information by diagnosis, sex, and amyloid status are available in Table 1.
Table 1
Sample characteristics by diagnosis, sex, and amyloid status
| Normal Controls (NC) | ||||
| Women (93) | Men (85) | |||
| Amyloid − | Amyloid + | Amyloid − | Amyloid + | |
| Demographics | ||||
| Number | 59 | 34 | 69 | 16 |
| Age (y) | 70.9 (4.9) | 72.9 (5.1) | 73.4 (6.5) | 76.8 (5.4) |
| Education (y) | 16.1 (2.5) | 15.2 (2.5) | 17.2 (2.2) | 17.4 (2.4) |
| Caucasian (%) | 93.2 | 94.1 | 91.3 | 100 |
| Hispanic (%) | 8.5 | 2.9 | 4.3 | 0 |
| Cognition | ||||
| Modified MoCA | 23.5 (1.5) | 23.5 (1.5) | 23.3 (1.7) | 23.1 (1.4) |
| APOE Carrier Status | ||||
| E4 Carriers | 17 | 17 | 8 | 9 |
| Brain Volumesa | ||||
| L HV | 3020.8 (313.9) | 2979.6 (326.1) | 3291.0 (380.8) | 3104.5 (236.2) |
| R HV | 3139.1 (350.7) | 3108.4 (364.8) | 3427.5 (364.0) | 3138.7 (300.7) |
| L Subiculum | 384.2 (42.3) | 381.6 (49.1) | 423.9 (54.9) | 389.4 (40.9) |
| R Subiculum | 390.0 (46.3) | 388.0 (48.8) | 425.9 (50.7) | 377.8 (39.4) |
| L CA1 | 559.9 (70.3) | 551.0 (70.0) | 616.3 (79.7) | 587.1 (57.3) |
| R CA1 | 588.5 (71.1) | 593.7 (87.4) | 649.8 (81.3) | 603.6 (77.9) |
| L GC/ML/DG | 259.4 (31.2) | 253.0 (30.9) | 278.1 (36.1) | 262.3 (22.6) |
| R GC/ML/DG | 272.3 (36.9) | 265.7 (35.6) | 295.5 (37.1) | 272.1 (30.4) |
| L CA3 | 182.0 (26.9) | 180.5 (28.1) | 195.5 (28.6) | 191.8 (20.6) |
| R CA3 | 201.7 (31.9) | 197.3 (32.2) | 220.3 (30.9) | 210.3 (28.5) |
| L CA4 | 224.8 (26.3) | 221.1 (24.7) | 240.4 (30.7) | 229.3 (18.1) |
| R CA4 | 235.9 (31.1) | 231.5 (29.8) | 255.7 (31.3) | 236.9 (25.0) |
| TIV | 1.38×10⁶ (1.10×10⁵) | 1.40×10⁶ (1.34×10⁵) | 1.57×10⁶ (1.36×10⁵) | 1.60×10⁶ (1.37×10⁵) |
| Early Mild Cognitive Impairment (eMCI) | ||||
| Women (158) | Men (184) | |||
| Amyloid − | Amyloid + | Amyloid − | Amyloid + | |
| Demographics | ||||
| Number | 75 | 83 | 85 | 99 |
| Age (y) | 69.0 (8.1) | 70.6 (7.6) | 68.9 (7.3) | 73.1 (5.6) |
| Education (y) | 15.8 (2.4) | 15.8 (2.9) | 16.7 (2.6) | 16.3 (2.8) |
| Caucasian (%) | 88 | 92.8 | 90.6 | 99 |
| Hispanic (%) | 6.7 | 3.6 | 4.7 | 2 |
| Cognition | ||||
| Modified MoCA | 22.6 (2.1) | 22.0 (2.3) | 22.5 (2.1) | 21.9 (2.5) |
| APOE Carrier Status | ||||
| E4 Carriers | 17 | 53 | 21 | 62 |
| Brain Volumesa | ||||
| L HV | 2984.1 (387.1) | 2777.6 (376.5) | 3202.5 (447.8) | 2973.6 (430.5) |
| R HV | 3089.2 (412.5) | 2843.1 (416.4) | 3338.8 (465.1) | 3129.1 (411.3) |
| L Subiculum | 381.9 (58.5) | 355.1 (55.3) | 407.2 (64.4) | 375.4 (63.2) |
| R Subiculum | 383.5 (64.6) | 351.8 (59.5) | 408.5 (64.1) | 378.9 (59.8) |
| L CA1 | 548.5 (68.7) | 513.1 (70.5) | 599.7 (88.2) | 571.1 (80.3) |
| R CA1 | 579.5 (77.5) | 533.0 (78.3) | 637.2 (96.0) | 603.6 (79.3) |
| L GC/ML/DG | 254.7 (34.0) | 236.8 (36.0) | 272.1 (40.8) | 254.1 (39.5) |
| R GC/ML/DG | 270.7 (38.7) | 247.3 (39.5) | 291.5 (42.8) | 277.1 (36.9) |
| L CA3 | 176.3 (25.3) | 167.6 (26.5) | 194.1 (29.8) | 184.2 (33.1) |
| R CA3 | 199.3 (33.5) | 183.5 (32.4) | 217.5 (36.8) | 211.2 (32.3) |
| L CA4 | 220.9 (27.5) | 207.0 (30.1) | 237.5 (33.3) | 222.3 (32.7) |
| R CA4 | 234.2 (32.0) | 215.7 (33.3) | 252.7 (35.4) | 242.8 (31.2) |
| TIV | 1.41×10⁶ (1.52×10⁵) | 1.39×10⁶ (1.37×10⁵) | 1.60×10⁶ (1.36×10⁵) | 1.62×10⁶ (1.52×10⁵) |
Note: Mean (SD) shown for continuous variables. aRaw, uncorrected volume values in mm3. MoCA, Montreal Cognitive Assessment; APOE, apolipoprotein E; HV, hippocampal volume; L, left; R, right; CA, cornu ammonis; GC, granule cell layer; ML, molecular layer; DG, dentate gyrus; TIV, total intracranial volume.
Mann-Whitney tests showed that for NC, men were significantly older, p = 0.01, more educated, p < 0.001, and more often APOE4 carriers p = 0.02 than women. For eMCI, men were also significantly older, p = 0.04 and more educated, p = 0.02 than women. There were no sex differences in modified MoCA score for NC or eMCI.
Mann-Whitney tests showed that for NC, individuals with A+ were significantly older, p = 0.04, less educated, p = 0.05, and more frequently APOE4 carriers, p < 0.001 than A−. No differences based on A+ were observed in modified MoCA scores for NC. For eMCI, individuals with A+ were significantly older, p < 0.001, had lower modified MoCA scores, p = 0.02, and were more often APOE4 carriers, p < 0.001 than A−. No differences based on A+ were observed in education for eMCI.
Sex moderation of diagnosis and amyloid status effects on hippocampal total and subfield volume
Total hippocampal volume
In a replication of prior work with new techniques, the model with A+, diagnosis, sex, and their interactions predicting left HV was significant, F(11, 505) = 17.80; p < 0.001; R2 = 0.29, yet the three-way interaction of A+, diagnosis, and sex was not significant, t(505) = −1.09, p = 0.27, indicating no moderating effects of sex and diagnosis on A+ effects for the left HV. Also replicating prior results, the model with A+, diagnosis, sex, and their interactions predicting right HV was significant, F(11, 505) = 18.10; p < 0.001; R2 = 0.28, and the three-way interaction of A+, diagnosis, and sex was also significant, showing sex moderated the effects of diagnosis and A+ on right HV, t(505) = −2.02, p = 0.04. Parsing this interactive effect indicated that there were differences in the interactive effects of sex and amyloid status on right hippocampus volume in NC t(505) = 1.95, p = 0.05, but not eMCI t(505) = −0.77, p = 0.44. Specifically, there was no relationship of A+ to HV in NC women t(505) = −0.15, p = 0.88, but A+ related to smaller right HV in NC men t(505) = −2.44, p = 0.02. At the eMCI stage, A+ appeared to have a detrimental effect on right HV regardless of sex (men: t(505) = −1.64, p = 0.10; women t(505) = −2.78, p = 0.01). See Table 2 and Figs. 1A and 2A.
Table 2
Summary of regression moderation analyses for left and right hippocampus and right subfield volume outcomes (N = 520)
| Variable | Left Hippocampus | |||
| B | p | 95% Confidence Interval | ||
| Amyloid PET Positivity (A+) | −105.474 | 0.002 | −171.956 | −38.992 |
| Diagnosis | −128.397 | 0.0001 | −190.539 | −66.256 |
| Sex | −62.661 | 0.043 | −123.325 | −1.997 |
| A+×Diagnosis×Sex | −131.935 | 0.275 | −369.027 | 105.157 |
| A+×Diagnosis | −53.209 | 0.377 | −171.326 | 64.907 |
| A+×Sex | 54.453 | 0.358 | −61.896 | 170.802 |
| Diagnosis×Sex | −47.715 | 0.43 | −166.427 | 70.998 |
| Age | −22.373 | <0.0001 | −27.119 | −17.626 |
| Education | 2.159 | 0.717 | −9.514 | 13.833 |
| Modified MoCA | 32.95 | <0.0001 | 18.655 | 47.244 |
| APOE4 Carrier Status | −5.234 | 0.883 | −74.798 | 64.33 |
| Variable | Right Hippocampus | |||
| B | p | 95% Confidence Interval | ||
| Amyloid PET Positivity (A+) | −125.602 | 0.001 | −200.745 | −50.46 |
| Diagnosis | −119.442 | 0.001 | −191.152 | −47.732 |
| Sex | −70.393 | 0.049 | −140.513 | −0.272 |
| A+×Diagnosis×Sex | −279.86 | 0.044 | −552.656 | −7.065 |
| A+×Diagnosis | −14.367 | 0.837 | −151.412 | 122.678 |
| A+×Sex | 76.974 | 0.266 | −58.725 | 212.674 |
| Diagnosis×Sex | −115.019 | 0.101 | −252.623 | 22.586 |
| Age | −22.702 | <0.0001 | −27.659 | −17.746 |
| Education | −6.647 | 0.288 | −18.926 | 5.633 |
| Modified MoCA | 31.886 | 0.0001 | 15.846 | 47.927 |
| APOE4 Carrier Status | −33.041 | 0.375 | −106.172 | 40.089 |
| Variable | Right Subiculum | |||
| B | p | 95% Confidence Interval | ||
| Amyloid PET Positivity (A+) | −16.199 | 0.003 | −26.948 | −5.45 |
| Diagnosis | −17.937 | 0.0006 | −28.162 | −7.713 |
| Sex | −9.603 | 0.054 | −19.379 | 0.173 |
| A+×Diagnosis×Sex | −42.895 | 0.033 | −82.367 | −3.423 |
| A+×Diagnosis | −1.78 | 0.86 | −21.549 | 17.989 |
| A+×Sex | 16.042 | 0.105 | −3.388 | 35.471 |
| Diagnosis×Sex | −11.939 | 0.238 | −31.799 | 7.921 |
| Age | −2.853 | <0.0001 | −3.579 | −2.128 |
| Education | −0.963 | 0.314 | −2.839 | 0.913 |
| Modified MoCA | 3.972 | 0.0009 | 1.638 | 6.306 |
| APOE4 Carrier Status | −9.156 | 0.093 | −19.85 | 1.538 |
| Variable | Right CA1 | |||
| B | p | 95% Confidence Interval | ||
| Amyloid PET Positivity (A+) | −18.657 | 0.025 | −34.958 | −2.356 |
| Diagnosis | −22.802 | 0.005 | −38.743 | −6.86 |
| Sex | −21.379 | 0.007 | −36.94 | −5.818 |
| A+×Diagnosis×Sex | −55.788 | 0.067 | −115.54 | 3.967 |
| A+×Diagnosis | −15.027 | 0.329 | −45.257 | 15.202 |
| A+×Sex | 14.284 | 0.348 | −15.597 | 44.166 |
| Diagnosis×Sex | −33.353 | 0.03 | −63.448 | −3.258 |
| Age | −3.265 | <0.0001 | −4.279 | −2.251 |
| Education | −0.948 | 0.48 | −3.584 | 1.688 |
| Modified MoCA | 5.098 | 0.003 | 1.769 | 8.426 |
| APOE4 Carrier Status | −6.82 | 0.384 | −22.198 | 8.559 |
| Variable | Right GC/ML/DG | |||
| B | p | 95% Confidence Interval | ||
| Amyloid PET Positivity (A+) | −11.867 | 0.001 | −19.087 | −4.648 |
| Diagnosis | −5.17 | 0.142 | −12.07 | 1.731 |
| Sex | −9.548 | 0.006 | −16.275 | −2.821 |
| A+×Diagnosis×Sex | −22.562 | 0.089 | −48.611 | 3.49 |
| A+×Diagnosis | −1.127 | 0.865 | −14.168 | 11.914 |
| A+×Sex | 1.188 | 0.858 | −11.836 | 14.212 |
| Diagnosis×Sex | −10.969 | 0.101 | −24.072 | 2.134 |
| Age | −1.671 | <0.0001 | −2.139 | −1.203 |
| Education | −0.679 | 0.259 | −1.859 | 0.502 |
| Modified MoCA | 3.699 | <0.0001 | 2.086 | 5.311 |
| APOE4 Carrier Status | 0.04 | 0.991 | −6.979 | 7.06 |
| Variable | Right CA3 | |||
| B | p | 95% Confidence Interval | ||
| Amyloid PET Positivity (A+) | −8.18 | 0.015 | −14.75 | −1.61 |
| Diagnosis | −3.026 | 0.326 | −9.075 | 3.023 |
| Sex | −7.11 | 0.018 | −13.014 | −1.206 |
| A+×Diagnosis×Sex | −13.056 | 0.265 | −36.04 | 9.928 |
| A+×Diagnosis | −2.195 | 0.706 | −13.603 | 9.213 |
| A+×Sex | −2.07 | 0.722 | −13.51 | 9.369 |
| Diagnosis×Sex | −9.438 | 0.108 | −20.95 | 2.075 |
| Age | −0.707 | 0.0006 | −1.11 | −0.303 |
| Education | −0.07 | 0.898 | −1.141 | 1.001 |
| Modified MoCA | 2.842 | 0.0001 | 1.461 | 4.223 |
| APOE4 Carrier Status | 3.786 | 0.246 | −2.619 | 10.191 |
| Variable | Right CA4 | |||
| B | p | 95% Confidence Interval | ||
| Amyloid PET Positivity (A+) | −9.573 | 0.003 | −15.783 | −3.364 |
| Diagnosis | −3.596 | 0.225 | −9.412 | 2.22 |
| Sex | −7.726 | 0.008 | −13.46 | −1.992 |
| A+×Diagnosis×Sex | −20.095 | 0.075 | −42.246 | 2.057 |
| A+×Diagnosis | −0.594 | 0.916 | −11.615 | 10.428 |
| A+×Sex | 1.228 | 0.827 | −9.834 | 12.29 |
| Diagnosis×Sex | −10.412 | 0.067 | −21.534 | 0.71 |
| Age | −1.189 | <0.0001 | −1.588 | −0.789 |
| Education | −0.55 | 0.28 | −1.549 | 0.449 |
| Modified MoCA | 2.918 | <0.0001 | 1.548 | 4.289 |
| APOE4 Carrier Status | 0.845 | 0.782 | −5.149 | 6.839 |
Note: Age, education, and modified MoCA scores were centered at their means. Dichotomous variables were centered around zero. PET, positron emission tomography; A+, positive amyloid PET scan; MoCA, Montreal Cognitive Assessment; APOE, apolipoprotein E; CA, cornu ammonis; GC, granule cell layer; ML, molecular layer; DG, dentate gyrus. Left Hippocampus model R = 0.539, p < 0.0001. Right Hippocampus model R = 0.525, p < 0.0001. Right subiculum model R = 0.481, p < 0.0001. Right CA1 model R = 0.440, p < 0.0001. Right GC/ML/DG model R = 0.472, p < 0.0001. Right CA3 model R = 0.347, p < 0.0001. Right CA4 model R = 0.433, p < 0.0001.
Fig. 1
Sex moderation of diagnosis and amyloid status effects. Sex moderates effects of diagnosis and Florbetapir PET amyloid positivity (A+) on right whole hippocampal volume (A), and right subiculum (B). Specifically, normal control (NC) women with A+ show whole and subfield volumes more comparable to NC women with a negative amyloid PET (A−), while NC men do not. At the early mild cognitive impairment (eMCI) stage, effects of A+ on total and subfield volume did not differ by sex, but generally related to smaller volumes across participants. A–, 18F-PET amyloid negative; A+, 18F-PET amyloid positive. For ease of viewing, hippocampus and subfield volume units are raw, uncorrected, in milimeters3.
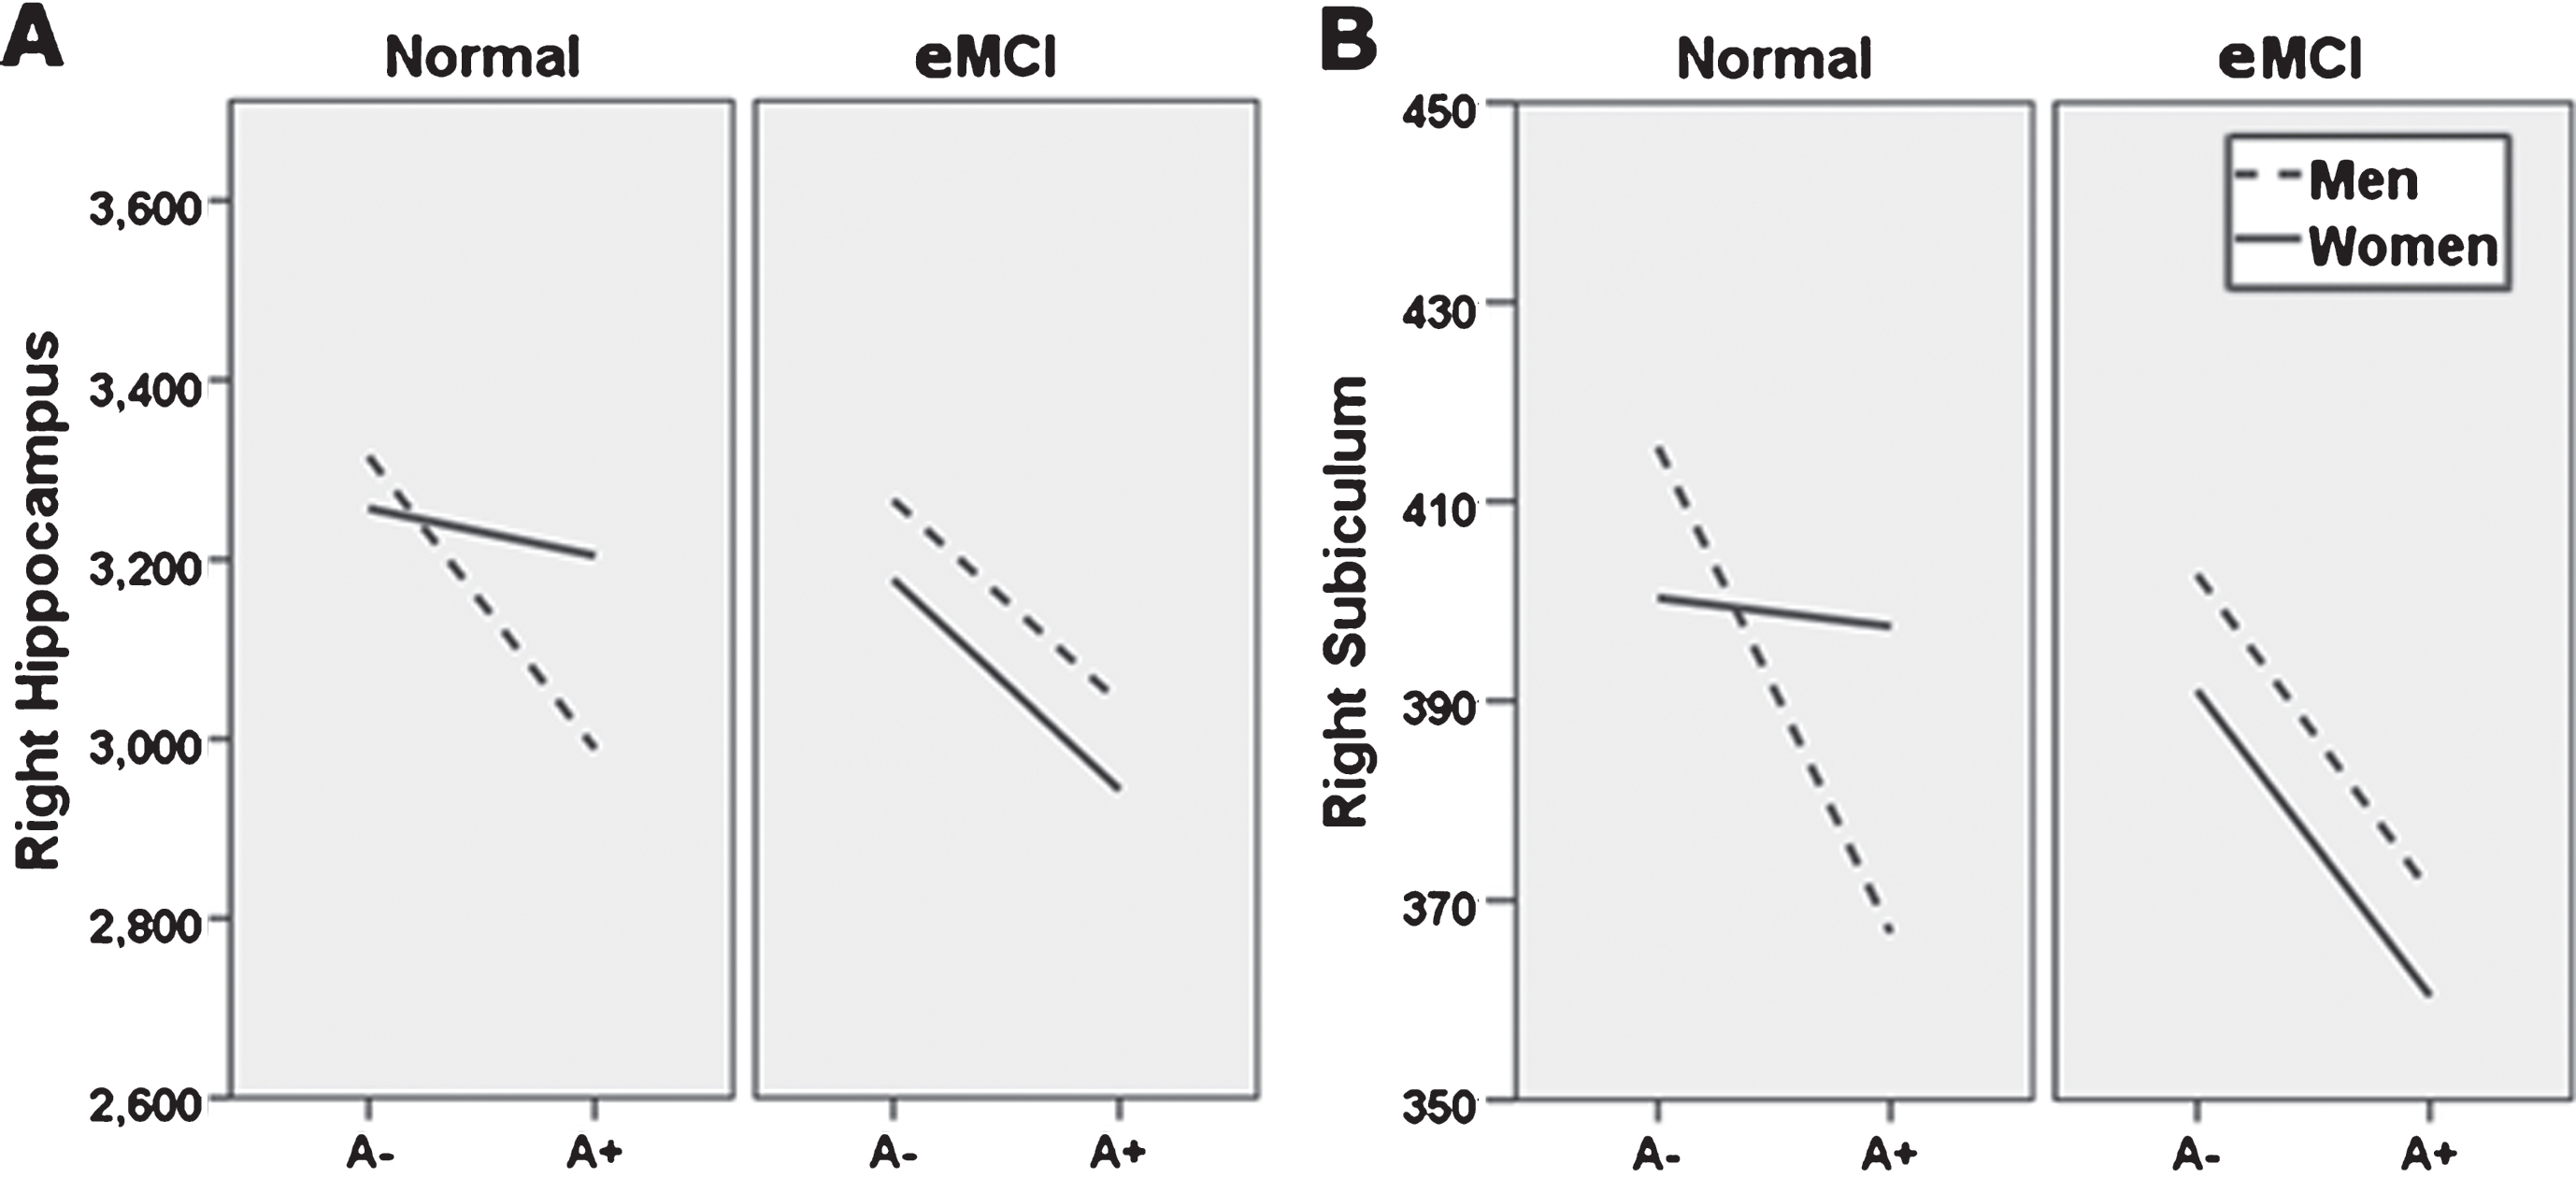
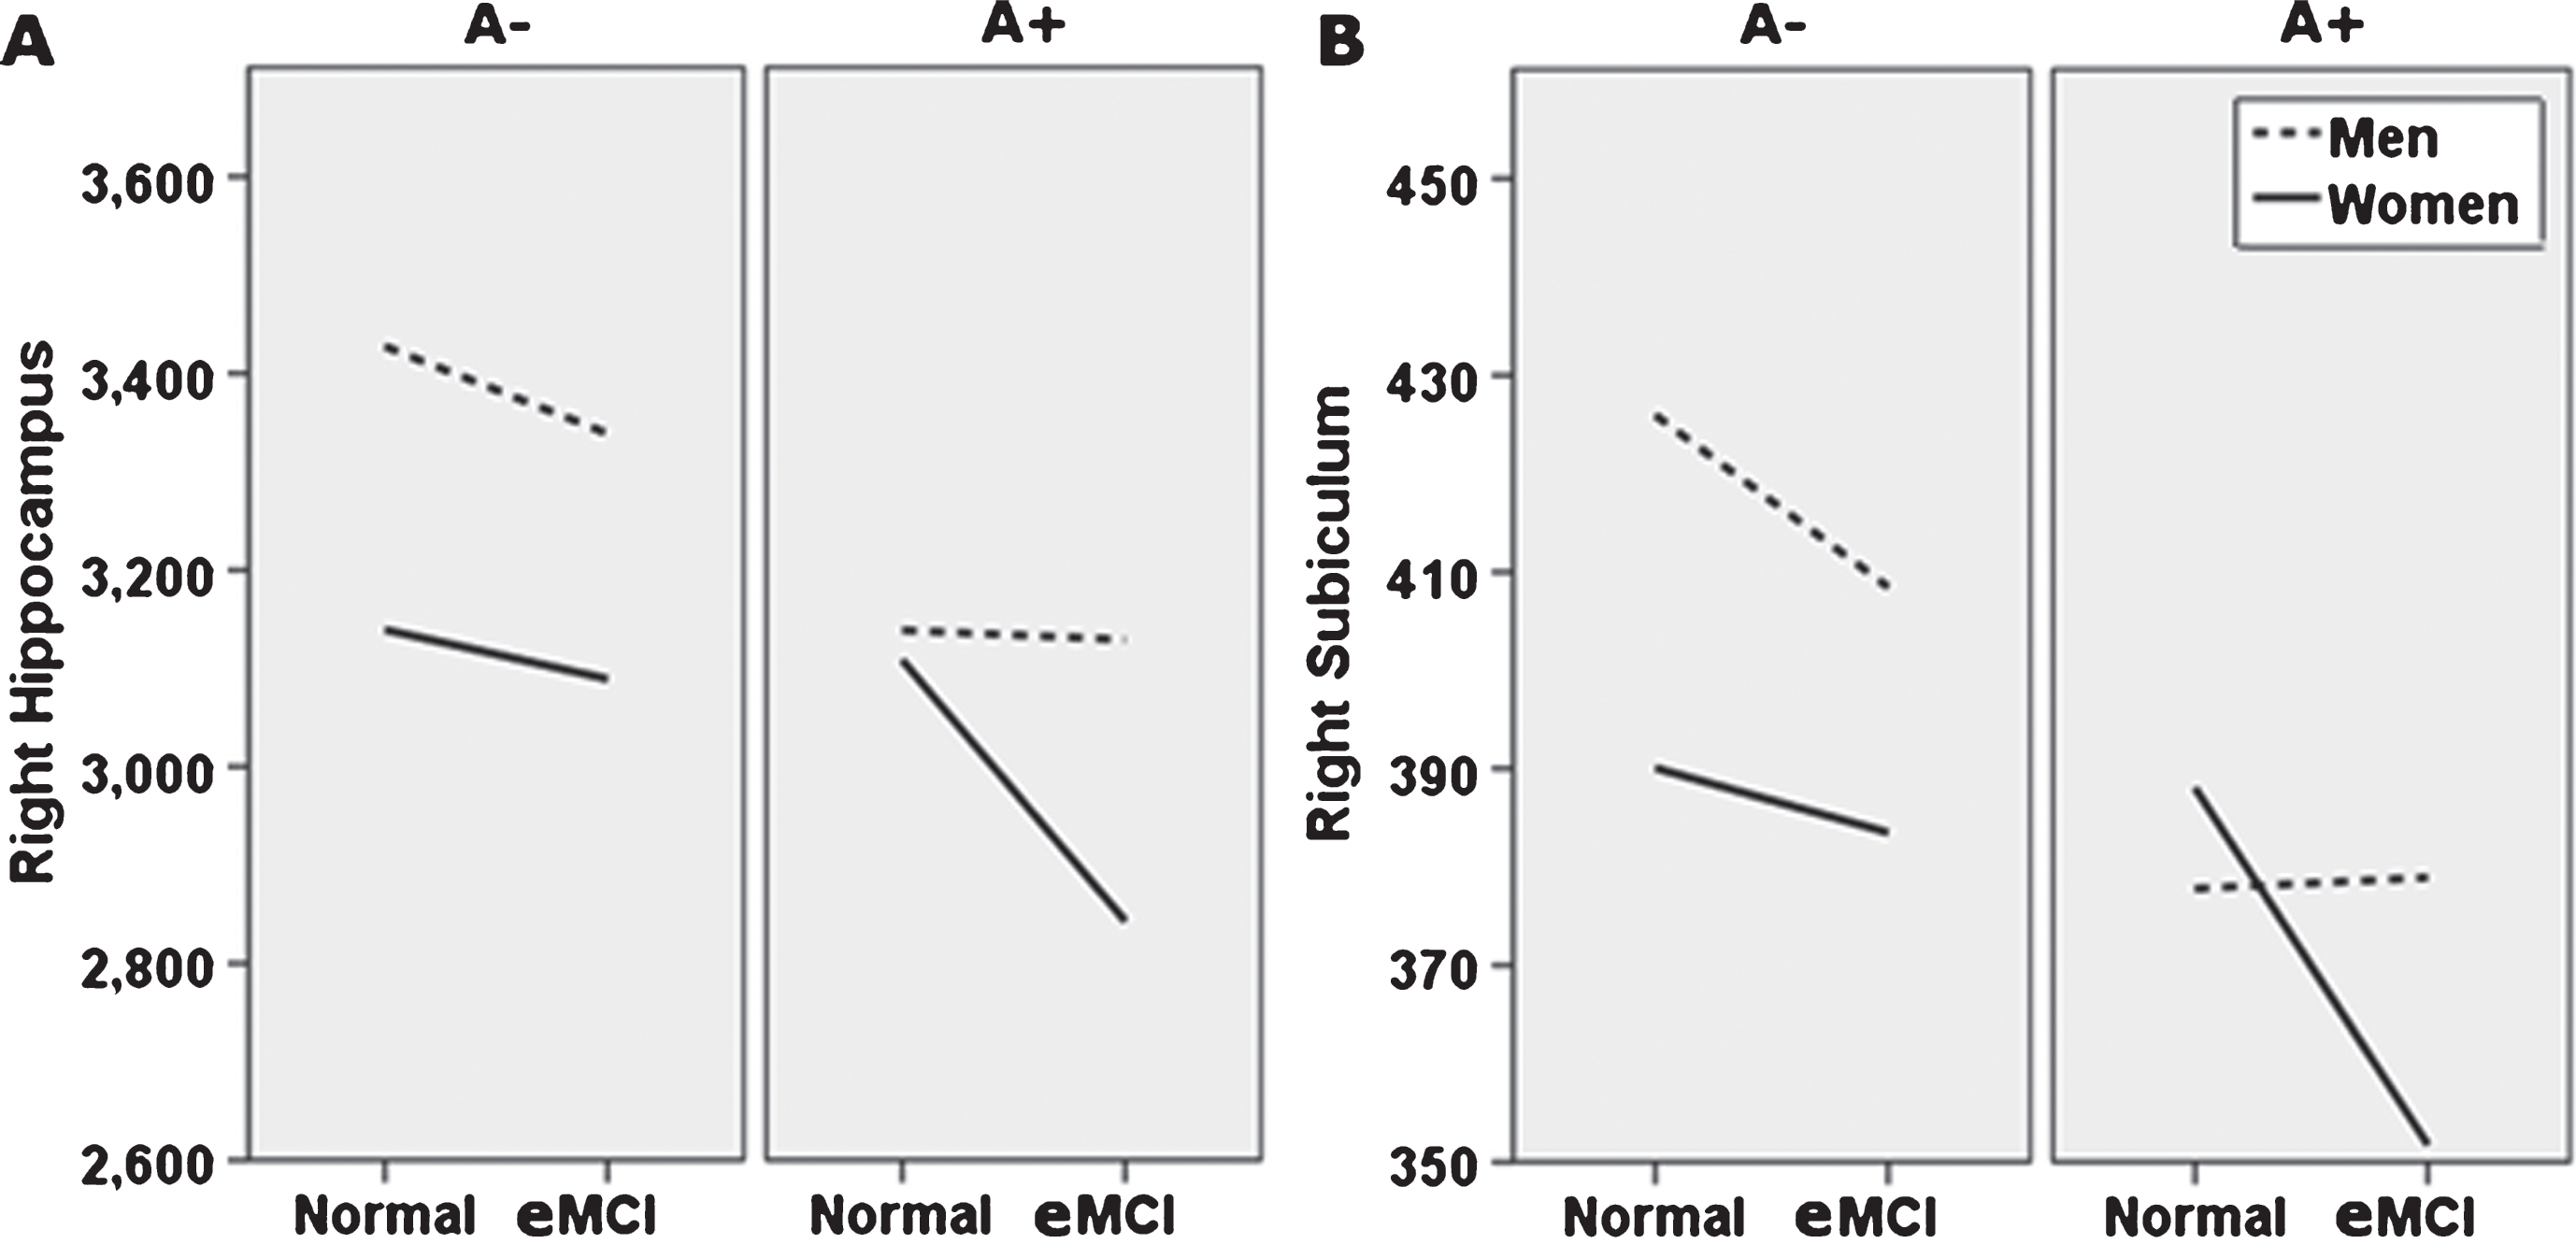
Fig. 2
Alternate presentation of sex moderation of diagnosis and amyloid status effects (breakdown by amyloid status). Sex moderates effects of diagnosis and Florbetapir PET amyloid positivity (A+) on right whole hippocampal volume (A), and right subiculum (B). Specifically, normal control (NC) women with A+ show whole and subfield volumes more comparable to NC women with a negative amyloid PET (A−), while NC men do not. At the early mild cognitive impairment (eMCI) stage, effects of A+ on total and subfield volume did not differ by sex, but generally related to smaller volumes across participants. Although not directly tested in this analysis, as shown, this figure also suggests that for A+ individuals, receiving an eMCI diagnosis is related to smaller volumes, specifically in women. A–, 18F-PET amyloid negative; A+, 18F-PET amyloid positive. For ease of viewing, hippocampus and subfield volume units are raw, uncorrected, in milimeters3.
Subfield volume
Following the significant right HV analysis, right hippocampal SV analyses showed the model for right subiculum was significant, F(11, 505) = 13.44; p < 0.001; R2 = 0.23, and the sex by diagnosis by amyloid status interaction was also significant, t(505) = −2.14, p = 0.03. Parsing the interaction showed sex differences in the effect of A+ on subiculum volume in NC participants t(505) = 2.38, p = 0.02. Specifically, there was no relationship of A+ to subiculum volume in NC women t(505) = 0.35, p = 0.73, but A+ related to smaller subiculum volumes in NC men t(505) = −2.67, p = 0.01. Similar to findings for the whole right hippocampus, the interaction of sex and amyloid status was not significant in eMCI t(505) = −0.44, p = 0.66, but rather suggested that A+ is linked to smaller subiculum volumes in eMCI regardless of sex (men: t(505) = −1.64, p = 0.10; women: t(505) = −2.17, p = 0.03). See Table 2 and Figs. 1B and 2B.
While regression models were significant for the remaining SV (p < 0.001), sex by diagnosis by amyloid status interaction effects for these subfields were either at trend-level (right CA1, t(505) = −1.83, p = 0.07; right CA4, t(505) = −1.78, p = 0.08; right dentate gyrus, t(505) = −1.70, p = 0.09) or not significant (right CA3, t(505) = −1.12, p = 0.27). Within subfields showing trend-level three-way interactions, the pattern of findings was similar to the effect pattern for the subiculum (i.e., trends toward greater impact of A+ on SV in NC men than NC women, and general detrimental effects of A+ in eMCI across sexes). See Table 2.
DISCUSSION
The current study examined whether sex and diagnosis moderate impact of amyloid positivity on hippocampal subfield volume. We hypothesized NC women with A+ would show hippocampal subfield volumes comparable to those in NC women with A– in right CA1, subiculum, CA3, CA4, and dentate gyrus, implying resistance to early impact of disease, but that A+ status would be associated with smaller right SV across sexes in eMCI. This prediction was partially supported; sex and diagnosis significantly moderated amyloid and diagnosis effects on right subiculum, and trends were observed for right CA1, CA4, and dentate gyrus. Specifically, NC men with A+ showed significantly smaller subiculum volume than their A– counterparts, while this effect was not seen in NC women. At the eMCI stage, A+ was associated with smaller subiculum volume regardless of sex. Trend level results for the CA1, CA4, and dentate gyrus followed a similar pattern (i.e., NC men with A+ showed SV that were smaller than NC men with A–, but this effect was not observed in NC women; individuals with eMCI and A+ showed smaller SV than individuals with eMCI and A–, regardless of sex). Effects were observed while accounting for effects of baseline cognitive status, age, education, APOE4 carrier status, and total brain volume.
The present findings suggest women have neural reserve at the level of the subiculum, a hippocampal subfield impacted very early in the progression of AD pathology. Specifically, we demonstrated that subiculum volume in women appears to resist effects of, or be maintained despite presence of, A+ at the NC stage. In other words, women with NC, but high likelihood of developing AD (i.e., A+), have subiculum volumes that are consistent with those of healthy women. On the other hand, men with NC and increased likelihood for AD (i.e., A+) show smaller subiculum volumes than healthy men, even before impairments are noted on formal memory measures. Combined with recent research supporting memory reserve for women with fewer prodromal AD traits [9–12], the present results suggest that examining memory and hippocampal volume may more sensitively identify men than women at risk for future decline, though recent research additionally suggests that looking at changes in hippocampal volume over time may assist with prediction of AD in women [53]. This has important implications for both clinical decision making and selection and outcome measures in clinical trials.
The mechanism for sex effects on rates of hippocampal atrophy remains unclear and is an area for future study. One avenue to consider is that while estrogen loss at menopause and certain hormone therapy approaches have been examined as a risk factor for cognitive decline (for a review, see [54]), it has been more difficult to consider the earlier protective effects of estrogen and how those may play out, or interact with sexually dimorphic inflammatory [16] and metabolic factors [17]. In addition, much recent research has suggested the importance of both creating higher-level risk categories combining across biomarkers and controlling for comorbid risks, such as APOE4 carrier status, [15] age [55, 56], education, and lifestyle factors (e.g., exercise, smoking, and alcohol use). As many of these factors differ by sex, the present results emphasize that sex should be considered in these types of analyses. Recent research also suggests that examining the hippocampus from an anterior-to-posterior perspective combined with anatomical labeling may yield additional information [57].
Strengths of the present study include a relatively large, well-characterized study sample, use of the latest hippocampal segmentation technology [30], and rigorous control of potential confound variables according to recent field recommendations [15, 31, 32, 54, 56]. At the same time, all methods of segmentation are vulnerable to errors, particularly with single anatomical images without very high resolution (i.e., greater than 3T as employed here). Future studies should replicate these findings with multiple images and at higher field strength, and with complementary methods for examining hippocampal structure, such as shape and radial distance analyses. In addition, the ADNI sample includes highly educated individuals with a restricted range of education; replication in other, more representative samples will be important. It also will be essential to examine sex differences in AD biomarkers longitudinally, to facilitate understanding of when exactly— or how much— pathology leads to cognitive, atrophic, and clinical symptom expression. Moreover, while the current investigation found significant three-way interactions representing an important preliminary finding, replication in larger samples will be necessary to ascertain that effects observed here are stable, truly sex-specific, and lateralized outside of the present sample, as well as to explore whether other subfields might reach significance. Additional investigation of the effects of estrogen levels and hormone replacement therapy will also be important in the future.
In sum, the present study provides additional evidence that in the face of AD, women have early neural reserve at the level of the hippocampus, and subiculum in particular. Findings were seen in a large sample, with the latest segmentation technology, and field-standard methods for controlling for potential confounds. If replicated in other samples and with other methods, early reserve for women in memory and hippocampal integrity could suggest need for changes in how and when women are screened for early signs of AD and how their progress is measured in clinical trials.
ACKNOWLEDGMENTS
We thank Christopher Bird for assistance with data aggregation and Freesurfer processing, and the ADNI investigators for their host of contributions.
The Alzheimer’s Disease Neuroimaging Initiative (ADNI) (National Institutes of Health Grant U01 AG024904) and DOD ADNI (Department of Defense award number W81XWH-12-2 0012). ADNI is funded by the National Institute on Aging, the National Institute of Biomedical Imaging and Bioengineering, and through generous contributions from the following: AbbVie, Alzheimer’s Association; Alzheimer’s Drug Discovery Foundation; Araclon Biotech; BioClinica, Inc.; Biogen; Bristol-Myers Squibb Company; CereSpir, Inc.; Eisai Inc.; Elan Pharmaceuticals, Inc.; Eli Lilly and Company; EuroImmun; F. Hoffmann-La Roche Ltd and its affiliated company Genentech, Inc.; Fujirebio; GE Healthcare; IXICO Ltd.; Janssen Alzheimer Immunotherapy Research & Development, LLC.; Johnson & Johnson Pharmaceutical Research & Development LLC.; Lumosity; Lundbeck; Merck & Co., Inc.; Meso Scale Diagnostics, LLC.; NeuroRx Research; Neurotrack Technologies; Novartis Pharmaceuticals Corporation; Pfizer Inc.; Piramal Imaging; Servier; Takeda Pharmaceutical Company; and Transition Therapeutics. The Canadian Institutes of Health Research is providing funds to support ADNI clinical sites in Canada. Private sector contributions are facilitated by the Foundation for the National Institutes of Health (http://www.fnih.org). The grantee organization is the Northern California Institute for Research and Education, and the study is coordinated by the Alzheimer’s Disease Cooperative Study at the University of California, San Diego. ADNI data are disseminated by the Laboratory for Neuro Imaging at the University of Southern California.
Research reported in this publication was supported by an Institutional Development Award (IDeA) from the National Institute of General Medical Sciences of the National Institutes of Health under grant number 5P20GM109025. In addition, research reported in this publication was supported in part by a grant from The Women’s Alzheimer’s Movement/Maria Shriver to Drs. Banks and Caldwell.
Authors’ disclosures available online (https://www.j-alz.com/manuscript-disclosures/18-0028r2).
REFERENCES
[1] | Hebert LE , Weuve J , Scherr PA , Evans DA . ((2013) ) Alzheimer disease in the United States (2010-2050) estimated using the 2010 census. Neurology 80: , 1778–1783. |
[2] | Nosheny RL , Insel PS , Truran D , Schuff N , Jack CR Jr , Aisen PS , Shaw LM , Trojanowski JQ , Weiner MW , Alzheimer’s Disease Neuroimaging Initiative ((2015) ) Variables associated with hippocampal atrophy rate in normal aging and mild cognitive impairment. Neurobiol Aging 36: , 273–282. |
[3] | Koran MEI , Wagener M , Hohman TJ , Alzheimer’s Disease Neuroimaging Initiative ((2017) ) Sex differences in the association between AD biomarkers and cognitive decline. Brain Imaging Behav 11: , 205–213. |
[4] | Ardekani BA , Convit A , Bachman AH . ((2016) ) Analysis of the MIRIAD data shows sex differences in hippocampal atrophy progression. J. Alzheimers Dis 50: , 847–857. |
[5] | Jack CR , Wiste HJ , Weigand SD , Knopman DS , Vemuri P , Mielke MM , Lowe V , Senjem ML , Gunter JL , Machulda MM , Gregg BE , Pankratz VS , Rocca WA , Petersen RC . ((2015) ) Age, sex, and APOE ɛ4 effects on memory, brain structure, and β-amyloid across the adult life span. JAMA Neurol 72: , 511–519. |
[6] | McCarrey AC , An Y , Kitner-Triolo MH , Ferrucci L , Resnick SM . ((2016) ) Sex differences in cognitive trajectories in clinically normal older adults. Psychol Aging 31: , 166–175. |
[7] | Murre JMJ , Janssen SMJ , Rouw R , Meeter M . ((2013) ) The rise and fall of immediate and delayed memory for verbal and visuospatial information from late childhood to late adulthood. Acta Psychol (Amst) 142: , 96–107. |
[8] | Munro CA , Winicki JM , Schretlen DJ , Gower EW , Turano KA , Muñoz B , Keay L , Bandeen-Roche K , West SK . ((2012) ) Sex differences in cognition in healthy elderly individuals. Aging Neuropsychol Cogn 19: , 759–768. |
[9] | Sundermann EE , Biegon A , Rubin LH , Lipton RB , Mowrey W , Landau S , Maki PM , Weiner M , Aisen P , Petersen R , Jack CR . ((2016) ) Better verbal memory in women than men in MCI despite similar levels of hippocampal atrophy. Neurology 86: , 1368–1376. |
[10] | Sundermann EE , Maki PM , Rubin LH , Lipton RB , Landau S , Biegon A , Alzheimer’s Disease Neuroimaging Initiative ((2016) ) Female advantage in verbal memory: Evidence of sex-specific cognitive reserve. Neurology 87: , 1916–1924. |
[11] | Sundermann EE , Biegon A , Rubin LH , Lipton RB , Landau S , Maki PM . ((2017) ) Does the female advantage in verbal memory contribute to underestimating Alzheimer’s disease pathology in women versus men?. J Alzheimers Dis 56: , 947–957. |
[12] | Caldwell JZK , Berg J-L , Cummings JL , Banks SJ . ((2017) ) Moderating effects of sex on the impact of diagnosis and amyloid positivity on verbal memory and hippocampal volume. Alzheimers Res Ther 9: , 72–82. |
[13] | Goodman Y , Bruce AJ , Cheng B , Mattson MP . ((2002) ) Estrogens attenuate and corticosterone exacerbates excitotoxicity, oxidative injury, and amyloid β-peptide toxicity in hippocampal neurons. J Neurochem 66: , 1836–1844. |
[14] | Pike CJ . ((2001) ) Estrogen modulates neuronal Bcl-xl expression and β-amyloid-induced apoptosis. J Neurochem 72: , 1552–1563. |
[15] | Neu SC , Pa J , Kukull W , Beekly D , Kuzma A , Gangadharan P , Wang L-S , Romero K , Arneric SP , Redolfi A , Orlandi D , Frisoni GB , Au R , Devine S , Auerbach S , Espinosa A , Boada M , Ruiz A , Johnson SC , Koscik R , Wang J-J , Hsu W-C , Chen Y-L , Toga AW . ((2017) ) Apolipoprotein E genotype and sex risk factors for Alzheimer disease. JAMA Neurol 74: , 1178–1189. |
[16] | Mangold CA , Wronowski B , Du M , Masser DR , Hadad N , Bixler GV , Brucklacher RM , Ford MM , Sonntag WE , Freeman WM . ((2017) ) Sexually divergent induction of microglial-associated neuroinflammation with hippocampal aging. J Neuroinflammation 14: , 141. |
[17] | Zhao L , Mao Z , Woody SK , Brinton RD . ((2016) ) Sex differences in metabolic aging of the brain: Insights into female suscetibility to Alzheimer’s disease. Neurobiol Aging 42: , 69–79. |
[18] | Mielke MM , Vemuri P , Rocca WA . ((2014) ) Clinical epidemiology of Alzheimer’s disease: Assessing sex and gender differences. Clin Epidemiol 6: , 37–48. |
[19] | Braak H , Braak E . ((1991) ) Neuropathological stageing of Alzheimer-related changes. Acta Neuropathol 82: , 239–259. |
[20] | Fouquet M , Desgranges B , Joie La R , Rivière D , Mangin J-F , Landeau B , Mézenge F , Pélerin A , De V , Sayette L , Viader F . ((2012) ) Role of hippocampal CA1 atrophy in memory encoding deficits in amnestic Mild Cognitive Impairment. Role of hippocampal CA1 atrophy in memory encoding deficits in amnestic Mild Cognitive Im- pairment. Neuroimage 5911: , 3309–3315. |
[21] | La Joie R , Perrotin A , de La Sayette V , Egret S , Doeuvre L , Belliard S , Eustache F , Desgranges B , Chetalat G . ((2013) ) Hippocampal subfield volumetry in mild cognitive impairment, Alzheimer’s disease and antic dementia. Neuroimage Clin 3: , 155–162. |
[22] | Mak E , Gabel S , Su L , Williams GB , Arnold R , Passamonti L , Vazquez Rodríguez P , Surendranathan A , Bevan-Jones WR , Rowe JB , O’Brien JT . ((2017) ) Multi-modal MRI investigation of volumetric and microstructural changes in the hippocampus and its subfields in mild cognitive impairment, Alzheimer’s disease, and dementia with Lewy bodies. Int Psychogeriatrics 29: , 545–555. |
[23] | Mueller SG , Schuff N , Yaffe K , Madison C , Miller B , Weiner MW . ((2010) ) Hippocampal atrophy patterns in mild cognitive impairment and Alzheimer’s disease. Hum Brain Mapp 31: , 1339–1347. |
[24] | Apostolova LG , Mosconi L , Thompson PM , Green AE , Hwang KS , Ramirez A , Mistur R , Tsui WH , de Leon MJ . ((2010) ) Subregional hippocampal atrophy predicts Alzheimer’s dementia in the cognitively normal. Neurobiol Aging 31: , 1077–1088. |
[25] | Hsu PJ , Shou H , Benzinger T , Marcus D , Durbin T , Morris JC , Sheline YI . ((2015) ) Amyloid burden in cognitively normal elderly is associated with preferential hippocampal subfield volume loss. J Alzheimers Dis 45: , 27–33. |
[26] | Mueller SG , Chao LL , Berman B , Weiner MW . ((2011) ) Evidence for functional specialization of hippocampal subfields detected by MR subfield volumetry on high resolution images at 4 T. Neuroimage 56: , 851–857. |
[27] | Apostolova LG , Dutton RA , Dinov ID , Hayashi KM , Toga AW , Cummings JL , Thompson PM . ((2006) ) Conversion of mild cognitive impairment to Alzheimer disease predicted by hippocampal atrophy maps. Arch Neurol 63: , 693–699. |
[28] | Apostolova LG , Morra JH , Green AE , Hwang KS , Avedissian C , Woo E , Cummings JL , Toga AW , Jack CR , Weiner MW , Thompson PM , Alzheimer’s Disease Neuroimaging Initiative ((2010) ) Automated 3D mapping of ine and 12-month associations between three verbal memory measures and hippocampal atrophy in 490 ADNI subjects. Neuroimage 51: , 488–499. |
[29] | de Flores R , La Joie R , Chételat G . ((2015) ) Structural imaging of hippocampal subfields in healthy aging and Alzheimer’s disease. Neuroscience 309: , 29–50. |
[30] | Iglesias JE , Augustinack JC , Nguyen K , Player CM , Player A , Wright M , Roy N , Frosch MP , McKee AC , Wald LL , Fischl B , Van Leemput K , Alzheimer’s Disease Neuroimaging Initiative ((2015) ) A computational atlas of the hippocampal formation using ex vivo, ultra-high resolution MRI: Application to adaptive segmentation of in vivo MRI. Neuroimage 115: , 117–137. |
[31] | Mormino EC , Betensky RA , Hedden T , Schultz AP , Amariglio RE , Rentz DM , Johnson KA , Sperling RA . ((2014) ) Synergistic effect of β-amyloid and neurodegeneration on cognitive decline in clinically normal individuals. JAMA Neurol 71: , 1379–1385. |
[32] | Nordenskjöld R , Malmberg F , Larsson E-M , Simmons A , Hakan A , Johansson L , Kullberg J . ((2015) ) Intracranial volume normalization methods: Considerations when investigating gender differences in regional brain volume. Psychiatry Res Neuroimaging 231: , 227–235. |
[33] | Folstein MF , Folstein SE , Mchugh PR . ((1975) ) “Mini-mental state”: A practical method for grading the cognitive state of patients for the clinician. J Psychiary Res 12: , 189–198. |
[34] | Morris JC . ((1993) ) The Clinical Dementia Rating (CDR): Current version and scoring rules. Neurology 43: , 2412–2414. |
[35] | Petersen RC , Aisen PS , Beckett LA , Donohue MC , Gamst AC , Harvey DJ , Jack CR , Jagust WJ , Shaw LM , Toga AW , Trojanowski JQ , Weiner MW , Weiner MW . ((2010) ) Alzheimer’s Disease Neuroimaging Initiative (ADNI): Clinical characterization. Neurology 74: , 201–209. |
[36] | Reuter M , Rosas HD , Fischl B . ((2010) ) Highly accurate inverse consistent registration: A robust approach. Neuroimage 53: , 1181–1196. |
[37] | Ségonne F , Dale AM , Busa E , Glessner M , Salat D , Hahn HK , Fischl B . ((2004) ) A hybrid approach to the skull stripping problem in MRI. Neuroimage 22: , 1060–1075. |
[38] | Fischl B , Salat DH , Busa E , Albert M , Dieterich M , Haselgrove C , Van Der Kouwe A , Killiany R , Kennedy D , Klaveness S , Montillo A , Makris N , Rosen B , Dale AM . ((2002) ) Whole brain segmentation: Automated labeling of neuroanatomical structures in the human brain. Neuron 33: , 341–355. |
[39] | Fischl B , Salat DH , Van Der Kouwe AJW , Makris N , Ségonne F , Quinn BT , Dale AM . ((2004) ) Sequence-independent segmentation of magnetic resonance images.S69-S. Neuroimage 23: , 84. |
[40] | Sled JG , Zijdenbos AP , Evans AC . ((1998) ) A nonparametric method for automatic correction of intensity nonuniformity in MRI data. IEEE Trans Med Imaging 17: , 87–97. |
[41] | Fischl B , Liu A , Dale AM . ((2001) ) Automated manifold surgery: Constructing geometrically accurate and topologically correct models of the human cerebral cortex. IEEE Trans Med Imaging 20: , 70–80. |
[42] | Segonne F , Pacheco J , Fischl B . ((2007) ) Geometrically accurate topology-correction of cortical surfaces using nonseparating loops. IEEE Trans Med Imaging 26: , 518–529. |
[43] | Dale AM , Fischl B , Sereno MI . ((1999) ) Cortical surface-based analysis: I. segmentation and surface reconstruction. Neuroimage 9: , 179–194. |
[44] | Dale AM , Sereno MI . ((1993) ) Improved localizadon of cortical activity by combining EEG and MEG with MRI cortical surface reconstruction: A linear approach. J Cogn Neurosci 5: , 162–176. |
[45] | Fischl B , Liu A , Dale AM . ((2001) ) Automated manifold surgery: Constructing geometrically accurate and topologically correct models of the human cerebral cortex. IEEE Trans Med Imaging 20: , 70–80. |
[46] | Dale AM , Fischl B , Sereno MI . ((1999) ) Cortical surface-based analysis. Neuroimage 9: , 179–194. |
[47] | Landau SM , Mintun MA , Joshi AD , Koeppe RA , Petersen RC , Aisen PS , Weiner MW , Jagust WJ , Alzheimer’s Disease Neuroimaging Initiative ((2012) ) Amyloid deposition, hypometabolism, and longitudinal cognitive decline. Ann Neurol 72: , 578–586. |
[48] | Landau SM , Breault C , Joshi AD , Pontecorvo M , Mathis CA , Jagust WJ , Mintun MA , Alzheimer’s Disease Neuroimaging Initiative ((2013) ) Amyloid-β imaging with Pittsburgh compound B and florbetapir: Comparing radiotracers and quantification methods. J Nucl Med 54: , 70–77. |
[49] | Landau SM , Marks SM , Mormino EC , Rabinovici GD , Oh H , O’Neil JP , Wilson RS , Jagust WJ . ((2012) ) Association of lifetime cognitive engagement and low β-amyloid deposition. Arch Neurol 69: , 623–629. |
[50] | Nasreddine ZS , Phillips NA , Bedirian V , Charbonneau S , Whitehead V , Collin I , Cummings JL , Chertkow H . ((2005) ) The Montreal Cognitive Assessment, MoCA: A brief screening tool for mild cognitive impairment. J Am Geriatr Soc 53: , 695–699. |
[51] | IBM_Corp R ((2015) ) IBM SPSS statistics for windows. |
[52] | Hayes AF . ((2013) ) The. Introduction to Mediation, Moderation, and Conditional Process Analysis, Guilford Press, New York. |
[53] | Burke SL , Hu T , Fava NM , Li T , Rodriguez MJ , Schuldiner KL , Burgess A , Laird A . ((2018) ) Sex differences in the development of mild cognitive impairment and probable Alzheimer’s disease as predicted by hippocampal volume or white matter hyperintensities. J Women Aging, doi: 10.1080/08952841.2018.1419476 |
[54] | Henderson VW . ((2014) ) Alzheimer’s disease: Review of hormone therapy trials and implications for treatment and prevention after menopause. J Steroid Biochem Mol Biol 142: , 99–106. |
[55] | Jack CR , Therneau TM , Wiste HJ , Weigand SD , Knopman DS , Lowe VJ , Mielke MM , Vemuri P , Roberts RO , Machulda MM , Senjem ML , Gunter JL , Rocca WA , Petersen RC . ((2016) ) Transition rates between amyloid and neurodegeneration biomarker states and to dementia: A population-based, longitudinal cohort study. Lancet Neurol 15: , 56–64. |
[56] | Jack CR , Wiste HJ , Weigand SD , Therneau TM , Knopman DS , Lowe V , Vemuri P , Mielke MM , Roberts RO , Machulda MM , Senjem ML , Gunter JL , Rocca WA , Petersen RC . ((2017) ) Age-specific and sex-specific prevalence of cerebral β-amyloidosis, tauopathy, and neurodegeneration in cognitively unimpaired individuals aged 50-95 years: A cross-sectional study. Lancet Neurol 16: , 435–444. |
[57] | Malykhin NV , Huang Y , Hrybouski S , Olsen F . ((2017) ) Differential vulnerability of hippocampal subfields and anteroposterior hippocampal subregions in healthy cognitive aging. Neurobiol Aging 59: , 121–134. |


