
Development of a High-Sensitivity Method for the Measurement of Human Nasal Aβ42, Tau, and Phosphorylated Tau
Abstract
Cost-effective and feasible methods for early diagnosis of Alzheimer’s disease (AD) are needed. We present two methods to measure AD-related biomarkers simultaneously from one nasal smear for the purpose of diagnosing AD. Japanese men and women aged 63–85 years old were recruited in 2015–2016 for this case–control study. A total of 25 AD cases and 25 controls (22 men and 28 women) participated in this research. Nasal smears were collected from the common nasal meatus, inferior concha, middle nasal meatus, and olfactory cleft, and the proteins in the samples were analyzed by two methods, which we named PGD (Pre-treatment with guanidine- n-Dodecyl-beta-D-maltoside solution) method 1 (PGD-I) and 2 (PGD-II). The PGD-I method measured total tau and amyloid-β (Aβ)42, but no differences in median levels of total tau and Aβ42 between AD cases and controls were found in any of the nasal locations. The PGD-II method measured Aβ42, total tau, and phosphorylated tau, but levels of Aβ40 in all nasal locations of both groups were near zero. Median levels of phosphorylated tau to total tau (p-tau/t-tau) ratios in the middle nasal meatus and in the olfactory cleft were significantly higher in AD cases than in controls, and could significantly predict AD. To assess diagnostic reliability, areas under the ROC curve were 0.74 (95% CL = 0.52–0.95, p = 0.030) for the middle nasal meatus and 0.72 (95% CL = 0.52–0.92, p = 0.029) for the olfactory cleft. Thus, PGD-I and PGD-II can detect AD-related biomarkers in nasal smears and PGD-II may be a useful tool for diagnosing AD.
INTRODUCTION
According to a report by Alzheimer’s Disease International, in 2013 the number of people with dementia was estimated at 4.4 million, and was expected to rise to 76 million in 2030 and 135 million in 2050. Since about 60%–70% of people with dementia have Alzheimer’s disease (AD), it is important to find effective methods for diagnosing and treating AD. The pathological hallmarks of AD are senile plaques, consisting of amyloid-β (Aβ) peptides, and neurofibrillary tangles, formed from abnormally phosphorylated tau within the cytoplasm of neurons [1]. Recent advances in AD research show that amyloid pathology begins some 10–20 years before the clinical onset of AD [2–4]. Therefore, it is very important to use not only clinical assessments but also biomarkers for AD diagnosis [5].
Recently, diagnostic tools such as structural magnetic resonance imaging (sMRI) and molecular neuroimaging with positron emission tomography (PET) have been under development, and are being applied in clinical settings [6]. However, MRI and PET are expensive. An alternate diagnostic approach is biomarker analysis via cerebrospinal fluid (CSF) [7]. Studies have shown that increased levels of total tau (t-tau) and phosphorylated tau (p-tau) proteins, and decreased CSF Aβ42 levels can be used to differentiate between AD cases and non-demented, neurologically normal people (“controls”) [7–9]. These CSF markers may also be useful in predicting progress from mild cognitive impairment to AD [10]. CSF biomarker analysis also has its drawbacks—it requires lumbar puncture, which is an invasive procedure with potentially adverse side effects. Therefore, alternative, more cost-effective, less-invasive, convenient, and feasible methods for early diagnosis of AD are needed.
The nasal mucosa is a target tissue for measuring AD biomarkers such as Aβ42, tau, and phosphorylated tau (p-tau). Olfactory dysfunction is an early sign of AD, as most patients suffer from anosmia [11]. A recent study found that Aβ deposition in olfactory epithelium can predict mild cognitive impairment and is associated with AD and dementia [12]. The olfactory bulb is often severely affected at an early stage in AD cases [13]. In addition, Aβ and tau deposits have been found in the olfactory epithelium of AD cases at autopsy [14, 15]. Animal experiments have shown that ventricle-injected isotope-labelled beta-amyloid peptide (125I-Aβ40) is transported to the nasal cavity through a non-hematogenous pathway [16]. Deposits of Aβ peptides in the nasal mucosa in a transgenic mouse model of AD have been found to be well correlated with the amounts of Aβ depositions in the brain [17]. These studies suggest that the nasal cavity may be a useful site for early diagnosis of AD.
We recently reported a highly sensitive method for measuring the contents of Aβ42 in human nasal epithelium [18]. However, when we applied this method to measurement of Aβ42 in nasal smears from AD cases and controls, the data showed very high variability (data not shown here). Since nasal epithelium bears variable amounts of nasal discharge, it is difficult to standardize the values for total protein concentrations. Therefore, we tried to develop a new method to simultaneously measure AD biomarkers such as Aβ42, Aβ40, tau, and phosphorylated tau from a single nasal smear. We now present two novel methods for simultaneously detecting biomarkers in human nasal smears. Each of these two methods was separately applied to the nasal smear samples, collected at four different sites from AD cases and from controls. Then, biomarker levels were compared between AD patients and controls.
MATERIALS AND METHODS
Study population
Elderly men and women were recruited from Shiga University of Medical Science Hospital in Kusatsu, Japan from 2015 to 2016. All participants provided written informed consent. This study complies with the Declaration of Helsinki and was approved by the Ethics Committee of the Shiga University of Medical Science (Approval number = 25–218). Finally, swabs from 19 people (8 control cases and 11 AD cases) were measured by PGD (Pre-treatment with guanidine-n-Dodecyl-beta-D-maltoside solution) method 1 (PGD-I), and swabs from 31 people (17 control cases and 14 AD cases) were measured by PGD method 2 (PGD-II).
Participants’ medical records, including history of disease, medication, and complications, were collected. Blood samples were taken from participants, and magnetic resonance imaging (MRI) was performed. To confirm the presence or absence of dementia, we examined all subjects following established hospital diagnostic protocols including the Mini-Mental State Examination (MMSE), Clinical Dementia Rating, Wechsler Memory Scale (WMS)-RI, WMS-RII, Alzheimer’s Disease Assessment Scale-cog (ADAS-cog), and Global Deterioration Scale (GDS) (Table 1).
Table 1
Characteristics of AD cases and controls
| AD case (n = 25) | Control (n = 25) | |||
| Characteristics | Median | IQR | Median | IQR |
| Age (y) | 76 | 73–79 | 71 | 67–77 |
| Sex (% male) | 48.0 | 40.0 | ||
| Diabetes (%) | 20.0 | 16.0 | ||
| Hypertension (%) | 24.0 | 20.0 | ||
| Hyperlipidemia (%) | 24.0 | 24.0 | ||
| Glucose Intolerance (%) | 4.0 | 0.0 | ||
| Clinical Dementia Rating Composite Rating (%) | ||||
| 0 (None) | 0 | 100 | ||
| 0.5 (Very Mild) | 40 | 0 | ||
| 1 (Mild) | 40 | 0 | ||
| 2 (Moderate) | 20 | 0 | ||
| 3 (Severe) | 0 | 0 | ||
| MMSE | 23.0 | 18.5–26.0 | 29.0 | 27.5–30.0 |
| WMS-R I | 5.0 | 3.0–8.0 | 16.0 | 13.5–22.0 |
| WMS-R II | 0.0 | 0.0–0.5 | 12.0 | 7.5–17.5 |
| ADAS-cog | 14.0 | 10.5–19.0 | 5.0 | 3.5–6.0 |
| GDS | 1.0 | 0.0–3.0 | 2.0 | 0.0–7.0 |
Data are presented as medians and interquartile range (IQR) or as percentages of individuals having the characteristic, as indicated.
Human nasal smear collection and pre-treatments
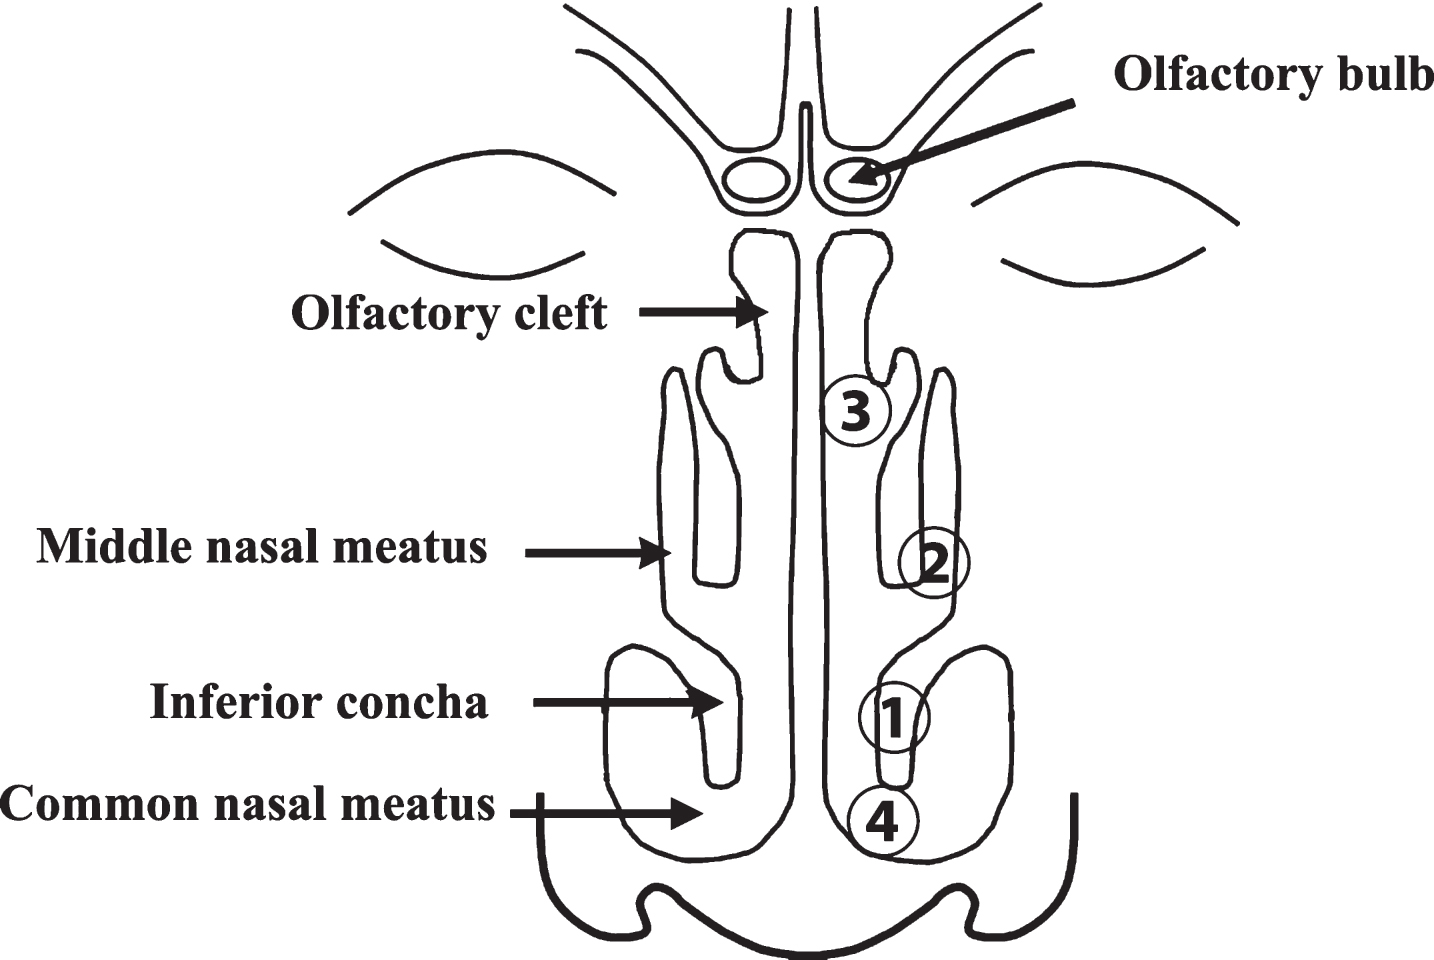
A designated otolaryngologist collected nasal smears from the left inferior concha, middle nasal meatus, olfactory cleft, and common nasal meatus using cotton swabs (HUBY-COTIX EN3-50S; Sanyo Co., Ltd., Osaka, Japan) (Fig. 1). All nasal smears were placed in microtubes, and nasal samples were extracted using the following methods.
Fig.1
Anatomy of the nasal cavity. Nasal smears were taken from the inferior concha (1), middle nasal meatus (2), olfactory cleft (3), and common nasal meatus (4) in that order.
Crude extraction
Each cotton swab was added to a microtube containing 100μl of 50 mM Tris HCL buffer (pH 8.0) containing 8M guanidine HCL, 200 mM NaCl, 2 mM EDTA, and 0.05% n-Dodecyl-beta-D-maltoside and was vortexed vigorously (we refer to this solution as the guanidine solution). The cotton swab was then removed from the microtube. The solution in the microtube was heated for 10 min at 70°C. The solution was put into a 0.2μm PTFE spin filter (Ultrafree-MC 0.2, Millipore Japan) set in a new microtube. The solution was then filtered by centrifugation (14,000×g, 30 min, 25°C). A volume of 90μl of the filtered solution was divided into two tubes containing 45μl each for separate Aβ and tau measurements.
Aβ measurements
Each 45μl sample of filtered solution was placed in a 300 kDa Nanosep® Centrifugal Filter (Paul Japan Corp., Tokyo, Japan) and filtered by centrifugation at 14,000×g for 15 min at 25°C. After centrifugation, 90μl of 50 mM Tris HCL buffer (pH 8.0) containing 200 mM NaCl, 1 mM EDTA and 0.05% n-Dodecyl-beta-D-maltoside (we call this the wash buffer) was added onto the same filter membrane. The solution was filtered into the same tube by centrifugation at 14,000×g for 15 min at 25°C. The filtered solution was collected and mixed well. A volume of 120μl of the filtered solution and then 40μl of the wash buffer were placed in 1 ml of the G-10 column set in a Bio-Spin Chromatography Column (Bio-Rad, Hercules, CA, USA) in order to remove guanidine HCl. The Bio-Spin Column was spun for 1 min at 800×g and the filtered solution (∼160μl) was collected. Triplicates of 5μl (total 15μl) were used for the measurements of total protein concentration using the Protein Assay Rapid Kit WAKO (Wako Pure Chemical Industries, Ltd., Osaka, Japan), and the remaining solutions for the measurements of Aβ42 and Aβ40 concentrations were applied to Human/Rat Beta Amyloid (42) ELISA Kit Wako, High Sensitive (Wako Pure Chemical Industries, Ltd.) and Human Beta Amyloid (40) ELISA Kit Wako II (Wako Pure Chemical Industries, Ltd.).
Tau measurements
We used two different methods: PGD-I and PGD-II.
PGD-I
A volume of 45μl of the filtered solution was added to 45μl of the guanidine solution and mixed well. The mixed solution (80μl) and the wash buffer (80μl) were placed into 1 ml of the G-10 column set in a Bio-Spin Chromatography Columns (Bio-Rad), in order to remove guanidine hydrochloride (HCl). The Bio-Spin Column was spun for 1 min at 800×g and the filtered solution (∼160μl) was collected. Triplicates of 5μl (total 15μl) were used for the measurements of total protein concentration using the Protein Assay Rapid Kit WAKO (Wako Pure Chemical Industries). The remaining solution was used to measure total tau concentrations using TAU (Total) Human ELISA Kit (Invitrogen).
PGD-II
A volume of 40μl of the filtered solution and then 10μl of the wash buffer were placed in 0.7 ml of G-10 column set in a Bio-Spin Chromatography Column (Bio-Rad), in order to remove guanidine HCl. The Bio-Spin Column was spun for 1 min at 800×g and the filtered solution (∼50μl) was collected. Triplicates of 2μl (6μl total) were used to measure total protein concentration using the Protein Assay Rapid Kit WAKO (Wako Pure Chemical Industries, Ltd.). Volumes of 10 and 25μl of the filtered solution were used to measure total tau and phosphorylated tau (p-tau) concentrations using the TAU (Total) Human ELISA Kit (Invitrogen) and TAU [pT181] Human ELISA Kit (Invitrogen), respectively.
We measured nasal fluid samples from a total of 11 AD cases and 8 controls using the PGD-I method, and samples from 14 AD cases and 17 controls using the PGD-II method (Table 2).
Table 2
Number of control and AD case participants according to nasal location and method
| Location | PGD-I | PGD-II | ||
| AD case | Control | AD case | Control | |
| Olfactory cleft | 11 | 8 | 14 | 17 |
| Middle nasal meatus | 11 | 8 | 14 | 17 |
| Inferior concha | 11 | 8 | 14 | 17 |
| Common nasal meatus | 11 | 8 | 10 | 15 |
Statistical analysis
Participants were classified by cognitive status, as AD case or control. Characteristic data were presented as medians and interquartile ranges (IQRs) or percentages for prevalence. Measured protein concentrations (standardized to total protein) were compared between AD cases and controls in both PGD-I and PGD-II methods. Protein levels were presented as medians and IQRs. Levels of p-tau/t-tau from PGD-II were compared between AD cases and controls. Data were presented as a column scatter plot using GraphPad Prism Version 7. Receiver operating characteristics (ROC) curves and areas under the curve (AUC) were used to assess the reliability of nasal protein levels for predicting AD. Youden’s Index (sensitivity + specificity - 1) was used to determine the optimal cut-offs. Wilcoxon’s rank-sum test was used to compare medians between AD cases and controls.
All statistical analyses were performed using SAS version 9.4 (SAS Institute, Cary, North Carolina). Two-tailed p-values of <0.05 were considered as significant.
RESULTS
Characteristics of study participants are presented in Table 1. A total of 25 AD cases and 25 controls were recruited. In total, there were 22 men and 28 women. The median ages for AD cases and controls were 76 and 71 years old, respectively. The prevalence of diabetes, hypertension, and hyperlipidemia were not significantly different between AD cases and controls. AD cases exhibited higher composite ratings for clinical dementia and lower scores on cognitive tests including the MMSE, WMS-R I, WMS-R II, ADAS-cog, and GDS (Table 1).
The results of PGD-I and PGD-II tests are shown in Tables 3 and 4, respectively. We collected nasal smears from four regions (Fig. 1). Because of feeling of discomfort, some people refused sample collections in process, and in some cases, we failed to collect a sufficient volume of specimens, so sample numbers in Tables 3 and 4 were different from those in Table 2.
Table 3
Proteins measured in different nasal locations by PGD-I method in AD cases and controls
| AD case | Control | ||||||
| Concentration (pmol/g protein) | |||||||
| Location | Sample (n) | Median | IQR | Sample (n) | Median | IQR | p-value |
| t-tau | |||||||
| Olfactory cleft | 10 | 567.7 | 517.5–634.8 | 7 | 636.4 | 426.7–675.9 | 0.887 |
| Middle nasal meatus | 9 | 576.0 | 529.1–713.9 | 7 | 468.6 | 260.1–751.4 | 0.370 |
| Inferior concha | 10 | 618.6 | 418.7–781.8 | 8 | 640.8 | 355.3–726.4 | 0.762 |
| Common nasal meatus | 10 | 704.4 | 437.7–858.2 | 8 | 721.6 | 513.9–855.2 | 1.000 |
| Aβ42 | |||||||
| Olfactory cleft | 8 | 2.00 | 1.40–3.20 | 8 | 1.60 | 0.90–2.00 | 0.525 |
| Middle nasal meatus | 8 | 1.90 | 0.90–4.80 | 8 | 1.80 | 1.40–2.40 | 0.623 |
| Inferior concha | 8 | 2.50 | 0.00–4.00 | 7 | 0.40 | 0.00–1.60 | 0.326 |
| Common nasal meatus | 10 | 2.40 | 1.70–3.60 | 8 | 1.70 | 0.60–2.80 | 0.459 |
p-values were derived from Wilcoxon test for comparison of medians.
Table 4
Proteins measured in different nasal locations by PGD-II method in AD cases and controls
| AD case | Control | ||||||
| Concentration (pmol/g protein) | |||||||
| Location | Sample(n) | Median | IQR | Sample(n) | Median | IQR | p-value |
| t-tau | |||||||
| Olfactory cleft | 13 | 265.5 | 143.5–391.3 | 17 | 367.7 | 256.6–735.8 | 0.250 |
| Middle nasal meatus | 12 | 194.8 | 54.8–539.9 | 17 | 335.1 | 266.0–562.0 | 0.328 |
| Inferior concha | 14 | 301.0 | 154.0–909.4 | 16 | 522.0 | 185.9–985.9 | 0.727 |
| Common nasal meatus | 9 | 327.9 | 194.0–1290.0 | 15 | 304.5 | 253.5–699.4 | 1.000 |
| p-tau | |||||||
| Olfactory cleft | 13 | 31.0 | 24.5–47.5 | 16 | 11.7 | 0.00–63.8 | 0.459 |
| Middle nasal meatus | 12 | 29.9 | 0.00–52.3 | 17 | 0.00 | 0.00–41.5 | 0.176 |
| Inferior concha | 14 | 0.00 | 0.00–0.00 | 16 | 0.00 | 0.00–0.00 | 0.581 |
| Common nasal meatus | 9 | 0.00 | 0.00–0.00 | 15 | 0.00 | 0.00–0.00 | 0.884 |
| Aβ42 | |||||||
| Olfactory cleft | 13 | 0.00 | 0.00–1.29 | 17 | 0.00 | 0.00–0.72 | 0.469 |
| Middle nasal meatus | 13 | 1.02 | 0.00–1.44 | 17 | 0.00 | 0.00–0.00 | 0.250 |
| Inferior concha | 14 | 0.00 | 0.00–1.38 | 17 | 0.00 | 0.00–1.42 | 1.000 |
| Common nasal meatus | 9 | 0.00 | 0.00–0.00 | 15 | 0.00 | 0.00–1.08 | 1.000 |
| Aβ40 | |||||||
| Olfactory cleft | 13 | 0.00 | 0.00–0.01 | 17 | 0.01 | 0.00–0.01 | 0.117 |
| Middle nasal meatus | 13 | 0.00 | 0.00–0.01 | 17 | 0.00 | 0.00–0.01 | 0.987 |
| Inferior concha | 14 | 0.00 | 0.00–0.01 | 17 | 0.01 | 0.00–0.01 | 0.481 |
| Common nasal meatus | 8 | 0.00 | 0.00–0.01 | 15 | 0.00 | 0.00–0.01 | 0.765 |
| p-tau/t-tau* | |||||||
| Olfactory cleft | 12 | 0.20 | 0.00–0.20 | 15 | 0.00 | 0.00–0.10 | 0.047 |
| Middle nasal meatus | 9 | 0.20 | 0.00–0.20 | 14 | 0.00 | 0.00–0.10 | 0.048 |
| Inferior concha | 13 | 0.00 | 0.00–0.00 | 13 | 0.00 | 0.00–0.00 | 0.864 |
| Common nasal meatus | 9 | 0.00 | 0.00–0.00 | 12 | 0.00 | 0.00–0.00 | 1.000 |
p-values were derived from Wilcoxon test for comparison of medians. *p-tau/t-tau is a ratio (has no units).
Protein measurements by PGD-I from nasal smears of the inferior concha, middle nasal meatus, olfactory cleft, and common nasal meatus are presented in Table 3. Total tau (t-tau) and Aβ42 were identified in AD cases and controls. T-tau levels were highest in the common nasal meatus and lowest in the olfactory cleft for AD cases. In controls, t-tau levels were highest in the common nasal meatus and lowest in the middle nasal meatus. Median t-tau levels were not found to be significantly different between AD cases and controls in any of the nasal locations.
Aβ42 levels were highest in the inferior concha and lowest in the middle nasal meatus in AD cases, whereas the opposite was found in controls—Aβ42 levels were highest in the middle nasal meatus and lowest in the inferior concha. However, no significant differences were observed in median levels of Aβ42 between AD cases and controls in any of the locations.
Table 4 shows protein measurements by PGD-II of t-tau, p-tau, Aβ42, and Aβ40. T-tau was highest in the common nasal meatus and lowest in the middle nasal meatus in AD cases. Unlike PGD-I, PGD-II found that t-tau was highest in the inferior concha and lowest in the common nasal meatus of controls. Levels of PGD-II-measured Aβ42 were low in most locations in AD cases and controls. No significant differences in median levels of t-tau and Aβ42 in any of the locations were found from PGD-II. Median Aβ40 levels were near zero in all nasal locations and were not significantly different between AD cases and controls in any of the nasal locations. Median p-tau was identified only in the middle nasal meatus and olfactory cleft in AD cases and controls. Although median p-tau levels appeared higher in AD cases than in controls, these differences were not statistically significant in any of the nasal locations.
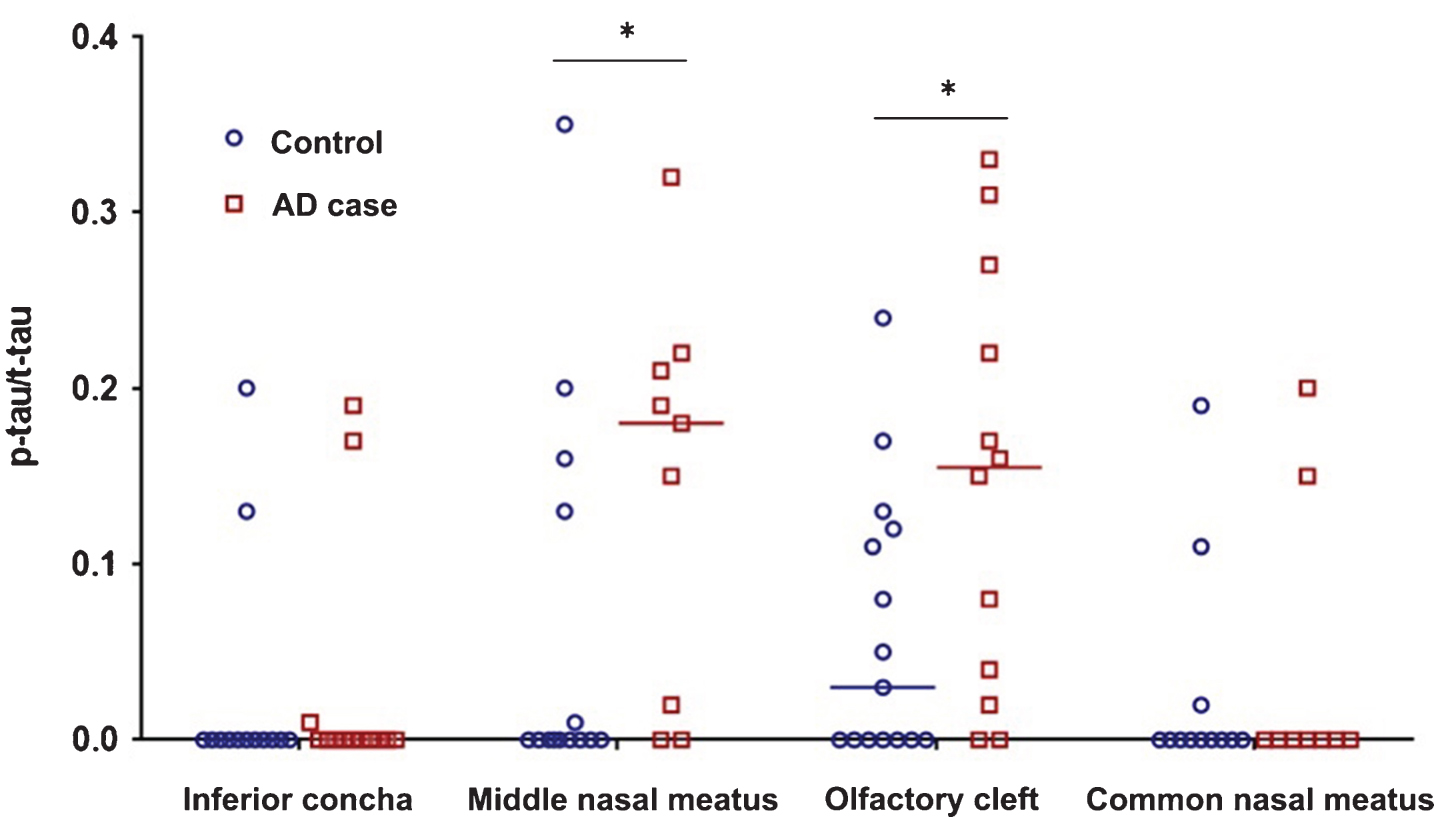
The ratios of p-tau/t-tau are shown in Fig. 2. Median values of p-tau/t-tau were significantly higher in AD cases than in controls in the middle nasal meatus and in the olfactory cleft. No significant differences in median p-tau/t-tau levels were observed in the inferior concha and the common nasal meatus between AD cases and controls.
Fig.2
P-tau/t-tau ratios in different nasal locations in AD cases and controls, measured by the PGD-II method. Asterisks represent significant differences (p < 0.05) between AD case and control median values. Wilcoxon’s p-values are 0.048 and 0.047 for the middle nasal meatus and olfactory cleft, respectively.
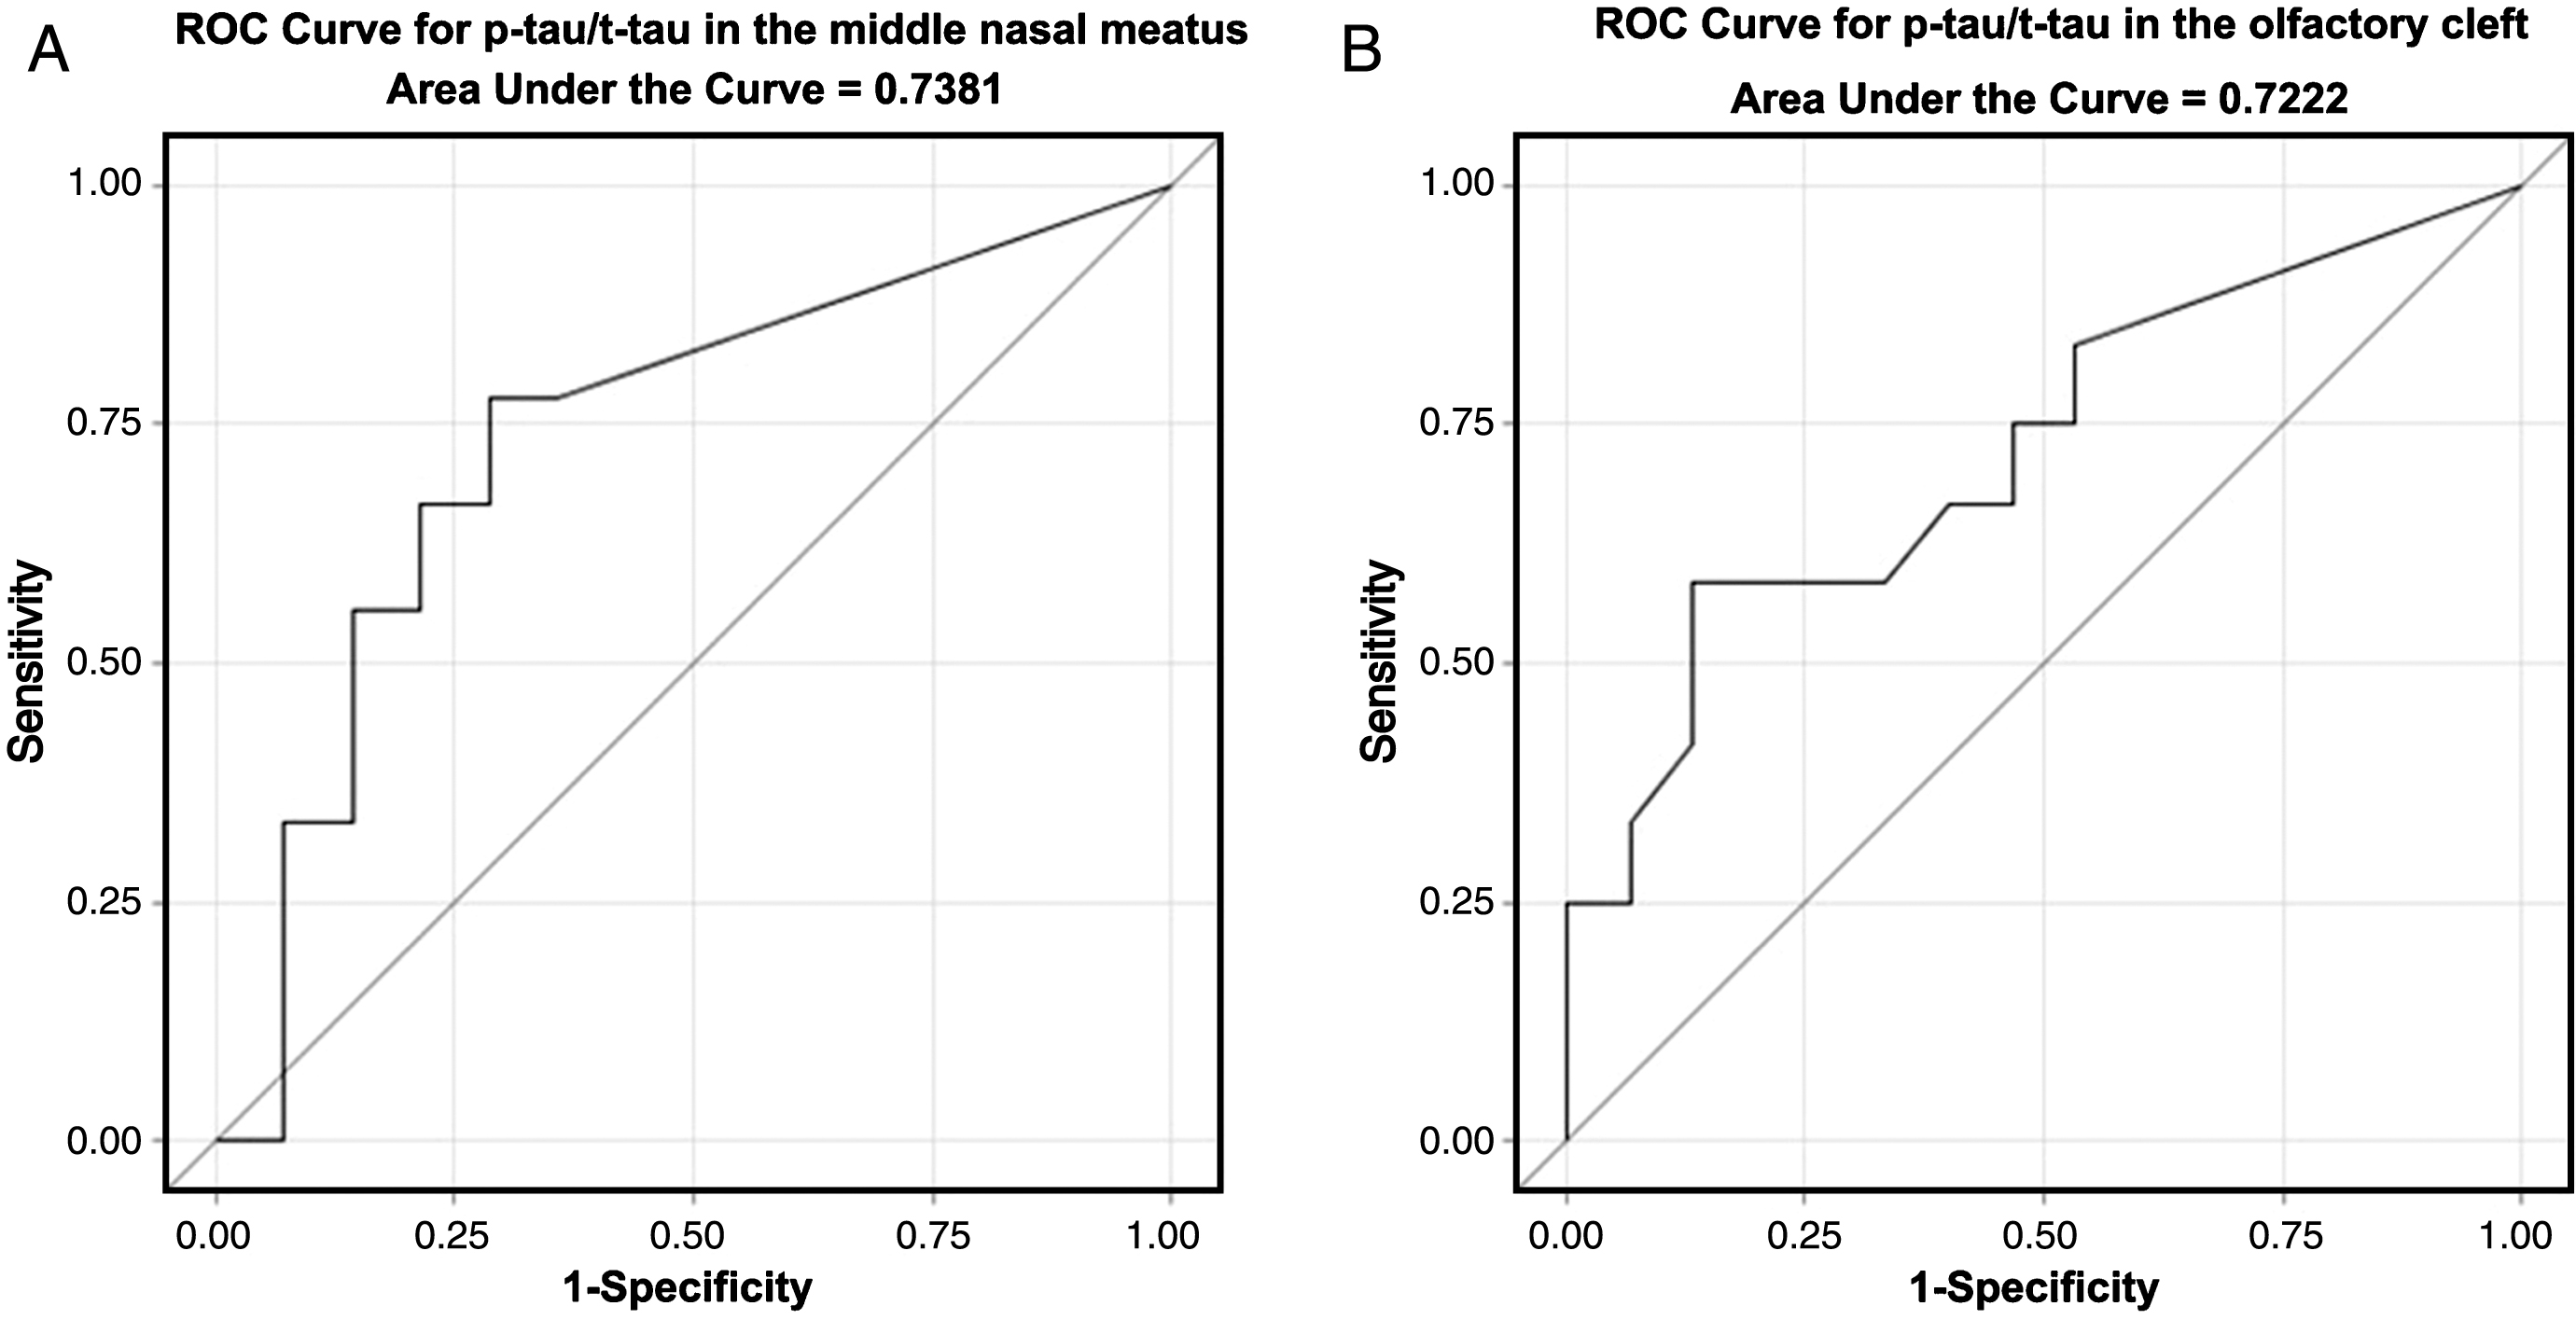
The receiver operating characteristics (ROC) curves for the ratio of p-tau/t-tau in predicting dementia are displayed in Fig. 3. The middle nasal meatus p-tau/t-tau ROC curve has an AUC of 0.738, with 95% confidence limits (95% CL) = 0.523–0.953, p-value (p) = 0.030 (Fig. 3A). The ROC curve AUC for the ratio in the olfactory cleft was 0.722, 95% CL = 0.523–0.9214, p = 0.029. Cut-off scores for each test were identified using Youden’s Index (sensitivity + specificity—1) as this is often used when there is no preference for sensitivity over specificity [19]. Cut-off scores with the highest Youden’s Index value were 0.02 (sensitivity = 0.78 and specificity = 0.71) for the middle nasal meatus and 0.15 (sensitivity = 0.58 and specificity = 0.87) for the olfactory cleft. A table of cut-off values with their associated sensitivity, specificity, and Youden’s Index values can be found in Supplementary Tables 1 and 2.
Fig.3
Receiver operating characteristic (ROC) curves for p-tau/t-tau in (A) the middle nasal meatus and (B) the olfactory cleft, for predicting AD. The area under the curve (AUC) is 0.738, 95% Confidence Limits (95% CL) = 0.523–0.953, p = 0.030 for A and 0.722, 95% CL = 0.523–0.921, p = 0.029 for B.
DISCUSSION
Using PGD-II, we could successfully measure levels of t-tau, p-tau, and Aβ42 simultaneously in nasal smears. Levels of Aβ40 in many nasal locations were not detectable. We had previously developed a high-sensitivity method for measuring levels of Aβ42 from human nasal smears [18]. Since Aβ42 in nasal epithelium is aggregated and insoluble, we used formic acid treatments in order to dissolve the aggregated Aβ42 [18]. However, we needed to neutralize the solution and then concentrate the neutralized solution before ELISA measurements [18]. In addition, t-tau and p-tau are degraded by formic acid preparation. This requires another nasal smear sample from the individual just to measure levels of tau and p-tau. A major disadvantage of this is that nasal fluid amount is limited and the extraction of many samples may contaminate subsequent samples. Instead of formic acid, we used guanidine HCl to dissolve aggregated proteins in this study. We use a G-10 column to remove guanidine HCl, and then tested samples by ELISA methods.
The PGD-I method measured Aβ42, and t-tau, and PGD-II measured Aβ42, t-tau, and p-tau, but median levels of Aβ40 in all nasal locations of both groups were very low (0 or 0.01). Neither method found that levels of t-tau, p-tau, Aβ42, and Aβ40 were significantly different between AD cases and controls in any of the nasal locations. However, the p-tau/t-tau ratios in samples from the olfactory cleft and middle nasal meatus were significantly higher in AD cases than in controls. We found that p-tau/t-tau in both locations can significantly predict AD. One study has shown high sensitivity and specificity when using the p-tau/t-tau ratio in CSF to diagnose AD [7]. Hyperphosphorylation of tau is a major pathological change in AD and is critical in the formation of neurofibrillary tangles, and tau proteins have been found to be abnormally deposited in the dystrophic olfactory epithelium of AD patients [14, 15]. The increased p-tau/t-tau ratio in the nasal cavity could be the result of pathologic changes in the olfactory epithelium in AD.
We collected nasal smears from four regions. Because of feelings of discomfort, some people refused sample collections in processes, and in some cases, we failed to collect a sufficient volume of specimens. However, since we found that we could measure levels of t-tau, p-tau, and Aβ42 from a single sample, the discomfort of sampling can be minimized.
Some studies have shown that the plasma Aβ42/Aβ40 ratio can be a good marker to identify AD [20–22]. In our study, the Aβ42/Aβ40 ratio in nasal smears did not significantly differ between AD cases and controls. However, the Aβ42/Aβ40 ratio could only be calculated in a few cases and control samples as the level of Aβ40 in many nasal locations seemed to be zero. Thus, due to the small sample size, our Aβ42/Aβ40 ratio results may not be conclusive. Further studies with increased sample sizes are needed.
Although Aβ peptides and tau proteins are found in nasal epithelium [14], the sources of the detected biomarkers in the nasal cavity are yet to be determined. Ayala-Grosso et al. reported that patient-derived olfactory stromal cells from biopsies of olfactory mucosa expressed Aβ peptides [23]. Our previous study using a rat model showed that Aβ peptides injected in the brain were transported from the brain into the nasal cavity [16]. The present study showed that the p-tau/t-tau ratio in the nasal cavity was significantly higher in AD cases than in controls, in the olfactory cleft and middle nasal meatus. Interestingly, the olfactory cleft and middle nasal meatus are deeper in the nasal cavity where the biomarker levels are closer to those of the olfactory epithelium and cranial cavity. Although the sources of the detected biomarkers in the nasal cavity are yet to be determined, biomarkers in nasal smears may be a useful tool for diagnosing AD.
Conclusion
Our novel PGD-II method detected Aβ42, Aβ40, p-tau, and t-tau from nasal smears, but levels of Aβ40 in all nasal locations of both groups were near zero. This method may be useful in distinguishing between AD patients and cognitively healthy individuals by assessing the p-tau/t-tau ratio in the olfactory cleft and middle nasal meatus.
ACKNOWLEDGMENTS
The authors wish to acknowledge Dr. Piers Vigers for English proofreading.
This study was supported by a grant from Panasonic Healthcare Co., Ltd.
Authors’ disclosures available online (https://www.j-alz.com/manuscript-disclosures/17-0962r1).
SUPPLEMENTARY MATERIAL
[1] The supplementary material is available in the electronic version of this article: http://dx.doi.org/10.3233/JAD-170962.
REFERENCES
[1] | Braak H , Braak E ((1996) ) Evolution of the neuropathology of Alzheimer’s disease. Acta Neurol Scand Suppl 165: , 3–12. |
[2] | Bateman RJ , Xiong C , Benzinger TL , Fagan AM , Goate A , Fox NC , Marcus DS , Cairns NJ , Xie X , Blazey TM , Holtzman DM , Santacruz A , Buckles V , Oliver A , Moulder K , Aisen PS , Ghetti B , Klunk WE , McDade E , Martins RN , Masters CL , Mayeux R , Ringman JM , Rossor MN , Schofield PR , Sperling RA , Salloway S , Morris JC ((2012) ) Clinical and biomarker changes in dominantly inherited Alzheimer’s disease. N Engl J Med 367: , 795–804. |
[3] | Jack CR Jr , Knopman DS , Jagust WJ , Petersen RC , Weiner MW , Aisen PS , Shaw LM , Vemuri P , Wiste HJ , Weigand SD , Lesnick TG , Pankratz VS , Donohue MC , Trojanowski JQ ((2013) ) Tracking pathophysiological processes in Alzheimer’s disease: An updated hypothetical model of dynamic biomarkers. Lancet Neurol 12: , 207–216. |
[4] | Sperling RA , Aisen PS , Beckett LA , Bennett DA , Craft S , Fagan AM , Iwatsubo T , Jack CR Jr , Kaye J , Montine TJ , Park DC , Reiman EM , Rowe CC , Siemers E , Stern Y , Yaffe K , Carrillo MC , Thies B , Morrison-Bogorad M , Wagster MV , Phelps CH ((2011) ) Toward defining the preclinical stages of Alzheimer’s disease: Recommendations from the National Institute on Aging-Alzheimer’s Association workgroups on diagnostic guidelines for Alzheimer’s disease. Alzheimers Dement 7: , 280–292. |
[5] | Aisen PS , Cummings J , Jack CR Jr , Morris JC , Sperling R , Frolich L , Jones RW , Dowsett SA , Matthews BR , Raskin J , Scheltens P , Dubois B ((2017) ) On the path to 2025: Understanding the Alzheimer’s disease continuum. Alzheimers Res Ther 9: , 60. |
[6] | Johnson KA , Fox NC , Sperling RA , Klunk WE ((2012) ) Brain imaging in Alzheimer disease. Cold Spring Harb Perspect Med 2: , a006213. |
[7] | Blennow K ((2017) ) A review of fluid biomarkers for Alzheimer’s disease: Moving from CSF to blood. Neurol Ther 6: (Suppl 1), 15–24. |
[8] | Simonsen AH , Herukka SK , Andreasen N , Baldeiras I , Bjerke M , Blennow K , Engelborghs S , Frisoni GB , Gabryelewicz T , Galluzzi S , Handels R , Kramberger MG , Kulczynska A , Molinuevo JL , Mroczko B , Nordberg A , Oliveira CR , Otto M , Rinne JO , Rot U , Saka E , Soininen H , Struyfs H , Suardi S , Visser PJ , Winblad B , Zetterberg H , Waldemar G ((2017) ) Recommendations for CSF AD biomarkers in the diagnostic evaluation of dementia. Alzheimers Dement 13: , 274–284. |
[9] | Sperling RA , Karlawish J , Johnson KA ((2013) ) Preclinical Alzheimer disease—the challenges ahead. Nat Rev Neurol 9: , 54–58. |
[10] | Herukka SK , Simonsen AH , Andreasen N , Baldeiras I , Bjerke M , Blennow K , Engelborghs S , Frisoni GB , Gabryelewicz T , Galluzzi S , Handels R , Kramberger MG , Kulczynska A , Molinuevo JL , Mroczko B , Nordberg A , Oliveira CR , Otto M , Rinne JO , Rot U , Saka E , Soininen H , Struyfs H , Suardi S , Visser PJ , Winblad B , Zetterberg H , Waldemar G ((2017) ) Recommendations for cerebrospinal fluid Alzheimer’s disease biomarkers in the diagnostic evaluation of mild cognitive impairment. Alzheimers Dement 13: , 285–295. |
[11] | Doty RL , Reyes PF , Gregor T ((1987) ) Presence of both odor identification and detection deficits in Alzheimer’s disease. Brain Res Bull 18: , 597–600. |
[12] | Devanand DP , Lee S , Manly J , Andrews H , Schupf N , Doty RL , Stern Y , Zahodne LB , Louis ED , Mayeux R ((2015) ) Olfactory deficits predict cognitive decline and Alzheimer dementia in an urban community. Neurology 84: , 182–189. |
[13] | Struble RG , Clark HB ((1992) ) Olfactory bulb lesions in Alzheimer’s disease. Neurobiol Aging 13: , 469–473. |
[14] | Arnold SE , Lee EB , Moberg PJ , Stutzbach L , Kazi H , Han LY , Lee VM , Trojanowski JQ ((2010) ) Olfactory epithelium amyloid-beta and paired helical filament-tau pathology in Alzheimer disease. Ann Neurol 67: , 462–469. |
[15] | Lee JH , Goedert M , Hill WD , Lee VM , Trojanowski JQ ((1993) ) Tau proteins are abnormally expressed in olfactory epithelium of Alzheimer patients and developmentally regulated in human fetal spinal cord. Exp Neurol 121: , 93–105. |
[16] | Kameshima N , Yanagisawa D , Tooyama I ((2013) ) beta-Amyloid peptide (1-40) in the brain reaches the nasal cavity via a non-blood pathway. Neurosci Res 76: , 169–172. |
[17] | Kameshima N , Nanjou T , Fukuhara T , Yanagisawa D , Tooyama I ((2012) ) Correlation of Aβ deposition in the nasal cavity with the formation of senile plaques in the brain of a transgenic mouse model of Alzheimer’s disease. Neurosci Lett 513: , 166–169. |
[18] | Nanjo T , Fukuhara T , Kameshima N , Yanagisawa D , Shimizu S , Shimizu T , Shiino A , Akatsu H , Yamamoto T , Tooyama I ((2014) ) Development of a method to measure Aβ42 in nasal cavity samples and its application in normal human volunteers. J Brain Sci 44: , 5–23. |
[19] | Bagdiwala SI , Haedo AS , Natal ML , Villaveces A ((2008) ) The agreement chart as an alternative to the receiver-operating characteristic curve for diagnostic tests. J Clin Epidemiol 61: , 866–874. |
[20] | Cammarata S , Borghi R , Giliberto L , Pardini M , Pollero V , Novello C , Fornaro M , Vitali A , Bracco L , Caltagirone C , Bossu P , Odetti P , Tabaton M ((2009) ) Amyloid-beta42 plasma levels are elevated in amnestic mild cognitive impairment. J Alzheimers Dis 18: , 267–271. |
[21] | Graff-Radford NR , Crook JE , Lucas J , Boeve BF , Knopman DS , Ivnik RJ , Smith GE , Younkin LH , Petersen RC , Younkin SG ((2007) ) Association of low plasma Abeta42/Abeta40 ratios with increased imminent risk for mild cognitive impairment and Alzheimer disease. Arch Neurol 64: , 354–362. |
[22] | Song F , Poljak A , Smythe GA , Sachdev P ((2009) ) Plasma biomarkers for mild cognitive impairment and Alzheimer’s disease. Brain Res Rev 61: , 69–80. |
[23] | Ayala-Grosso CA , Pieruzzini R , Diaz-Solano D , Wittig O , Abrante L , Vargas L , Cardier J ((2015) ) Amyloid-abeta peptide in olfactory mucosa and mesenchymal stromal cells of mild cognitive impairment and Alzheimer’s disease patients. Brain Pathol 25: , 136–145. |

