
Comprehensive Characterization of the Pyroglutamate Amyloid-β Induced Motor Neurodegenerative Phenotype of TBA2.1 Mice
Abstract
Alzheimer’s disease (AD) is the most common neurodegenerative disorder and is being intensively investigated using a broad variety of animal models. Many of these models express mutant versions of human amyloid-β protein precursor (AβPP) that are associated with amyloid-β protein (Aβ)-induced early onset familial AD. Most of these models, however, do not develop bold neurodegenerative pathology and the respective phenotypes. Nevertheless, this may well be essential for their suitability to identify therapeutically active compounds that have the potential for a curative or at least disease-modifying therapy in humans. In this study, the new transgenic mouse model TBA2.1 was explored in detail to increase knowledge about the neurodegenerative process induced by the presence of pyroglutamate modified human Aβ3-42 (pEAβ3-42). Analysis of the sensorimotor phenotype, motor coordination, Aβ pathology, neurodegeneration, and gliosis revealed formation and progression of severe pathology and phenotypes including massive neuronal loss in homozygous TBA2.1 mice within a few months. In contrast, the start of a slight phenotype was observed only after 21 months in heterozygous mice. These data highlight the role of pEAβ3-42 in the disease development and progression of AD. Based on the findings of this study, homozygous TBA2.1 mice can be utilized to gain deeper understanding in the underlying mechanisms of pEAβ3-42 and might be suitable as an animal model for treatment studies targeting toxic Aβ species, complementary to the well described transgenic AβPP mouse models.
INTRODUCTION
Alzheimer’s disease (AD) is the most common neurodegenerative disorder. The major postmortem pathological hallmarks of the disease are the progressive neurodegeneration, hyperphosphorylated tangles of the tau protein, and amyloid-β (Aβ) containing plaques [1, 2]. Several studies claim soluble oligomers of Aβ as the relevant pathogen for development and progression of AD [3]. Monomeric Aβ is constantly produced by cleavage of the amyloid-β protein precursor (AβPP) by β- and γ- secretase and aggregates in a series of different species from oligomers to fibrils and to the formation of plaques [4, 5]. It was suggested that the oligomerization of Aβ leads in a cascade to synaptic dysfunction, hyperphosphorylated tangles of the tau protein, neurodegeneration, and finally dementia [3]. Different Aβ species have been identified in brains of AD patients, by which Aβ1 - 40 and Aβ1 - 42 are the most common. Despite those isoforms, N-terminal truncated species are also dominantly found in AD brains. The most common N-terminal truncated Aβ species are pyroglutamate-modified Aβ peptides (pEAβ), which represent about 10 to 20% of total Aβ isolated from vascular amyloid deposits and up to 50% of the Aβ peptides present in purified amyloid plaque cores [6]. It is well known that pEAβ3-42 has an enhanced oligomerization tendency and is more neurotoxic compared to Aβ1 - 42 [7–9]. Moreover, it is resistant against degradation, and is able to impair long-term potentiation. Besides several potential posttranslational modifications (PTM) of Aβ, pEAβ3-42 is the only PTM for which an immunotherapy has been developed and already tested in humans [10].
To gain deeper insight into the disease mechanisms, the use of AD animal models in research is highly relevant and thus far without alternative. However, most of the models used do not show any neurodegenerative pathology, which is certainly a major disadvantage for their use in the development of curative medications. In this study, we used the new mouse model TBA2.1, exhibiting a motor neurodegenerative phenotype induced by the neuronal presence of N-terminal truncated and pyroglutamated Aβ3-42 (pEAβ3-42) [11]. Several studies have shown that with the beginning of the preclinical stage of AD, humans also develop deficiencies in the motor function after first cognitive impairments [12–14]. This implies lower muscle bulks and lower muscle strength, especially the grip strength is affected, but also restrictions in motor learning. Therefore, the relation between the motor disorder and the presence of pEAβ3-42 might also be relevant for the human disease.
The aim of the present study was to obtain further insights into the extent of the pEAβ3-42 induced neurodegenerative process in transgenic mice. Additionally, we aimed to identify suitable experiments and behavioral tests which could be used as robust read out in future therapeutic studies. Therefore, the phenotypes of both homozygous and heterozygous TBA2.1 mice were analyzed in detail including their motoric abilities and disabilities, and cerebral pathology at different ages was compared to wild type littermates, to validate and extend the results of Alexandru et al. [11]. We have solely concentrated on the analysis of motor deficits, as motor impairment will bias standard cognition assays, like the Morris water maze, the novel object recognition test, and the Y maze, to name a few. The findings of this study extend the knowledge of the TBA2.1 mouse model as a suitable research model for treatment studies evaluating new drug candidates against AD, complementary to the AD mouse models exhibiting cognitive deficits.
MATERIAL AND METHODS
Ethics statement
All experiments were done in accordance with the German Law on the protection of animals and approved by LANUV North-Rhine-Westphalia (Germany, AZ84-02.04.2011.A359).
Animals
Heterozygous (HET) and homozygous (HOM) TBA2.1 mice exhibiting neuronal formation of pEAβ3-42 were originally described on a C57BL/6×DBA1 background [11] and were further crossed to C57BL/6 for more than four generations. Generation of TBA2.1 mice was described by Alexandru et al. [11]. Briefly, the chromosomal integration of the pre-pro-peptide of murine thyrotropin releasing hormone (TRH, Thyroliberin) was used, whereby the TRH was fused to the N-terminus of the modified human Aβ polypeptide Aβ(Q3–42). Thus, Aβ(Q3–42) expression was directed into the secretory pathway in neuronal tissue, based on murine Thy1.2 regulatory sequences. For final generation of pEAβ3-42, the N-terminally truncated Aβ species are posttranslationally modified by the endogenous glutaminyl-cyclase [11]. Wild type littermates (wild type, WT) were used as control mice. Mice were housed up to four per cage in a controlled environment on a 12/12-h light/dark cycle (lights on from 7 a.m.–7 p.m.), with 54% humidity, temperature of 22°C, and food and water ad libitum. For breeding, only heterozygous mice were used. Homozygous mice were sacrificed at five months of age for ethical reasons due to the severity of the disease.
Animal experimental setup
Cross-sectional characterization of male TBA2.1 mice was initially based on phenotype assessment (SHIRPA test battery) and motor balance (accelerating rotarod) from two to five months of age using heterozygous (HET), homozygous TBA2.1 (HOM) and wild type littermates (WT).
To increase the understanding of the motor phenotype progression of individual homozygous TBA2.1 mice, a longitudinal study with a different group of male, homozygous, and wild type TBA2.1 mice was performed additionally. They were tested at 3 and 5 months of age in additional motor tests including open field test, clasping behavior, marble burying behavior, grip strength, and pole test. The phenotype of old heterozygous, male mice (HET) was analyzed at 18, 21, and 24 months of age in the SHIRPA test battery, motor balance (accelerating rotarod), pole test, grip strength, and marble burying behavior compared to WT.
Except for the SHIRPA assessment, all individuals were habituated in single cages before starting the particular test. All experimenters were blind to genotype and all tests were carried out at the same time of day. For each experiment, a minimum of 5 mice per genotype and group was used. A detailed listing of the mice used per experiment is given in Table 1.
Table 1
Overview of the used number of mice per experiment
| Experiment | Age (mo) | Number of mice | ||
| WT | HOM | HET | ||
| Body weight, SHIRPA, Rotarod, (all cross-sectional) | 2 | 8 | 8 | 9 |
| 3 | 8 | 7 | 6 | |
| 4 | 10 | 12 | 11 | |
| 5 | 10 | 12 | 11 | |
| 18 | 10 | 7 | – | |
| 21 | 9 | 8 | – | |
| 24 | 6 | 5 | – | |
| Innate and motor behavior, open field (longitudinal) | 3 | 8 | – | 7 |
| 5 | 8 | – | 7 | |
| 18 | 10 | 8 | – | |
| 21 | 9 | 8 | – | |
| 24 | 6 | 5 | – | |
| Immunohistochemical analysis | 3 | – | – | 6 |
| 5 | 5 | – | 6 | |
| 18 | 8 | 6 | – | |
| 24 | 8 | 6 | – | |
| ELISA | 5 | 5 | – | 5 |
Phenotype assessment
The primary screen of the SHIRPA test battery was used to assess the phenotype [15]. This test consisted of the following subtests: abnormal body carriage, alertness, abnormal gait, startle response, loss of righting reflex, touch response, pinna reflex, cornea reflex, forelimb placing reflex, hanging behavior, and pain response. Mice were individually observed and scored in an arena of 42.5 cm×18 cm×26.5 cm (L×H×W). Scoring was defined from 0 (similar to WT) to 3 (extremely abnormal from WT). In every measurement, the body weight was also recorded.
Accelerating rotarod
Analysis of the motor coordination of the TBA2.1 mice was performed using a rotarod apparatus (Ugo Basile Srl, Comerio VA, Italy) and a previously published protocol [11]. The test was conducted in two days with one training and three test sessions. In the training on the first morning, the mice had to stay on the rod for at least 60 s at constant 10 rpm. In the afternoon as well as on the next day morning and afternoon, the mice had to run in three trials on the beam accelerating from 4 to 40 rpm. The total time on the beam of each trial was used for analysis and the maximum time was 10 min.
Grip strength analysis
Grip strength analysis of the forelimbs was evaluated using the Grip Strength Meter (Ugo Basile Srl, Comerio VA, Italy). Following the manufacturers protocol, TBA2.1 mice were placed with their forelimbs to a triangular grasping bar which they grip intuitively. The mice were pulled backwards until they release the holder. The peak force was measured three times in succession. The mean value of all three peak forces was used for analysis.
Modified pole test
The standard pole test evaluates basal ganglia related movement disorders [16, 17]. Owing to the severe motor phenotype of homozygous TBA2.1 mice, the following modifications were realized. The mice were placed with the head downwards instead of upwards on a vertical pole (height 50 cm, diameter 1.2 cm, rough-surfaced) and their movement downwards was rated. The runs were scored from 0 to 3 (0 continuous run, 1 part-way run, 2 slipping downwards, 3 falling down). This procedure was performed three times and the sum of all three scores was used for analysis.
Marble burying test
The marble burying test was used to assess generic and motor behavior of the mice [18]. The mice were placed in a housing cage with 5 cm bedding, and twelve opaque, green marbles (diameter 18 mm, arranged at regular intervals). After 30 min, marbles buried to more than 75% were counted by two independent experimenters. Mean of the counts were used for analysis.
Clasping test
To characterize innate clasping behavior, the mice were lifted up by the tail for 15 s. Trembling and/or cramping of the hind limbs was observed and scored (from 0 meaning similar to wild type mice until 3 meaning extreme abnormal behavior). This procedure was performed three times and the sum of all three scores was used for analysis.
Open field test
The open field test was performed to analyze the locomotive and explorative behavior of homozygous and wild type TBA2.1 mice at an age of 3 and 5 months. After habituation, mice were placed in a square-shaped arena (44 cm×44 cm×44 min), imaginarily divided into two departments: center and border zone (center: 22 cm×22 cm, border: 44 cm×44 cm). The mice were allowed to explore the arena for 30 min. They were recorded with a camera driven tracking system, Ethovision 11 (Noldus, Wageningen, The Netherlands).
Tissue preparation
The mice were sacrificed and the brains were analyzed. The right brain hemisphere was used for immunohistological analysis and the left hemisphere for biochemical analysis. Both hemispheres were stored at –80°C until further processing.
Immunohistochemical analysis
Aβ load (antibody 6E10), neurodegeneration (antibody NeuN) and gliosis (antibodies against GFAP and CD11b) of 5 months old WT, 3 and 5 months old homozygous TBA2.1, as well as 18 and 24 months old wild type and heterozygous TBA2.1 mice were assessed by immunohistochemical or immunofluorescence analysis using 20μm thick, sagittal sections divided by a cryotome (Leica Biosystems Nussloch GmbH, Wetzlar, Germany). Five to seven brain sections per mouse were fixed and treated with 70% formic acid for antigen retrieval. The sections were washed and treated with 3% H2O2 in methanol for elimination of endogenous peroxidases. After a further washing step, sections were incubated with the primary antibody over night at 4°C in a humid chamber (6E10:1:1000, Bio Legend, San Diego, CA, USA; GFAP: 1:1000, DAKO, Agilent Technologies, Santa Clara, CA, USA; NeuN: 1:1000 Merck Millipore, Darmstadt, Germany, CD11b: 1:2500 Abcam, Cambridge, UK) in Tris buffered saline with 1% Triton X100 (TBST) with 1% bovine serum albumin (BSA). Afterwards, sections were incubated with a biotinylated secondary anti-mouse or anti-rabbit antibody (both 1:1000 in TBST+1% BSA, Sigma-Aldrich, Germany). Staining was visualized by use of 3, 3’-Diaminobenzidine (DAB) enhanced with saturated nickel ammonium sulphate solution (homozygous mice, Figs. 6 and 9), or by use of secondary antibodies labeled with different fluorescence dyes (Goat anti-mouse IgG (H + L), Alexa Fluor 568, Goat anti-rabbit IgG (H + L), Alexa Fluor 488, Invitrogen, USA). Immunofluorescence sections were counterstained by DAPI (4′,6-Diamidin-2-phenylindol) (Merck, Germany). Sections were mounted with DPX Mountant (Sigma-Aldrich, Germany) after washing in an ascending alcohol series. Images were taken with a LMD6000 microscope (Leica Camera, Germany) with a DFC310 FX camera (Leica Camera, Germany). The stained area of GFAP and NeuN (motor cortex, striatum, inferior colliculus, brain stem, and hippocampal region CA1), CD11b (inferior colliculus, brain stem), and particles of Aβ in different brain regions (6E10: sensorimotor cortex, striatum, hippocampal region CA1) in homozygous TBA2.1 mice and their non-transgenic littermates were analyzed. Additionally, Aβ particles (hippocampal CA1 region, Striatum) and DAPI counts (hippocampal CA1 region) in heterozygous TBA2.1 mice and their non-transgenic littermates were analyzed. Quantification was performed using ImageJ (National Institute of Health, Bethesda, MD, USA).
Enzyme-linked immunosorbent assay (ELISA)
To quantify the cerebral pEAβ3-42 levels the amyloid-beta (N3pE-42) ELISA (IBL International GmbH, Hamburg, Germany) was used. For that reason, the left brain hemispheres were homogenized with Tris buffer (20 mM Tris pH 8.3, 250 mM NaCl, Roche EDTA free Complete Protease Inhibitor) in the PreCellys24 homogenizer (2×20 s at 6.500 rpm, Bertin Technologies, Montigny-le-Bretonneux, France). The resulting homogenate was vortexed, 15 min sonified, vortexed again and centrifuged (175.000 g, 4°C, 30 min). The pellet was incubated and resuspended with 0.2% diethanolamine (DEA) on ice and centrifuged. The supernatant, the DEA soluble fraction, was used for analysis. The pellet was incubated and resuspended with 70% formic acid (FA) on ice and centrifuged. FA is used to destroy all insoluble large Aβ structures, to provide the analysis of insoluble Aβ species. The interphase was taken and neutralized with 1 M Tris pH 11.3 representing the insoluble Aβ fraction. The pEAβ3-42 level of the DEA soluble and the insoluble Aβ fractions were quantified in the ELISA using the manufacturer’s protocol.
Statistical analysis
Gaussian distribution of all data was tested in the Shapiro-Wilk-Test. Normally distributed data were analyzed using either one- or two-way ANOVA (analysis of variance) with Fisher LSD post hoc analysis or t test. Repeated measurements (RM) were analyzed by use of one- or two-way RM ANOVA. Non-parametric data were tested using the Friedman or Kruskal-Wallis test. Appropriate non-parametric post hoc analysis was performed with Multiple Comparison Tests by Dunn or by Dunnet. In order to avoid the use of an insufficient number of mice in the conducted experiments, power analyses were carried out to check the appropriate group sizes to achieve a biologically relevant effect (α= 0.05, β≤0.2). Power analysis was performed based on the experiments from Brener et al. and Dunkelmann et al. [19, 20]. A biologically relevant effect was set with regard to the changes between wild type and homozygous TBA2.1 mice from the recently published SHIRPA and rotarod results of Dunkelmann et al. [20]. According to the results of this study, 2 months old wild type mice revealed a mean SHIRPA score of 1.4 (SD 1.6). Assuming a biologically relevant effect of 200%, and a significance level of α= 0.05 (5%) and β≤0.2 (20%), the expected power of the experiment is 80% by using 6 mice per group, or 90% by using 8 mice per group, respectively. Power analysis was performed by use of InVivoStat 2.5 (InVivoStat by Simon Bate and Robin Clark, United Kingdom, [21]). No power analysis was performed for repeated measure analysis (e.g., rotarod), as it is not accessible with simple power analysis. All data are expressed as mean±SEM. All statistical calculations were performed using GraphPad Prism 5 (GraphPad Software, Inc., La Jolla, CA, USA), SigmaPlot Version 11 (Systat Software, Erkrath, Germany).
RESULTS
Appearance and motor coordination of transgenic TBA2.1 mice
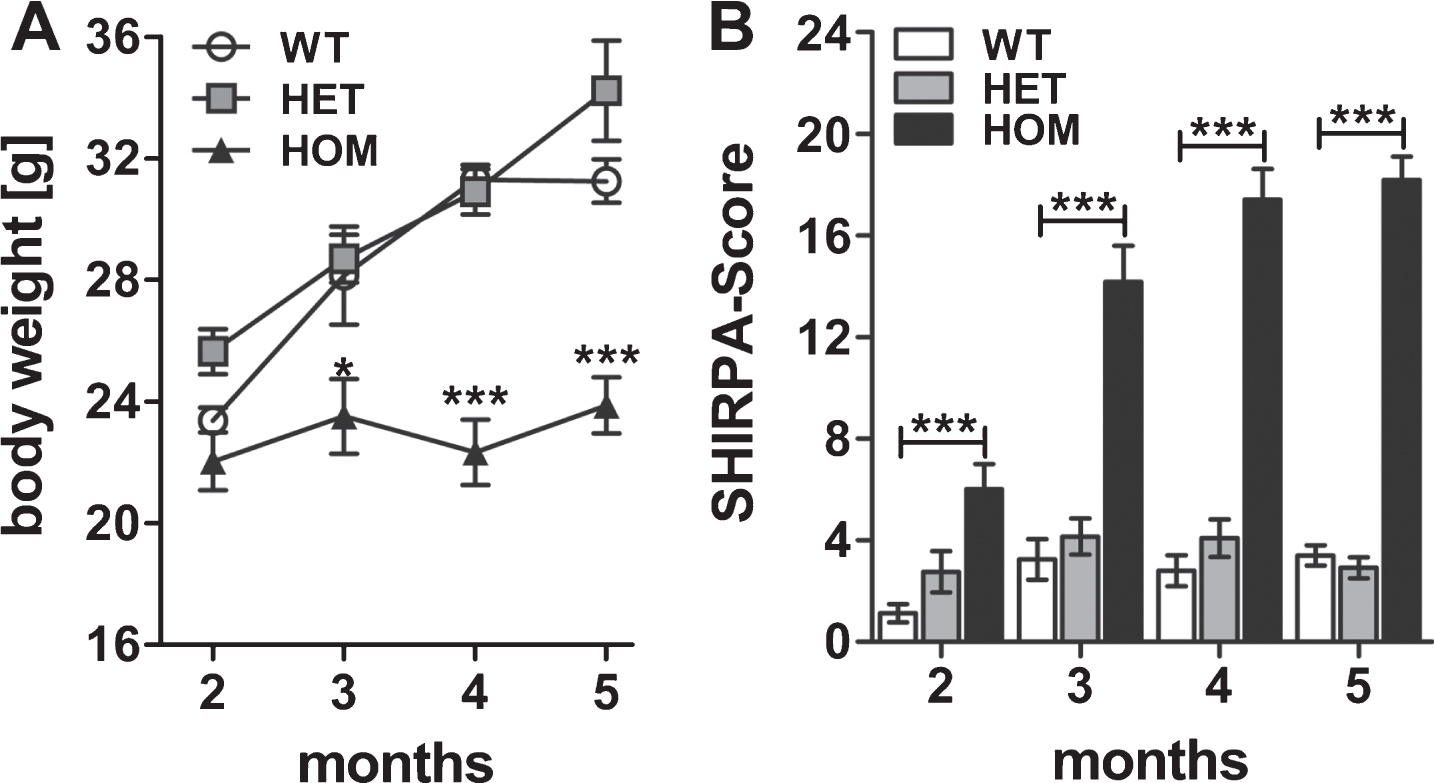
To get a first impression of the motor neurodegenerative phenotype induced by pEAβ3-42, we analyzed two, three, four, and five months old heterozygous (HET) and homozygous (HOM) TBA2.1 mice and their wild type littermates (WT). They were tested cross-sectionally in the phenotype assessment test and for motor coordination using the accelerating rotarod test. First of all, we analyzed the body weight of homozygous, heterozygous, and wild type mice at different ages. Body weight gain of homozygous mice was reduced compared to wild type and heterozygous mice (two-way ANOVA, F (3,95) = 18.2, p < 0.001; Fisher LSD post hoc analyses, WT versus HOM, 2 m p = 0.39, 3 m p < 0.01, 4 m p < 0.001, 5 m p < 0.001). This means, the body weight of homozygous mice was stabilized at about 22.9±0.5 g, whereas that of wild type mice increased from 23.2±0.4 g to 31.2±0.6 g during the period of measurements, similar to the body weight of heterozygous mice (Fig. 1A). The phenotype assessment revealed a neurological phenotype in homozygous mice already at two months of age with a five times higher score compared to wild type mice (two-way ANOVA, F (2,99) = 226.7, p < 0.001; Fisher LSD post hoc analyses, WT versus HET n.s., WT versus HOM p < 0.001 at all ages, Fig. 1B). The score of homozygous mice, i.e., their phenotypic abnormalities, increased until five months of age. Among the phenotypic abnormalities, an impairment of lower sensorimotor functions (e.g., basic movements) in connection with the development of a kyphosis and a rigid gait could be observed. However, heterozygous mice appeared normal at this age.
Fig.1
Weight gain and phenotype assessment of wild type (WT), heterozygous (HET), and homozygous (HOM) TBA2.1 mice. The weight gain of HOM mice was reduced from 2 to 5 months compared to HET and WT mice (A). Phenotype assessment using the SHIRPA test battery revealed a bold phenotype of HOM TBA2.1 mice starting already at 2 months of age (B). Data is presented as mean±SEM; *p < 0.05 and ***p < 0.001 versus WT.
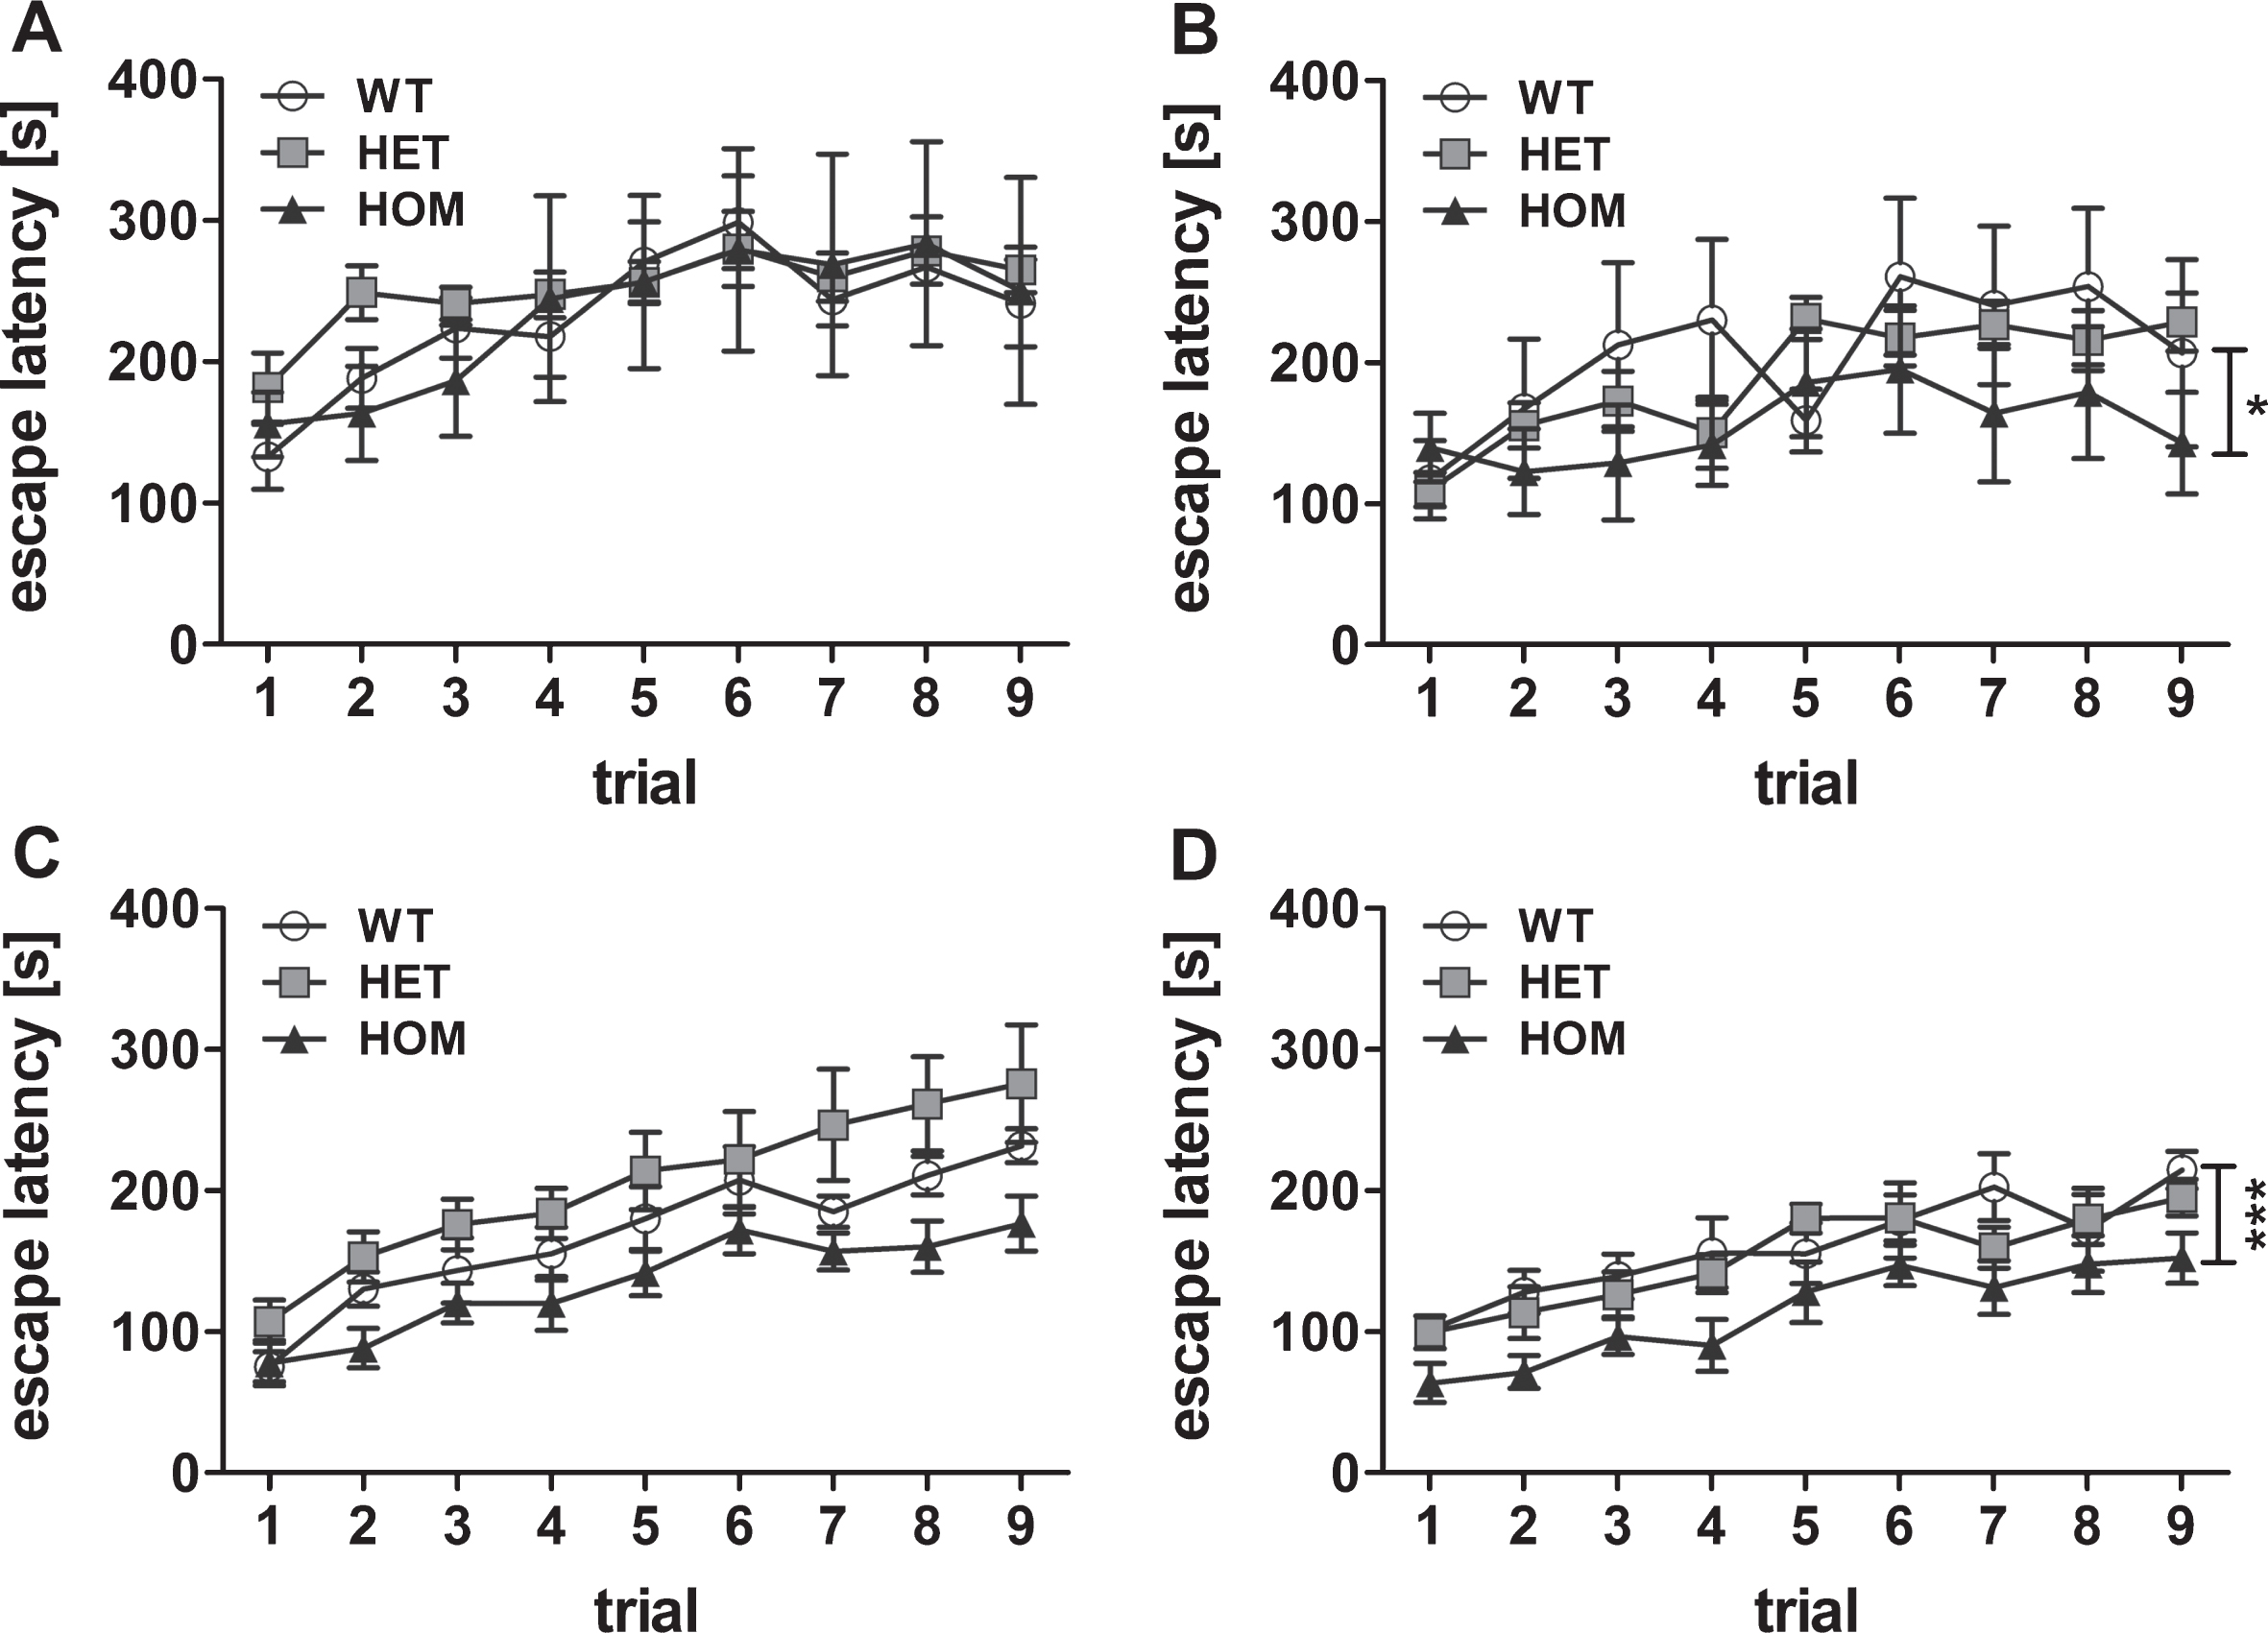
Analysis of the motor coordination and motor learning of two months old mice showed similar performance regardless of the phenotype (Friedman test, not significant (n.s.)) (Fig. 2A). However, at the age of three months, the motor learning of the homozygous mice decreased when compared to the abilities of the wild type mice (Friedman test, p = 0.031, post hoc analysis WT versus HET n.s., WT versus HOM p < 0.05). A deficit in motor coordination was measurable at four and five months of age, too, although it only reached statistical significance at 5 months (Friedman test, p = 0.002, WT versus HET n.s., WT versus HOM p < 0.001). In contrast, motor coordination and learning of the heterozygous mice showed no significant differences in relation to the control wild type mice (Fig. 2A-D). These results indicated a proceeding phenotype in homozygous mice and no measurable abnormalities in heterozygous mice until five months of age.
Fig.2
Cross-sectional analysis of the motor phenotype. Motor balance was tested using rotarod apparatus with 9 trials in total in 2, 3, 4, and 5 months old transgenic TBA2.1 mice (A, B, C, D, respectively). Deterioration of motor balance of homozygous (HOM) TBA2.1 mice started with an age of 3 months and was significantly further reduced in 5 months old mice compared to wild type (WT) (B and D). No difference was observed between the performance of heterozygous (HET) TBA2.1 and WT mice. Data is represented as mean±SEM, *p < 0.05 and ***p < 0.001 versus WT.
Detailed investigation of the motor phenotype of homozygous TBA2.1 mice
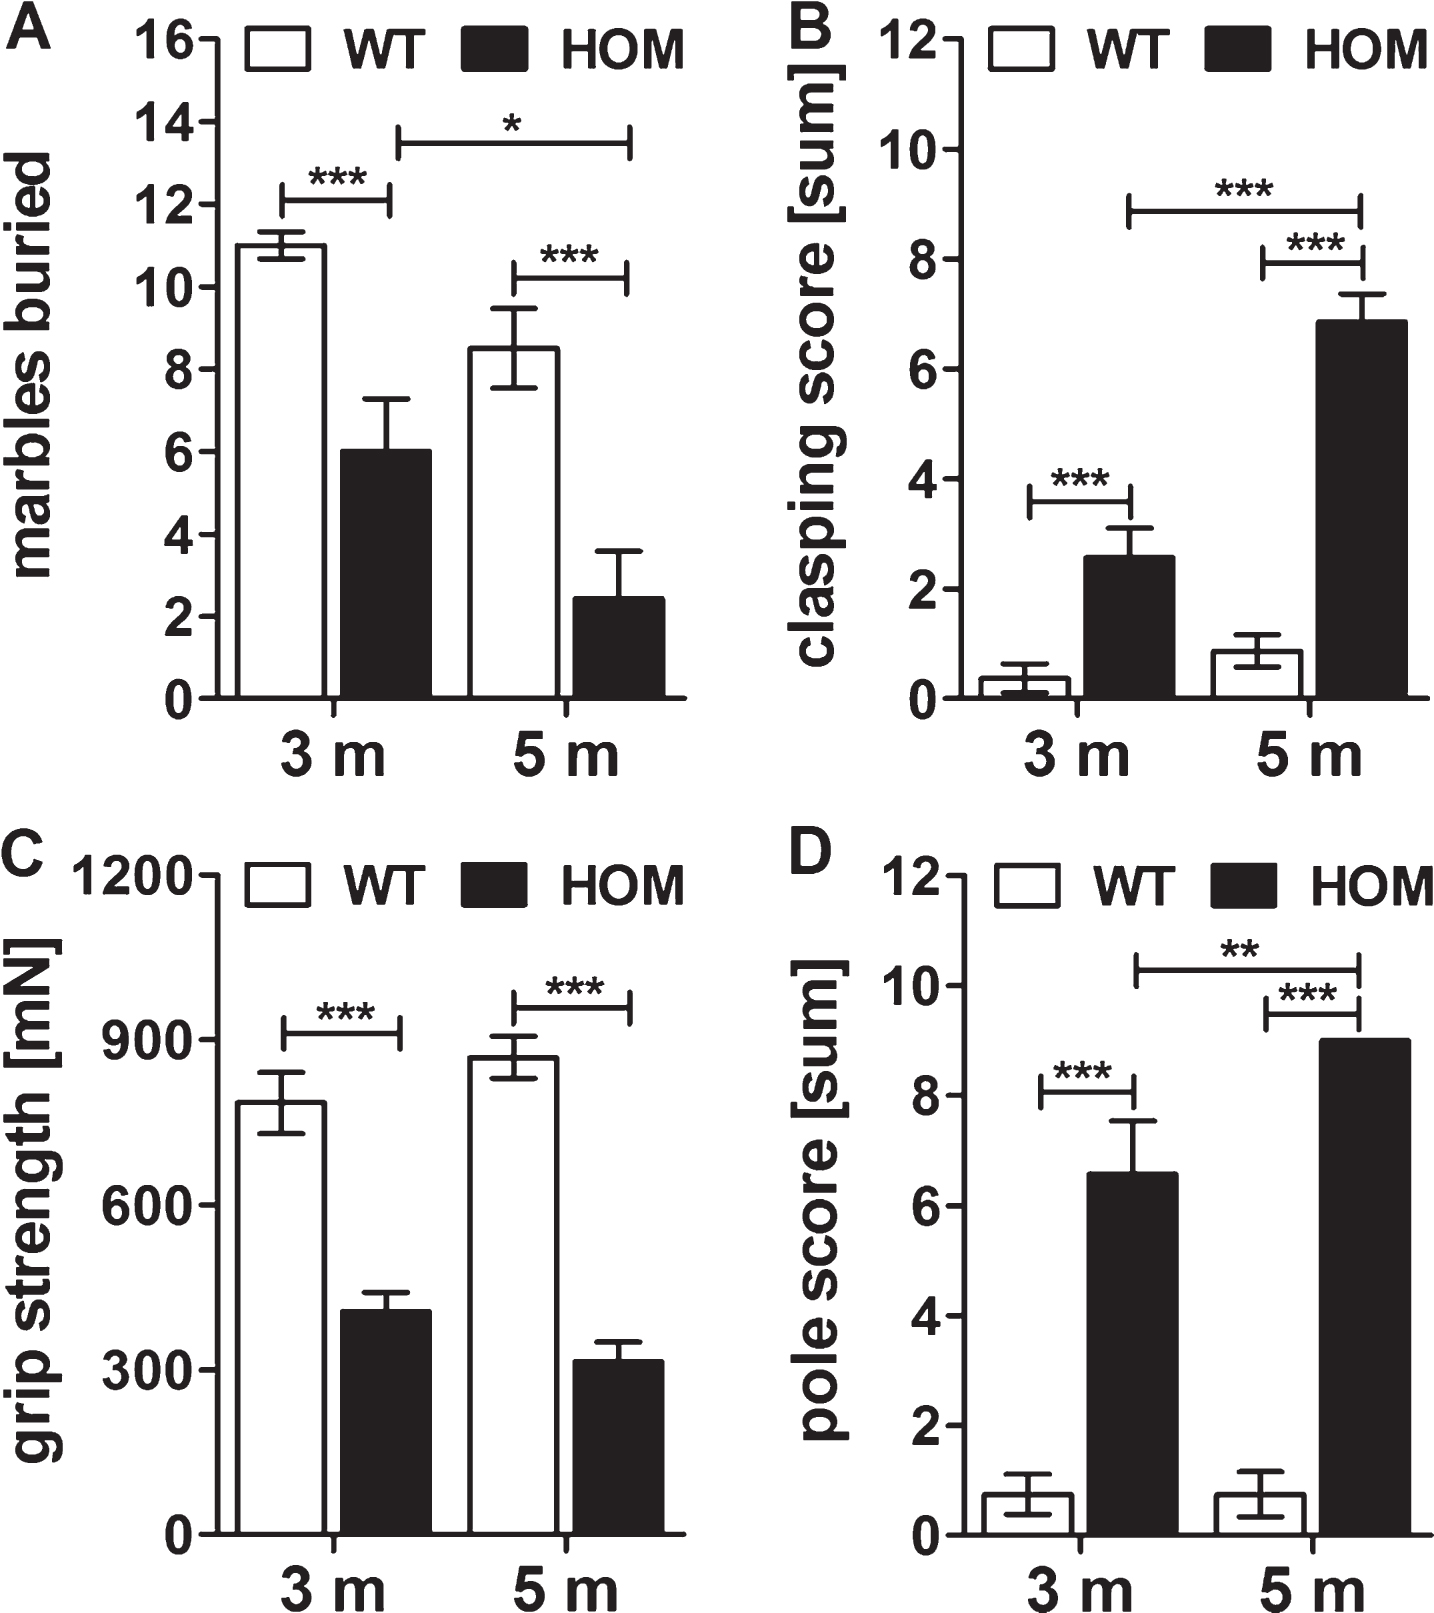
In order to characterize the motor deficits of the homozygous mice in more detail, we performed additional tests with homozygous and wild type mice at an age of 3 and 5 months using the marble burying, clasping and pole tests, and measured their grip strength. Homozygous mice buried significantly less marbles already at an age of 3 as well as at 5 months compared to their wild type littermates (two-way RM ANOVA, F (1,13) = 33.9, p < 0.001, Fisher LSD post hoc analysis, WT versus HOM 3 m p < 0.001, WT versus HOM 5 m p < 0.001), with a progression of the impaired burrowing behavior of HOM TBA2.1 mice within this test from 3 to 5 months of age (two-way RM ANOVA, F (1,13) = 9.5, p = 0.009; Fisher LSD post hoc analysis, HOM 5 m versus HOM 3 m p = 0.027) (Fig. 3A). Additionally, homozygous TBA2.1 mice showed a significantly reduced clasping score compared to the wild type littermates (two-way RM ANOVA, F (1,13) = 71.8, p < 0.001; Fisher LSD post hoc analysis, WT versus HOM 3 m p < 0.001, WT versus HOM 5 m p < 0.001), with a significant progression from 3 to 5 months of age (two-way RM ANOVA, F (1,13) = 63.8, p < 0.001; Fisher LSD post hoc analysis, HOM 5 m versus HOM 3 m p < 0.001) (Fig. 3B). The grip strength of homozygous TBA2.1 mice was also significantly reduced at both ages analyzed in comparison to their wild type littermates (two-way RM ANOVA, F (1,13) = 95.2, p < 0.001; Fisher LSD post hoc analysis, WT versus HOM 3 m p < 0.001, WT versus HOM 5 m p < 0.001), here without a significant progression of their forelimb strength from 3 to 5 months (two-way RM ANOVA, F (1,13) = 0.01, n.s) (Fig. 3C). Furthermore, in the pole test the mice showed similar deficits. Again, there was a significant difference in the performance of homozygous TBA2.1 mice at an age of 3 and 5 months compared to wild type littermates (two-way RM ANOVA, F (1,13) = 160.9, p < 0.001; Fisher LSD post hoc analysis, WT versus HOM 3 m p < 0.001, WT versus HOM 5 m p < 0.001), and a significantly declined performance from 3 to 5 months of age (two-way RM ANOVA, F (1,13) = 5.3, p = 0.035; Fisher LSD post hoc analysis, HOM 5 m versus HOM 3 m p = 0.008) (Fig. 3D).
Fig.3
Innate and motor behavior of wild type littermates (WT) and homozygous (HOM) TBA2.1 mice. Longitudinal study of WT and HOM male TBA2.1 mice. Behavior of marble burying (A), clasping (B), grip strength (C) and pole test (D) of HOM TBA2.1 mice was impaired compared to WT. Data is represented as mean±SEM, *p < 0.05, **p < 0.01, and ***p < 0.001.
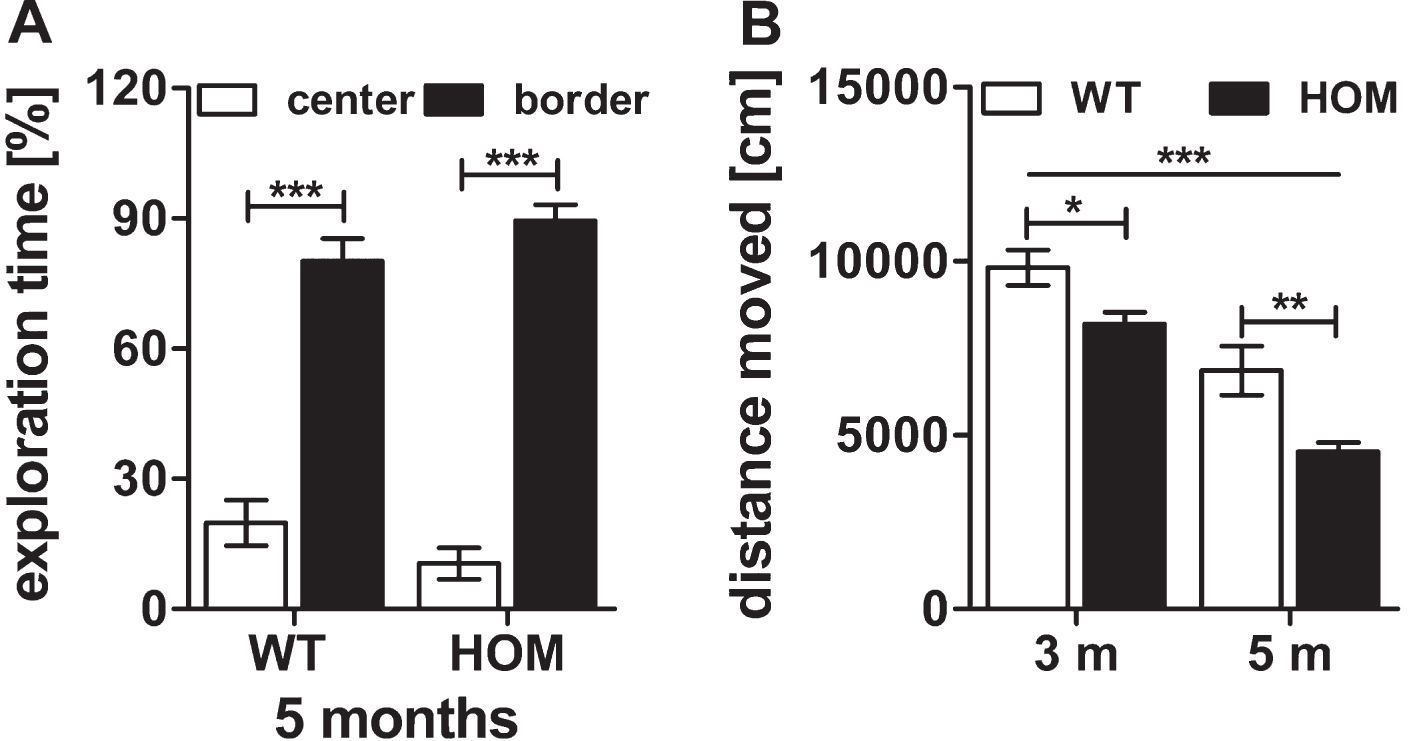
In this study, we also performed open field tests for the assessment of the exploratory/anxiety related and locomotive behavior of 3 and 5 months old wild type and homozygous TBA2.1 mice. There was a significant difference between the times spent in border and center zones during the 30 min test for all mice at an age of 5 months but not between the groups, indicating similar anxiety related behavior of homozygous and wild type mice (two-way ANOVA, zone: F (1,24) = 240.1, p < 0.001, genotype: F (1,24) = 2.1×10 -13, n.s.) (Fig. 4A). Nevertheless, there was a significant difference between the travelled distance of wild type and homozygous TBA2.1 mice at both ages analyzed (two-way RM ANOVA, F (1.24) = 10.2, p = 0.007; Fisher LSD post hoc analysis, WT versus HOM 3 m p = 0.037, WT versus HOM 5 m p = 0.007) (Fig. 4B). A decline in the moved distance from 3 to 5 months of age could be observed within both analyzed genotypes, indicating a possible habituation effect (two-way ANOVA, F (1,24) = 66.4, p < 0.001; Fisher LSD post hoc analysis, both p < 0.001) (Fig. 4B).
Fig.4
Open field activity of wild type (WT) and homozygous (HOM) TBA2.1 mice. No difference in exploratory behavior of center and border zone was observed between homozygous and wild type littermates in the open field test at an age of 5 months (A). A significant difference in the travelled distance was observed between WT and HOM mice (B). Data is represented as mean±SEM and *p < 0.5, **p < 0.01, and ***p < 0.001.
Phenotype assessment and motor coordination of aged heterozygous mice
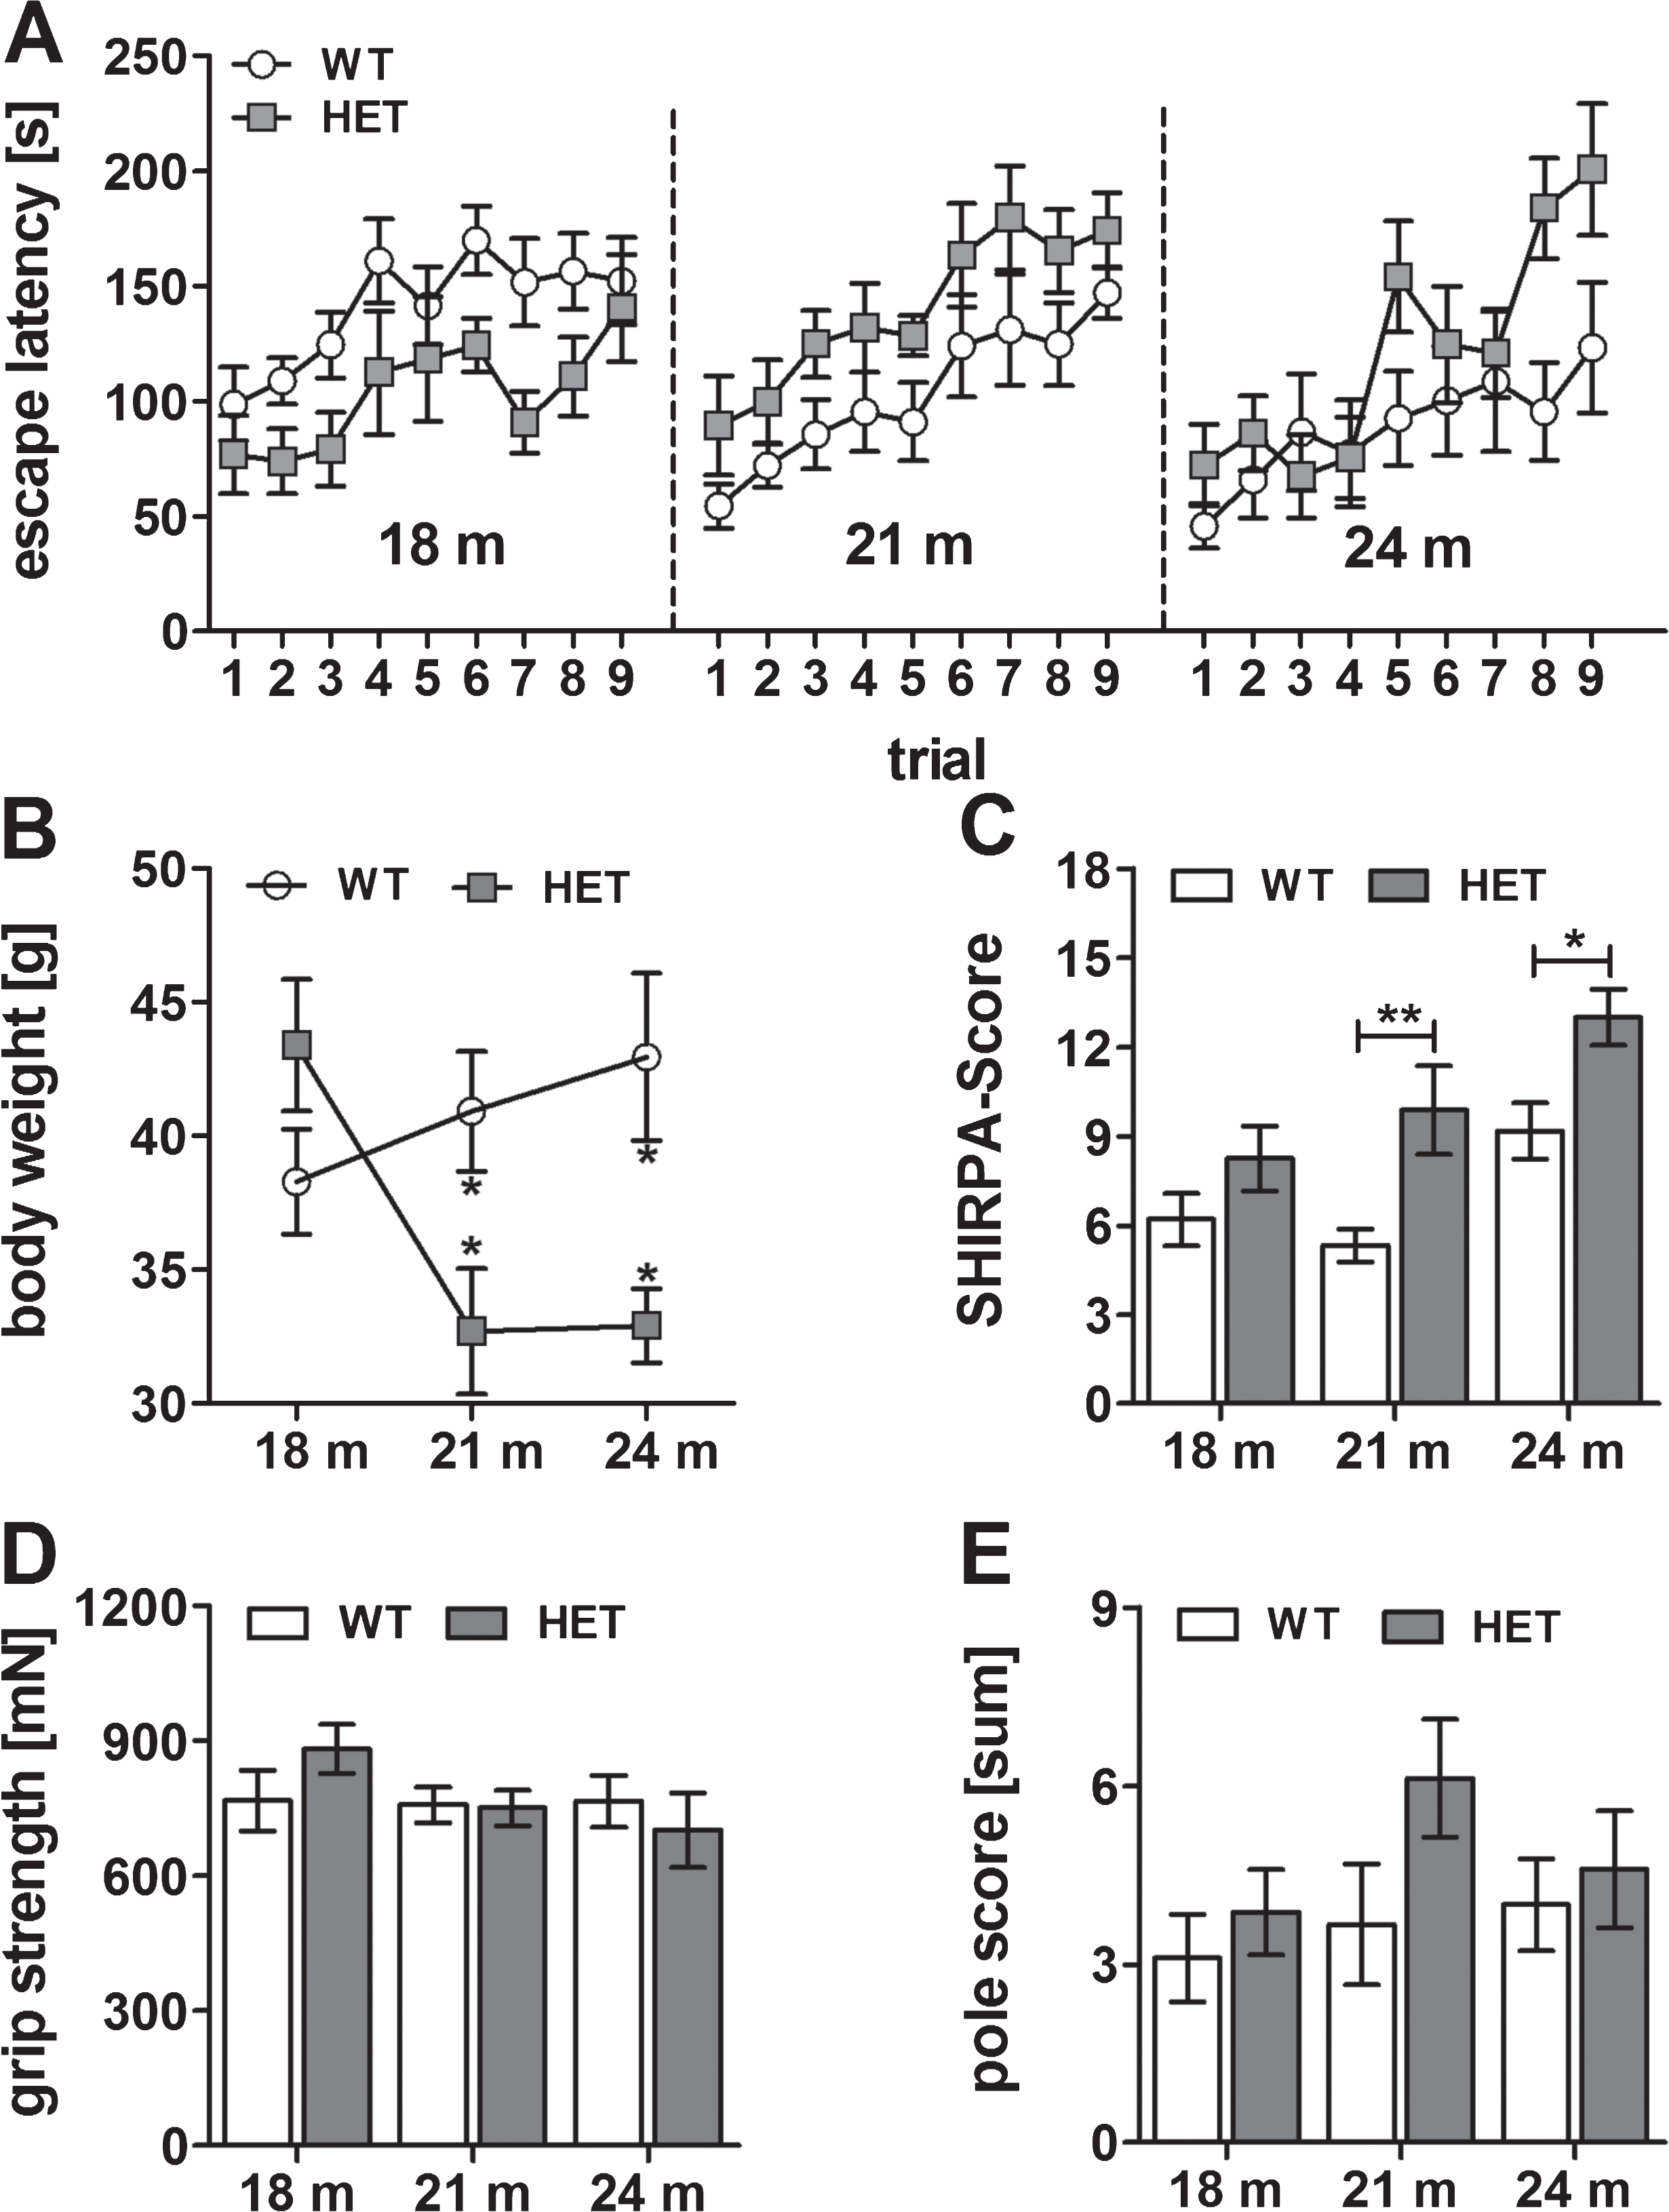
Since there were no significant differences in motor coordination in young heterozygous mice compared to wild type mice of the same age, we additionally analyzed them with 18, 21, and 24 months of age. Also, at that age motor coordination was similar between heterozygous and wild type mice (Friedman test, p < 0.001, Dunn test n.s.) (Fig. 5A). In the phenotype assessment at the age of 21 and 24 months, heterozygous mice showed a minor, but significant phenotype compared to wild type littermates at the respective age (two-way ANOVA, F (1,42) = 16.2, p < 0.001; Fisher LSD post hoc analysis, WT versus HET 18 m n.s., WT versus HET 21 m p = 0.002, WT versus HET 24 m p = 0.032) (Fig. 5C), which was underlined by a reduced body weight at the same age (two-way ANOVA, F (1,42) = 5.0, p = 0.031; Fisher LSD post hoc analysis, WT versus HET 18 m n.s. p = 0.11, WT versus HET 21 m p = 0.013, WT versus HET 24 m p = 0.014) (Fig. 5B). These minor changes are especially observable by an abnormal body carriage and gait, reduced pain response, and slightly reduced reflexes. A decreased body weight might be the result of a potential loss of muscle volume due to the reduced motor neuron innervation. The grip strength (two-way-ANOVA n.s) and the results of the pole test (two-way-ANOVA n.s.) of heterozygous mice were indistinguishable from those of the wild type mice (Fig. 5D, E). These results indicated a beginning phenotype in the heterozygous mice starting from 21 months of age but without impairment of the motor skills as measured on the rotarod.
Fig.5
Motor behavior of wild type (WT) and heterozygous (HET) mice at 18, 21, and 24 months of age. Rotarod performance was equal among WT and HET at all ages (A). Phenotype assessment using SHIRPA test battery showed a minor motor phenotype in heterozygous mice at 21 and 24 months of age (C) while the body weight was also reduced at the same age (B). The grip strength (D) and performance in the pole test (E) were not impaired at any age. Data is represented as mean±SEM and *p < 0.05.
Aβ pathology of 3 and 5 months old homozygous and aged heterozygous TBA2.1 mice
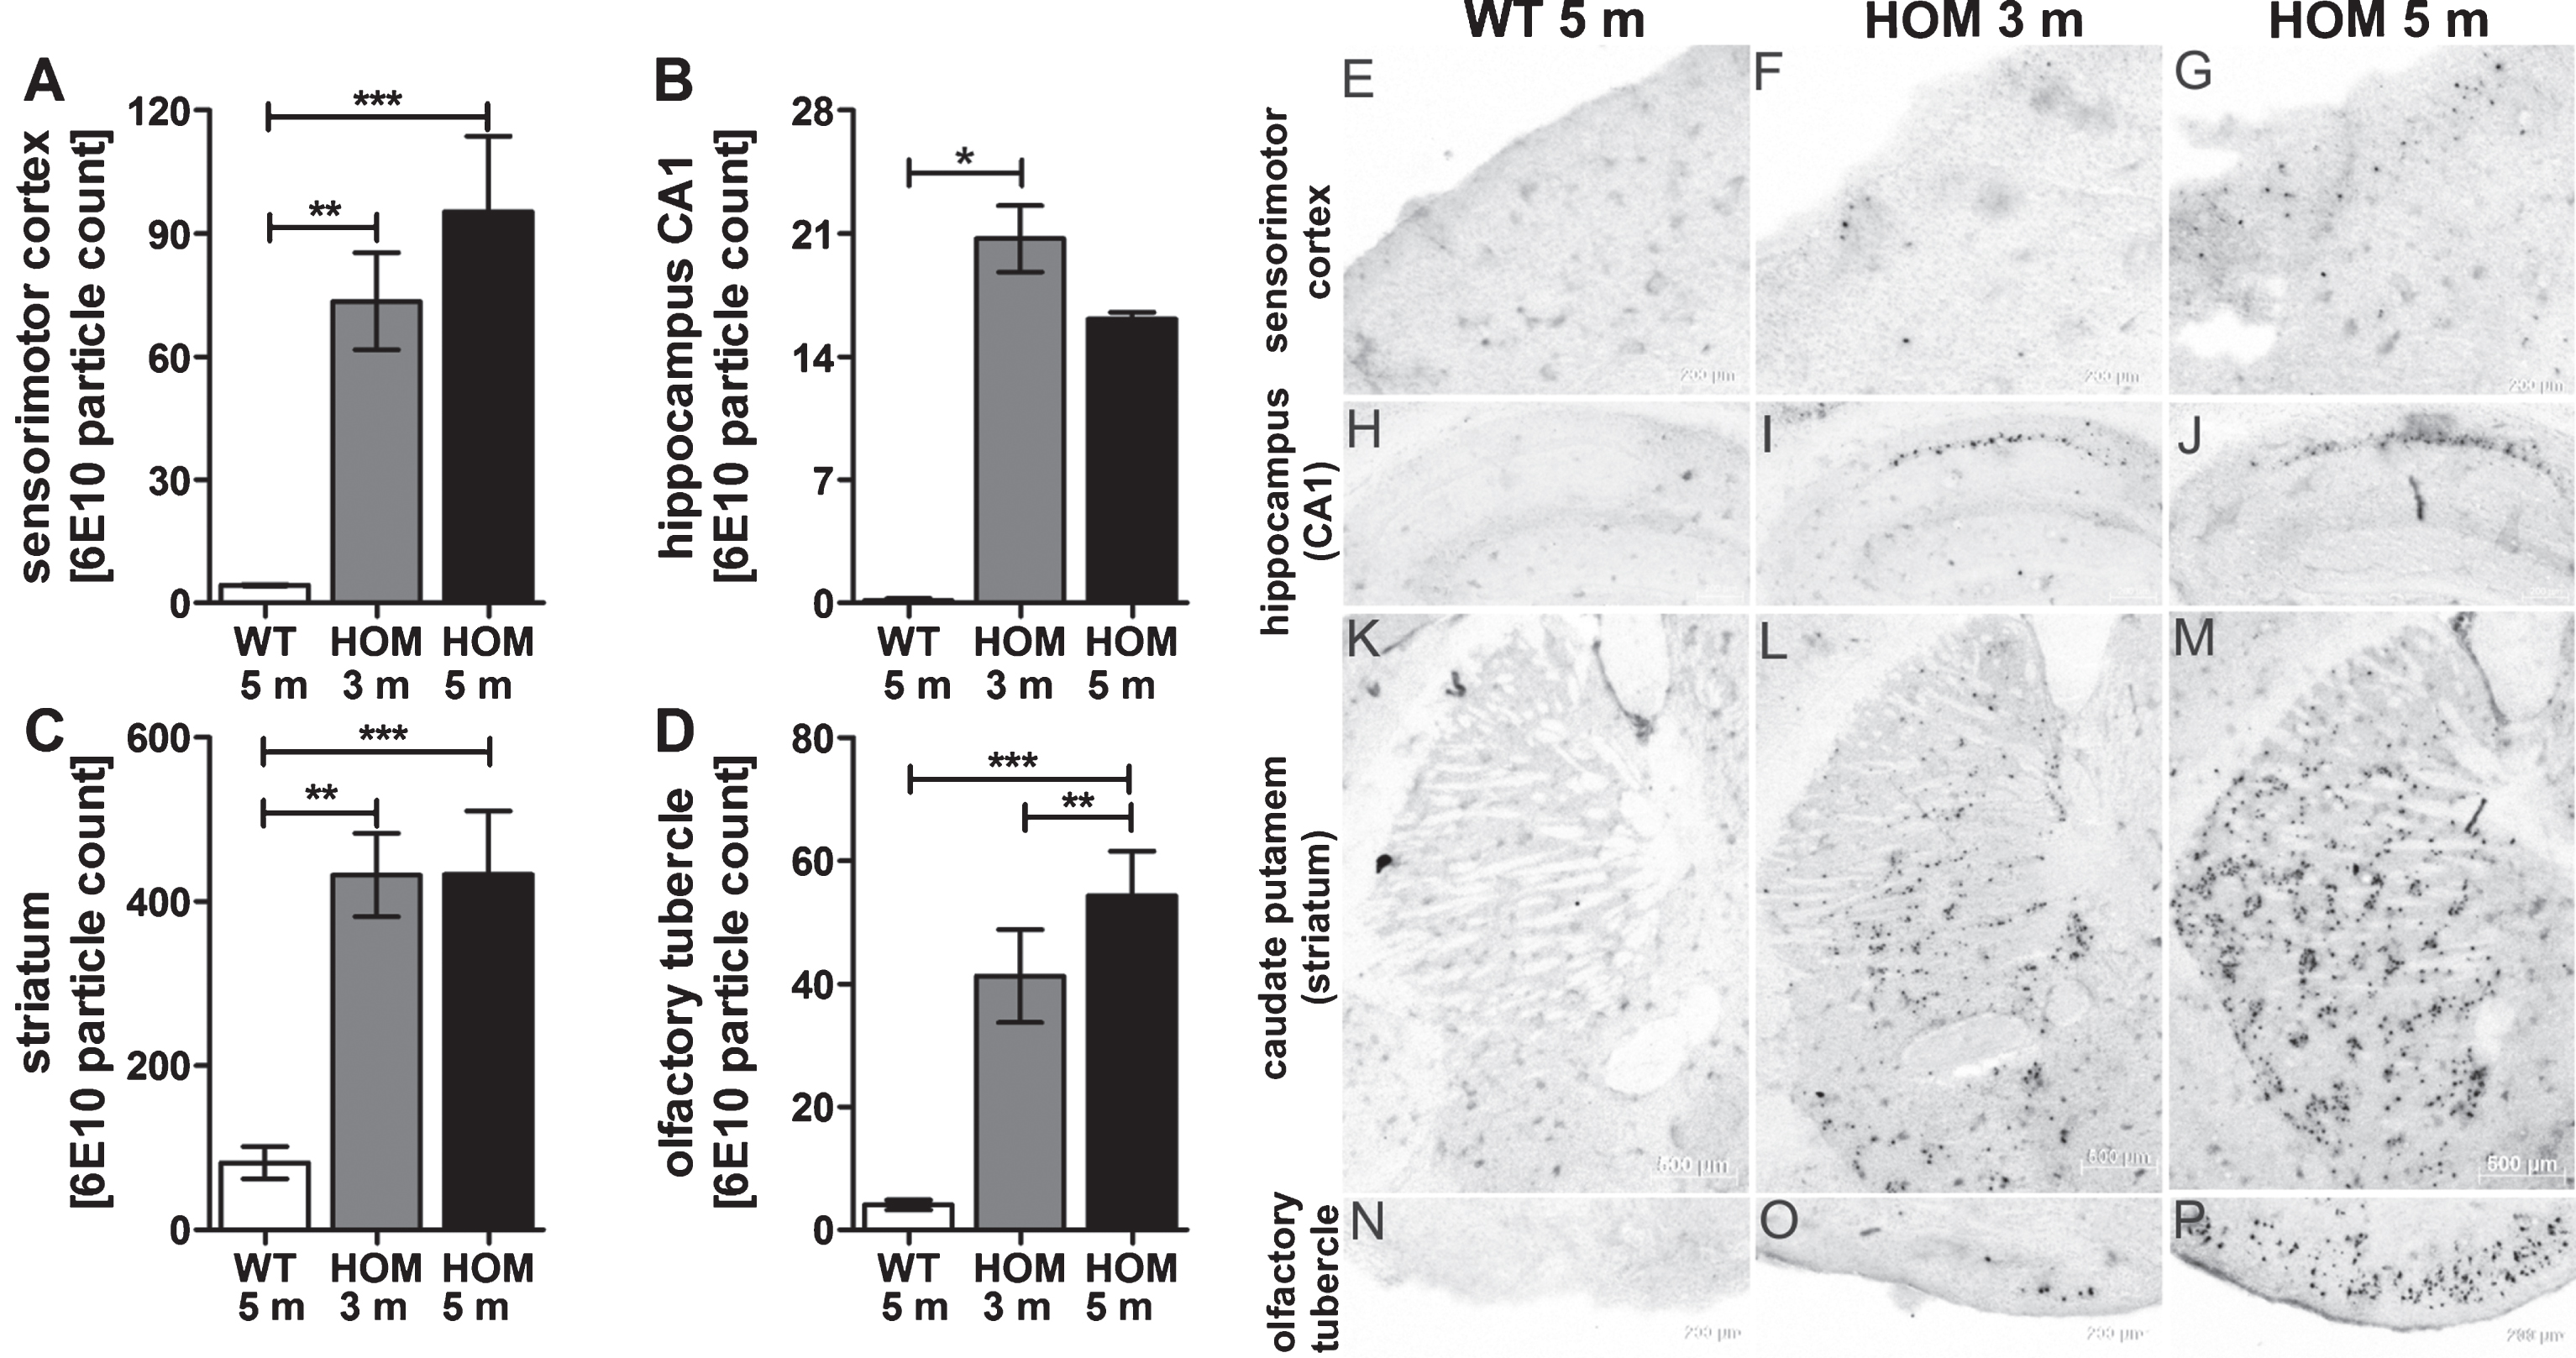
To complement our findings of the behavioral tests, we analyzed the Aβ pathology and quantified the amount of Aβ (immunohistochemistry using antibody 6E10) in different brain regions (olfactory tubercle, striatum (caudate putamen), sensorimotor area (cortex) and CA1 region (hippocampus)) and the amount of pEAβ3-42 protein levels with biochemical quantification (ELISA). In most of the currently used AD mouse models, Aβ deposits are described as diffuse or compact plaques of a size from about 10μm2 to a maximum size of 6,500μm2 [22]. In contrast, Aβ deposits of homozygous TBA2.1 mice are much smaller (average size 148μm2, maximum size 987μm2), and never diffuse, with more or less clear demarcation to their surrounding (Fig. 6E-P). In all analyzed regions, there was a significantly higher amount of Aβ particles in the brains of homozygous TBA2.1 mice at both ages compared to wild type littermates (cortex: one-way ANOVA F (2,14) = 11.7, p = 0.031; Fisher LSD post hoc analysis, WT versus HOM 3 m p = 0.003, WT versus HOM 5 m p < 0.001, HOM 3 m versus HOM 5 m n.s. p = 0.26; caudate putamen, striatum: one-way ANOVA F (2,14) = 13.5, p < 0.001; Fisher LSD post hoc analysis, WT versus HOM 3 m p < 0.001, WT versus HOM 5 m p < 0.001, HOM 3 m versus HOM 5 m n.s. p = 1; olfactory tubercle: one-way ANOVA F (2,14) = 15.5, p < 0.001; Fisher LSD post hoc analysis, WT versus HOM 3 m p = 0.001, WT versus HOM 5 m p < 0.001, HOM 3 m versus HOM 5 m n.s. p = 0.16; CA1 region hippocampus: Kruskal-Wallis one-way ANOVA on Ranks p = 0.001; Dunn’s post hoc analysis WT versus HOM 3 m p < 0.05, WT versus HOM 5 m n.s., HOM 3 m versus HOM 5 m n.s.).
Fig.6
Aβ aggregates in wild type (WT), and 3 and 5 months old homozygous (HOM) TBA2.1 mice. Aβ particles were visualized by 6E10 staining in wild type (WT), and 3 and 5 months old homozygous (HOM) TBA2.1 mice. Aβ particles were quantified in different brain regions (A, N-P: olfactory tubercle, B, K-M: caudate putamen (striatum), C, E-G: sensorimotor area (cortex), D, H-J: CA1 region (hippocampus)). Data is presented as mean±SEM; *p < 0.05, **p < 0.01, and ***p < 0.001.
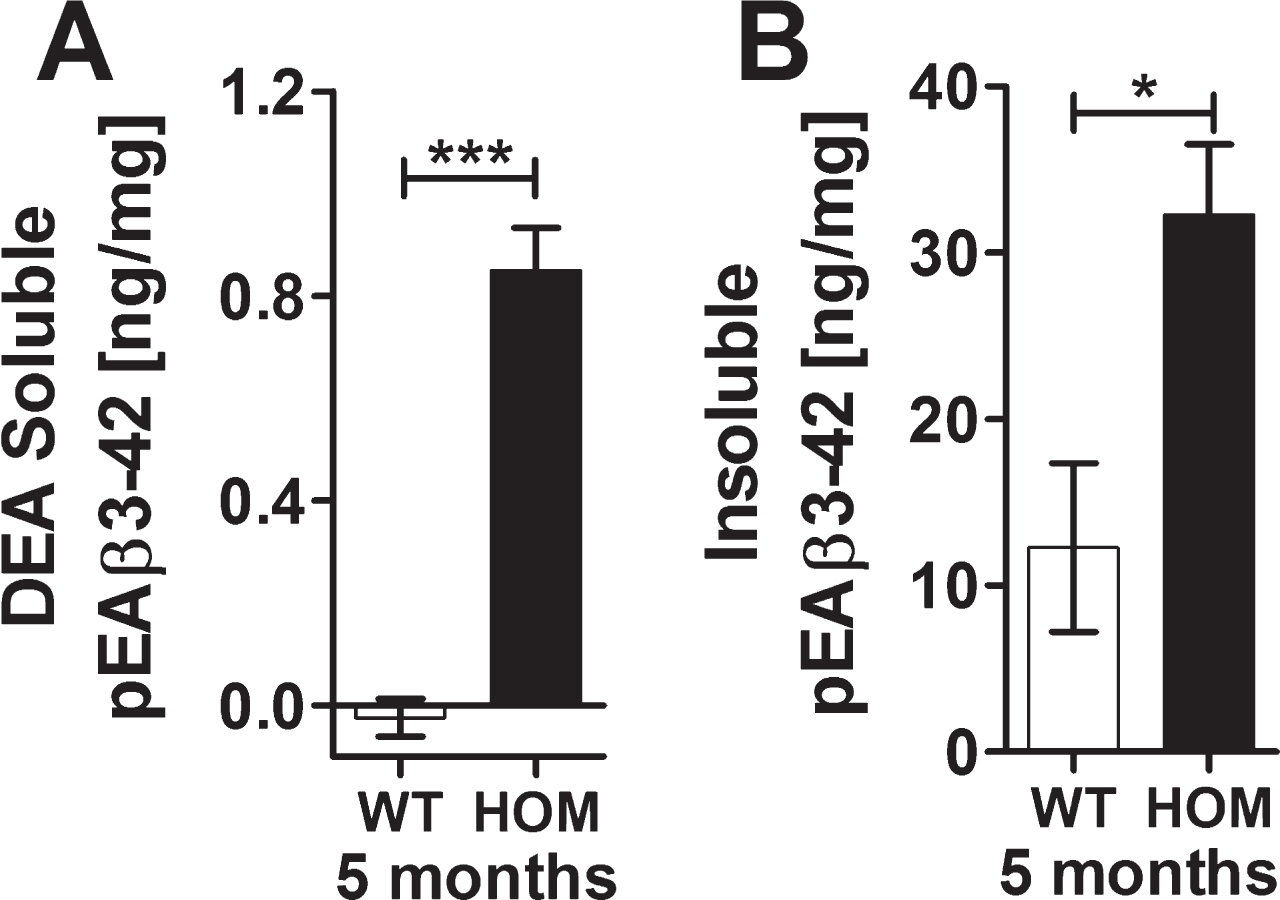
Quantifications of pEAβ3-42 protein levels in the hemispheres of homozygous TBA2.1 mice revealed a significant amount of 1.6±0.2 ng/ml of DEA-soluble pEAβ3-42, whereas the DEA-soluble fraction of the wild type hemisphere was below detection limit (unpaired two-tailed t test, p < 0.001). The insoluble fraction of pEAβ3-42 was about 32.3±4.3 ng/ml insoluble pEAβ3-42, which was statistically significant to the insoluble pEAβ3-42 fraction of the wild type hemispheres (unpaired two-tailed t test, p < 0.05). The wild type insoluble pEAβ3-42 was about 12.3±4.3 ng/ml representing endogenous murine pEAβ3-42 (Fig. 7A, B). All analyzed samples of the soluble Tris-fraction were below the detection limit.
Fig.7
Biochemical analysis of pEAβ3-42 of 5 months old wild type (WT) and homozygous (HOM) TBA2.1 mice. Biochemical analysis of DEA-soluble and insoluble pEAβ3-42 revealed a significant difference between wild type and 5 months old homozygous TBA2.1 mice. Data is represented as mean±SEM; *p < 0.05 and ***p < 0.001.
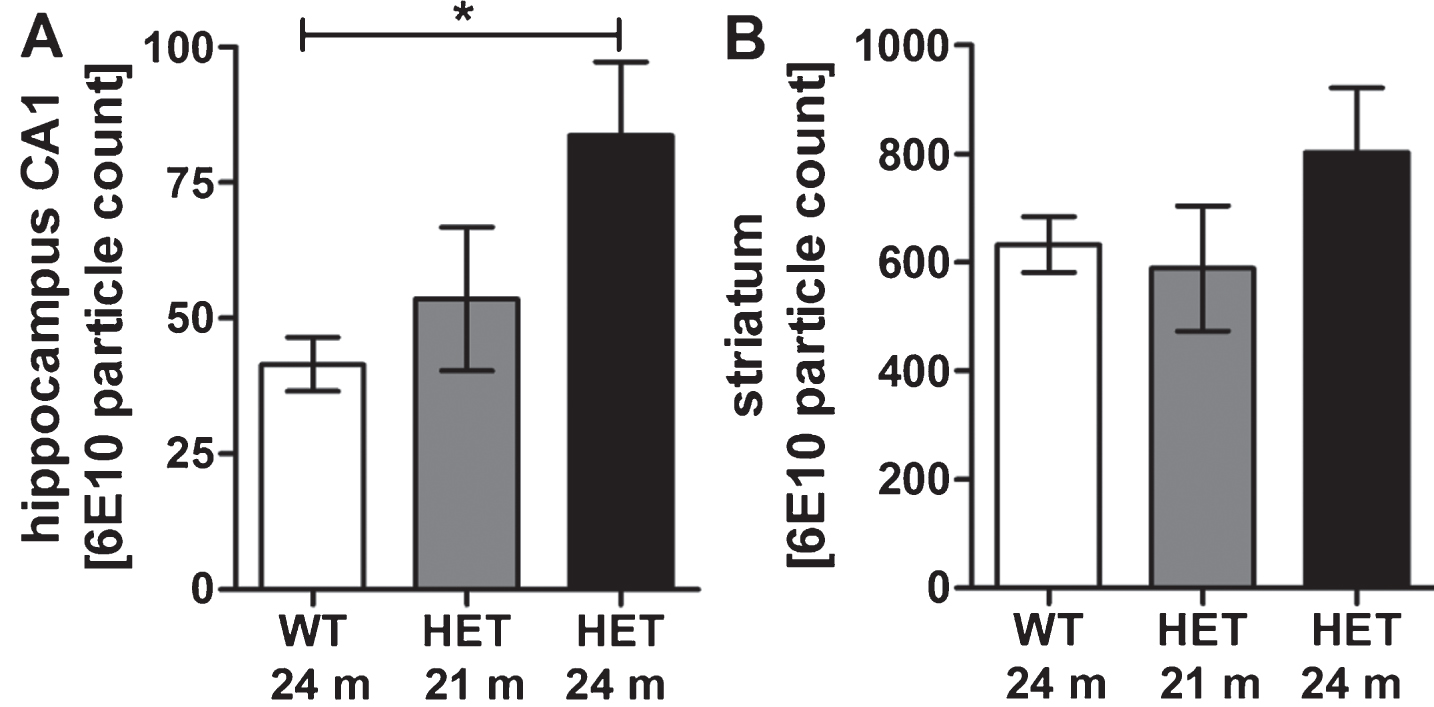
Quantification of the amount of Aβ in the brains of 18 and 24 months old heterozygous TBA2.1 mice achieved a significant increase of Aβ in the hippocampus of 24 months old heterozygous TBA2.1 mice in comparison to wild type mice (one-way ANOVA F (2,15) = 3.7, p = 0.05; Fisher LSD post hoc analysis, WT versus HET 24 m p = 0.02, WT versus HET 18 m n.s p = 0.08, HET 18 m versus HET 24 m n.s. p = 0.46) (Fig. 8A). There was no significant change in the amount of Aβ particles in the striatum of all analyzed ages of heterozygous TBA2.1 mice (one-way ANOVA F (2,15) = 1.3, n.s. p = 0.31) (Fig. 8B).
Fig.8
Aβ aggregates in wild type (WT), and 18 and 24 months old heterozygous (HET) TBA2.1 mice. Staining of Aβ deposits in 18 and 24 months old heterozygous TBA2.1 mice compared to 24 months old wild type littermates. Aβ deposits were quantified in the striatum and CA1 hippocampal region. Data is represented as mean±SEM; *p < 0.05.
Gliosis and neuronal loss in homozygous and aged heterozygous TBA2.1 mice
Additionally, we analyzed the neuronal loss of homozygous TBA2.1 mice in more detail. Quantification of all NeuN positive cells in the CA1 region revealed a significant decrease of neurons in homozygous mice of 3 and 5 months compared to 5 months old wild type mice (one-way ANOVA F (2,13) = 21.3, p < 0.001; Fisher LSD post hoc analysis, WT versus HOM 3 m p = 0.012, WT versus HOM 5 m p < 0.001, HOM 3 m versus HOM 5 m n.s. p = 0.37), without proceeding neuronal loss from 3 to 5 months of age (Table 2, Fig. 9). Within the striatum, no significant loss of neurons in 3 and 5 months old homozygous TBA2.1 mice was observed (one-way ANOVA F (2,13) = 21.3, n.s. p = 0.19) (Table 2, Fig. 9). Furthermore, no significant decrease of neurons was detectable within the motor cortex (one-way ANOVA F (2,13) = 21.3, n.s. p = 0.07).
Table 2
Neuronal loss and gliosis in homozygous TBA2.1 mice. Staining of activated astrocytes (GFAP), activated microglia (CD11b), and neuronal nuclei (NeuN) in 3 and 5 months old homozygous TBA2.1 mice (HOM) compared to 5 months old wild type littermates (WT). Quantification was performed in different brain areas (NeuN and GFAP: motor cortex, striatum, CA1, inferior colliculus, brain stem; CD11b: inferior colliculus, brain stem), resulting in a significant decrease of neurons in the CA1 region and, by trend, a decrease of neurons in the striatum. Analysis of gliosis revealed a significant increase of activated astrocytes and microglia in different brain areas, which are known to be involved in motor function
| Brain area | WT 5 m | HOM 3 m | HOM 5 m | Statistic | |
| NeuN (IR area [%]) | Motor cortex | 11.3±0.4 | 13.7±0.8 | 13.3±0.9 | n.s. |
| Striatum | 10.0±1.3 | 6.7±0.7 | 4.5±0.4 | n.s. | |
| CA1 | 47.5±3.1 | 30.6±1.8 | 27.3±1.7 | WT vs. HOM 3 m p = 0.012; WT vs. HOM 5 m p = 0.001; HOM 3 m vs. HOM 5 m n.s. | |
| Inferior colliculus | 2.8±0.5 | 2.2±0.5 | 2.4±0.3 | n.s. | |
| Brain stem | 9.4±1.6 | 7.6±1.6 | 8.9±0.6 | n.s. | |
| GFAP (IR area [%]) | Motor cortex | 6.6±0.8 | 9.2±0.7 | 8.8±0.5 | WT vs. HOM 3 m p = 0 026; WT vs. HOM 5 m p = 0.046; HOM 3 m vs. HOM 5 m n.s. |
| Striatum | 2.2±0.2 | 2.0±0.2 | 2.3±0.3 | n.s. | |
| CA1 | 7.9±1.6 | 18.7±2.5 | 9.0±1.7 | WT vs. HOM 3 m p = 0 002; WT vs. HOM 5 m n.s.; HOM 3 m vs. HOM 5 m p = 0 004 | |
| Inferior colliculus | 10.4±1.9 | 11.7±1.1 | 12.4±2.4 | n.s. | |
| Brain stem | 19.5±2.6 | 17.4±1.1 | 18.4±1.5 | n.s. | |
| CD11b (IR area [% ]) | Inferior colliculus | 0.7±0.2 | 2.0±0.6 | 3.2±0.9 | n.s. |
| Brain stem | 1.8±0.7 | 9.7±1.0 | 11.6±1.7 | WT vs. HOM 3 m p < 0.001; WT vs. HOM 5 m p = 0.002; HOM 3 m vs. HOM 5 m n.s. |
Data is presented as mean±SEM, **p < 0.01 and ***p < 0.001.
Additionally, we analyzed activated astrocytes in and around the CA1 region, as well as in the striatum. There was no significant difference in the amount of activated astrocytes in the striatum between 5 months old wild type and 3 as well as 5 months old homozygous TBA2.1 mice (one-way ANOVA F (2,13) = 0.6, n.s. p = 0.59) (Table 2, Fig. 9), but there was a significant increase of GFAP positive cells in the CA1 region of the hippocampus. Here, we observed a significant increase of the amount of GFAP positive cells in 3 months old homozygous TBA2.1 mice compared to wild type mice. Interestingly, at 5 months of age, the GFAP positive area in the CA1 region of homozygous TBA2.1 mice dropped again to levels comparable of wild type mice (one-way ANOVA F (2,13) = 21.3, p = 0.004; Fisher LSD post hoc analysis, WT versus HOM 3 m p = 0.002, WT versus HOM 5 m n.s. p = 0.66, HOM 3 m versus HOM 5 m. p = 0.004) (Table 2, Fig. 9). Analysis of activated astrocytes within the motor cortex revealed a significant increase of this cell type in 3 and 5 months old homozygous TBA2.1 mice (one-way ANOVA F (2,15) = 3.86, p = 0.048; Fisher LSD post hoc analysis, WT versus HOM 3 m p = 0.026, WT versus HOM 5 m n.s. p = 0.66, HOM 3 m versus HOM 5 m p = 0.046) (Table 2, Fig. 9).
Fig.9
Gliosis and neuronal loss in homozygous TBA2.1 mice. Representative immunofluorescence and bright field images of the motorcortex, CA1 hippocampal region, striatum, and brain stem of a 5 months old wild type (WT), and 3 and 5 months old homozygous (HOM) mice illustrating activated astrocytes (GFAP, green, A-I), activated microglia (CD11b, bright field, J-K) and neuronal nuclei (NeuN, red, A-I). Counterstaining was performed with DAPI (A-I).
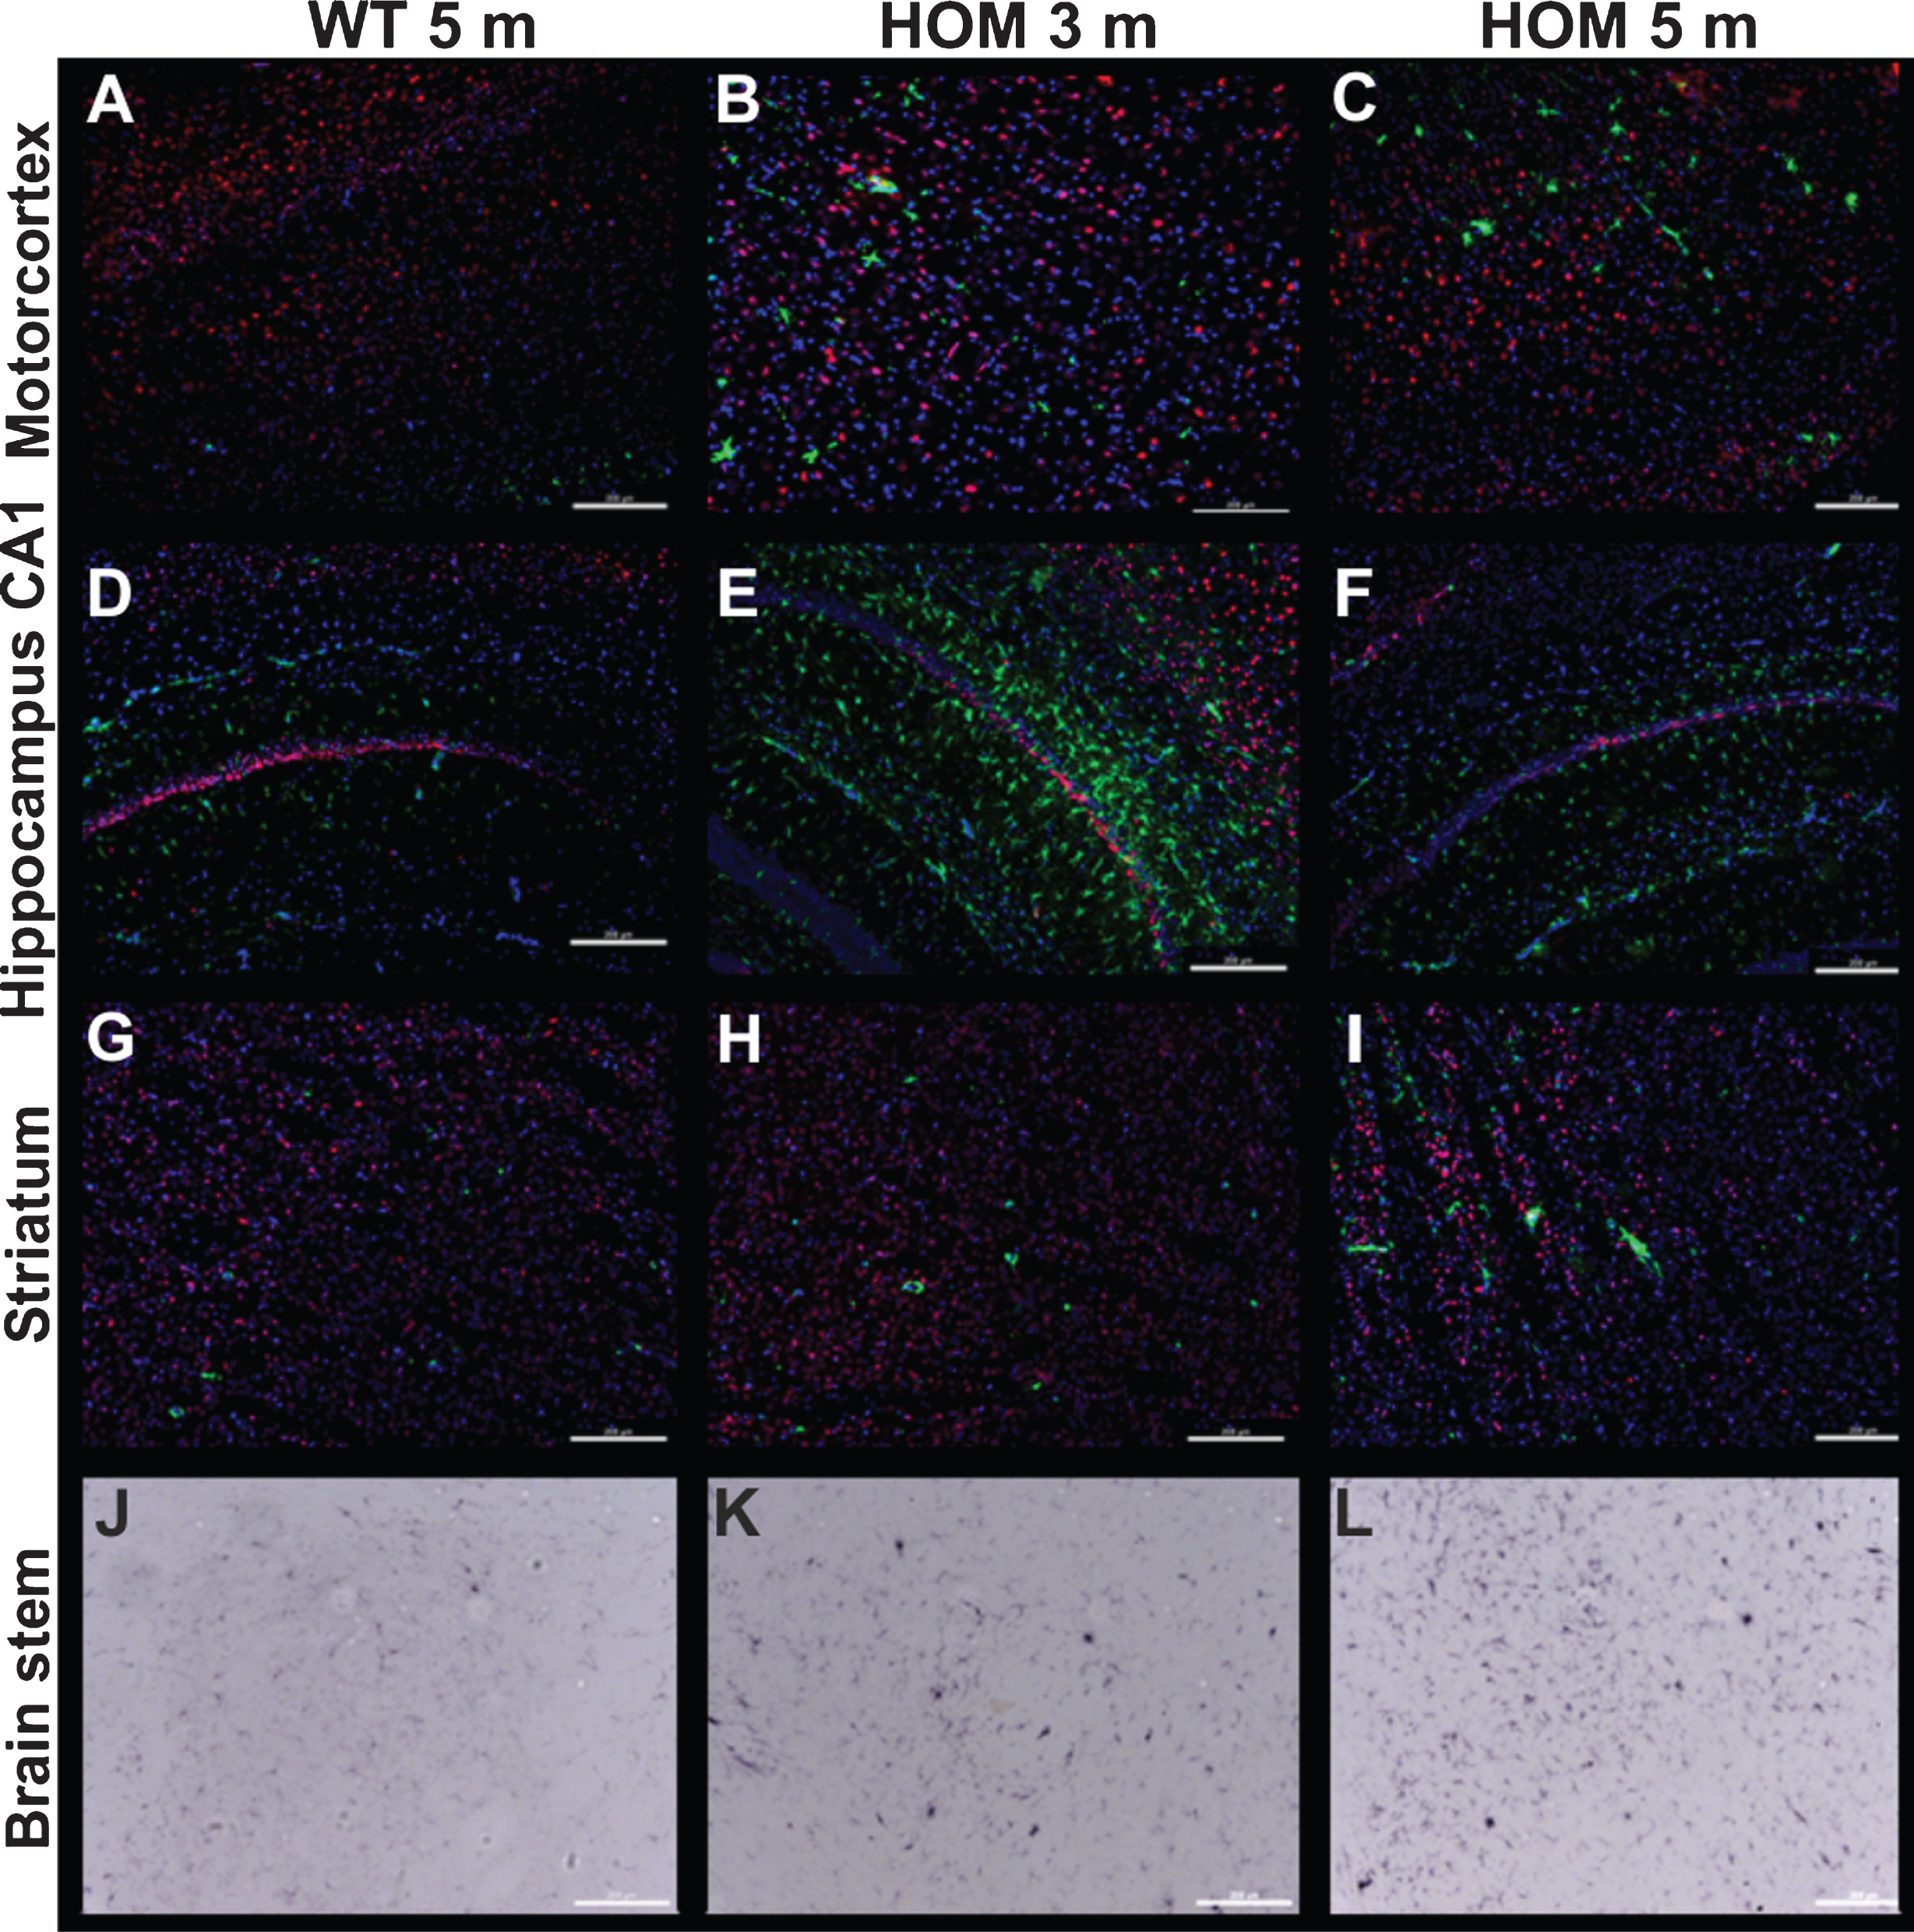
To analyze the inflammatory processes in more detail, we performed additional CD11b staining to visualize and quantify activated microglia. We found CD11b positive areas in the brain stem, inferior colliculus, and a negligible amount of CD11b positive cells in parts of the thalamus and substantia nigra. Quantification revealed a significant increase of activated microglia in the brain stem of 3 as well as 5 months old homozygous TBA2.1 mice in comparison to 5 months old wild type mice (one-way ANOVA F (2,15) = 12.45, p < 0.001; Fisher LSD post hoc analysis, WT versus HOM 3 m p = 0.002, WT versus HOM 5 m n.s. p < 0.001, HOM 3 m versus HOM 5 m n.s. p = 0.31, Table 2). There was no significant difference observed within the midbrain (inferior colliculus) (one-way ANOVA F (2,15) = 2.71 n.s., p = 0.1, Table 2, Fig. 9).
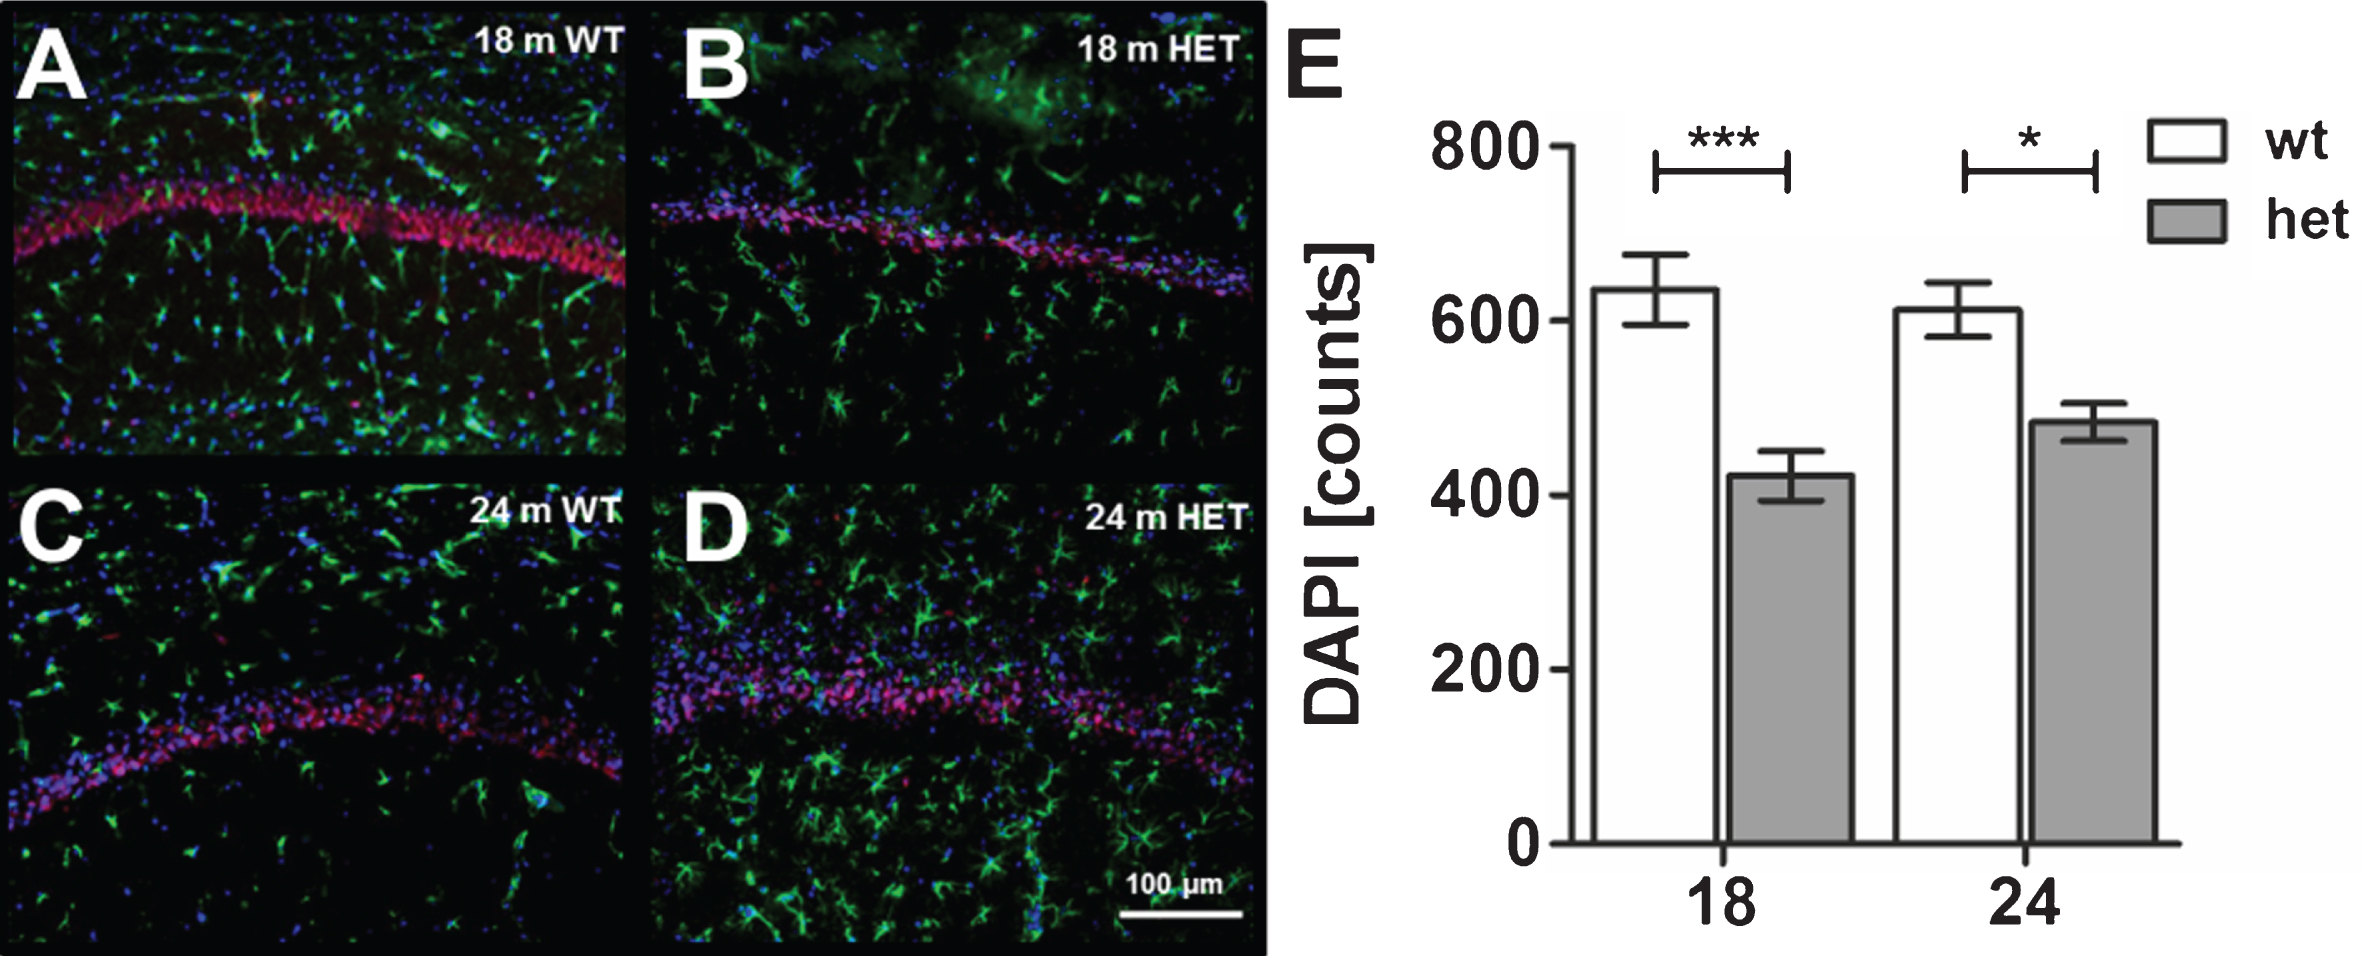
In addition, we analyzed the possible loss of neurons within the CA1 region of 18 and 24 months old heterozygous mice compared to 18 and 24 months old wild type TBA2.1 mice. Based on the DAPI nuclear staining and quantification, we found significant loss of nuclei in 18 and 24 months old heterozygous TBA2.1 mice compared to wild type mice at the same age (two-way ANOVA F (1,24) = 26.46, p < 0.001; Fisher LSD post hoc analysis, WT versus HET 18 m p < 0.001, WT versus HET 24 m. p = 0.011, HET 18 m versus HET 24 m. n.s. p = 0.23, WT 18 m versus HET 24 m. n.s. p = 0.6), but not between heterozygous or wild type mice with increasing age (Fig. 10).
Fig.10
Astrocytosis and neuronal loss in wild type (WT) and aged heterozygous (HET) TBA2.1 mice. Staining of activated astrocytes (GFAP) and neuronal nuclei (NeuN) in 18 and 24 months old HET TBA2.1 mice in comparison to 18 and 24 months old WT littermates (A-D). All nuclei were counter stained with DAPI. Quantification of the number of nuclei (DAPI counts) in CA1 hippocampal region revealed a significant difference between WT and HET TBA2.1 mice at both analyzed ages, but not between 24 months old HET TBA2.1 and WT mice (E). Data is represented as mean±SEM and *p < 0.05 and ***p < 0.001.
DISCUSSION
AD has been intensively studied for more than 100 years in order to understand the underlying mechanisms for the development of neurodegeneration and to find an effective therapy to slow down or stop disease progression. In preclinical research, rodent models are frequently used and offer the possibility to verify hypotheses which are established based on experiments in vitro. AD is the most common neurodegenerative disorder and still, most of the animal models used do not exhibit all features of AD. While cognitive deficits, amyloid deposits or neurofibrillary tangles and some kind of inflammation are observable in many AD mouse lines, neurodegeneration is observed only in a few mouse models [23, 24]. There is an urgent need for mouse models, which develop neurodegeneration, because this is one of the major pathological hallmarks of AD in humans. To avoid further failures of AD clinical trials with Aβ-targeting drug candidates, it is advisable to test the respective compounds in animal models that develop neurodegeneration based on Aβ-aggregation mediated toxicity.
In this study, we used the TBA2.1 mouse model, which was previously introduced and described showing a pEAβ3-42 induced neurodegenerative phenotype [11]. As reviewed by Bayer and Wirths, pEAβ3-42 can be frequently found in plaques and CAA in the brains of human AD patients [25]. There, it is generated by cleavage of the first N-terminal two amino acids, aspartate and alanine, resulting in a newly formed N-terminus (glutamate at position three). Thereafter, a PTM occurs where glutamate is converted to pyroglutamate by cyclization via a glutaminyl cyclase. This PTM results in altered biochemical functions such as an enhanced oligomerization tendency and higher neurotoxic properties [9]. In addition, more and more evidence exists that Aβ plaques are not responsible for synaptic dysfunction, neurodegeneration, and finally dementia. According to a hypothesis by Alexandru et al., the QC-dependent generation of pEAβx - 42 could explain the discrepancy between healthy individuals with Aβ plaques and AD patients. To gain more knowledge about the clinical importance of pEAβ, the TBA2.1 mouse model was developed [11].
Alexandru and colleagues first described some deficits of the homozygous mice, but did not look into the phenotype of heterozygous TBA2.1 mice in detail [11]. Thus, the aim of this work was to increase knowledge about the pEAβ3-42 induced neurodegenerative process in AD by validating and extending the existing findings with homozygous and heterozygous TBA2.1 mice. Furthermore, we aimed at identifying additional robust motor behavioral tests which are suitable for longitudinal monitoring of homozygous TBA2.1 mice in future therapeutic studies.
Our results confirm the progressive early-onset motor neurodegenerative phenotype of the homozygous mice using the SHIRPA phenotype assessment and the accelerating rotarod test. Additional motor related tests, namely marble burying, clasping, grip strength, pole test, and open field test, revealed severe motor impairments of homozygous mice already at an age of 3 months of which some progressed further until the age of 5 months. Most of these tests picked up not only motor disabilities but also deficits in the intuitive or generic behavior and the basal ganglia of the mice [26]. All proved to be suitable for a robust measurement of the phenotype of homozygous TBA2.1 mice and thus as a useful and meaningful read out in preclinical drug testing. In particular, those tests, which were able to measure phenotype progression, i.e., SHIRPA test, marble burying, clasping, pole test, and open field test, are considered useful for a potential longitudinal monitoring of a treatment success in the homozygous mouse model, as they can be applied repeatedly with little bias by learning or habituation processes. Actually, successful monitoring of a preclinical therapeutic study with this mouse model has already been demonstrated using the SHIRPA and rotarod tests [19, 20]. The number of mice used in the here described characterization study was based on our experience with this mouse model in these previous studies [19, 20]. This was also confirmed by statistical power analysis. In detail, the group sizes were sufficient considering an appropriate, biologically relevant effect, with regard to the changes between wild type and homozygous mice. Despite the profound phenotype in homozygous and in some parts also in heterozygous mice assessments using larger groups of mice allow for discrimination of smaller differences in certain brain regions or at younger ages and increase the statistical power. This has to be considered for planning of future treatment studies as a statistically significant effect might not be achieved with such small group sizes, especially if the treatment will not lead to complete reversal of the phenotype. Therefore, the use of larger group sizes is recommended for such preclinical therapeutic studies.
In heterozygous mice a mild, most likely starting phenotype initiating at 21 months was found in the SHIRPA phenotype assessment, which was confirmed by a drop in body weight. However, these phenotypic deficits did not have any impact on the motor abilities as tested in the rotarod test of the mice. Possible explanations are, on the one hand that the phenotype in heterozygous mice is only very slowly progressing, starting with abnormalities in the obviously very sensitive SHIRPA test and progressing further to motor disabilities. On the other hand, the number of analyzed heterozygous TBA2.1 mice was comparably low. One might speculate that by use of more mice per group a significant effect might have been achieved Nevertheless, the late-onset of phenotypic changes in heterozygous in comparison to homozygous mice suggests that the induced deficits are strongly dependent on the gene-dosage of the transgenic Aβ(Q3-42) expression, and thereby pEAβ3-42 level rather than a threshold for initiating neuropathological processes as suggested before [11]. This hypothesis is further underlined by the analysis of the Aβ pathology, in which we were able to find significant changes in the hippocampus of heterozygous mice only at 24 months, an age when the striatum did not show pathology yet.
Furthermore, we analyzed the neuropathological changes in the brains of homozygous TB2.1 mice in more detail. Aβ was found in form of small aggregated particles widely spread over the brain, especially in the striatum, the CA1 region of the hippocampus, brainstem, and midbrain (inferior colliculus) confirming earlier reports [11]. Moreover, we observed Aβ aggregates in the somatomotor area of the cortex and the olfactory tubercle at all analyzed ages in homozygous TBA2.1 mice. As previously described, homozygous TBA2.1 mice showed a dramatic neuronal loss in the CA1 hippocampal region already at 3 months of age. In heterozygous mice, we assessed the number of nuclei in the CA1 region to be significantly reduced at 18 and 24 months of age compared to wild type littermates of the same age. We assume that heterozygous TBA2.1 mice will develop a similar pathology compared to homozygous TBA2.1 mice, but at a very old age when there are limitations to use them for possible therapeutic studies.
To further characterize the distribution of activated astrocytes and microglia in homozygous TBA2.1 mice in more detail, we quantified the GFAP and CD11b positive area in different brain regions. There was a significant increase of CD11b positive cells in the brain stem, indicating massive inflammatory processes in a region, which is known to be involved in motor functions. There was only a negligible amount of astrocytes in the striatum without a significant alteration of GFAP positive cells in homozygous TBA2.1 mice at all analyzed ages in comparison to their wild type littermates. In contrast, the amount of GFAP positive cells in the CA1 hippocampal region was significantly higher in 3, but not in 5 months old homozygous TBA2.1 mice. Although the number of analyzed mice was relatively small, the investigated effect here is in accordance with the results published by Alexandru et al. [11]. Since massive neuronal loss was observed at 3 and 5 months of age in this hippocampal area, these finding suggests a dysfunctional chemical transmission between neurons and astrocytes or in neuronal-glial synapses at the age of 5 months [27], because within this age significantly less astrocytes were detectable in the CA1 hippocampal region compared to 3 months old homozygous TBA2.1 mice.
Depositions of Aβ aggregates in various brain areas, neuronal loss in the hippocampus and striatum in combination with severe motor deficits suggest that the basal ganglia might be affected in homozygous TBA2.1 mice. Aβ deposits and neuronal loss are found in nearly all structures of the basal ganglia organization. The connectivity of basal ganglia processes motor information about complex control loops, whereby the motor stimuli of the cortex are processed by the striatum, substantia nigra, globus pallidus, and thalamus whence the result is sent back to the cortex to give a motor output [28, 29]. Future work by us or others should pay attention on an in-depth analysis of the possibly dysfunctional basal ganglia network, since some of the accomplished motor behavioral tests reflect impairments of the basal ganglia network, which might be a further explanation for the severe motor impairments.
In contrast to the widely used APP or APP/PS expressing mouse models, for which only subtle neurodegeneration could be shown, homozygous TBA2.1 mice exhibit massive neuronal loss at very early age. A few mouse models are described in the literature expressing N-terminally truncated forms of Aβ, especially pEAβ3-42 and Aβ4 - 42. Those models are characterized by neuronal loss, in particular detectable in the CA1 hippocampal region [30–34]. Moreover, they display either cognitive deficits alone or in combination with motor deficits. However, most of them develop neuronal loss or onset of the phenotype not before the age of 8 months. In contrast, the onset of the phenotype in homozygous TBA2.1 is observable already at 2 months of age and progresses rapidly [11, 20]. Due to the neuronal loss within the CA1 hippocampal region, which is a brain region involved in learning, one might expect that TBA2.1 mice will also display cognitive deficits. However, we have not addressed cognition within this study as the aim was to further characterize solely the motor phenotype. Whether there is indeed cognitive impairment has to be elucidated in future experiments. In any case, most of the behavioral tests for measuring cognitive deficits require motor skills, intact sensory function and reflexes [35, 36]. In these tests, mice are requested to explore areas (e.g., object recognition test or mazes) or react to external stimuli (e.g., passive avoidance task, fear conditioning memory test). To the best of our knowledge, dependence on intact motor and sensory function cannot be ruled out completely. Therefore, when testing homozygous TBA2.1 mice with compromised motor and reflex functions a learning effect might not be clearly detected since the neurological disorder will always bias the output. Due to this reason, tests for the evaluation of potential cognitive deficits in transgenic TBA2.1 should be selected and performed very carefully.
In summary, the findings of this study demonstrate a first evidence that the neurodegeneration in TBA2.1 mice is strongly dependent on the level of human pEAβ3–42 as there is a clear gene-dosage dependence of all pathological manifestations and neurodegenerative phenotypes. The behavioral set ups validated here provide a robust read out, which is able to pick up progression of the degenerative phenotype of homozygous TBA2.1 mice. A model exhibiting a clearly progressive phenotype based on neuronal loss is of advantage for preclinical treatment studies, validating therapeutic substances targeting toxic Aβ species. Even though the homozygous TBA2.1 mice exhibit rapid progression of their phenotype, they have already successfully been used for treatment studies [19, 20]. Moreover, the results of the behavioral and pathological examinations propose the TBA2.1 mouse model as an additional suitable mouse model for longitudinal studies with substances targeting Aβ, whose therapeutic efficacy was shown in an AD mouse model with cognitive deficits previously.
ACKNOWLEDGMENTS
The first breeding pairs of TBA2.1 mice were a generous gift by Probiodrug. Financial support of D.W. was provided by “Portfolio Technology and Medicine”, the Helmholtz-Validierungsfonds of the Impuls and Vernetzungs-Fonds der Helmholtzgemeinschaft. D.W. and K.-J.L. were supported by the “Portfolio Drug Research” of the Impuls and Vernetzungs-Fonds der Helmholtzgemeinschaft.
Authors’ disclosures available online (https://www.j-alz.com/manuscript-disclosures/17-0775r3).
REFERENCES
[1] | Bloom GS ((2014) ) Amyloid-beta and tau: The trigger and bullet in Alzheimer disease pathogenesis. JAMA Neurol 71: , 505–508. |
[2] | Parihar MS , Hemnani T ((2004) ) Alzheimer’s disease pathogenesis and therapeutic interventions. J Clin Neurosci 11: , 456–467. |
[3] | Haass C , Selkoe DJ ((2007) ) Soluble protein oligomers in neurodegeneration: Lessons from the Alzheimer’s amyloid beta-peptide. Nat Rev Mol Cell Biol 8: , 101–112. |
[4] | Zhang YW , Thompson R , Zhang H , Xu H ((2011) ) APP processing in Alzheimer’s disease. Mol Brain 4: , 3. |
[5] | Klyubin I , Cullen WK , Hu NW , Rowan MJ ((2012) ) Alzheimer’s disease Abeta assemblies mediating rapid disruption of synaptic plasticity and memory. Mol Brain 5: , 25. |
[6] | Kuo YM , Emmerling MR , Woods AS , Cotter RJ , Roher AE ((1997) ) Isolation, chemical characterization, and quantitation of A beta 3-pyroglutamyl peptide from neuritic plaques and vascular amyloid deposits. Biochem Biophys Res Commun 237: , 188–191. |
[7] | Perez-Garmendia R , Gevorkian G ((2013) ) Pyroglutamate-modified amyloid beta peptides: Emerging targets for Alzheimer’s disease immunotherapy. Curr Neuropharmacol 11: , 491–498. |
[8] | Gunn AP , Masters CL , Cherny RA ((2010) ) Pyroglutamate-Abeta: Role in the natural history of Alzheimer’s disease. Int J Biochem Cell Biol 42: , 1915–1918. |
[9] | Jawhar S , Wirths O , Bayer TA ((2011) ) Pyroglutamate amyloid-beta (Abeta): A hatchet man in Alzheimer disease. J Biol Chem 286: , 38825–38832. |
[10] | AlzheimerResearchForum ((2017) ) Therapeutics, Immunotherapy (passive), N3pG-Aβ Monoclonal Antibody, LY3002813. http://www.alzforum.org/therapeutics/ly3002813, Accessed on Octobe 18, 2017. |
[11] | Alexandru A , Jagla W , Graubner S , Becker A , Bauscher C , Kohlmann S , Sedlmeier R , Raber KA , Cynis H , Ronicke R , Reymann KG , Petrasch-Parwez E , Hartlage-Rubsamen M , Waniek A , Rossner S , Schilling S , Osmand AP , Demuth HU , von Horsten S ((2011) ) Selective hippocampal neurodegeneration in transgenic mice expressing small amounts of truncated Abeta is induced by pyroglutamate-Abeta formation. J Neurosci 31: , 12790–12801. |
[12] | Wirths O , Bayer TA ((2008) ) Motor impairment in Alzheimer’s disease and transgenic Alzheimer’s disease mouse models. Genes Brain Behav 7: (Suppl 1), 1–5. |
[13] | van Halteren-van Tilborg IA , Scherder EJ , Hulstijn W ((2007) ) Motor-skill learning in Alzheimer’s disease: A review with an eye to the clinical practice. Neuropsychol Rev 17: , 203–212. |
[14] | Buchman AS , Bennett DA ((2011) ) Loss of motor function in preclinical Alzheimer’s disease. Expert Rev Neurother 11: , 665–676. |
[15] | Rogers DC , Fisher EMC , Brown SDM , Peters J , Hunter AJ , Martin JE ((1997) ) Behavioral and functional analysis of mouse phenotype: SHIRPA, a proposed protocol for comprehensive phenotype assessment. Mamm Genome 8: , 711–713. |
[16] | Ogawa N , Hirose Y , Ohara S , Ono T , Watanabe Y ((1985) ) A simple quantitative bradykinesia test in MPTP-treated mice. Res Commun Chem Pathol Pharmacol 50: , 435–441. |
[17] | Meredith GE , Kang UJ ((2006) ) Behavioral models of Parkinson’s disease in rodents: A new look at an old problem. Mov Disord 21: , 1595–1606. |
[18] | Deacon RM ((2006) ) Digging and marble burying in mice: Simple methods for in vivo identification of biological impacts. Nat Protoc 1: , 122–124. |
[19] | Brener O , Dunkelmann T , Gremer L , van Groen T , Mirecka EA , Kadish I , Willuweit A , Kutzsche J , Jurgens D , Rudolph S , Tusche M , Bongen P , Pietruszka J , Oesterhelt F , Langen KJ , Demuth HU , Janssen A , Hoyer W , Funke SA , Nagel-Steger L , Willbold D ((2015) ) QIAD assay for quantitating a compound’s efficacy in elimination of toxic Abeta oligomers. Sci Rep 5: , 13222. |
[20] | Dunkelmann T , Teichmann K , Ziehm T , Schemmert S , Frenzel D , Tusche M , Dammers C , Jurgens D , Langen KJ , Demuth HU , Shah NJ , Kutzsche J , Willuweit A , Willbold D ((2018) ) Abeta oligomer eliminating compounds interfere successfully with pEAbeta(3-42) induced motor neurodegenerative phenotype in transgenic mice. Neuropeptides 67: , 27–35. |
[21] | Clark RA , Shoaib M , Hewitt KN , Stanford SC , Bate ST ((2012) ) A comparison of InVivoStat with other statistical software packages for analysis of data generated from animal experiments. J Psychopharmacol 26: , 1136–1142. |
[22] | Grathwohl SA , Kalin RE , Bolmont T , Prokop S , Winkelmann G , Kaeser SA , Odenthal J , Radde R , Eldh T , Gandy S , Aguzzi A , Staufenbiel M , Mathews PM , Wolburg H , Heppner FL , Jucker M ((2009) ) Formation and maintenance of Alzheimer’s disease beta-amyloid plaques in the absence of microglia. Nat Neurosci 12: , 1361–1363. |
[23] | Hall AM , Roberson ED ((2012) ) Mouse models of Alzheimer’s disease. Brain Res Bull 88: , 3–12. |
[24] | LaFerla FM , Green KN ((2012) ) Animal models of Alzheimer disease. Cold Spring Harb Perspect Med 2: , a006320. |
[25] | Bayer TA , Wirths O ((2014) ) Focusing the amyloid cascade hypothesis on N-truncated Abeta peptides as drug targets against Alzheimer’s disease. Acta Neuropathol 127: , 787–801. |
[26] | Glajch KE , Fleming SM , Surmeier DJ , Osten P ((2012) ) Sensorimotor assessment of the unilateral 6-hydroxydopamine mouse model of Parkinson’s disease. Behav Brain Res 230: , 309–316. |
[27] | Rodriguez JJ , Olabarria M , Chvatal A , Verkhratsky A ((2009) ) Astroglia in dementia and Alzheimer’s disease. Cell Death Differ 16: , 378–385. |
[28] | Grillner S , Robertson B , Stephenson-Jones M ((2013) ) The evolutionary origin of the vertebrate basal ganglia and its role in action selection. J Physiol 591: , 5425–5431. |
[29] | Pappas SS , Leventhal DK , Albin RL , Dauer WT ((2014) ) Mouse models of neurodevelopmental disease of the basal ganglia and associated circuits. Curr Top Dev Biol 109: , 97–169. |
[30] | Meissner JN , Bouter Y , Bayer TA ((2015) ) Neuron loss and behavioral deficits in the TBA42 mouse model expressing n-truncated pyroglutamate amyloid-beta3-42. J Alzheimers Dis 45: , 471–482. |
[31] | Bouter Y , Dietrich K , Wittnam JL , Rezaei-Ghaleh N , Pillot T , Papot-Couturier S , Lefebvre T , Sprenger F , Wirths O , Zweckstetter M , Bayer TA ((2013) ) N-truncated amyloid beta (Abeta) 4-42 forms stable aggregates and induces acute and long-lasting behavioral deficits. Acta Neuropathol 126: , 189–205. |
[32] | Wirths O , Breyhan H , Cynis H , Schilling S , Demuth HU , Bayer TA ((2009) ) Intraneuronal pyroglutamate-Abeta 3-42 triggers neurodegeneration and lethal neurological deficits in a transgenic mouse model. Acta Neuropathol 118: , 487–496. |
[33] | Casas C , Sergeant N , Itier JM , Blanchard V , Wirths O , van der Kolk N , Vingtdeux V , van de Steeg E , Ret G , Canton T , Drobecq H , Clark A , Bonici B , Delacourte A , Benavides J , Schmitz C , Tremp G , Bayer TA , Benoit P , Pradier L ((2004) ) Massive CA1/2 neuronal loss with intraneuronal and N-terminal truncated Abeta42 accumulation in a novel Alzheimer transgenic model. Am J Pathol 165: , 1289–1300. |
[34] | Wirths O , Bayer TA ((2010) ) Neuron loss in transgenic mouse models of Alzheimer’s disease. Int J Alzheimers Dis 2010: , 723782. |
[35] | Deacon RM ((2013) ) Measuring motor coordination in mice. J Vis Exp e2609. |
[36] | Ameen-Ali KE , Wharton SB , Simpson JE , Heath PR , Sharp P , Berwick J ((2017) ) Review: Neuropathology and behavioural features of transgenic murine models of Alzheimer’s disease. Neuropathol Appl Neurobiol 43: , 553–570. |

