
Decreased N-Acetyl Aspartate/Myo-Inositol Ratio in the Posterior Cingulate Cortex Shown by Magnetic Resonance Spectroscopy May Be One of the Risk Markers of Preclinical Alzheimer’s Disease: A 7-Year Follow-Up Study
Abstract
Although molecular positron emission tomography imaging of amyloid and tau proteins can facilitate the detection of preclinical Alzheimer’s disease (AD) pathology, it is not useful in clinical practice. More practical surrogate markers for preclinical AD would provide valuable tools. Thus, we sought to validate the utility of conventional magnetic resonance spectroscopy (MRS) as a screening method for preclinical AD. A total of 289 older participants who were cognitively normal at baseline were clinically followed up for analysis of MRS metabolites, including N-acetyl aspartate (NAA) and myo-inositol (MI) in the posterior cingulate cortex (PCC) for 7 years. The 289 participants were retrospectively divided into five groups 7 years after baseline: 200 (69%) remained cognitively normal; 53 (18%) developed mild cognitive impairment (MCI); 21 (7%) developed AD; eight (2%) developed Parkinson’s disease with normal cognition, and seven (2%) developed dementia with Lewy bodies (DLB). The NAA/MI ratios of the PCC in the AD, MCI, and DLB groups were significantly decreased compared with participants who maintained normal cognition from baseline to 7 years after baseline. MMSE scores 7 years after baseline were significantly correlated with MI/Cr and NAA/MI ratios in the PCC. These results suggest that cognitively normal elderly subjects with low NAA/MI ratios in the PCC might be at risk of progression to clinical AD. Thus, the NAA/MI ratio in the PCC measured with conventional 1H MRS should be reconsidered as a possible adjunctive screening marker of preclinical AD in clinical practice.
INTRODUCTION
Accumulating data from large-scale studies, such as the Alzheimer’s Disease Neuroimaging Initiative (ADNI) and the Dominantly Inherited Alzheimer Network (DIAN), and the results of clinical trials of disease modifying drugs, suggest that the pathology of Alzheimer’s disease (AD) often begins approximately 20 years before the clinical onset of mild cognitive impairment (MCI) and AD [1, 2]. Thus, treatment with disease-modifying drugs after the onset of AD/MCI may already be too late. Therefore, developing methods for screening and preventive intervention in the preclinical stages of AD is a critical issue. Specifically, establishing a system for identifying subjects at risk of prodromal AD could play a valuable role in enabling preventive therapy at the preclinical stages of AD. Cerebrospinal fluid (CSF) biomarkers, including Aβ40, Aβ42, total tau (t-tau), and phosphorylated tau (p-tau) obtained by lumbar puncture have been established as reliable biomarkers reflecting the underlying pathogenesis of AD; however, obtaining these biomarkers is invasive for patients [3–8]. Recently developed neuroimaging techniques, such as molecular positron emission tomography (PET) for visualizing abnormal amyloid and tau deposition in the brain, are powerful methods not only for detecting molecular pathology at asymptomatic stages in AD but also for differential diagnosis of other tauopathies, such as progressive supranuclear palsy, corticobasal syndrome, and frontotemporal dementia [9–15].
However, although amyloid and tau imaging techniques enable direct observation of AD pathogenesis, they are not appropriate methods for easily screening dementia in most hospitals, and have not been widely applied in clinical practice. Ideal screening methods for capturing subjects at risk of early MCI/AD or preclinical AD must be accessible, easy to perform, non-invasive and low-cost. Novel blood-based biomarkers for AD/MCI have been proposed as an alternative method; however, there are currently no verified blood-based biomarkers that are specific to AD/MCI [16–19].
However, standard 1.5-Tesla (T) MRI is popular in clinical settings in Japan, and could be applied for voxel-based morphometry (VBM)-MRI for detection of AD-specific structural brain changes, especially medial temporal atrophy. The utility of VBM-MRI has been confirmed for a range of applications, such as voxel-based specific regional analysis systems for Alzheimer’s disease (VSRAD), which enables the detection of hippocampal atrophy [20–25], and proton magnetic resonance spectroscopy (1H MRS) for capturing early brain biochemical abnormalities useful for early diagnosis and tracking subjects with dementia caused by AD [25]. Furthermore, a number of previous studies have demonstrated that detecting metabolite abnormalities with brain 1H MRS brain is useful not only for the early differential diagnosis of dementia-related diseases, including MCI and AD, but also for predicting conversion from MCI into AD [25–47].
A previous cross-sectional study in our laboratory demonstrated the utility of VSRAD, combined with 1H MRS of posterior cingulate cortex (PCC) relevant CSF biomarkers (Aβ42, p-tau, and Aβ42/p-tau) as adjunct early screening methods for dementia caused by AD in clinical practice [25]. The results revealed that the peak values of each metabolite of 1H MRS, particularly N-acetylaspartate (NAA) and myo-inositol (MI) of the PCC, were altered in MCI/AD subjects compared with normal controls before cognitive decline, and hippocampal atrophy was revealed with VSRAD from the very early stages [25]. In that study, VSRAD incidentally revealed that 118 elderly subjects showed very mild cognitive decline without brain atrophy. Of 118 subjects, 79 (67%) were cognitively normal, 18 (15%) had MCI, and six (5%) had early AD. The NAA/Cr ratio and NAA/MI ratio in the PCC on 1H MRS in the 18 MCI and six AD patients was significantly decreased, compared with 79 normal age-matched controls. Thus, we proposed that not only VSRAD but also analysis of 1H MRS metabolites in the PCC might be useful for the diagnosis of AD/MCI in clinical practice. Moreover, we speculated that alterations of metabolites of 1H MRS in the PCC, which may reflect biochemical alterations caused by AD, could precede the clinical onset and structural alterations in AD/MCI and may be helpful for prediction of preclinical AD. The aim of this 7-year follow-up study was to validate whether 1H MRS analysis in the PCC is useful for the prediction of AD progression in cognitively normal, elderly individuals.
MATERIALS AND METHODS
A sample of 320 healthy and cognitively normal individuals with no organic brain disorders (aged 69–89 years) who voluntarily attended a medical checkup including a brain examination at our hospital was recruited for this study. All study subjects provided informed consent. Individuals with a history of stroke, white matter lesions including periventricular hyperintensity on T2 weighted MRI, cardiac dysfunction, and other systemic diseases including diabetes mellitus and psychiatric diseases were excluded from the study. Thirty-one of the 320 participants withdrew from the study within 5 years from baseline because of complications due to other significant sicknesses or personal circumstances. As a result, 289 subjects were consistently followed up for 7 years, from April 2010 to April 2017. All 289 subjects fulfilled the following inclusion criteria: 1) Absence of memory-related complaints, as verified by a study partner; 2) Mini-Mental State Examination (MMSE) scores between 24 and 30; 3) Clinical Dementia Rating (CDR) = 0; 4) Normal cognitive function, based on an absence of significant impairment in cognitive functions or activities of daily living. The exclusion criteria were as follows: any significant neurological disease, such as Parkinson’s disease (PD), multi-infarct dementia, Huntington’s disease, normal pressure hydrocephalus, brain tumor, progressive supranuclear palsy, seizure disorder, subdural hematoma, multiple sclerosis, or history of significant head trauma followed by persistent neurological defaults or known structural brain abnormalities.
At baseline, 289 cognitively normal elderly subjects (mean age: 74.8±5.2 years, age range: 69–82 years, female: 164, male: 125, MMSE: 28.2±1.8, CDR: 0) were selected.
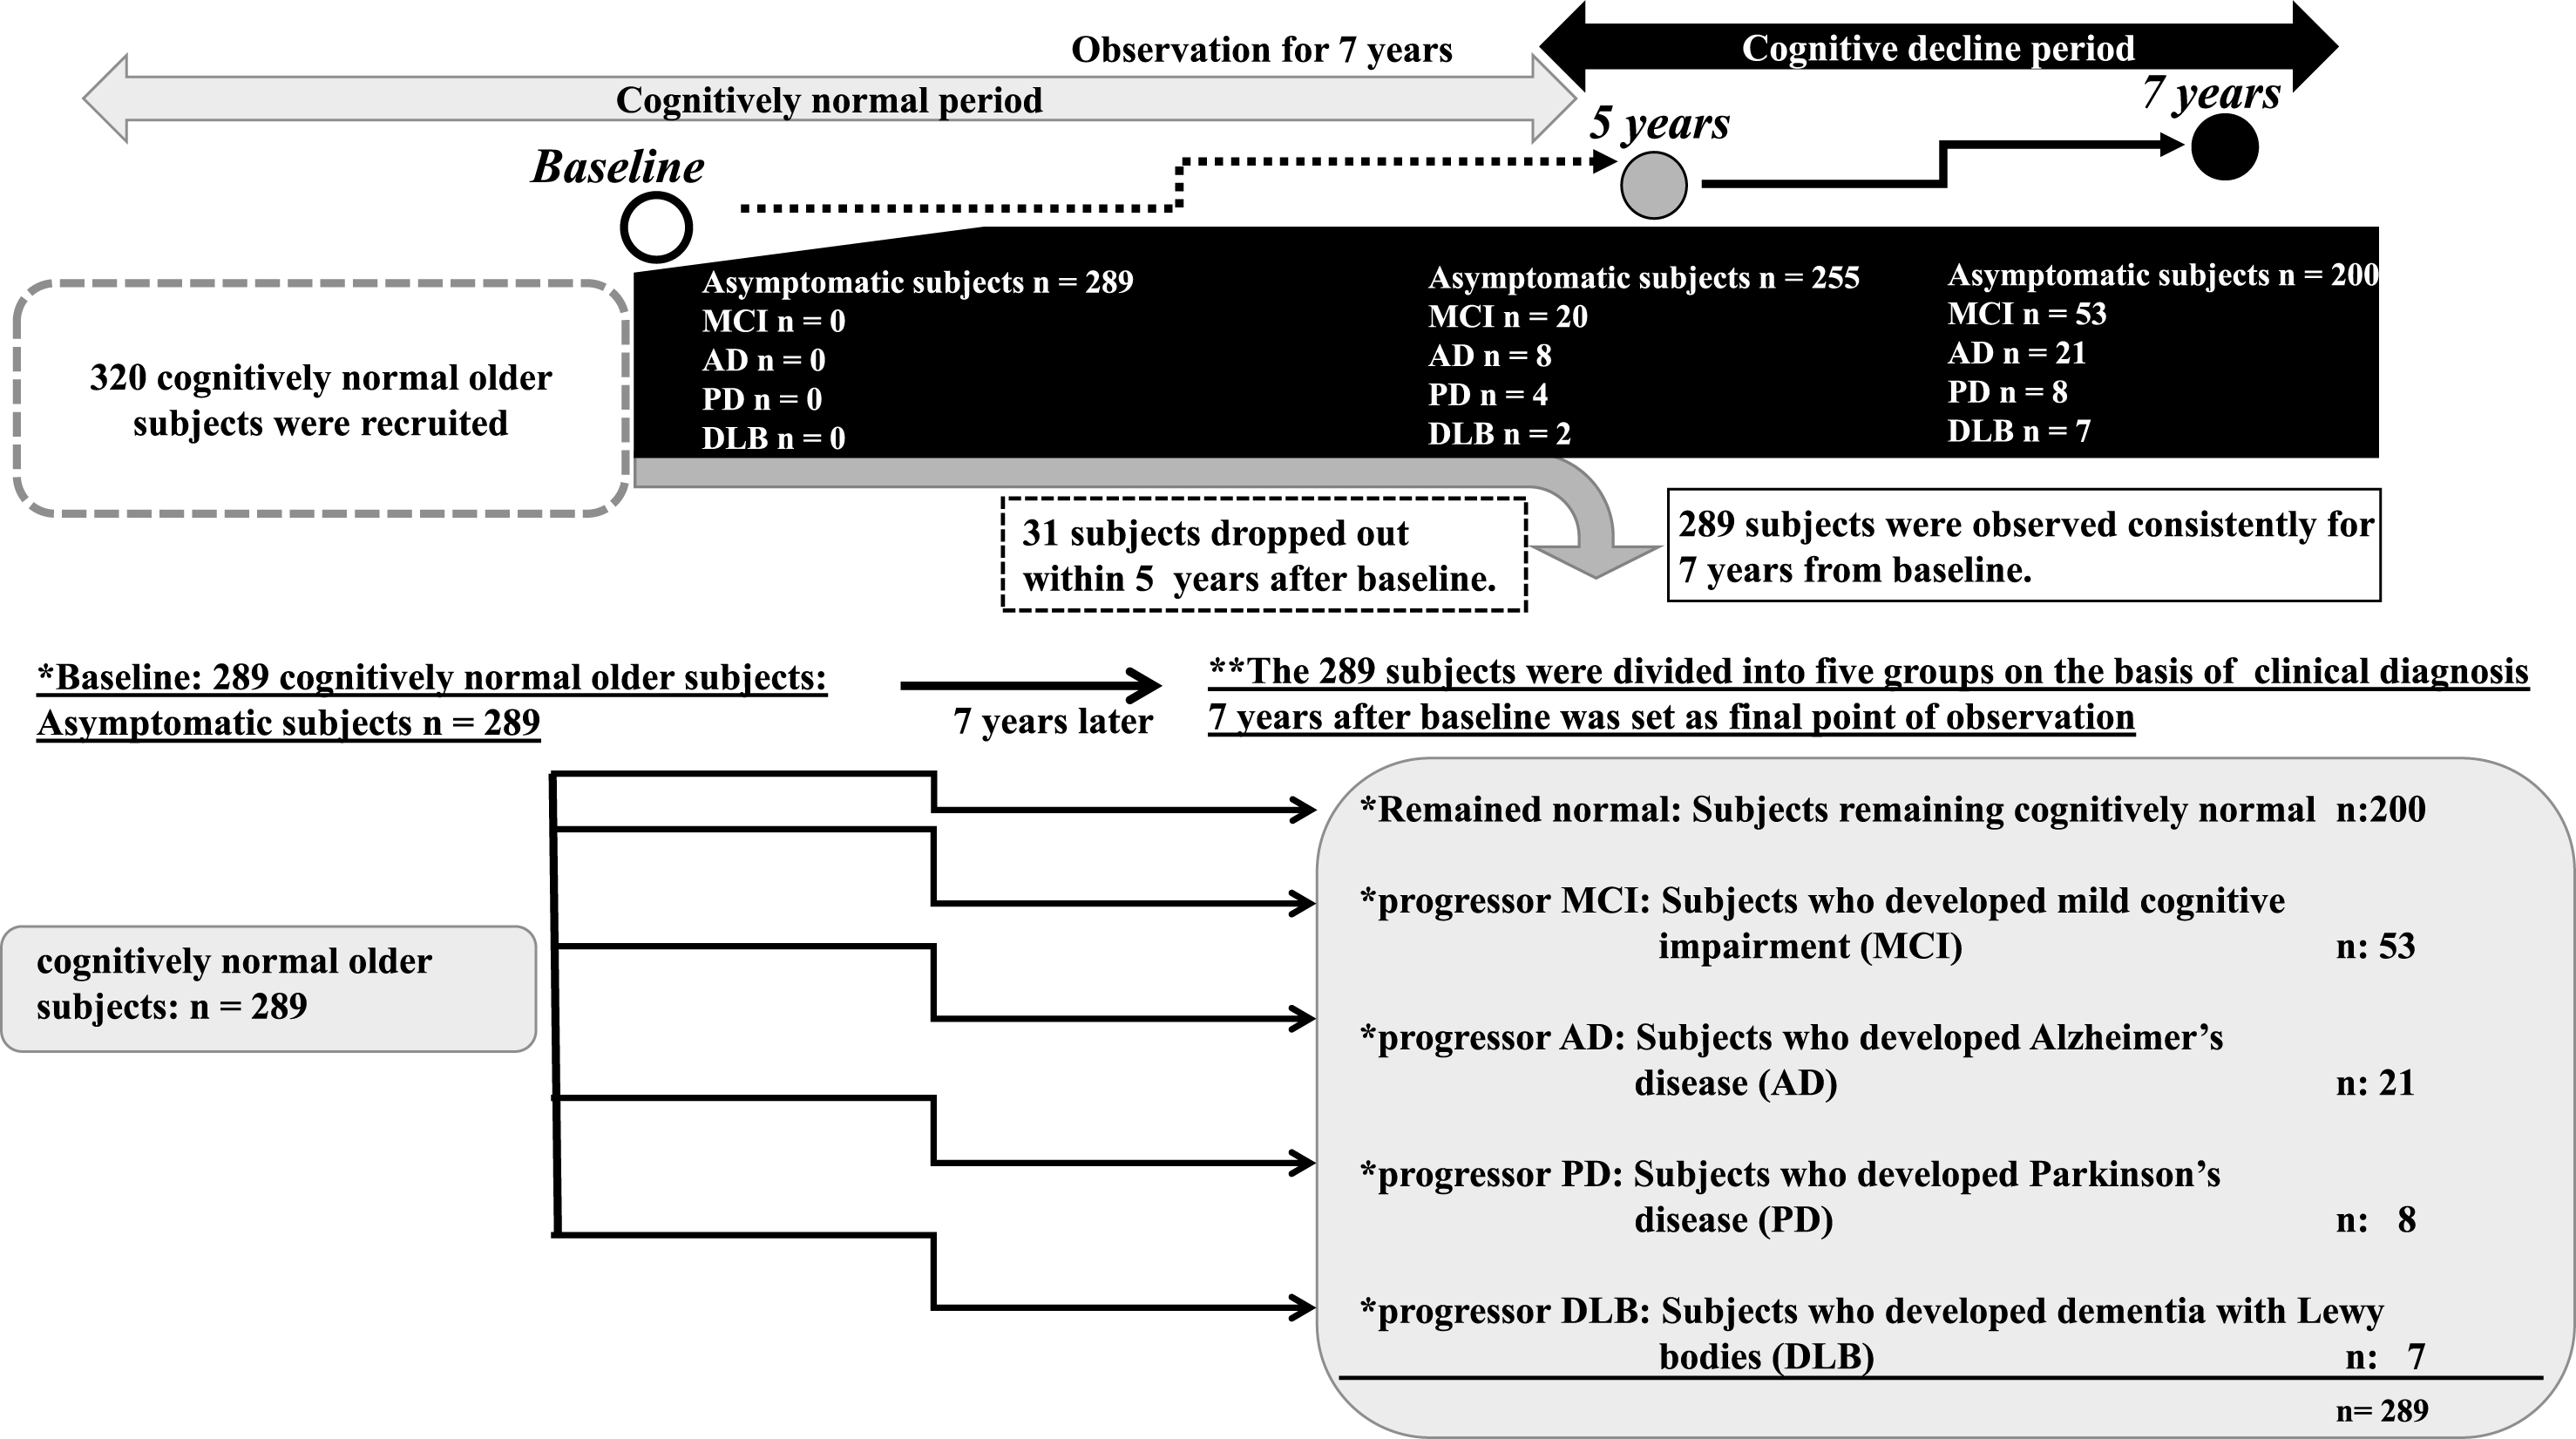
A general medical examination by interview, in addition to counseling, routine blood testing, and electrocardiography, was performed annually. MMSE, regular MRI, VSRAD, and 1H MRS of the PCC were performed at baseline, and at 5 and 7 years after baseline as the final observation points of the study. CSF was obtained by lumbar puncture at the final point, 7 years after baseline. The APOE genotype was tested in all subjects using standard procedures, which included obtaining informed consent from all research subjects and donors [48]. None of the subjects was taking acetylcholinesterase inhibitors or memantine at baseline. At 7 years after baseline, the 289 participants were divided into five groups based on neurological status (Fig. 1): Remained Normal: Subjects remaining cognitively normal (n = 200, 69.2%); Progressor MCI: Subjects who developed MCI (n = 53, 18.3%); Progressor AD: Subjects who developed AD (n = 21, 7.3%); Progressor PD: Subjects who developed PD without dementia (n = 8, 2.8%); and Progressor DLB: Subjects who developed DLB (n = 7, 2.4%). The diagnoses were based on clinical criteria [49–53]. The diagnosis of DLB was confirmed based on the results of 123I-MIBG myocardial scintigraphy showing that myocardial 123I-MIBG uptake was impaired in early-stage DLB [54]. Moreover, all subjects with AD/MCI, PD and DLB at 7 years after baseline, undertook examinations of CSF Aβ1 - 42 and CSF p-tau proteins for accurate diagnosis [3–8].
Fig.1
Outline of the follow up study. An outline of this follow up study is shown in a flowchart. We recruited 320 participants who previously voluntarily visited the memory clinic and were deemed cognitively normal without organic brain disorder, ranging from 69 to 89 years old. Informed consent was obtained from all participants. Of these participants, 31 dropped out within 5 years after baseline. Thus, a total of 289 cognitively normal older participants were consistently followed up for 7 years from April 2010 to April 2017. At 7 years after baseline, the 289 participants were divided into the following five groups on the basis of neurological status: *Remained normal: Subjects remaining cognitively normal (n = 200); *Progressor MCI: Subjects who developed MCI 7 years later (n = 53); *Progressor AD: Subjects who developed AD 7 years later (n = 21); *Progressor PD: Subjects who developed PD 7 years later (n = 8); and *Progressor DLB: Subjects who developed DLB 7 years later (n = 7). At 5 years later, there were 20 MCI, eight AD, four PD, and two DLB patients.
Informed consent was provided by each participant and a relative. The protocol was approved by the Ethics Committees of the Higashi Matsudo Municipal Hospital. The study was conducted over 7 years, from April 2010 to April 2017.
MR and 1H MRS examination
MRI (T1, T2, and fluid attenuated inversion recovery [FLAIR]) and 1H MRS were performed with a 1.5 T MR system (Vantage Titan; Toshiba Medical Systems, Tochigi, Japan) with a 14-channel phased array head coil (Toshiba Medical Systems).
1H MRS was performed at baseline and at 5 years and 7 years after baseline, using the vendor-supplied (Toshiba Medical Systems) automated MRS package single-voxel method with a spin echo sequence. A point resolved spectroscopy sequence with TR = 2,000 ms, TE = 25 ms, 2,048 data points, and 128 excitations was used for the examinations. An 8-cm3 (2×2×2 cm) 1H MRS voxels that mainly included the posterior cingulate and precuneus region were prescribed on a midsagittal 3D-GRE image, including the right and left PCC (Fig. 2A,B) [26]. The quality control procedure for the 1H MRS was as follows: 1) The spectra with full width at half maximum were≤0.2 ppm; 2) The flip angle of water suppression pre-pulse for minimizing the water signal in the volume of interest (VOI) was optimized, i.e., the water suppression ratio of the water signal to the residual water signal was set to approximately 80–300.
Fig.2
1H MRS examination. Sagittal and axial MRI images showing the PCC, defined as a volume of interest (VOI) in 1H MRS examination (A). Upper picture of (B) shows the analyzed peak of each metabolite. The lower table shows the measured peak height of each metabolite: myo-inositol (MI), choline (cho), creatine (Cr), and N-acetylaspartate (NAA) using 1H MRS in the posterior cingulate cortex (PCC). We calculated the NAA/Cr, Cho/Cr, MI/Cr, and NAA/MI ratios, as described in the Materials and Methods.
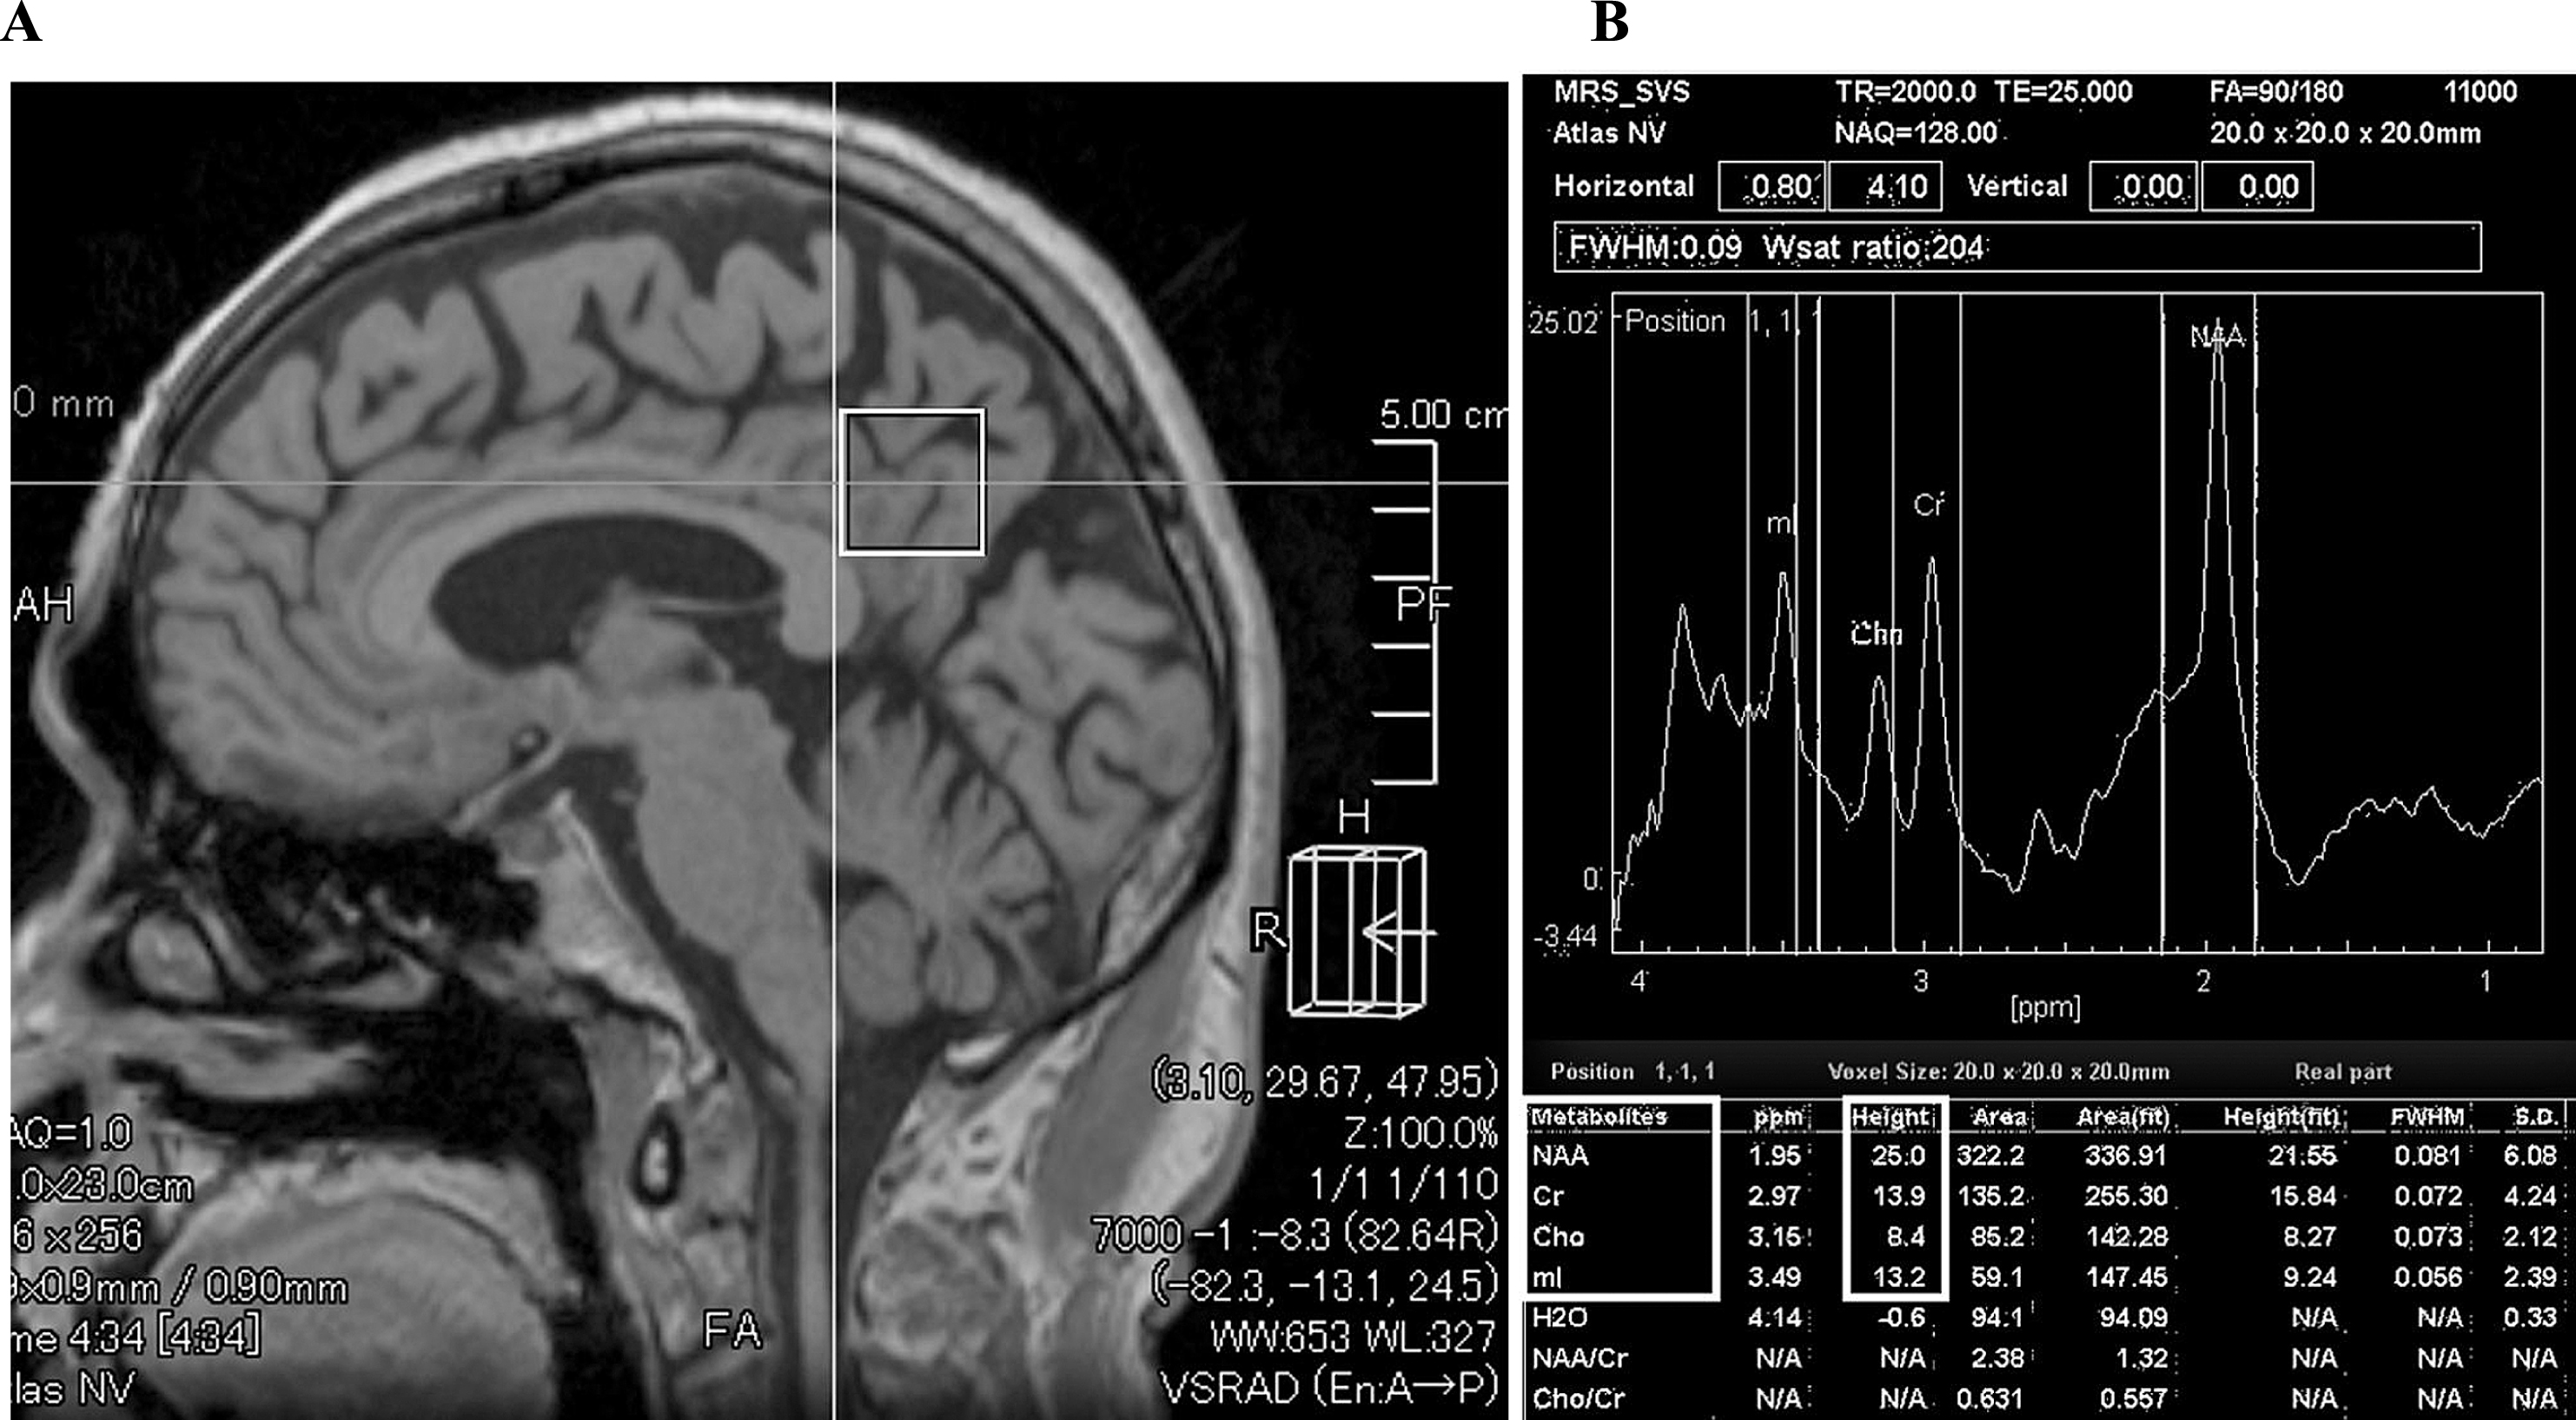
We selected the PCC as the VOI in 1H MRS in this study because previous studies have shown that the PCC is a well-defined midline structure from which reproducible, high-quality, single-voxel spectra can be acquired using regular 1.5-T MRI. In this respect, it differs from the hippocampus, which is anatomically small and sometimes difficult to analyze because of CSF contamination from the inferior horn of the lateral ventricle. The PCC also has significant metabolite measurement reliability and higher sensitivity to early AD pathology compared with other regions of the brain, including the hippocampus [26, 55–58]. The peak height ratios of NAA, choline (Cho), and MI normalized to Cr levels (described as NAA/Cr, Cho/Cr, MI/Cr, and NAA/MI) were evaluated as described previously (Fig. 2B) [26]. Voxel placement for spectroscopy and all data analysis were carried out by one neurologist and two trained radiologists who were blinded to each subject’s diagnosis.
CSF analysis
CSF analysis was performed in subjects with MCI/AD, PD, and DLB at the endpoint: 7 years from baseline. All CSF samples were obtained by lumbar puncture between 2 P.M. and 3 P.M., and were collected into polypropylene tubes. The CSF samples were centrifuged (1,000×g for 10 min at 4°C) to remove any debris, then stored in small aliquots at –80°C. CSF Aβ1 - 40 and Aβ1 - 42 were measured by enzyme-linked immunosorbent assay (ELISA) using a Human Beta Amyloid (1–40) ELISA Kit (Wako, 292-62301; Wako Chemical Co.) and a Human Beta Amyloid (1–42) ELISA Kit (Wako, 298-62401; Wako Chemical Co.), respectively. CSF p-tau protein levels were measured using INNOTEST® PHOSPHO-TAU (181P; Innogenetics, Belgium).
Statistics
Statistical calculations were performed using GraphPad Prism® software (GraphPad Software). Values are presented as the mean±standard deviation (SD) and the median±interquartile deviation. Groups were compared using χ2 tests (two groups) or Kruskal–Wallis tests (three and four groups). Correlations between each factor were examined using Spearman’s rank correlation analyses. A linear model was applied to the data to obtain the correlation coefficients (rs) and p-values.
RESULTS
NAA/Cr, MI/Cr, and NAA/MI in the PCC at baseline, and 5 and 7 years from baseline (i.e., the end of follow-up)
The NAA/Cr ratio at baseline was already lower in subjects with progressor MCI who developed MCI 7 years later (p = 0.01) and in subjects with progressor AD (p < 0.0001) who developed AD 7 years later compared with subjects who remained cognitively normal (Fig. 3A). The NAA/Cr ratio was lower in subjects with MCI and AD compared with subjects who remained cognitively normal throughout the observation period. Seven years after baseline, the NAA/Cr ratio was significantly lower in AD and DLB subjects compared with subjects who remained cognitively normal, MCI subjects, and PD subjects (Table 1A and Fig. 3A). The MI/Cr ratio in subjects with progressor AD and DLB was already significantly higher compared with subjects who remained cognitively normal (p = 0.046) at baseline. In subjects with progressor AD and DLB, the MI/Cr ratios at5- and 7-year follow-up were higher than at baseline (Table 1B and Fig. 3B). The NAA/MI ratio was significantly lower in subjects with MCI (p < 0.0001), AD (p < 0.0001), and DLB (p < 0.0001) compared with subjects who remained cognitively normal (Table 1C and Fig. 3C). Importantly, the NAA/MI ratio of progressor AD and DLB patients was already significantly decreased at baseline compared with the progressor MCI (p = 0.022) and progressor PD (p = 0.012) groups, and subjects who remained cognitively normal (p < 0.0001) (Fig. 3C).
Fig.3
Metabolites of 1H MRS at baseline, and 5 and 7 years later in each group. The NAA/Cr ratio was significantly decreased in the progressor MCI and the progressor AD groups compared with subjects who remained normal and those who exhibited progression of PD from baseline. The NAA/Cr ratio became significantly decreased in the DLB group compared with subjects who remained normal and in the progressor PD group 7 years later. The MI/Cr ratio at baseline was significantly increased in the progressor AD group compared with subjects who remained normal (*p = 0.046) (A). The MI/Cr ratio increased in the progressor MCI, AD, and DLB groups compared with subjects who remained normal after 5 years. Moreover, the MI/Cr ratio in the progressor AD group was significantly elevated compared with the progressor MCI group 5 years after baseline (B). The NAA/MI ratio showed a significant decline in the progressor MCI, AD, and DLB groups compared with subjects who remained normal and those in the progressor PD group from baseline before the onset of each disease. Thus, the NAA/MI ratio could differentiate the progressor AD group from the progressor MCI group at baseline. A decreased NAA/MI ratio in the progressor MCI, AD, and DLB groups was found at all three data collection points: baseline, 5, and 7 years after baseline (C).
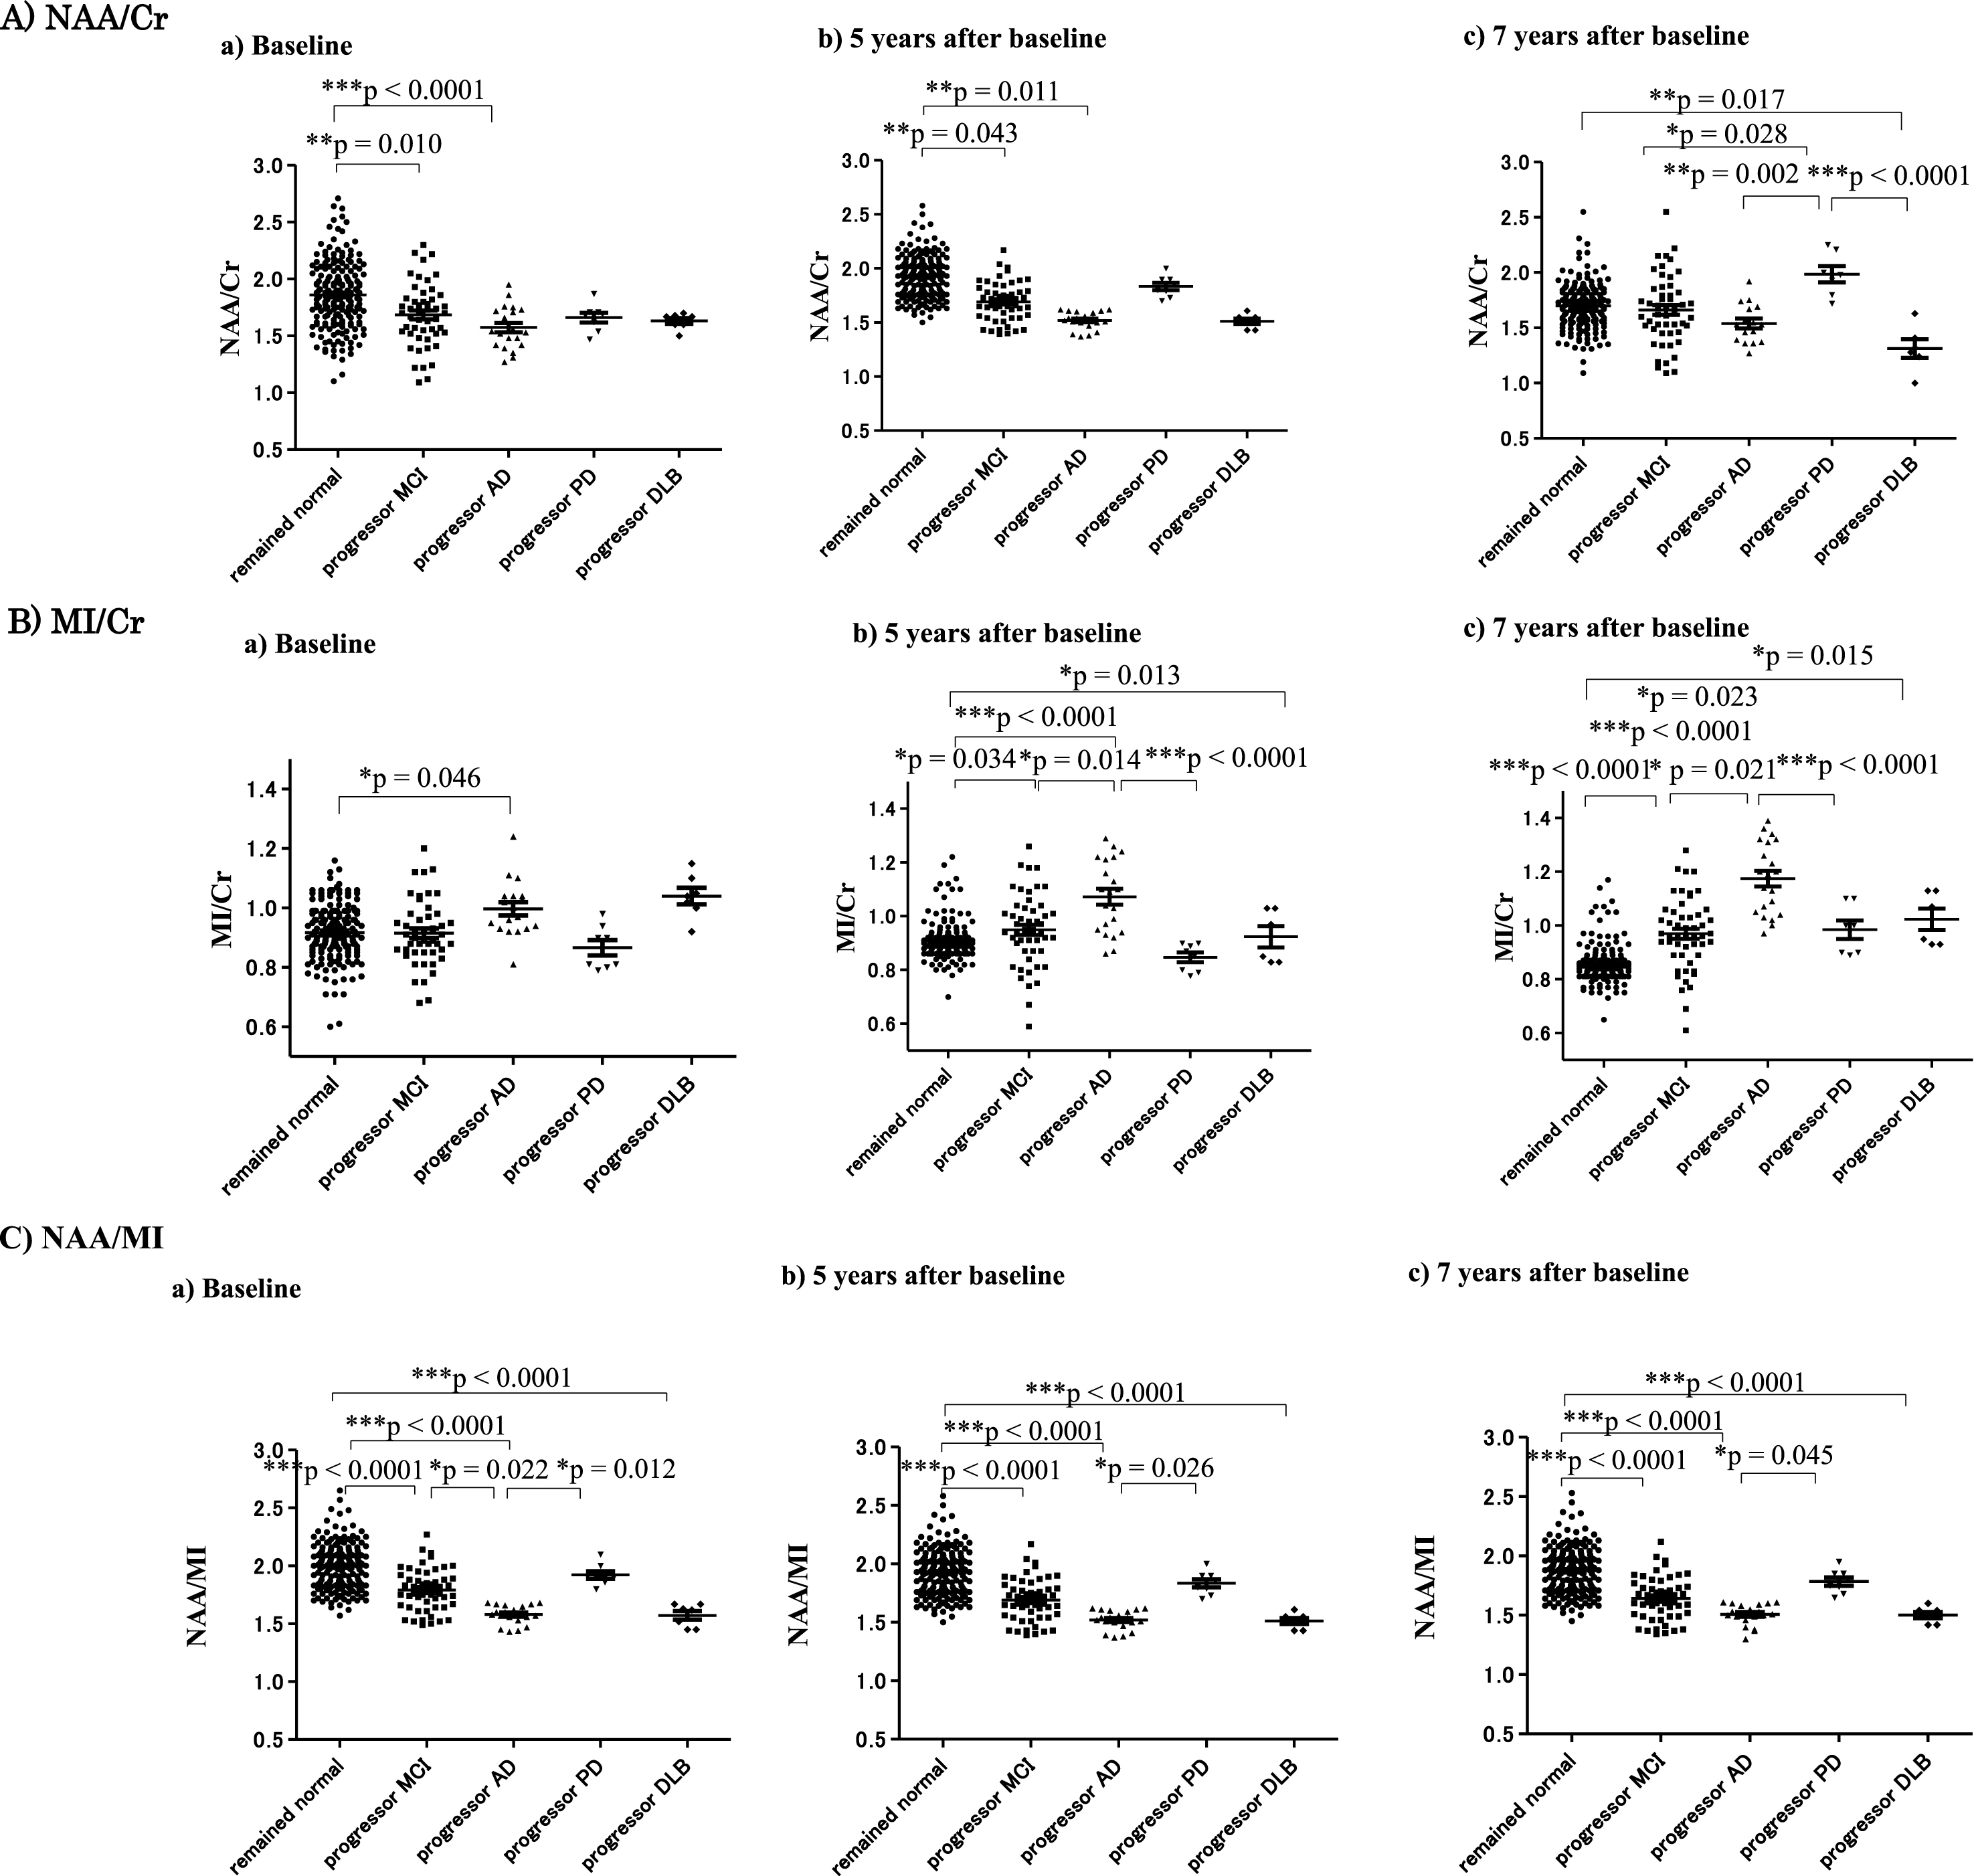
Table 1a
NAA/Cr at baseline, and 5 and 7 years after baseline
| MRS | Baseline | 5 years later | 7 years later |
| NAA/Cr | (final point) | ||
| Remained cognitively | 1.86 (average) ± 0.29 (SD) | 1.75±0.22 | 1.70±0.20 |
| normal | (median: 1.86) | (1.76) | (1.71) |
| Progressor MCI | 1.68±0.28 | 1.60±0.31 | 1.66±0.31 |
| (1.70) | (1.60) | (1.66) | |
| Progressor AD | 1.57±0.18 | 1.51±0.12 | 1.54±0.18 |
| (1.54) | (1.55) | (1.53) | |
| Progressor PD | 1.66±0.12 | 1.69±0.12 | 1.69±0.20 |
| (1.69) | (1.70) | (1.68) | |
| Progressor DLB | 1.63±0.07 | 1.41±0.58 | 1.31±0.21 |
| (1.67) | (1.62) | (1.30) |
Table 1b
MI/Cr at baseline, and 5 and 7 years after baseline
| MRS | Baseline | 5 years later | 7 years later |
| MI/Cr | (final point) | ||
| Remained cognitively | 0.92 (average) ± 0.09 (SD) | 0.91±0.07 | 0.86±0.07 |
| normal | (median: 0.91) | (0.90) | (0.85) |
| Progressor MCI | 0.92±0.11 | 0.95±0.13 | 0.97±0.13 |
| (0.90) | (0.94) | (0.97) | |
| Progressor AD | 1.00±0.09 | 1.07±0.14 | 1.17±0.13 |
| (1.00) | (1.09) | (1.09) | |
| Progressor PD | 0.87±0.07 | 0.85±0.05 | 0.98±0.09 |
| (0.86) | (0.86) | (1.00) | |
| Progressor DLB | 1.04±0.07 | 0.92±0.10 | 1.02±0.10 |
| (1.04) | (0.91) | (1.01) |
Table 1c
NAA/MI at baseline, and 5 and 7 years after baseline
| MRS | Baseline | 5 years later | 7 years later |
| NAA/MI | (final point) | ||
| Remained cognitively | 2.00±0.19 (mean±SD) | 1.93±0.19 | 1.88±0.19 |
| normal | (median: 2.00) | (1.93) | (1.88) |
| Progressor MCI | 1.79±0.18 | 1.69±0.18 | 1.64±0.18 |
| (1.77) | (1.67) | (1.62) | |
| Progressor AD | 1.58±0.08 | 1.52±0.08 | 1.51±0.09 |
| (1.58) | (1.52) | (1.51) | |
| Progressor PD | 1.92±0.09 | 1.83±0.10 | 1.78±0.10 |
| (1.90) | (1.83) | (1.78) | |
| Progressor DLB | 1.57±0.10 | 1.51±0.07 | 1.50±0.07 |
| (1.62) | (1.51) | (1.50) |
Mean values±SD for each parameter are presented in Table 1.
ROC analysis of the NAA/MI ratio distinguishing subjects with progressor AD from those who remained cognitively remained normal
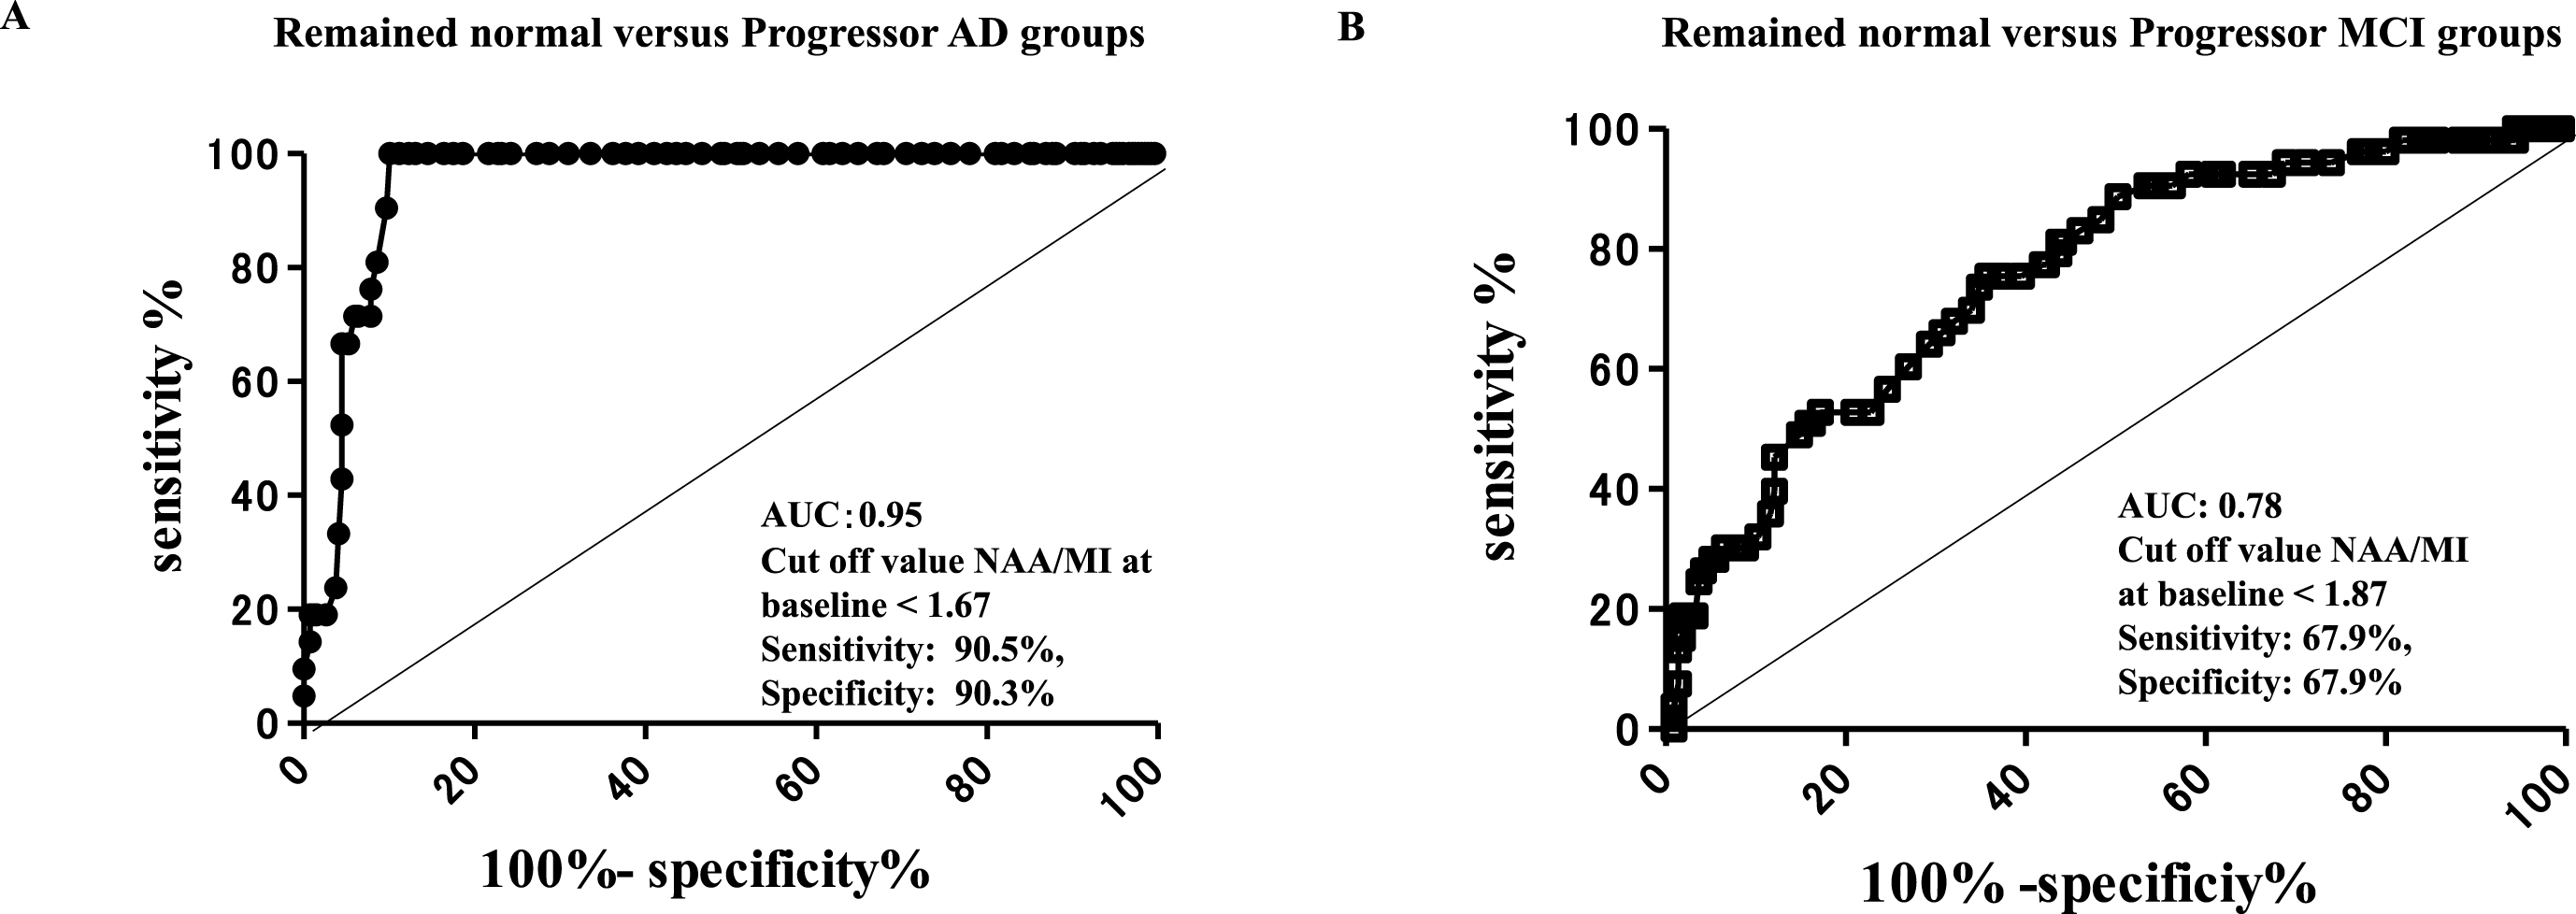
ROC analysis revealed that the NAA/MI ratio in the PCC at baseline could differentiate subjects who developed AD 7 years later from subjects who remained cognitively normal, with an area under the curve (AUC) of 0.95, sensitivity 90.5%, and specificity of 90.3% at a cut-off value of <1.67 (Fig. 4A). In contrast, the NAA/MI ratio that distinguished subjects with progressor MCI from those who remained cognitively normal had an AUC of 0.78 with a sensitivity of 67.9% and a specificity of 67.9% at a cut-off value of <1.87 (Fig. 4B). The results of the ROC analysis revealed that cognitively normal subjects whose NAA/MI ratio in the PCC was <1.67 may be likely to develop AD in the future. Importantly, our follow up results suggest that a low NAA/MI ratio (<1.67) in the PCC may be a risk factor for the future onset of AD.
Fig.4
ROC analysis of 1H MRS in the PCC at baseline. ROC analysis of the 1H MRS in the PCC at baseline, the ratio of NAA/MI showed an AUC of 0.95, sensitivity of 90.5%, and specificity of 90.3% at the cut-off value of <1.67 in the remained normal versus progressor AD groups (A), and an AUC of 0.78, sensitivity of 67.9%, and specificity of 67.9% at the cut-off value of <1.87 in the remained normal versus progressor MCI groups. The ROC analysis indicated that cognitively normal subjects with NAA/MI ratio values <1.67 in the PCC may be at risk of AD in the future.
MMSE score
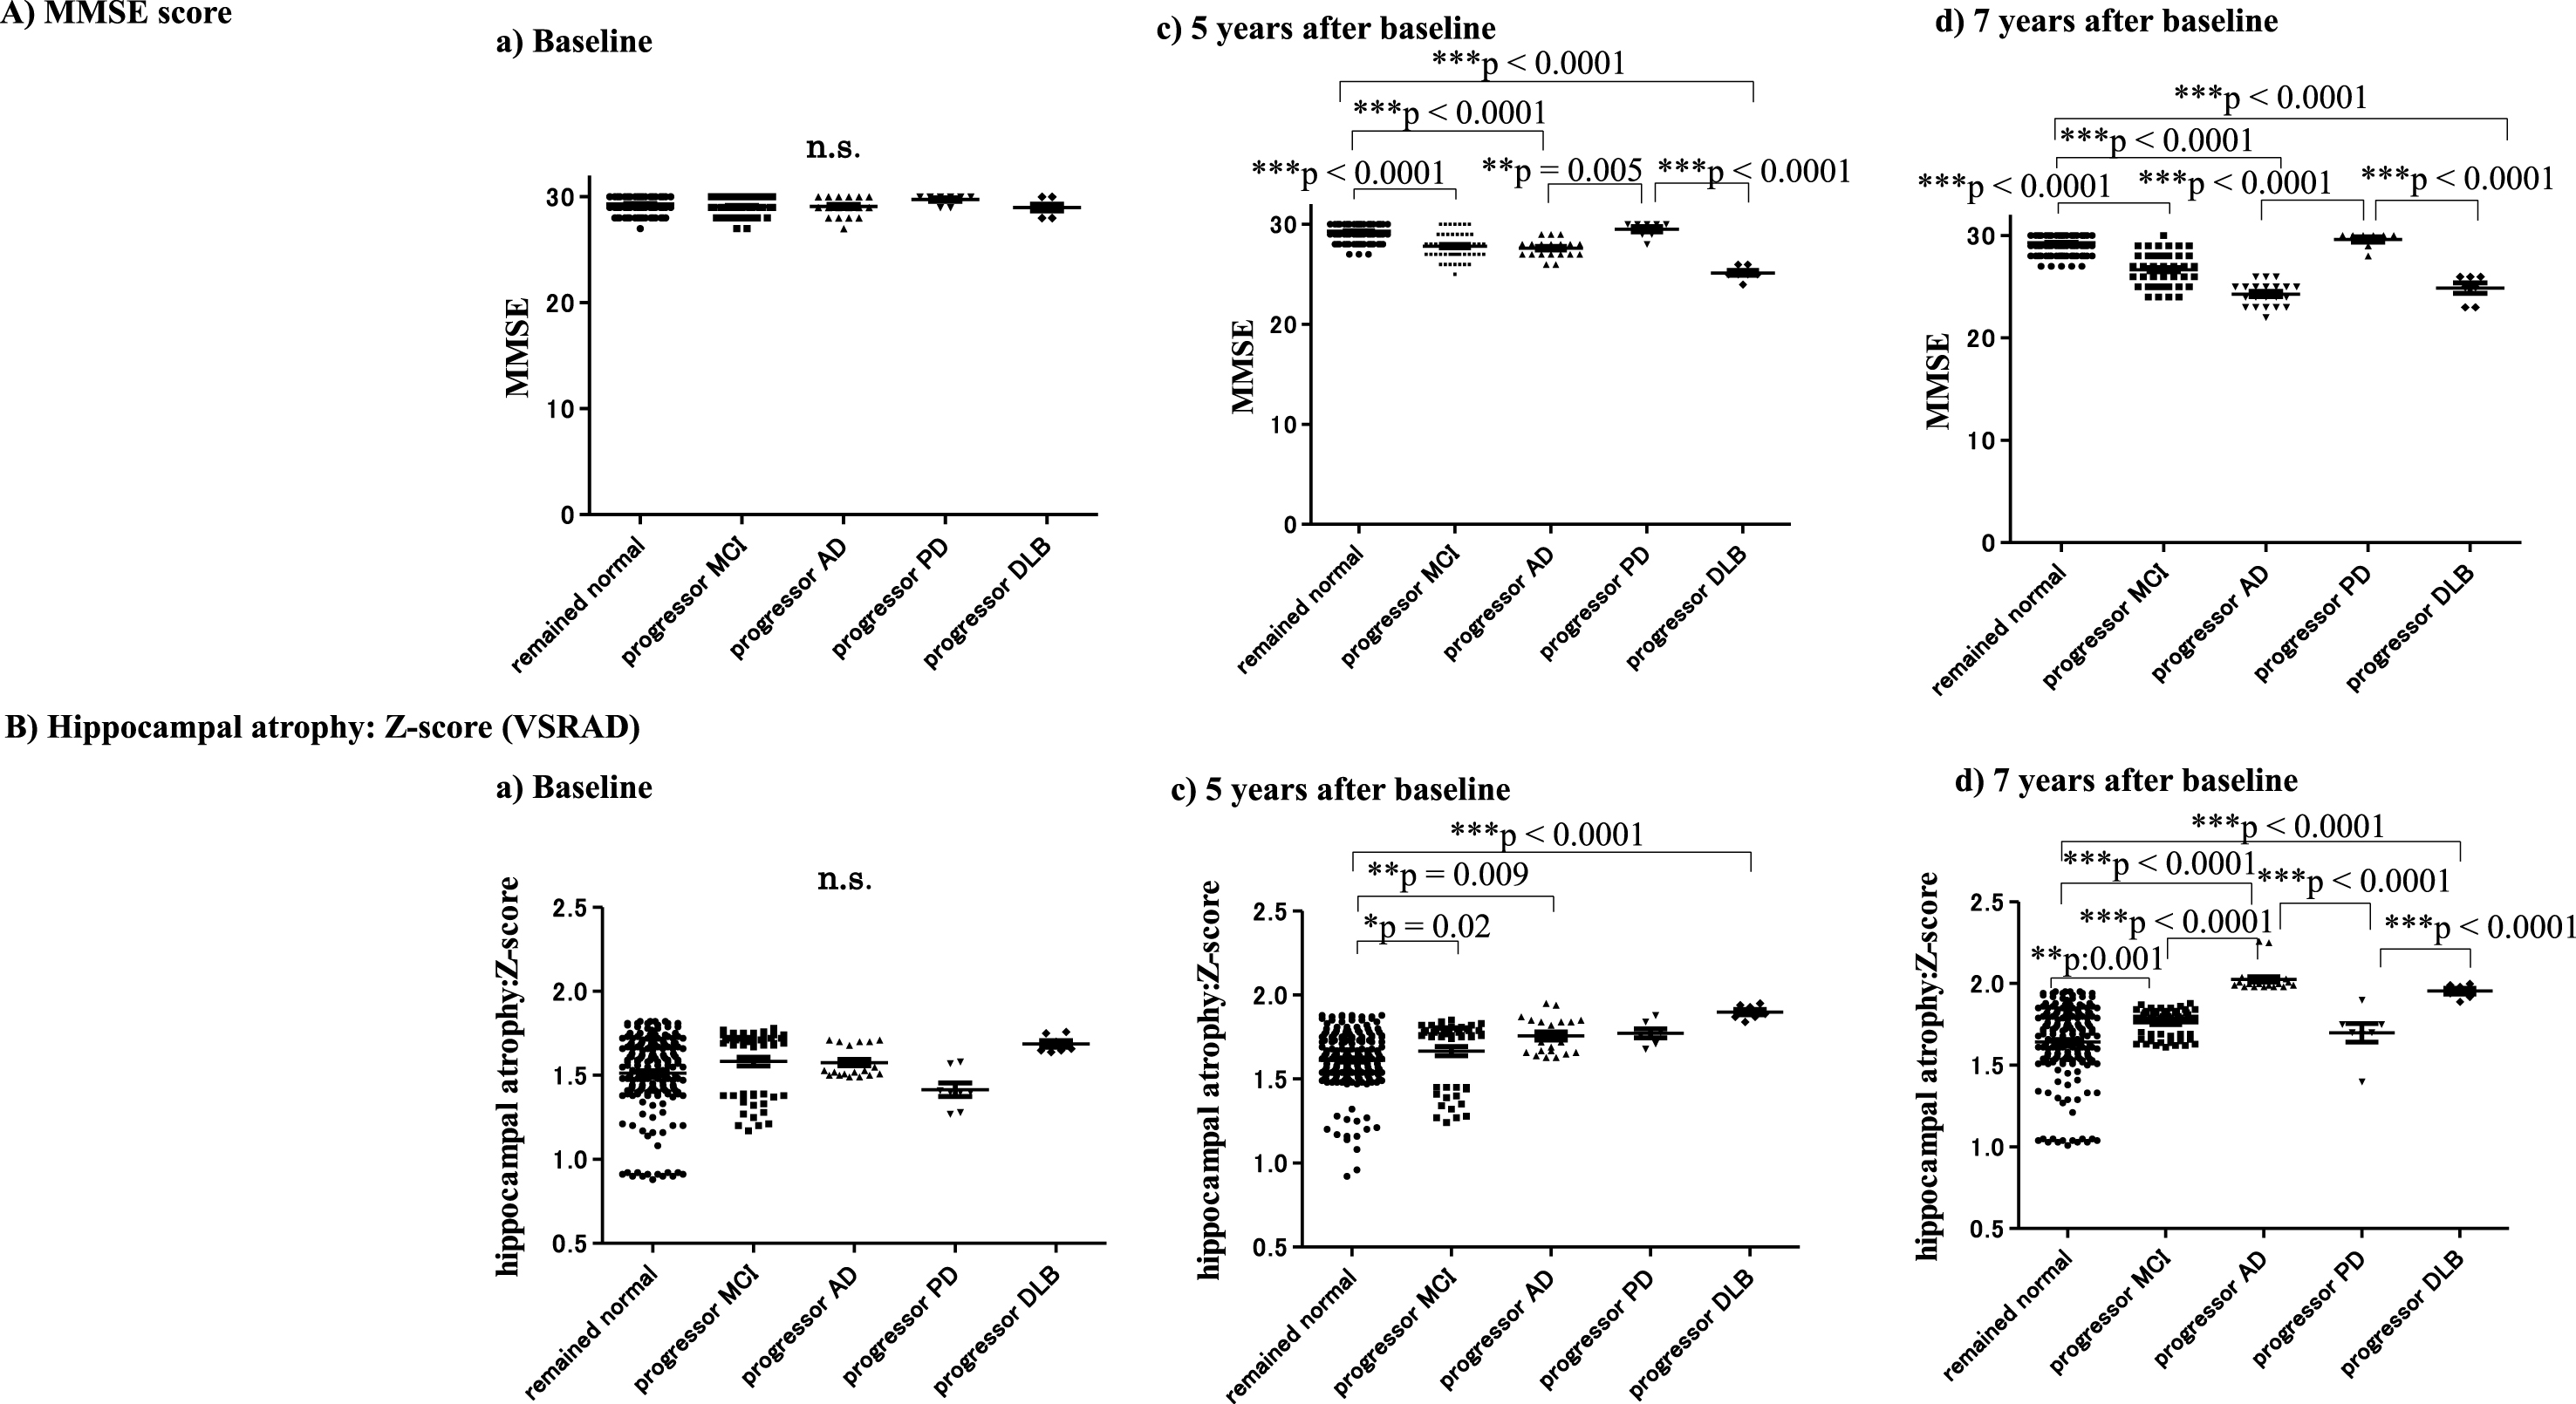
Subjects showed no apparent changes in cognition based on MMSE scores until 5 years after baseline. Declining MMSE scores were found in subjects with progressor MCI: 27.8±1.3 (28.0) (***p < 0.0001), AD: 27.6±0.9 (28.0) (***p < 0.0001), and DLB: 25.1±0.7 (25.0) (***p < 0.0001) compared with subjects who remained cognitively normal: 29.3±0.8 (29.0) at 5 years after baseline. A significant decrease in MMSE scores was found in the MCI: 26.7±1.5 (27.0) (***p < 0.0001), AD: 24.3±1.1 (24.0) (***p < 0.0001) and DLB: 24.9±1.3 (25.0) (***p < 0.0001) groups compared with subjects who remained cognitively normal: 29.3±0.8 (29.0) at the final point (7 years from baseline) (Table 2 and Fig. 5A).
Table 2
MMSE scores at baseline, and 5 and 7 years after baseline
| MMSE score | Baseline | 5 years later | 7 years later |
| (end point) | |||
| Remained cognitively | 29.3 (average) ± 0.7 (SD) | 29.3±0.8 | 29.3±0.8 |
| normal | (median: 29.0) | (29.0) | (29.0) |
| Progressor MCI | 29.1±0.8 | 27.8±1.3 | 26.7±1.5 |
| (29.0) | (28.0) | (27.0) | |
| Progressor AD | 29.1±0.9 | 27.6±0.9 | 24.3±1.1 |
| (29.0) | (28.0) | (24.0) | |
| Progressor PD | 29.8±0.5 | 29.5±0.8 | 29.6±0.7 |
| (30.0) | (30.0) | (30.0) | |
| Progressor DLB | 29.0±0.8 | 25.1±0.7 | 24.9±1.3 |
| (30.0) | (25.0) | (25.0) |
Fig.5
MMSE scores and hippocampal atrophy at baseline, 5 years and 7 years after baseline. Decline of MMSE scores was not clear until 1 year prior to the 5 years after baseline. However, the decline of the MMSE in the progressor MCI, AD, and DLB groups was apparent compared with subjects who remained cognitively normal 5 years later (A). Hippocampal atrophy shown by VSRAD Z-scores became apparent in subjects with progressor MCI, AD, and DLB 5 years after baseline. At 7 years from baseline, hippocampal atrophy on VSRAD was significant in the progressor MCI, AD and DLB groups, compared with subjects who remained cognitively normal (***p < 0.0001) (B).
Hippocampal atrophy: VSRAD: Z-score
The VSRAD results indicated no apparent hippocampal atrophy during the asymptomatic stage until 5 years after baseline (Fig. 5B). However, VSRAD indicated significant hippocampal atrophy in subjects with progressor AD: 1.76±0.11 (1.72) (**p = 0.009), MCI: 1.67±0.20 (1.76) (*p = 0.02), and DLB: 1.90±0.04 (1.89) (***p < 0.0001) compared with subjects who remained cognitively normal: 1.51±0.22 (1.56) at 5 years after baseline (Fig. 5B, C). At 7 years after baseline, VSRAD Z-scores clearly showed hippocampal atrophy in MCI: 1.76±0.08 (1.79) (**p = 0.001), AD: 2.03±0.08 (2.00) (***p < 0.0001) and DLB: 1.95±0.04 (1.96) (***p < 0.0001) compared with subjects who remained cognitively normal: 1.64±0.22 (1.69). In addition, VSRAD Z-scores showed significant differences among subjects with MCI, AD, PD: 1.70±0.15 (1.70), and DLB, as follows: AD > MCI (***p < 0.0001), AD > PD (***p < 0.0001), and DLB > PD (***p < 0.0001) (Table 3and Fig. 5B).
Table 3
Z-scores (VSRAD) at baseline, and 5 and 7 years after baseline
| Z-score | Baseline | 5 years later | 7 years later |
| (VSRAD) | (end point) | ||
| Remained cognitively normal | 1.51±0.22 (average±SD) | 1.61±0.17 | 1.64±0.22 |
| (median: 1.56) | (1.62) | (1.69) | |
| Progressor MCI | 1.58±0.20 | 1.67±0.20 | 1.76±0.08 |
| (1.69) | (1.76) | (1.79) | |
| Progressor AD | 1.58±0.09 | 1.76±0.11 | 2.03±0.08 |
| (1.53) | (1.72) | (2.00) | |
| Progressor PD | 1.41±0.11 | 1.77±0.07 | 1.70±0.15 |
| (1.40) | (1.76) | (1.70) | |
| Progressor DLB | 1.69±0.05 | 1.90±0.04 | 1.95±0.04 |
| (1.66) | (1.89) | (1.96) |
Serial changes of MMSE scores, Z-scores (VSRAD), and NAA/MI ratio on 1H MRS at baseline, 5 years, and 7 years after baseline in each group
The change in each parameter (MMSE score, hippocampal atrophy shown by the Z-score of the VSRAD, and the NAA/MI ratio in the PCC) in each group was analyzed at three points: baseline, 5 years, and 7 years (final point) after baseline.
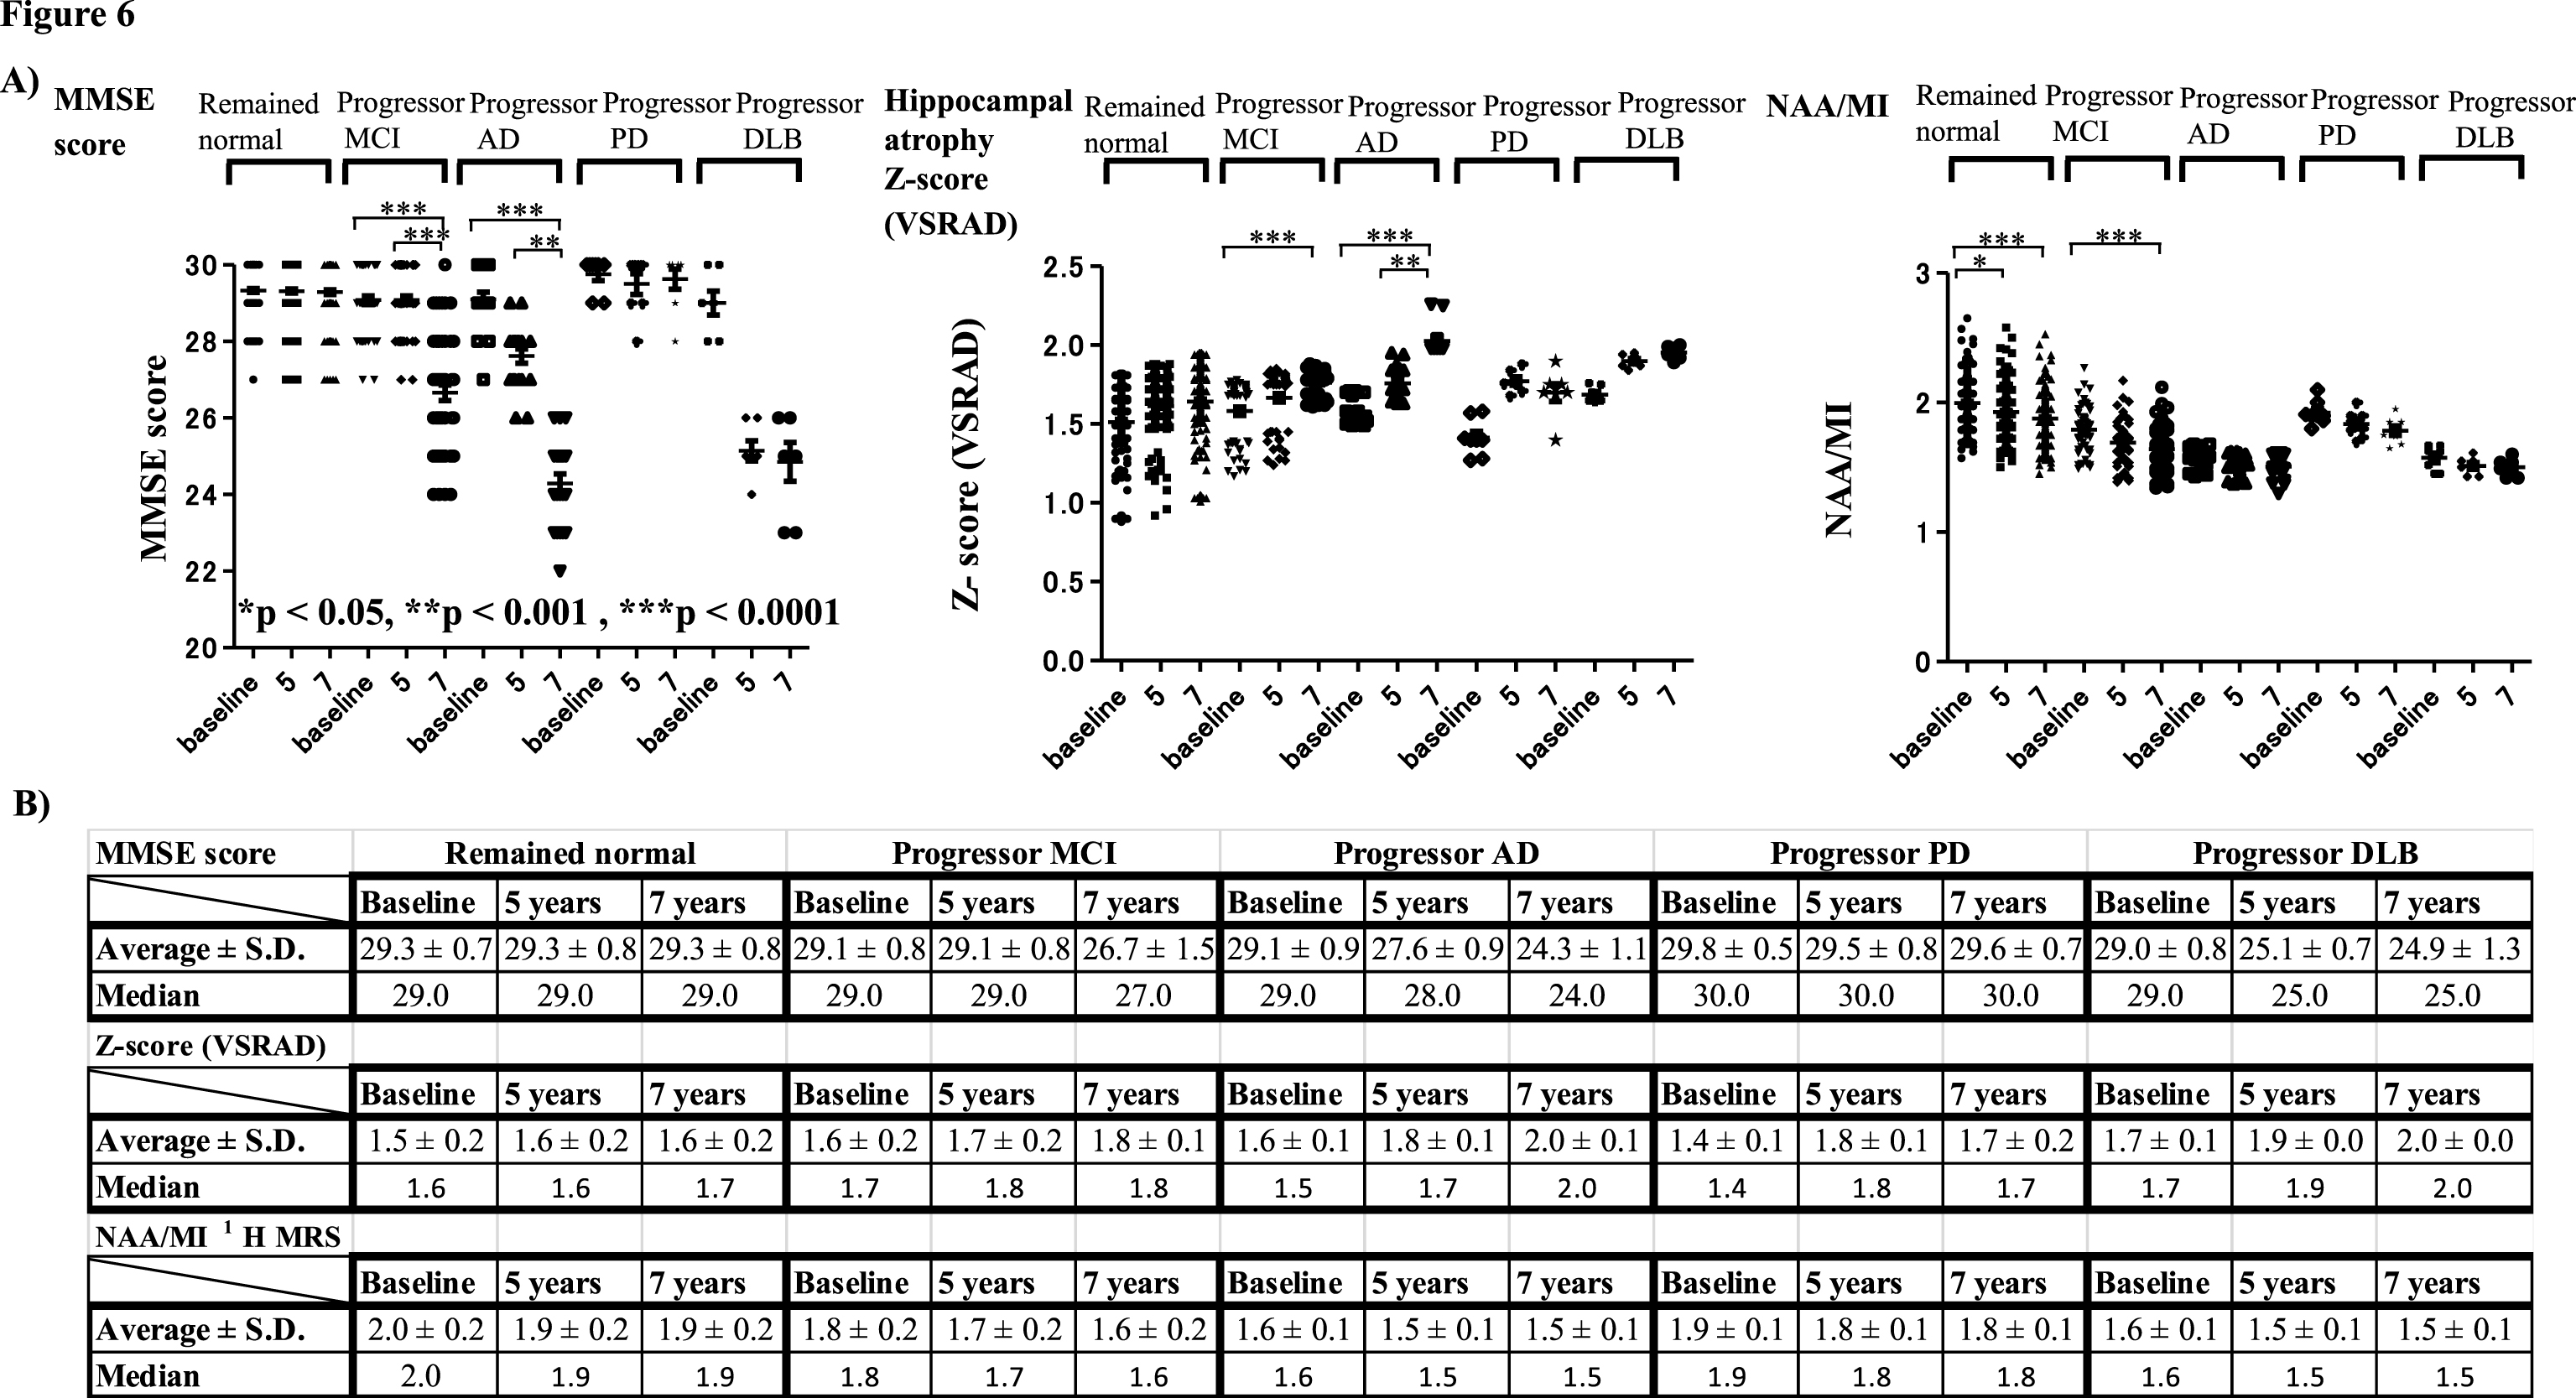
The results showed that MMSE scores at 7 years after baseline were significantly lower compared with those at 5 years and at baseline in subjects with progressor MCI and AD (Fig. 6A). Significantly increased VSRAD Z-scores at 7 and 5 years after baseline indicated that hippocampal atrophy was also increased in these groups. The NAA/MI ratio indicated that values decreased from baseline in subjects with MCI, subjects with progressor AD, and those with DLB. Although the NAA/MI ratio in subjects with AD, PD, and DLB clearly tended to decrease, the analysis did not reveal any significant changes in these groups. Instead, the NAA/MI ratio showed a significant decrease at 5 and 7 years after baseline in subjects who remained cognitively normal and at 7 years after baseline compared with baseline(Fig. 6A, B).
Fig.6
Serial changes in MMSE scores, Z-scores (VSRAD) and NAA/MI ratio on 1H MRS at baseline, 5 years, and 7 years after baseline in each group. Serial changes at baseline, 5 years, and 7 years later are shown in the Figure and Table. MMSE scores 7 years after baseline decreased significantly compared with 5 years after baseline in the progressor MCI and AD groups (A). The hippocampal atrophy shown by VSRAD Z-scores revealed significantly increased Z-scores at 7 years and 5 years compared with baseline. In the progressor MCI, AD and DLB groups, it is noted that NAA/MI ratio was already decreased from baseline. Although the NAA/MI ratio in the AD, PD, and DLB groups tended to decrease progressively, the results did not reveal significant serial changes in these groups. Instead, the NAA/MI ratio showed a significant decrease at 7 and 5 years after baseline in subjects who remained cognitively normal, and in the progressor MCI group 7 years after baseline compared with baseline (A, B).
CSF Aβ42 and CSF-p-tau obtained at the final point (7 years after baseline) in each group
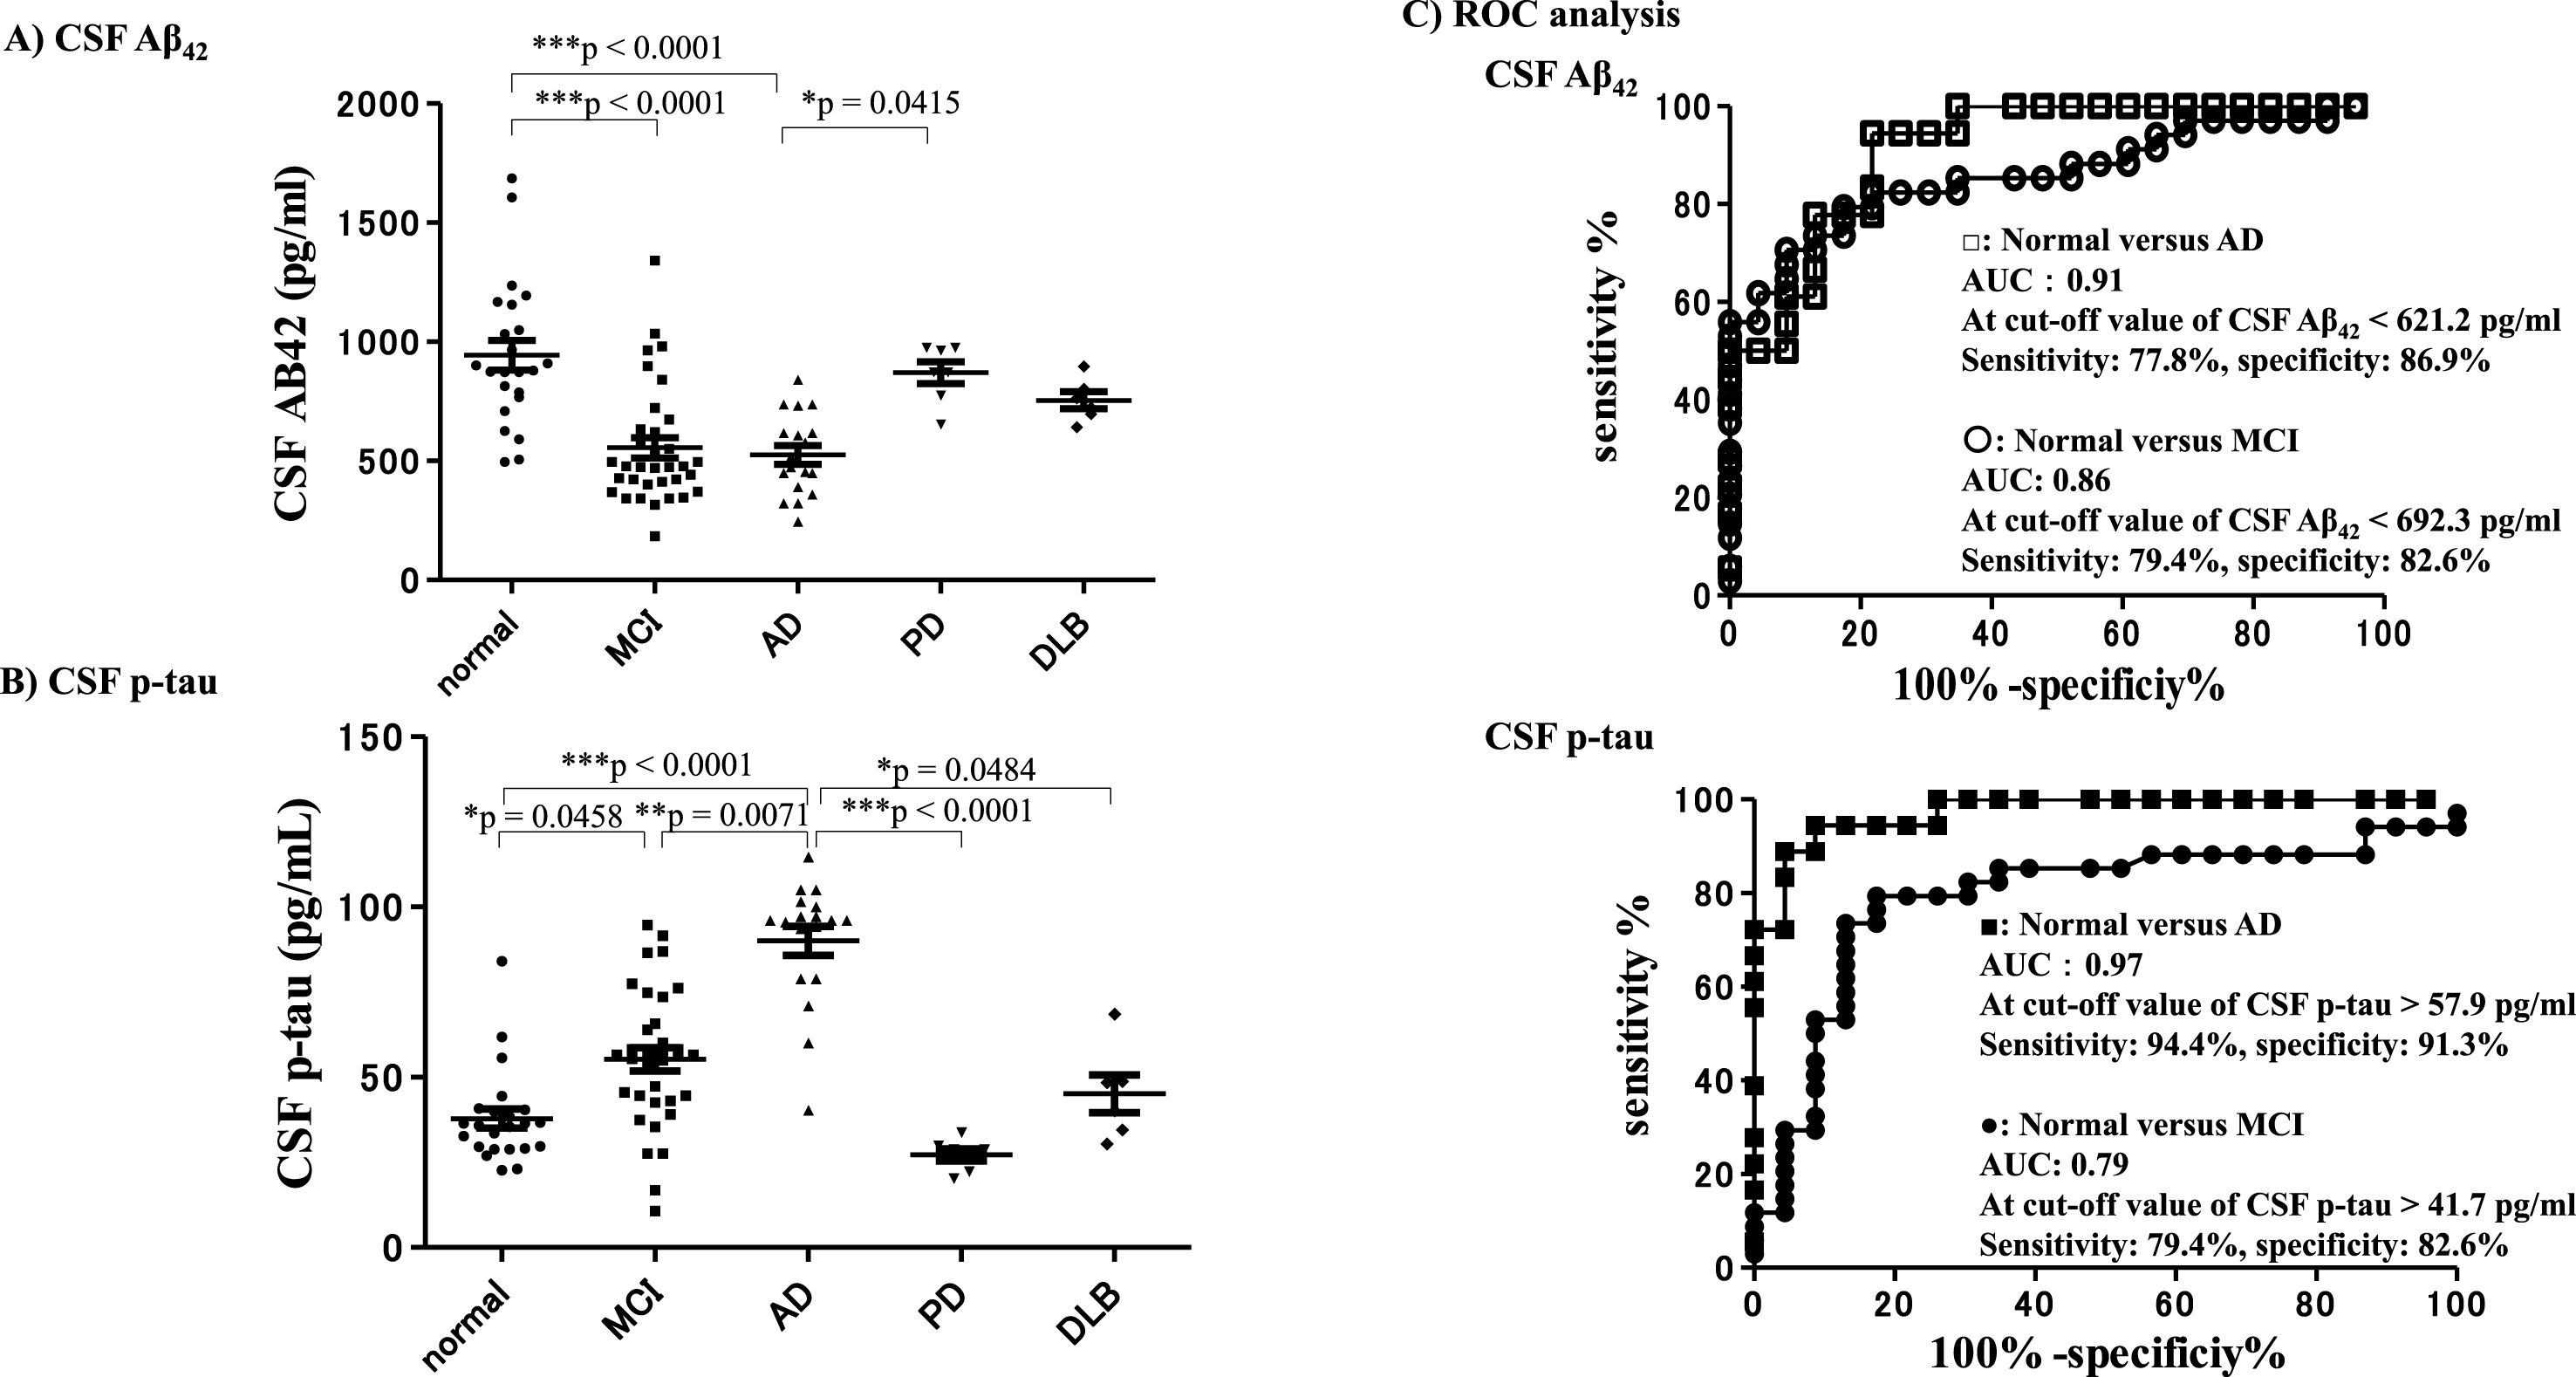
The CSF Aβ42 levels of subjects in the AD group and the MCI group were significantly lower compared with subjects who remained cognitively normal (***p < 0.0001) (Fig. 7A). The CSF-p-tau levels of the AD subjects were significantly higher compared with subjects who remained cognitively normal, and compared with the other neurological disease groups. The levels of CSF p-tau in subjects with AD were significantly higher compared with the MCI (**p = 0.0071) and DLB (*p = 0.0484; Fig. 7B) groups. ROC analysis revealed that the level of CSF Aβ42 7 years after baseline enabled differentiation of subjects with AD from those who remained cognitively normal with an AUC of 0.91, sensitivity of 77.8%, and specificity of 86.9% at a cut-off value <621.2 pg/ml. The level of CSF-Aβ42 differentiated subjects with MCI from those who remained cognitively normal with an AUC of 0.86, sensitivity of 79.4%, and specificity of 82.6% at a cut-off value <692.3 pg/ml. The CSF-p tau levels were able to differentiate subjects with AD from those who remained cognitively normal with an AUC of 0.97, sensitivity of 94.4%, and specificity of 91.3% at a cut-off value >57.9 pg/ml. The CSF-p tau levels could also differentiate subjects with MCI from those who remained cognitively normal with an AUC of 0.79, sensitivity of 79.4%, and specificity of 82.6% at a cut-off value >41.7 pg/ml (Fig. 7C). The results of the CSF-Aβ42 and CSF p-tau analyses 7 years after baseline revealed that subjects in the AD group showed AD-specific biomarker changes.
Fig.7
CSF-Aβ42 and CSF-p-tau 7 years after baseline. CSF-Aβ42 and CSF-p-tau measured at the final point (7 years after baseline) in each group. CSF-Aβ42 levels of subjects in the AD and MCI groups were significantly lower compared with subjects who remained cognitively normal (A). CSF-p-tau levels were significantly higher in the AD group compared with subjects who remained cognitively normal and with the other neurological disease groups. CSF p-tau levels in subjects with AD were significantly higher than those in subjects with MCI and subjects with DLB (B). ROC analysis revealed that the level of CSF-Aβ42 7 years after baseline could differentiate subjects with AD from those who remained cognitively normal with an AUC of 0.91, sensitivity of 77.8%, and specificity of 86.9%, with a cut-off value of <621.2 pg/ml. The level of CSF-Aβ42 differentiated subjects with MCI from those who remained cognitively normal with an AUC of 0.86, sensitivity of 79.4%, and specificity of 82.6% with a cut-off value of <692.3 pg/ml. CSF p-tau levels could differentiate AD subjects from those who remained cognitively normal with an AUC of 0.97, sensitivity of 94.4%, and specificity of 91.3% with a cut-off value of >57.9 pg/ml, and differentiate MCI subjects from normal subjects with an AUC of 0.79, sensitivity of 79.4%, and specificity of 82.6% with a cut-off value of >41.7 pg/ml (C). Thus, the CSF-Aβ42 and CSF p-tau results revealed that subjects in the AD group exhibited AD-specific biomarker changes.
Correlation between 1H MRS metabolites and MMSE and CSF biomarkers at the final point, 7 years after baseline
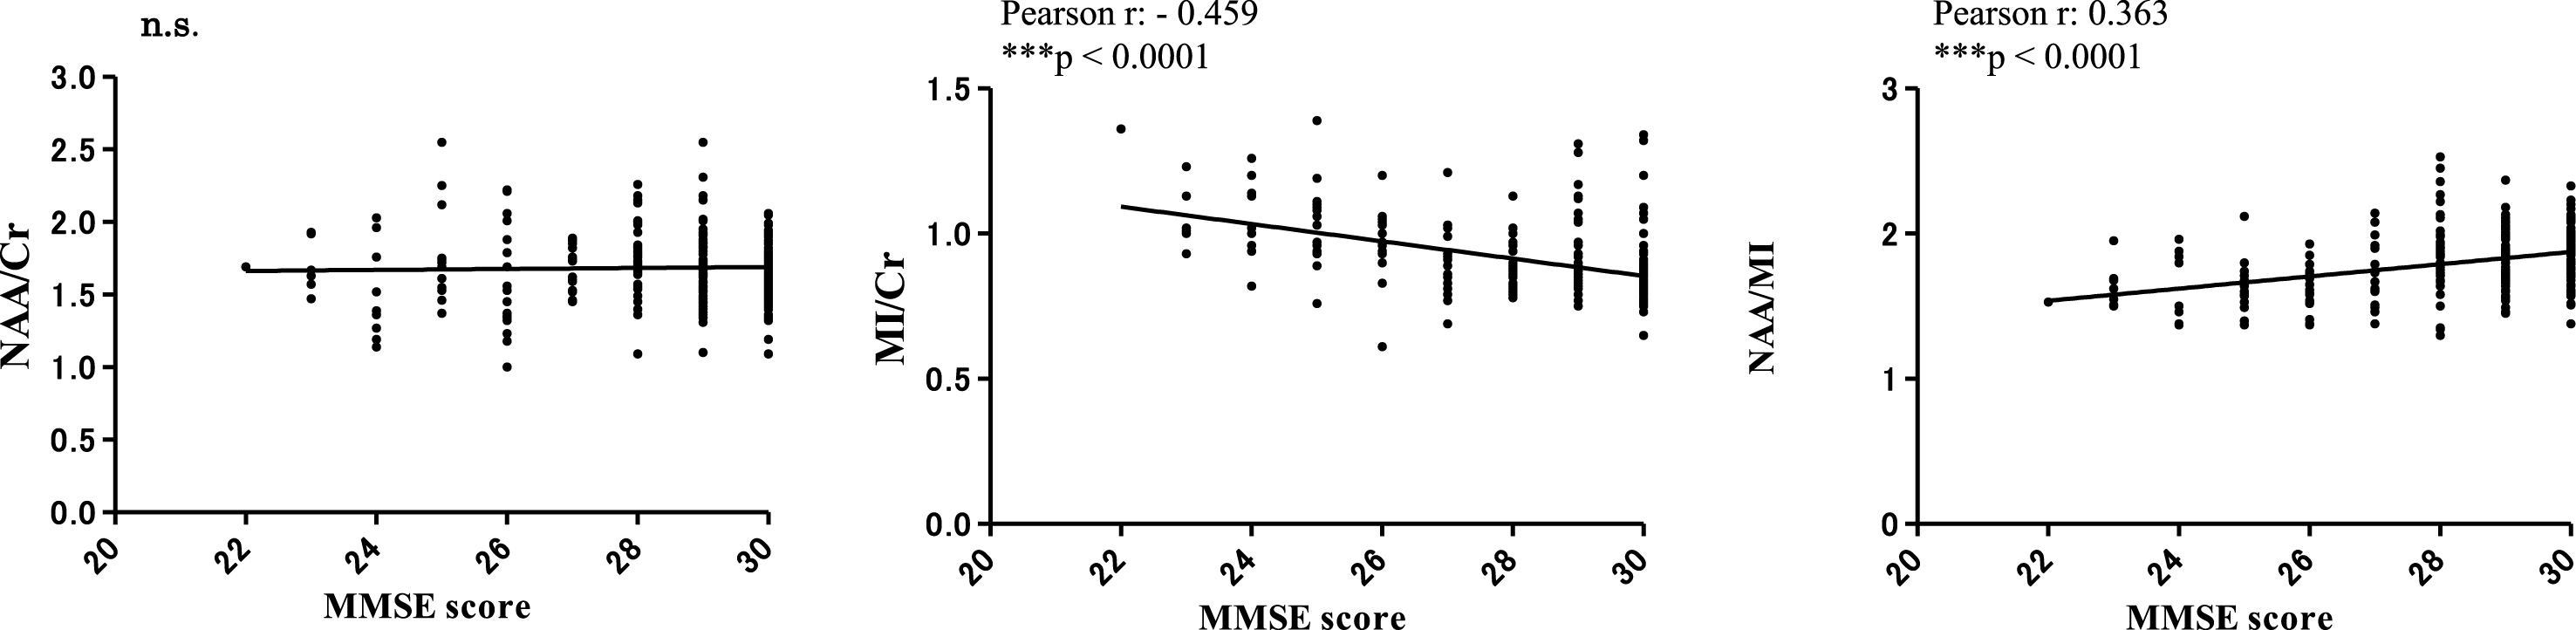
Correlation analyses between MMSE scores and 1H MRS metabolites (NAA/Cr, MI/Cr and NAA/MI) were conducted 7 years after baseline. MMSE scores exhibited a significant negative correlation with the MI/Cr ratio (Pearson r: –0.459, ***p < 0.0001), a significant positive correlation with the NAA/MI ratio (Pearson r: –0.459, ***p < 0.0001), but no correlation with the NAA/Cr ratio (Fig. 8). Regarding the relationship between CSF- Aβ42, CSF-p-tau, and NAA/MI ratio, we examined the correlation between NAA/MI and NAA/MI in each subject 7 years after baseline. The results did not find any significant statistical correlation between the NAA/MI ratio and the levels of CSF-Aβ42 andCSF-p-tau.
Fig.8
Correlations between MRS metabolites (NAA/Cr, MI/Cr and NAA/MI) and MMSE scores 7 years after baseline. There were no significant correlations between MMSE scores and the NAA/Cr ratio. The MI/Cr ratio was negatively correlated with MMSE scores (Pearson r: –0.459, ***p < 0.0001). The NAA/MI ratio was positively correlated with MMSE scores (Pearson r: 0.363, ***p < 0.0001). The results did not reveal a significant correlation between the NAA/MI ratio and CSF-Aβ42 or CSF-p-tau levels at 7 years from baseline (data not shown).
Effect of apolipoprotein E ɛ4 (APOE4 allele) and NAA/Cr, MI/Cr, and NAA/MI ratio on 1H MRS at baseline
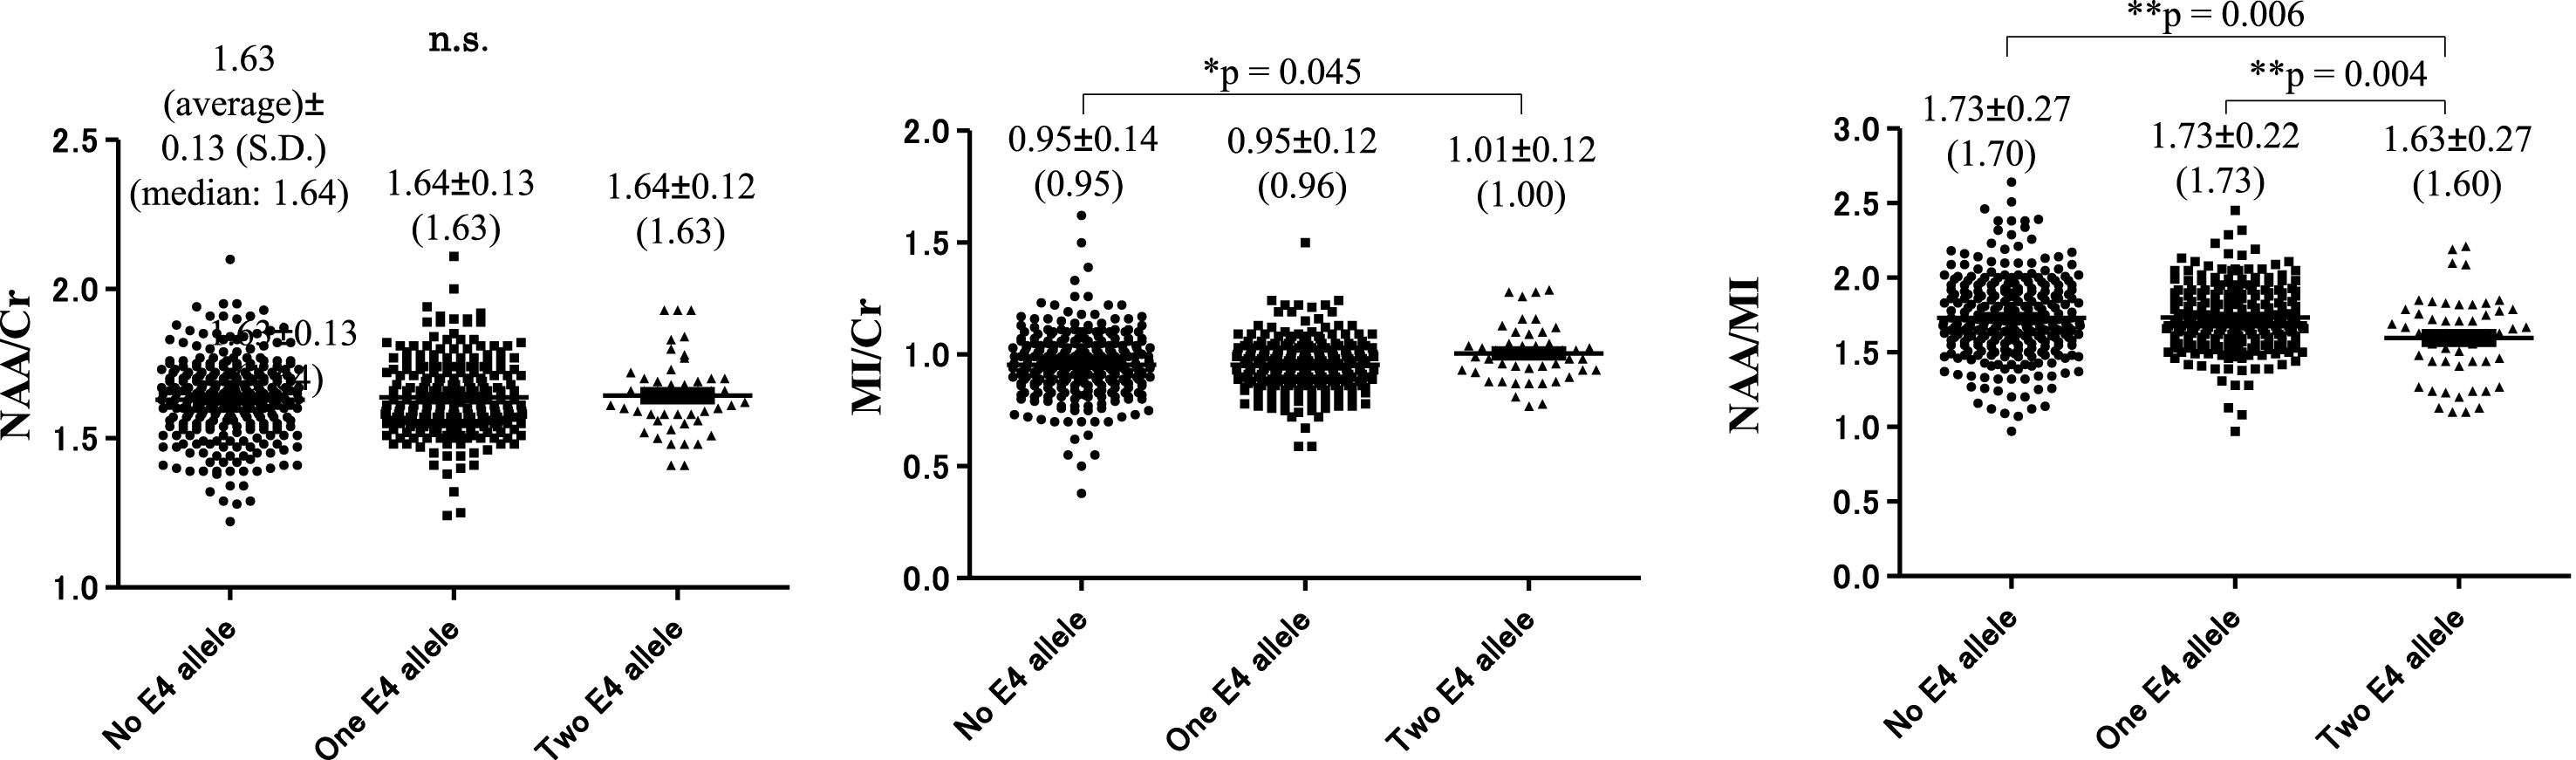
The MI/Cr ratio at baseline was significantly higher in subjects with two copies of the ɛ4 allele (1.01±0.12 [1.00]) compared with subjects with no ɛ4 allele (0.95±0.14 [0.95], p = 0.045). The NAA/MI ratio at baseline was significantly decreased in subjects with two copies of the ɛ4 allele 1.63±0.27 (1.60) compared with subjects with one copy of the ɛ4 allele 1.73±0.22. (1.73) (**p = 0.004) and subjects without the ɛ4 allele: 1.73±0.27 (1.70), (**p = 0.006). The NAA/Cr ratio showed no significant difference between subjects with and without the ɛ4 allele (Fig. 9).
Fig.9
Number of apolipoprotein E ɛ4 alleles and NAA/Cr, MI/Cr, and NAA/MI ratio at baseline. There was no significant difference between subjects with the ɛ4 allele and subjects without the ɛ4 allele in NAA/Cr ratio. MI/Cr ratio at baseline was significantly increased in subjects with two copies of the ɛ4 allele: 1.01±0.12 (1.00) compared with subjects without the ɛ4 allele: 0.95±0.14 (0.95) (*p = 0.045). The NAA/MI ratio at baseline was significantly decreased in subjects with two copies of the ɛ4 allele 1.63±0.27 (1.60) compared with subjects with one copy of the ɛ4 allele 1.73±0.22 (1.73) (**p = 0.004) and subjects without the ɛ4 allele: 1.73±0.27 (1.70), (**p = 0.006).
DISCUSSION
We followed 289 cognitively normal subjects without neurological deficits or brain atrophy at baseline. These subjects underwent long-term observation of neurological conditions, assessment of cognitive status using MMSE scores, and analysis of metabolites of 1H MRS in the PCC with MRI over 7 years. Of the 289 participants, 200 (69%) remained cognitively normal (“remained normal”); 53 (18.3 %) developed MCI (“progressor MCI”); 21 (7.3 %) developed AD (“progressor AD”); eight (2.8%) developed PD (“progressor PD”); and seven (2.4%) developed DLB (“progressor DLB”) within 7 years from baseline. The results revealed that the NAA/Cr ratio was significantly decreased in the progressor MCI group, the AD group, and the DLB group compared with baseline (Table 1A and Fig. 3A). The MI/Cr ratio was significantly elevated in the progressor AD and DLB groups compared with baseline (Table 1B and Fig. 3B). The NAA/MI ratio in the progressor AD and DLB groups was significantly lower(approximately < 1.7) compared with subjects who remained cognitively normal from the asymptomatic baseline (approximately > 1.8) (Table 1C and Fig. 3C). The results of the ROC analysis of cognitively normal compared with AD subjects indicated that cognitively normal older subjects with an NAA/MI ratio lower than 1.67 in the PCC may be at risk of progressing to AD (progressor AD) within 7 years. The ROC analysis revealed that this measure had a sensitivity of 90.5%, and specificity of 90.3% (Fig. 4A). In contrast, the ROC analysis of the NAA/MI ratio revealed that the measure was relatively inaccurate for distinguishing the progressor MCI group from subjects who remained asymptomatic. However, it is possible that the asymptomatic subjects whose NAA/MI ratios were more or less than 1.7 may have been at risk of progressor MCI (Table 1C and Fig. 4B). MMSE scores and hippocampal atrophy on the VSRAD (Fig. 5A, B) did not show any apparent abnormalities in the pre-symptomatic stage until 5 years after baseline, compared with the 1H MRS results. These findings suggest that cognitive decline, as demonstrated by MMSE scores, and hippocampal atrophy (reflected by VSRAD) in the progressor MCI, AD, and DLB groups emerged 5–7 years after the appearance of abnormalities in 1H MRS. Thus, the current results suggest that 1H MRS alterations precede cognitive decline and hippocampal atrophy in subjects with progressor MCI, AD, and DLB.
Regarding the serial changes in MMSE scores, hippocampal atrophy, and the NAA/MI ratio in the PCC (Fig. 6), the results indicated that cognitive decline and hippocampal atrophy occurred later, from 5 to 7 years after baseline (Fig. 6A, B). In contrast, the serial change in each group was not statistically significant except in the group of subjects who remained cognitively normal, and in the progressor MCI group. The NAA/MI ratio in subjects with progressor AD, PD, and DLB tended to decrease over time, but the changes were not statistically significant. There are several potential explanations for this pattern of results. First, it is possible that the NAA/MI ratio in the AD and DLB groups was defined at baseline (i.e., pre-symptomatic stage of the disease), and remained relatively stable subsequently. Alternatively, because we had limited data, the statistical power may have been insufficient to reveal significant results. Thus, further studies will be needed to clarify this issue.
The results revealed a significant correlation between MMSE scores and MI/Cr and NAA/MI ratios (Fig. 8). However, significant correlations were not found between the NAA/MI ratio and CSF-Aβ42 or CSF-p-tau at 7 years from baseline (data not shown). Thus, our 1H MRS results suggest that cognitive function might be associated with the MI/Cr and NAA/MI ratios in the PCC; however, it is unclear whether decreased NAA/MI is directly associated with the molecular pathology of AD, such as abnormal deposition of amyloid and tau in the brain. The results of the 1H MRS analysis of metabolites and those of amyloid or tau PET should be compared with validate whether abnormalities in 1H MRS are associated with abnormal amyloid deposition and the presence of tau.
Regarding the effect of the number of APOE4 alleles in the 289 cognitively normal participants, the MI/Cr ratio was significantly higher in subjects with two ɛ4 alleles, compared with subjects with no ɛ4 alleles. However, the NAA/MI ratio was significantly lower in subjects with two ɛ4 alleles or one ɛ4 allele compared with subjects with no ɛ4 alleles (Fig. 9). These results suggest that altered NAA/Cr, MI/Cr, and NAA/MI ratios in the PCC, along with the APOE4 allele, may be involved in the pathophysiology of AD. These results are compatible with previous studies demonstrating that alterations of the metabolites in 1H MRS in the PCC are useful for predicting the onset of AD at an asymptomatic stage in sporadic AD. Moreover, 1H MRS studies of familial AD with genetic mutations have produced convincing results, and the method may also be applied to sporadic cases [44–46]. Godbolt et al. [44] reported 1H MRS in the PCC in pre-symptomatic mutation carriers of presenilin 1 or amyloid-β protein precursor mutations. They showed a significant decrease in NAA/Cr and NAA/MI ratios in pre-symptomatic mutation carriers compared with controls, concluding that metabolic changes can be detected in pre-symptomatic mutation carriers years before the expected onset of AD [44]. Kantarci et al. [45] examined subjects with microtubule-associated protein (MAPT) mutations. They reported that symptomatic MAPT mutation carriers were characterized by decreased NAA/Cr and NAA/MI ratios, hippocampal atrophy, and an increased MI/Cr ratio, whereas presymptomatic MAPT mutation carriers exhibited increased MI/Cr and decreased NAA/MI ratios, with an unchanged NAA/Cr ratio and hippocampal volume compared with controls. These results indicate that the MI/Cr ratio, a possible index of glial activation, precedes the decrease of the NAA/Cr ratio, a measure of neuronal integrity and hippocampal atrophy [45]. 1H MRS abnormalities in the PCC can be observed in the genetic background for the screening of prodromal AD. In addition, the decreased NAA/Cr and NAA/MI ratios and increased MI levels in the PCC could be characteristic findings in pre-symptomatic andsymptomatic AD.
Although the pathomechanism of the alteration of metabolites in 1H MRS in the PCC is unknown, 1H MRS abnormalities in the PCC are likely to be an important finding reflecting the pathophysiology of AD. The PCC forms a central node in the default mode network of the brain, and the connections between the PCC and the hippocampus are altered at a very early stage of AD. It has also reported that amyloid deposition is prominent in the PCC, and reduced metabolism is recognized in the presymptomatic stages of AD. Metabolic abnormalities in the PCC could be linked to amyloid deposition in early AD [55–58]. Previous studies have proposed that a decreased NAA/Cr ratio reflects decreased neuronal integrity, while increased MI/Cr may reflect glial activation or neuroinflammation associated with neuronal degeneration, and decreased NAA/MI is a sensitive marker reflecting pathological changes of MCI and AD [33–36, 43]. Wang et al (2015) reported a systematic review and meta-analysis of altered MRS metabolites in AD. They concluded that the NAA/Cr ratio decreased markedly in the PCC, and a significantly elevated MI/Cr ratio was found not only in the PCC but also in the parietal gray matter [43]. Lin et al. (2016) reported that NAA and the NAA/MI ratio were sensitive to the functional status of adults with Down syndrome progressing to AD, including prior to dementia [46]. Our results also showed that the MI/Cr ratio increased and the NAA/MI ratio decreased with an increase in the number of APOE ɛ4 alleles (Fig. 9). The results suggest that low NAA/Cr and high MI/Cr ratios in the PCC may be involved in APOE ɛ4 allele, and could be risk factors for the onset of AD. Importantly, Voevodskaya et al. [47] reported systematic results showing the altered metabolites in the PCC on 1H MRS in relation to cognitive status, amyloid PET findings, and APOE4 genotype. They reported that amyloid-positive cognitively healthy participants exhibited a significant increase in MI/Cr and MI/NAA levels compared with amyloid-negative healthy older subjects. In addition, MI/Cr and MI/NAA ratios were correlated with the amount of cortical deposition of amyloid evaluated in amyloid-positive healthy older subjects, and levels were found to be already elevated at the asymptomatic stages of AD. Moreover, MI/Cr concentrations were increased in healthy APOE ɛ4 carriers with normal CSF Aβ42 levels, suggesting that MI levels may reveal the regional neural effects of APOE ɛ4 before amyloid pathology is detectable. They concluded that MI levels were elevated preceding amyloid pathology, and MI/Cr levels of APOE ɛ4 carriers were elevated compared with those of APOE ɛ4 non-carriers, independently of amyloid pathology. Interestingly, Voevodskaya et al. (2016) reported that MI/Cr and NAA/MI levels, but not NAA/Cr levels were altered by the APOE ɛ4 allele in a dose-dependent manner [47]. These results suggest that increased MI levels, which could reflect glial activation and inflammatory changes linked to the APOE ɛ4 allele may precede to amyloid and tau pathology in AD. Thus, the findings reported by Voevodskaya et al. (2016) are compatible with the current results (Fig. 9) [47]. In addition, our results also revealed a significantly decreased NAA/MI ratio and elevated MI/Cr ratio in the PCC using 1H MRS in subjects with progressor DLB, similar to previous findings in AD subjects [59–62]. Although the pathomechanism underlying 1H MRS abnormalities in DLB is unknown, our 1H MRS results in subjects who developed DLB may reflect reduced metabolism and abundant amyloid deposition of the PCC, which could be characteristic findings in DLB, as previously reported [59–62]. These results suggest that the NAA/MI ratio in the PCC could be used for differential diagnosis among typical PD, PD with dementia, and DLB, and that 1H MRS should be used to examine patients with parkinsonism.
The current data were obtained at three time points (baseline, and 5 and 7 years after baseline), including MMSE scores, Z-scores (VSRAD) (showing brain atrophy), and metabolites of 1H MRS in the PCC. The results suggest that 1H MRS changes preceded changes in MMSE scores and the VSRAD, and that abnormalities in 1H MRS had already appeared in the asymptomatic stages at baseline. However, declining MMSE scores and hippocampal atrophy, shown by the VSRAD, appeared 5 years after baseline, but were not apparent during the asymptomatic period until 5 years after baseline. We speculated that the NAA/MI ratio in the PCC, shown by 1H MRS, might insidiously decrease for 7 years followed by cognitive decline and brain atrophy. Taken together with previous reports, our results indicate that subjects exhibiting decreased NAA/MI and increased MI/Cr ratios in the PCC with 1H MRS, in combination with carrying APOE ɛ4, may be at risk of developing AD or DLB. Based on these findings, we propose that the evaluation of the NAA/MI ratio in the PCC by 1H MRS may provide a useful method for screening preclinical AD in clinicalsettings.
However, the current study involved several limitations that should be considered. First, we were unable to analyze changes in CSF biomarkers because we could only examine the CSF biomarkers at one point, 7 years after baseline, because of ethical constraints. In addition, the three time points (baseline, 5 and 7 years later) of data collection for 1H MRS and MMSE and the single time point for the CSF biomarkers were insufficient for rigorous longitudinal analysis. In the future, longitudinal studies over a longer period from the asymptomatic stage through the symptomatic stage to worsening of the condition, with greater sampling frequency, should be performed to validate whether the NAA/MI ratio in the PCC could be used as a screening marker for the prediction of AD, as suggested by our results. It may be beneficial to perform 1H MRS together with 18F-fluorodeoxyglucose, amyloid, and tau-PET to investigate whether the 1H MRS abnormalities are associated with the molecular pathology of AD. Thus, despite these limitations, to our knowledge the current study is the first demonstration of the clinical utility of 1H MRS in the PCC for screening preclinical or prodromal AD. Further extensive multicenter prospective studies involving serial 1H MRS should be performed to validate whether decreased NAA/MI ratio in the PCC detected with 11H MRS could be a risk marker forpreclinical AD.
ACKNOWLEDGMENTS
We acknowledge the technical staff of Toshiba Medical Systems, who provided technical advice on the MRI and 1H MRS equipment. This work was supported by a Grant-in-Aid for Scientific Research (M.W.) from the Ministry of Education, Culture, Sports, Science, and Technology of Japan. We thank Benjamin Knight, MSc, from Edanz Group (http://www.edanzediting.com/ac) for editing a draft of this manuscript.
Authors’ disclosures available online (http://j-alz.com/manuscript-disclosures/17-0450r2).
REFERENCES
[1] | Sperling RA , Aisen PS , Beckett LA , Bennett DA , Craft S , Fagan AM , Iwatsubo T , Jack CR Jr , Kaye J , Montine TJ , Park DC , Reiman EM , Rowe CC , Siemers E , Stern Y , Yaffe K , Carrillo MC , Thies B , Morrison-Bogorad M , Wagster MV , Phelps CH ((2011) ) Toward defining the preclinical stages of Alzheimer’s disease: Recommendations from the National Institute on Aging-Alzheimer’s Association workgroups on diagnostic guidelines for Alzheimer’s disease. Alzheimers Dement 7: , 280–292. |
[2] | Bateman RJ , Xiong C , Benzinger TL , Fagan AM , Goate A , Fox NC , Marcus DS , Cairns NJ , Xie X , Blazey TM , Holtzman DM , Santacruz A , Buckles V , Oliver A , Moulder K , Aisen PS , Ghetti B , Klunk WE , McDade E , Martins RN , Masters CL , Mayeux R , Ringman JM , Rossor MN , Schofield PR , Sperling RA , Salloway S , Morris JC ((2012) ) Clinical and biomarker changes in dominantly inherited Alzheimer’s disease. N Engl J Med 367: , 795–804. |
[3] | Lin JS , O’Connor E , Rossom RC , Perdue LA , Eckstrom E ((2013) ) Screening for cognitive impairment in older adults: A systematic review for the U.S. Preventive Services Task Force. Ann Intern Med 159: , 601–612. |
[4] | Lista S , Garaci FG , Ewers M , Teipel S , Zetterberg H , Blennow K , Hampel H ((2014) ) CSF Aβ1-42 combined with neuroimaging biomarkers in the early detection, diagnosis and prediction of Alzheimer’s disease. Alzheimers Dement 10: , 381–392. |
[5] | Kandimalla RJ , Prabhakar S , Wani WY , Kaushal A , Gupta N , Sharma DR , Grover VK , Bhardwaj N , Jain K , Gill KD ((2013) ) CSF p-Tau levels in the prediction of Alzheimer’s disease. Biol Open 2: , 1119–1124. |
[6] | Roe CM , Fagan AM , Grant EA , Holtzman DM , Morris JC ((2013) ) CSF biomarkers of Alzheimer disease: “Noncognitive” outcomes. Neurology 81: , 2028–2031. |
[7] | Moghekar A , Li S , Lu Y , Li M , Wang MC , Albert M , O’Brien R ((2013) ) CSF biomarker changes precede symptom onset of mild cognitive impairment. Neurology 81: , 1753–1758. |
[8] | Wang L , Brier MR , Snyder AZ , Thomas JB , Fagan AM , Xiong C , Benzinger TL , Holtzman DM , Morris JC , Ances BM ((2013) ) Cerebrospinal fluid Aβ42, phosphorylated tau181, and resting-state functional connectivity. JAMA Neurol 70: , 1242–1248. |
[9] | Okamura N , Furumoto S , Harada R , Tago T , Yoshikawa T , Fodero-Tavoletti M , Mulligan RS , Villemagne VL , Akatsu H , Yamamoto T , Arai H , Iwata R , Yanai K , Kudo Y ((2013) ) Novel 18F-labeled arylquinoline derivatives for noninvasive imaging of tau pathology in Alzheimer disease. J Nucl Med 54: , 1420–1427. |
[10] | Maruyama M , Shimada H , Suhara T , Shinotoh H , Ji B , Maeda J , Zhang MR , Trojanowski JQ , Lee VM , Ono M , Masamoto K , Takano H , Sahara N , Iwata N , Okamura N , Furumoto S , Kudo Y , Chang Q , Saido TC , Takashima A , Lewis J , Jang MK , Aoki I , Ito H , Higuchi M ((2013) ) Imaging of tau pathology in a tauopathy mouse model and in Alzheimer patients compared to normal controls. Neuron 79: , 1094–1108. |
[11] | Harada R , Okamura N , Furumoto S , Furukawa K , Ishiki A , Tomita N , Tago T , Hiraoka K , Watanuki S , Shidahara M , Miyake M , Ishikawa Y , Matsuda R , Inami A , Yoshikawa T , Funaki Y , Iwata R , Tashiro M , Yanai K , Arai H , Kudo Y ((2016) ) 18F-THK5351: A novel PET radiotracer for imaging neurofibrillary pathology in Alzheimer disease. J Nucl Med 57: , 208–214. |
[12] | Okamura N , Yanai K ((2017) ) Brain imaging: Applications of tau PET imaging. Nat Rev Neurol 13: , 197–198. |
[13] | Kikuchi A , Okamura N , Hasegawa T , Harada R , Watanuki S , Funaki Y , Hiraoka K , Baba T , Sugeno N , Oshima R , Yoshida S , Kobayashi J , Ezura M , Kobayashi M , Tano O , Mugikura S , Iwata R , Ishiki A , Furukawa K , Arai H , Furumoto S , Tashiro M , Yanai K , Kudo Y , Takeda A , Aoki M ((2016) ) In vivo visualization of tau deposits in corticobasal syndrome by 18F-THK5351 PET. Neurology 87: , 2309–2316. |
[14] | Passamonti L , Vázquez Rodríguez P , Hong YT , Allinson KS , Williamson D , Borchert RJ , Sami S , Cope TE , Bevan-Jones WR , Jones PS , Arnold R , Surendranathan A , Mak E , Su L , Fryer TD , Aigbirhio FI , O’Brien JT , Rowe JB ((2017) ) 18F-AV-1451 positron emissiontomography in Alzheimer’s disease and progressive supranuclearpalsy. Brain 140: , 781–791. |
[15] | Spina S , Schonhaut DR , Boeve BF , Seeley WW , Ossenkoppele R , O’Neil JP , Lazaris A , Rosen HJ , Boxer AL , Perry DC , Miller BL , Dickson DW , Parisi JE , Jagust WJ , Murray ME , Rabinovici GD ((2017) ) Frontotemporal dementia with the V337M MAPT mutation: Tau-PET and pathology correlations. Neurology 88: , 758–766. |
[16] | Omori C , Kaneko M , Nakajima E , Akatsu H , Waragai M , Maeda M , Morishima-Kawashima M , Saito Y , Nakaya T , Taru H , Yamamoto T , Asada T , Hata S , Suzuki T , Japanese Alzheimer’s Disease Neuroimaging Initiative ((2014) ) Increased levels of plasma p3-alcα35, a major fragment of Alcadeinα by γ-secretase cleavage, in Alzheimer’s disease. J Alzheimers Dis 39: , 861–870. |
[17] | Uchida K , Shan L , Suzuki H , Tabuse Y , Nishimura Y , Hirokawa Y , Mizukami K , Akatsu H , Meno K , Asada T ((2015) ) Amyloid-β sequester proteins as blood-based biomarkers of cognitive decline. Alzheimers Dement (Amst) 1: , 270–280. |
[18] | Mattsson N , Andreasson U , Zetterberg H , Blennow K ; Alzheimer’s Disease Neuroimaging Initiative ((2017) ) Association of plasma neurofilament light with neurodegeneration in patients with Alzheimer disease. JAMA Neurol 74: , 557–566. |
[19] | O’Bryant SE , Mielke MM , Rissman RA , Lista S , Vanderstichele H , Zetterberg H , Lewczuk P , Posner H , Hall J , Johnson L , Fong YL , Luthman J , Jeromin A , Batrla-Utermann R , Villarreal A , Britton G , Snyder PJ , Henriksen K , Grammas P , Gupta V , Martins R , Hampel H ; Biofluid Based Biomarker Professional Interest Area ((2017) ) Blood-based biomarkers in Alzheimer disease: Current state of thescience and a novel collaborative paradigm for advancingfrom discovery to clinic. Alzheimers Dement 13: , 45–58. |
[20] | Ashburner J , Friston KJ ((2000) ) Voxel-based morphometry–the methods. Neuroimage 11: , 805–821. |
[21] | Hirata Y , Matsuda H , Nemoto K , Ohnishi T , Hirao K , Yamashita F , Asada T , Iwabuchi S , Samejima H ((2005) ) Voxel based morphometry to discriminate early Alzheimer’s disease from controls. Neurosci Lett 382: , 269–274. |
[22] | Whitwell JL , Josephs KA , Murray ME , Kantarci K , Przybelski SA , Weigand SD , Vemuri P , Senjem ML , Parisi JE , Knopman DS , Boeve BF , Petersen RC , Dickson DW , Jack CR Jr ((2008) ) MRI correlates of neurofibrillary tangle pathology at autopsy: A voxel-based morphometry study. Neurology 71: , 743–749. |
[23] | Hayashi H , Kawakatsu S , Suzuki A , Shibuya Y , Kobayashi R , Sato C , Otani K ((2012) ) Application of the VSRAD, a specific and sensitive voxel-based morphometry, to comparison of entorhinal cortex atrophy between dementia with Lewy bodies and Alzheimer’s disease. Dement Geriatr Cogn Disord 34: , 328–331. |
[24] | Matsuda H , Mizumura S , Nemoto K , Yamashita F , Imabayashi E , Sato N , Asada T ((2012) ) Automatic voxel-based morphometry of structural MRI by SPM8 plus diffeomorphic anatomic registration through exponentiated lie algebra improves the diagnosis of probable Alzheimer Disease. AJNR Am J Neuroradiol 33: , 1109–1114. |
[25] | Waragai M , Hata S , Suzuki T , Ishii R , Fujii C , Tokuda T , Arai H , Ohrui T , Higuchi S , Yoshida M , Igarashi K , Moriya M , Iwai N , Uemura K ((2014) ) Utility of SPM8 plus DARTEL (VSRAD) combined with magnetic resonance spectroscopy as adjunct techniques for screening and predicting dementia due to Alzheimer’s disease in clinical practice. J Alzheimers Dis 41: , 1207–1222. |
[26] | Kantarci K , Jack CR Jr , Xu YC , Campeau NG , O’Brien PC , Smith GE , Ivnik RJ , Boeve BF , Kokmen E , Tangalos EG , Petersen RC ((2000) ) Regional metabolic patterns in mild cognitive impairment and Alzheimer’s disease: A 1H MRS study. Neurology 55: , 210–217. |
[27] | Kantarci K , Xu Y , Shiung MM , O’Brien PC , Cha RH , Smith GE , Ivnik RJ , Boeve BF , Edland SD , Kokmen E , Tangalos EG , Petersen RC , Jack CR Jr ((2002) ) Comparative diagnostic utility of different MR modalities in mild cognitive impairment and Alzheimer’s disease. Dement Geriatr Cogn Disord 14: , 198–207. |
[28] | Kantarci K , Reynolds G , Petersen RC , Boeve BF , Knopman DS , Edland SD , Smith GE , Ivnik RJ , Tangalos EG , Jack CR Jr ((2003) ) Proton MR spectroscopy in mild cognitive impairment and Alzheimer disease: Comparison of 1.5 and 3 T. AJNR Am J Neuroradiol 24: , 843–849. |
[29] | Kantarci K , Petersen RC , Boeve BF , Knopman DS , Tang-Wai DF , O’Brien PC , Weigand SD , Edland SD , Smith GE , Ivnik RJ , Ferman TJ , Tangalos EG , Jack CR Jr ((2004) ) 1HMR spectroscopy in common dementias. Neurology 63: , 1393–1398. |
[30] | Modrego PJ , Fayed N , Pina MA ((2005) ) Conversion from mild cognitive impairment to probable Alzheimer’s disease predicted by brain magnetic resonance spectroscopy. Am J Psychiatry 162: , 667–675. |
[31] | Metastasio A , Rinaldi P , Tarducci R , Mariani E , Feliziani FT , Cherubini A , Pelliccioli GP , Gobbi G , Senin U , Mecocci P ((2006) ) Conversion of MCI to dementia: Role of proton magnetic resonancespectroscopy. Neurobiol Aging 27: , 926–932. |
[32] | Jessen F , Traeber F , Freymann K , Maier W , Schild HH , Block W ((2006) ) Treatment monitoring and response prediction withproton MR spectroscopy in AD. Neurology 67: , 528–530. |
[33] | Kantarci K ((2007) ) 1H magnetic resonance spectroscopy in dementia. Br J Radiol 80: , S146–S152. |
[34] | Kantarci K , Weigand SD , Petersen RC , Boeve BF , Knopman DS , Gunter J , Reyes D , Shiung M , O’Brien PC , Smith GE , Ivnik RJ , Tangalos EG , Jack CR Jr ((2007) ) Longitudinal 1H MRS changes in mild cognitive impairment and Alzheimer’s disease. Neurobiol Aging 28: , 1330–1339. |
[35] | Kantarci K , Knopman DS , Dickson DW , Parisi JE , Whitwell JL , Weigand SD , Josephs KA , Boeve BF , Petersen RC , Jack CR Jr ((2008) ) Alzheimer disease: Postmortem neuropathologic correlates of antemortem 1H MR spectroscopy metabolite measurements. Radiology 248: , 210–220. |
[36] | Kantarci K , Weigand SD , Przybelski SA , Shiung MM , Whitwell JL , Negash S , Knopman DS , Boeve BF , O’Brien PC , Petersen RC , Jack CR Jr ((2009) ) Risk of dementia in MCI: Combined effect of cerebrovascular disease, volumetric MRI, and 1H MRS. Neurology 72: , 1519–1525. |
[37] | Westman E , Wahlund LO , Foy C , Poppe M , Cooper A , Murphy D , Spenger C , Lovestone S , Simmons A ((2011) ) Magnetic resonance imaging andmagnetic resonance spectroscopy for detection of early Alzheimer’sdisease. J Alzheimers Dis 26: , 307–319. |
[38] | Modrego PJ , Fayed N ((2011) ) Longitudinal magnetic resonance spectroscopy as marker of cognitive deterioration in mild cognitive impairment. Am J Alzheimers Dis Other Demen 26: , 631–636. |
[39] | Watanabe T , Shiino A , Akiguchi I ((2010) ) Absolute quantification in proton magnetic resonance spectroscopy is useful to differentiate amnesic mild cognitive impairment from Alzheimer’s disease and healthy aging. Dement Geriatr Cogn Disord 30: , 71–77. |
[40] | Watanabe T , Shiino A , Akiguchi I ((2015) ) [Prediction of conversion from amnestic mild cognitive impairment to Alzheimer’s disease using proton magnetic resonance spectroscopy]. Rinsho Shinkeigaku 55: , 709–715. |
[41] | Kantarci K , Lowe V , Przybelski SA , Senjem ML , Weigand SD , Ivnik RJ , Roberts R , Geda YE , Boeve BF , Knopman DS , Petersen RC , Jack CR Jr ((2011) ) Magnetic resonance spectroscopy, β-amyloid load, and cognition in a population-based sample of cognitively normal older adults. Neurology 77: , 951–958. |
[42] | Kantarci K , Weigand SD , Przybelski SA , Preboske GM , Pankratz VS , Vemuri P , Senjem ML , Murphy MC , Gunter JL , Machulda MM , Ivnik RJ , Roberts RO , Boeve BF , Rocca WA , Knopman DS , Petersen RC , Jack CR Jr ((2013) ) MRI and MRS predictors of mild cognitive impairment in a population-based sample. Neurology 81: , 118–133. |
[43] | Wang H , Tan L , Wang HF , Liu Y , Yin RH , Wang WY , Chang XL , Jiang T , Yu JT ((2015) ) Magnetic resonance spectroscopy in Alzheimer’s disease: Systematic review and meta-analysis. J Alzheimers Dis 46: , 1049–1070. |
[44] | Godbolt AK , Waldman AD , MacManus DG , Schott JM , Frost C , Cipolotti L , Fox NC , Rossor MN ((2006) ) MRS shows abnormalities before symptoms in familial Alzheimer disease. Neurology 66: , 718–722. |
[45] | Kantarci K , Boeve BF , Wszolek ZK , Rademakers R , Whitwell JL , Baker MC , Senjem ML , Samikoglu AR , Knopman DS , Petersen RC , Jack CR Jr ((2010) ) MRS in presymptomatic MAPT mutation carriers: A potentialbiomarker for tau-mediated pathology. Neurology 75: , 771–778. |
[46] | Lin AL , Powell D , Caban-Holt A , Jicha G , Robertson W , Gold BT , Davis R , Abner E , Wilcock DM , Schmitt FA , Head E ((2016) ) (1) H-MRSmetabolites in adults with Down syndrome: Effects of dementia. Neuroimage Clin 11: , 728–735. |
[47] | Voevodskaya O , Sundgren PC , Strandberg O , Zetterberg H , Minthon L , Blennow K , Wahlund LO , Westman E , Hansson O ; Swedish BioFINDER study group ((2016) ) Myo-inositol changes precede amyloid pathology and relate to APOE genotype in Alzheimer disease. Neurology 86: , 1754–1761. |
[48] | Hixson JE , Vernier DT ((1990) ) Restriction isotyping of human apolipoprotein E by gene amplification and cleavage with HhaI. J Lipid Res 31: , 545–548. |
[49] | McKhann G , Drachman D , Folstein M , Katzman R , Price D , Stadlan EM ((1984) ) Clinical diagnosis of Alzheimer’s disease: Report of theNINCDS-ADRDA Work Group under the auspices of Department of Healthand Human Services Task Force on Alzheimer’s Disease. Neurology 34: , 939–944. |
[50] | McKeith IG , Dickson DW , Lowe J , Emre M , O’Brien JT , Feldman H , Cummings J , Duda JE , Lippa C , Perry EK , Aarsland D , Arai H , Ballard CG , Boeve B , Burn DJ , Costa D , Del Ser T , Dubois B , Galasko D , Gauthier S , Goetz CG , Gomez-Tortosa E , Halliday G , Hansen LA , Hardy J , Iwatsubo T , Kalaria RN , Kaufer D , Kenny RA , Korczyn A , Kosaka K , Lee VM , Lees A , Litvan I , Londos E , Lopez OL , Minoshima S , Mizuno Y , Molina JA , Mukaetova-Ladinska EB , Pasquier F , Perry RH , Schulz JB , Trojanowski JQ , Yamada M ((2005) ) Consortium on DLB. Diagnosis and management of dementia with Lewy bodies: Third report of the DLB Consortium. Neurology 65: , 1863–1872. |
[51] | McKhann GM , Knopman DS , Chertkow H , Hyman BT , Jack CR Jr , Kawas CH , Klunk WE , Koroshetz WJ , Manly JJ , Mayeux R , Mohs RC , Morris JC , Rossor MN , Scheltens P , Carrillo MC , Thies B , Weintraub S , Phelps CH ((2011) ) The diagnosis of dementia due to Alzheimer’s disease: Recommendations from the National Institute on Aging-Alzheimer’s Association workgroups on diagnostic guidelines for Alzheimer’s disease. Alzheimers Dement 7: , 263–269. |
[52] | Petersen RC , Smith GE , Waring SC , Ivnik RJ , Tangalos EG , Kokmen E ((1999) ) Mild cognitive impairment: Clinical characterization and outcome. Arch Neurol 56: , 303–308. |
[53] | Petersen RC ((2004) ) Mild cognitive impairment as a diagnostic entity. J Intern Med 256: , 183–194. |
[54] | Yoshita M , Taki J , Yokoyama K , Noguchi-Shinohara M , Matsumoto Y , Nakajima K , Yamada M ((2006) ) Value of 123I-MIBG radioactivity in the differential diagnosis of DLB from AD. Neurology 66: , 1850–1854. |
[55] | Buckner RL , Andrews-Hanna JR , Schacter DL ((2008) ) “The brain’s default network: Anatomy, function, and relevance to disease”. Ann N Y Acad Sci 1124: , 1–38. |
[56] | Leech R , Braga R , Sharp DJ ((2013) ) Echoes of the brain within theposterior cingulate cortex. J Neurosci 32: , 215–222. |
[57] | Leech R , Sharp DJ ((2014) ) The role of the posterior cingulate cortex in cognition and disease. Brain 137: , 12–32. |
[58] | Chang YT , Huang CW , Chang YH , Chen NC , Lin KJ , Yan TC , Chang WN , Chen SF , Lui CC , Lin PH , Chang CC ((2015) ) Amyloid burden in the hippocampus and default mode network: Relationships with gray matter volume and cognitive performance in mild stage Alzheimer disease. Medicine (Baltimore) 94: , e763. |
[59] | Waragai M , Yamada T , Matsuda H ((2007) ) Evaluation of brain perfusion SPECT using an easy Z-score imaging system (eZIS) as an adjunct to early-diagnosis of neurodegenerative diseases. J Neurol Sci 260: , 57–64. |
[60] | Edison P , Rowe CC , Rinne JO , Ng S , Ahmed I , Kemppainen N , Villemagne VL , O’Keefe G , Någren K , Chaudhury KR , Masters CL , Brooks DJ ((2008) ) Amyloid load in Parkinson’s disease dementia and Lewy body dementia measured with [11C] PIB positron emission tomography. J Neurol Neurosurg Psychiatry 79: , 1331–1338. |
[61] | Kantarci K , Lowe VJ , Boeve BF , Weigand SD , Senjem ML , Przybelski SA , Dickson DW , Parisi JE , Knopman DS , Smith GE , Ferman TJ , Petersen RC , Jack CR Jr ((2012) ) Multimodality imaging characteristics of dementiawith Lewy bodies. Neurobiol Aging 33: , 2091–2105. |
[62] | Ishii K , Hosokawa C , Hyodo T , Sakaguchi K , Usami K , Shimamoto K , Hosono M , Yamazoe Y , Murakami T ((2015) ) Regional glucose metabolic reduction in dementia with Lewy bodies is independent of amyloid deposition. Ann Nucl Med 29: , 78–83. |


