
Copy Number Variants in Alzheimer’s Disease
Abstract
Alzheimer’s disease (AD) is a devastating disease mainly afflicting elderly people, characterized by decreased cognition, loss of memory, and eventually death. Although risk and deterministic genes are known, major genetics research programs are underway to gain further insights into the inheritance of AD. In the last years, in particular, new developments in genome-wide scanning methodologies have enabled the association of a number of previously uncharacterized copy number variants (CNVs, gain or loss of DNA) in AD. Because of the exceedingly large number of studies performed, it has become difficult for geneticists as well as clinicians to systematically follow, evaluate, and interpret the growing number of (sometime conflicting) CNVs implicated in AD. In this review, after a brief introduction of this type of structural variation, and a description of available databases, computational analyses, and technologies involved, we provide a systematic review of all published data showing statistical and scientific significance of pathogenic CNVs and discuss the role they might play in AD.
INTRODUCTION
Alzheimer’s disease (AD) is the most common form of dementia affecting between 24 to 35 million people worldwide [1] and mainly afflicting elderly people. It is a devastating disease characterized by decreased cognition, loss of memory, and lastly death. Cholinergic neurons, particularly those of the cortical and subcortical areas, including hippocampal areas, are the most affected by this disease process. Since the hippocampus plays a key role in learning processes and memory, neurodegeneration in this area is considered the main cause of memory loss.
Neuropathologically, AD is mainly characterized by the presence of abnormal aggregates of amyloid-β (Aβ) peptide in the form of extracellular senile plaques and hyperphosphorylated tau protein in the form of intracellular neurofibrillary tangles (NFTs), microvascular damage, including vascular amyloid deposits, and pronounced inflammation of the affected brain regions. AD is often anticipated by mild cognitive impairment (MCI), a clinical condition characterized by cognitive deficit. It is estimated that the progression from MCI to AD occurs approximately in 10–15% of patients [2].
The disease can be classified into two types, depending on the age of onset: early-onset (EOAD) that occurs before 65 years of age and accounts for less than 5% of all cases [3], and late-onset (LOAD, >65 years) which is the most common form. AD is highly heritable, with heritability estimates ranging from 58 to 79% [4]. Having a family history is the second greatest risk factor for the disease and this occurs both in EOAD and in LOAD.
In about 13% of EOAD familial patients, the disease is inherited in an autosomal dominant manner with full penetrance (at least three cases in three generations) [5] and is caused by mutations in three genes, APP (amyloid precursor protein, chr.21q21) [6], PSEN1 (presenilin-1, chr.14q24) [7], and PSEN2 (presenilin-2, chr.1q42) [8]. The APP gene encodes the transmembrane protein AβPP that can be cleaved by different cellular proteases: α-, β-, and γ-secretases. PSEN1 and PSEN2 encode essential components of the γ-secretase complex.
Overall, the Mendelian form of the disease is very rare and occurs in a small percentage of AD patients (<1%). The majority of cases probably result from a combination of non-genetic factors and genetic susceptibilities. No causative genes have been identified for LOAD, which appear to be heterogeneous and multifactorial. The greatest known risk factor is aging. Other potential non-genetic risk factors include sex, trauma brain injury, diabetes mellitus, cigarette smoking, and alcohol consumption. Epigenetic mechanisms, such as abnormal DNA methylation and histone modification, can also modulate AD risk.
The main gene involved in AD susceptibility is APOE on chromosome 19q13.2 encoding the protein APOE which is found in senile plaques, cerebral vessels, and NFTs in AD brains [9]. APOE influences the formation of neuritic plaques in mouse models [10] and binds Aβ in vitro [11]. The APOEɛ4 allele is the strongest genetic risk factor for LOAD in a gene dose-dependent manner [12], as confirmed by several genome wide-association studies (GWAS) (for a meta-analysis see Lambert et al. [13]), and is also associated with an earlier age of onset of the disease [14]. However, this polymorphism accounts for less than half the genetic variance in AD risk, and the presence of the ɛ4 allele is neither necessary nor sufficient by itself for the development of the disease. This evidence strongly suggests the existence of additional genetic risk factors as supported by several recent large GWAS (also see http://www.alzgene.org/, for a complete list of the candidate genes). Several reviews of the genetics of AD are available [15–18].
Taken together, the previously discussed findings account only for a fraction of the estimated heritability. Recent studies have found that duplications or deletions of DNA fragments, known as copy number variants (CNVs), may play a role in missing heritability. CNVs cause both normal and pathogenic genetic variation [19], modulate gene expression, change gene structure, and promote significant phenotypic variations [20]. Moreover, some CNVs, encompassing genes encoding drug-metabolizing enzymes, cause different responses to certain drugs [21].
This review aims to analyze the currently available literature on CNVs in AD in order to provide a better understanding of the role CNVs may play in this pathology.
COPY NUMBER VARIANTS
CNVs are DNA segments that vary from one kilobase (kb) to several megabases (Mb) and present variable copy number in comparison with a reference genome [22]. They include deletions or duplications of DNA (Fig. 1) and represent the most prevailing types of structural variations in the human genome [23]. Deletions concerning certain categories of genes, such as dosage-sensitive genes, are under-represented in CNV regions and could undergo negative selection [24], while duplications are less likely to be pathogenic and are often under positive selection, which favors the evolution of many gene families like those encoding immunoglobulins, globins, and olfactory receptors [25, 26].
CNVs may involve one or more genes and are distributed in a non-uniform manner; in fact, they are found mainly toward centromeres and telomeres [26], probably because these genomic regions have a repetitive nature. CNVs are related to the presence of exons, segmental duplications [27] also called low copy repeats (LCRs), microRNAs [28], and repetitive elements such as Alu sequences.
CNVs constitute approximately 12% of the human genome [27] and are responsible for an important proportion of normal phenotypic variation [29]. They are divided into two main groups: recurrent CNVs and non-recurrent CNVs. Recurrent CNVs are probably due to homologous recombination between repeated sequences during meiosis; non-recurrent CNVs instead are often caused by non-homologous mechanisms that happen throughout the genome and occur at sites of homology of 2 to 15 base pairs [30]. These errors can be either simple where a segment of DNA is cut from its original position and the ends are joined, or complex if a deletion is followed by an insertion or a duplication of DNAat breakpoints.
CNVs can be large or small: the first ones are often found in regions containing large homologous repeats or segmental duplications while small CNVs may due to non-homology driven mutational mechanisms. CNVs can affect gene expression and induce phenotypic variation by altering genome organization itself and gene dosage [31]. Therefore, they can also influence the susceptibility of an individual to disease and drug response [32].
In the human genome, CNVs are also classified as benign CNV (normal genomic variant), likely benign CNV, variant of uncertain significance (VOUS), CNV of possible clinical relevance (high-susceptibility locus/risk factor/likely pathogenic variant), and clinically relevant CNV (pathogenic variant) [33]. CNVs can be familial or de novo, with de novo mutation rate being higher than single base-pair mutation rate [34] and contributing to the development of sporadic genomic disorders [35]. CNVs are often associated with several complex and common disorders including nervous system disorders. Indeed, several studies have shown that susceptibility to late-onset complex disease such as amyotrophic lateral sclerosis, Parkinson’s disease, and AD is linked to thepresence of CNVs that also increase the risk for other diseases such as schizophrenia, autism, and mental retardation [36].
METHODS FOR CNVs ANALYSIS
Methods for CNVs analysis include CNV detection, CNV genotyping, and CNV association analysis. CNV detection and genotyping is performed by a mix of biological and data analysis tools, while CNV association analysis can be done by data analysis methods, algorithms, and software. We describe methods for CNV detection and genotyping first, and CNV association analysis afterwards.
Methods for CNV detection and genotyping
CNV detection concerns the identification of CNV loci by comparing multiple genomes. CNV genotyping focuses on uncovering the variations of an individual, usually by comparing it to a reference genome. The most common methods for CNV detection and genotyping can be classified in four main groups, which are based on comparative genomic hybridization (CGH) [37], single nucleotide polymorphism (SNP) genotyping [38], next generation sequencing, and quantitative PCR, respectively. Next we discuss each of these categories of methods in detail.
CGH-based methods
Array comparative genomic hybridization (aCGH) [37] represents one of the most used methods, although it has recently been superseded by methods based on SNP-arrays. It is based on the quantitative comparison of differentially labeled test and normal reference DNAs, which are co-hybridized to an array (Fig. 2). The fluorescence intensity ratio obtained on each spot provides a locus-by-locus measure of DNA copy number changes. This technique is able to analyze the whole genome in a single test but its resolution is low [39].
Several types of DNA sequences are used to construct arrays. They include bacterial artificial chromosomes (BACs) (40–200 kb in size), small insert clones (1.5–4.5 kb), cDNA clones (0.5–2 kb), genomic PCR products (100 bp–1.5 kb), and oligonucleotides (25–80 bp). Although arrays that use BAC clones provide the most comprehensive coverage of the genome, they cannot identify CNVs smaller than 50 kb. Higher-resolution analysis can be obtained by spotting shorter DNA molecules on the array.
Recent high-throughput techniques for identifying CNVs use CGH arrays with a high number (hundreds of thousands or millions) of probes that cover a large part of the genome [40]. A CNV is recognized when a significant variation with respect to a reference genome is identified on a number (typically more than 5–10) of consecutive probes. A limit of this method is the low resolution (typically fives to tens of kilobases).
SNP-based methods
Methods based on SNP-arrays use probabilistic models to infer CNVs from SNP array data and other available information, such as SNP population allele frequencies, distance between adjacent SNPs, and information from related family members, when available. These methods perform higher resolution (in the order of kilobases) than CGH-based methods.
SNP-arrays are used to evaluate the intensity of the hybridization signal of genomic DNA with the average value of control DNA. In contrast with aCGH, SNP arrays are designed for genotyping and use single-source hybridization instead of competitive hybridization [41]. Both CGH and SNP arrays are able to detect submicroscopic CNVs that are not recognized by the routine karyotype analyses.
There are several algorithms and tools available for inferring CNVs from SNP data [42]. The most known are PennCNV [43], QuantiSNP [44], iPattern [45], and some proprietary software (e.g., CNVpartition, implemented in Illumina BeadStudio, and Affymetrix Genotyping Console). PennCNV is an algorithm based on Hidden Markov Models widely used to detect CNVs with high resolution using the Illumina Infinium assay platform, and can be adapted to other platforms (e.g., Affymetrix SNP array). QuantiSNP [44], used to identify chromosome aberrations, is an algorithm that obtains high-resolution CNV/aneuploidy detection and improves the accuracy of segmental aneuploidy identification. QuantiSNP can perform joint inference across samples to improve resolution in locating CNV boundaries. iPattern shows a better reproducibility in breakpoint estimation for common CNVs by performing clustering across samples [43].
NGS-based methods
In the last years, NGS techniques for high resolution (<10 kb) CNVs detection have become popular [46]. The development of NGS platforms, such as Illumina [47], the SOLiD system from Applied Biosystems [48], and Roche 454 Life Sciences [49], has facilitated CNVs detection. One of the main advantages of these techniques is that they are able to identify CNV breakpoints at specific base pair resolution. Unlike array-based platforms, NGS-based methods are able to detect smaller structural variations (in the range of 10 to 2,000 bp), inversions, intrachromosomal translocation, and de novo CNVs. The main categories of NGS based CNV detection methods are pair-end mapping (PEM) and depth of coverage (DOC)-based method [50]. PEM-based methods detect balanced structural variations such as inversions and small CNVs, while DOC methods are the most commonly used by CNV detection tools. The main advantage of NGS is the capacity to sequence many reads in a single run at an inexpensive cost if compared with traditional Sanger sequencing [51]. In relation to CNVs detection, advantages are higher coverage and resolution, more accurate estimation of copy numbers, widest range of detection of breakpoints, higher capability to identify new CNVs [52, 53]. Major NGS platforms for DNA-sequencing can be categorized in whole-genome sequencing (WGS) and whole-exome sequencing (WES). WGS can define the full spectrum of variants in the whole genome, while WES techniques focus on coding regions of the genome with high coverage [54].
WES is employed to identify genes associated with Mendelian diseases including AD [55, 56] and is less costly since the exomes represent only about 1% of the genome [57], while WGS is preferred to identify the breakpoints in chromosome translocations and inversions [58].
PCR-based techniques
Variation of specific genomic regions can be performed by quantitative PCR (qPCR) [59], which allows the user to monitor the amplification in “real-time” as an increase of PCR products is highlighted by an increase in fluorescence. qPCR enables the identification of individual deletions or duplications and is a valid tool in large-scale association studies. Other advantages of this technique are the short time (few hours) required from sample preparation to get the results, the small DNA quantities needed for high throughput, and the low cost per sample. On the other hand, it is not suitable for detecting CNVs simultaneously in different genome regions. For this purpose the following alternative methods are used: multiplex amplifiable probe hybridization (MAPH) [39], multiplex ligation-dependent probe amplification (MLPA), quantitative multiplex PCR of short fluorescent fragments (QMPSF), and multiplex amplicon quantification (MAQ) [60]. However they can target a limited number of regions simultaneously, and hence they cannot be employed for genome-wide CNV studies.
In MAPH, multiple loci can be detected together by using sets of different probes flanked by the same primer binding sites [39]. The test DNA is firstdenatured and bound to a nylon filter and then hybridized with specific probes of different length. These probes have identical tail sequences and can be amplified with universal primers. After amplification, the products are separated according to size and quantified by comparing the fluorescence with that of control regions.
MLPA is performed in solution [61]. Pairs of probe are designed to hybridize adjacent areas and a contiguous probe molecule is created. The resulting products can be separated and quantified as in MAPH. This technique allows the use of up to 40 probes in one experiment and, as with MAPH, the probes can be used to screen large cohorts of samples [62]. In comparison, MAPH and MLPA have different advantages and disadvantages [63]. The generation of probes is simpler for MAPH than MLPA but MAPH has a higher contamination risk. Throughput is higher for MLPA. MAPH requires 1 μg of DNA while MLPA requires 100–200 ng to obtain reproducibleresults [63].
QMPSF is a method in which short genomic sequences are simultaneously amplified using dye-labeled primers [64]. The fragments obtained after PCR are separated by capillary electrophoresis. Peak areas of patients and controls are compared and variations in the peak areas are evaluated.
The copy number status can be also determined using MAQ, able to determine the copy number status of multiple loci in a single assay [65]. This technique quantifies fluorescently labeled test and control amplicons, obtained by a single multiplex PCR amplification and separated on a capillary sequencer. The comparison of normalized peak areas between the target amplicons and the control amplicons results in a dosage quotient that indicates the copy number of the CNV in the test sample.
Summary of methods for CNVs analysis
A comparison among the various methods for CNVs identification and genotyping is reported in Table 1. An exhaustive discussion of advantages and disadvantages of each method can be found in Cantsilieris et al. [66]. In general, SNP-array-based methods and aCGH are more convenient for identification of CNVs in the whole genome. They have similar characteristics but SNP-array-based methods perform a slightly higher resolution. NGS methods have higher resolution but they are generally more expensive, require more time (2-3 days) for getting results, and have a low/moderate throughput compared to array-based methods. PCR-based methods have the highest resolution, but they have limited applicability since they can target single locus or a small number of loci.
With the exception of NGS, the discussed methods are mainly quantitative, i.e., they are able to identify if variations in the copy number occur (with some likelihood), but not the exact number of copies. This is often satisfactory, although sometimes a more accurate analysis is needed. In this case, NGS-based methods are better choices.
Methods for CNV association analysis
The software most widely used in the analysis of association studies (including CNVs and AD) is PLINK [67] a free, open-source toolset, which performs various types of analyses, including statistics for quality control, population stratification detection, and case/control association testing. It also includes specific analysis tools for CNV analysis. Other software tools include EIGENSTRAT (http://genepath.med.harvard.edu/~reich/EIGENSTRAT.htm), for detecting and correcting for population stratification in GWAS, and the SNP & Variation Suite of GoldenHelix (http://goldenhelix.com/), which contains analytic tools that perform quality-assurance and statistical tests for genetic association studies. Some studies implement their own software by using statistical tools, including ANCOVA [68] and PCA [69] for multivariate analysis, and Bonferroni [70] for multiple testing correction.
DATABASES OF CNVs
Generally, for the analysis of CNVs, the following categories of databases are used: “in-house”, “theme”, and “data aggregators” [33]. “In-house” databases are used to analyze the cases treated by each laboratory itself; “theme” databases refer to CNVs related to particular control populations; “data aggregators” integrate collections of data from different sources.
Several public Internet databases can be used for array data interpretation. The human CNVs are mostly catalogued in the Database of Genomic Variants (DGV) (http://projects.tcag.ca/variation/). DGV was created in 2004 and provides a useful catalogue of control data for studies aiming at correlating genomic variations with phenotypic data. It is freely accessible and is continuously updated with new high quality data, including samples analyzed in different studies. DGV contains a summary of genomic alterations involving segments greater than 50 bp and less than 3 Mb. A new version of DGV in which the majority of CNVs were detected by NGS platforms and methods has been recently developed. Zarrei et al. [71] considered recent high-resolution studies that maximize sensitivity and minimize false discoveries. In the new version, uncertain results from previous studies have been removed. They include CNVs detected from platforms such as BAC array, which overestimate the breakpoints [72], have low resolution, and miss many small variants. Some individual CNVs were removed since previous studies had stated that they were very rare or due to false discoveries. In the new DGV version, Zarrei et al. have also combined the variants of different studies in merged CNVRs (copy number variation regions) and used a CNVR-clusteringalgorithm to identify groups of variants that have at least 50% of reciprocal overlaps [40].
Other databases available are: Database of Chromosomal Imbalance and Phenotype in Humansusing Ensembl Resources (DECIPHER) (http://decipher.sanger.ac.uk/), European Cytogeneticists Association Register of Unbalanced Chromosome Aberrations (ECARUCA) (http://www.ecaruca.net), and International Standards for Cytogenomic Arrays (ISCA) (http://www.iscaconsortium.org). DECIPHER provides information on chromosomal microdeletions and duplications and facilitates the search for genes that influence human development and health. ECARUCA collects cytogenetic and clinical data on rare chromosome disorders. ISCA contains whole genome array data from a subset of clinical diagnostic laboratories.
Other tools are often adopted for obtaining information related to genes included in detected CNVs. Diagnostic laboratories primarily use UCSC Genome Browser (http://genome.ucsc.edu/) since it enables connection to various databases described above [73]. To improve the classification of CNVs, analytical tools are employed. One of the most common is Genomic Classification of CNVs Objectively (GECCO) (http://sourceforge.net/projects/genomegecco/) that includes functionalities for analyzing genomic characteristics as repetitive elements inside CNVs and aids in confirming the pathogenicity of de novo CNVs.
CNVs AND ALZHEIMER’S DISEASE
Several authors have performed studies to identify the potential role of CNVs in the genetic basis of AD. Most of them focused on CNVs longer than 100 kb. Table 2 lists all the genes reported in the studies reviewed, excluding those whose association with the disease was not found significant (p-value >0.05) in GWAS and summarizes the data obtained by the authors.
Based on encompassed genes, CNVs can be classified into different types: CNVs causing Mendelian EOAD; CNVs in high risk AD groups; CNVs in known AD risk genes; and CNVs in genome-wide studies. We discuss each of these types separately.
CNVs causing Mendelian EOAD
To date, duplications in the APP gene are the only pathogenic CNVs found in EOAD families with autosomal dominant transmission. Since the first report [74], this variation has been found almost exclusively in affected subjects (http://www.molgen.ua.ac.be/ADMutations/) and its frequency has been estimated to be 8% in the Mendelian families [74]. A recent study has suggested a limited contribution of APP duplication in familial EOAD and extremely rare in LOAD [75]. These findings have been confirmed by Chapman et al. [76] who found only one event over 3,260 AD patients (average age at onset = 72.91, SD = 8.49) and no events in 1,290controls.
Two different small deletions (<10 kb) of exon 9 of another Mendelian gene, PSEN1, firstly identified by Crook et al. [77] and Smith et al. [78], have been found in some patients with familialEOAD.
CNVs in high risk AD groups
Two studies were performed on EOAD patients for whom mutations in the known genes had been excluded. Rovelet-Lecrux et al. [79] assessed the presence of rare CNVs in familial and sporadic EO patients. The genome-wide study detected seven CNVs encompassing some genes, four of which encoding proteins involved in Aβ peptide metabolism or signaling: KLK6, SLC30A3, MEOX2, FPR2. KLK6 (kallicrein related peptidase 6, chr. 19q13) encodes neurosin, localized in senile plaques and NFTs of AD brains. SLC30A3 (solute carrier family 30 member 3, chr 2p23) encodes the ZnT3 synaptic vesicle zinc transporter. Zn2+ promotes Aβ aggregation in senile plaques or in cerebral amyloid angiopathy. MEOX2 (mesenchyme homeobox 2, chr 7p21) encodes a regulator of vascular differentiation whose expression is low in AD. FPR2 (formyl peptide receptor 2, chr19q13) encodes for a receptor used by Aβ42 to chemoattract and activate mononuclear phagocytic cells.
Hooli et al. [80] conducted a genome-wide CNV study on EO familial AD and early/mixed-onset pedigrees and found 12 novel CNV regions co-segregating with the disease within families. The genes involved (see Table 2) take part into neuronal pathways crucial to brain functioning. In addition, they also detected CNVs encompassing known frontotemporal lobar dementia genes: CHMP2B (charged multivesicular body protein 2B, chr.3p11.2) and MAPT (microtubule associated protein tau, chr.17q21.1).
Altogether, these findings support a possible causal role of some genes in addition to those already known.
CNVs in known AD risk genes
Some authors found CNVs associated to AD in genes previously identified as risk genes for AD in GWA studies (http://www.alzgene.org/). Brouwers et al. [60] evaluated a common LCR-associated CNV in the CR1 gene (complement receptor 1, chr. 1q32) and found that carriers of three LCR1 copies have an increased risk for developing AD compared with individuals with two copies. They also confirmed that LCR1 CNV dosage correlates with the different isoforms (mainly CR1-F and CR1-S) produced by the gene. This study was performed in a Flanders-Belgian cohort and replicated in a French cohort. Chapman et al. [76] identified duplications, that may be pathogenic overlapping CR1 in two patients from a large association study of the Genetic and Environmental Risk for Alzheimer’s disease Consortium (GERAD). On the contrary, Szigeti et al. [69], who analyzed 375 AD patients and 180 controls from the Texas Alzheimer Research and Care Consortium (TARCC), found rare CNVs overlapping BIN1 (bridging integrator 1, chr. 2q14) and the LCR region of CR1 with opposite dosage in cases and controls.
Swaminathan et al. analyzed the role of CNVs in AD and MCI using data from non-Hispanic Caucasian participants in the Alzheimer’s Disease Neuroimaging Initiative (ADNI) [81–83] and the National Institute of Aging-LOAD/National Cell Repository for AD (NIA-LOAD/NCRAD Family Study) [82]. In addition, they also used samples from the Translational Genomics Reasearch Institute (TGen) [83]. They examined a set of candidate genes previously related to AD and identified from the AlzGene database. They detected in two patients a CNV in another known AD risk gene, PICALM (phosphatidylinositol binding clathrin assembly protein, chr. 11q14). Furthermore, they found that the genes RELN (reelin, chr. 7q22), and DOPEY2 (dopey family member 2, chr. 21q22.2) were overlapped by CNVs only in cases (AD and/or MCI) and not in controls in the three studies.
CNVs in genome-wide studies
A number of potentially interesting gene regions have been identified by means of CNV GWAS.
Among the CNVs found in their case-control studies using ADNI participants, Swaminathan et al. [81, 82] analyzed only those present in cases (AD and/or MCI) but not controls (Table 2). However, the data obtained were not significant after correction for multiple testing. In a third study, Swaminathan et al. [83] analyzed TGen and ADNI cohorts and selected a number of genes overlapped by CNVs in at least four cases but not in controls. Among them, only the HLA-DRA (major histocompatibility complex, class II, DR alpha chr.6p21.3) gene showed a significant association with the disease (uncorrected p = 0.0144). Deletions and duplications in the fusion gene CHRFAM7A (CHRNA7 - cholinergic receptor, nicotinic, alpha 7, exons 5–10, chr.15q13.3 - and FAM7A - family with sequence similarity 7A, exon A-E fusion, chr.15q13.1) were found both in cases and in controls (corrected p = 0.0198). A meta-analysis performed for this gene in the same paper, using the findings from the three studies [81–83], revealed a significant association with AD and /or MCI risk (p = 0.006).
Swaminathan et al. [82] also found two AD participants having a CNV > 2 Mb. The first AD participant had a 2.4 Mb deletion on chromosome 11 that overlapped some member of the olfactory receptor genes, a multigene family involved in odorant discrimination [84]. The second AD participant had a 3.2 Mb duplication on chromosome 3 including the GBE1 (glucan (1,4-alpha-), branching enzyme 1,chr.3p12.3) gene. This gene encodes a protein involved in glycogen biosynthesis and it has not been previously associated with AD susceptibility.
A study performed by Ghani et al. [42], in a dataset of AD patients and normal controls of Caribbean Hispanic origin, identified a duplication on chromosome 15q11.2 encompassing up to five genes on chr.15q11.2: TUBGCP5, CYFIP1, NIPA2, NIPA1, and WHAMML1. This duplication showed association with the disease (uncorrected p = 0.037). CYFIP1 and NIPA1 may be important in neurological development [85]. NIPA1 encodes a magnesium transporter associated with early endosomes in neuronal and epithelial cells [86] while CYFIP1 forms a complex at synapses with the fragile X mental retardation protein (FMRP) and eIF4E (FMRP-CYFIP1-eIF4E complex) is involved in synaptic stimulation [87]. In this study a number of rare CNVs were also detected. Furthermore, these authors did not replicate the borderline association (uncorrected p = 0.053) reported by Heinzen et al. [70] between a duplication on chromosome 15q13.3 affecting the CHRNA7 locusand AD.
Chapman et al. [76] carried out a large CNV genome-wide association study on AD patients and normal controls coming from European countries and from USA. They investigated the loci which had been previously highlighted in other smaller studies [70, 81, 82, 42] but they failed to replicate any findings. They only found an excess of CNVs in AD samples in the 15q11.2 region identified by Ghani et al., but this excess was not significant. The lack of significance might depend on the rarity of the involved CNVs, which are observed in a small number of cases, insufficient to establish statistical significance.
Some authors have focused on CNV-Regions (CNVRs), which are union of CNVs that may affect the same biological function. Using gene expression data from pathologically ascertained AD cases, Li et al. [68] identified the following five genes which were both differentially expressed between cases and controls and had over 50% of the variance explained by the cis-CNVstate: ARL17P1 (ADP-ribosylation factor-like 17A, chr.17p21.31), CREB1 (cAMP responsive element binding protein 1, chr.2q34), FAM119A, also known as METTL21A (methyltransferase like 21A, chr.2q33.3), NBPF10 (neuroblastoma breakpoint family, member 10, chr.1q21.1), and SDF4 (stromal cell derived factor 4, chr.1p36.33). The authors identified an 8-kb deletion containing a PAX6-binding site on chr2q33.3 upstream of CREB1, which could explain the altered gene expression. They also performed a case–control study on 1,230 AD subjects and 936 normal controls to test the association of the probes with AD. After multiple testing correction, the 8-kb deletion was found significantly associated with the disease (p = 0.008). It is noteworthy that disruption of CREB1, encoding for a transcription factor, causes neurodegeneration in hippocampus in a mouse model [88]. The potential role in AD of FAM119A, adjacent to CREB1, cannot be excluded.
Guffanti et al. [89] analyzed the distribution of CNVs in ADNI samples that includes 146 AD cases, 313 MCI cases, and 181 controls genotyped using the Human-610 Quad BeadChip. They found large heterozygous deletions in cases (p < 0.0001) and identified 44 copy number variable loci. The number of AD and/or MCI subjects with more than one CNVR deletion was significantly greater in cases than in controls (p = 0.005). Seven out of 44 CNVRs were significantly associated to AD and/or MCI (p-value<0.05). These deletions were present in AD and MCI cases and only in one control.
A duplication and a deletion were found respectively in the 16p13.11 and 17p12 regions in two AD patients [82]. These variants have previously been associated with schizophrenia [90, 91], but notwith AD.
Szigeti et al. [69] in the genome-wide study performed on TARCC participants, also carried out a cases-only analysis to test the CNV association with age at onset (AAO) of AD. The authors confirmed their previously reported chromosome 14 olfactory receptor cluster association with AAO of AD (uncorrected p = 0.03) [92] and identified five CNV regions, with size ranging from 3.6 kb to 24.8 kb suggesting that small and rare events could contribute to the heritability of AAO of AD. They also attempted to replicate these results by analyzing the NIA-LOAD Familial Study dataset probands but failed to reach their goal because of the limited availability of probes in the regions of interest in the platform used. The CNV regions identified by this study overlap with BIN1 (bridging integrator 1, chr. 2q14), the LCR region of CR1 with opposite dosage in cases and controls and the gene CPNE4. However, their results are inconclusive since their findings are supported by CNVs reported in an old version of DGV, which have not been considered in the new version.
DISCUSSION
Several studies have highlighted the role of CNVs in the pathogenesis of neurological diseases. Presently, APP duplication is the only recognized CNV causing AD. Many CNVs have been found in patients but not in controls, or in both these groups; however, further investigations would be appropriate in order to verify their effective correlation with the pathology. The only significant results that survived correction for multiple testing included the CREB1, HLA-DRA, and CHRFAM7A genes, together with a duplication on chromosome 15q11.2 encompassing TUBGCP5, CYFIP1, NIPA2, NIPA1, and WHAMML1. Analysis of CNVRs identified seven of them that were significant for association with cognitive impairment. Deletions within these CNVRs encompass genes involved in biological pathways like axonal guidance, neuronal morphogenesis and differentiation.
In some cases, study findings are not concordant. These discrepancies may be due to different study design, different clinical ascertainment criteria, stringency of the quality control criteria used for sample selection, population origin, and small sample size. Some results might be biased due to batch effects [93], which occur because measurements are affected by laboratory conditions, reagent lots, and personnel differences. Batch effects can be critical in long studies since conditions might vary during thestudy.
Furthermore, it is important to note that sometimes a direct comparison of CNV calls from different studies is difficult if different genotyping platform are used because the location of the probes may not correspond.
Some criticism could be made of those studies that have used the same dataset (ADNI) [81–83, 89]. Replication in independent samples would be useful to overcome a possible circularity of the results previously obtained. It is noteworthy that results from GWAS should not be considered definitive. Indeed they often produce false associations because of multiple testing, and they cannot establish causality [94], but it can simultaneously exclude many true-positive loci. There is no widely recognized multiple-testing correction approach for CNV analysis, and standard thresholds for SNP GWAS are likely to be too stringent because of the strong dependency of overlapping regions in the search space. Correction for multiple testing can discard many false associations, but it can simultaneously exclude many true-positive loci. The conventional threshold of 5×10⁻⁸ for measuring significance in GWAS has been recently criticized [95] and is not applicable here since it has been designed mainly for SNPs (hundreds of thousands to millions tested in one experiment). Further work for designing suitable correction methods in genome-wide CNVs analysis is necessary.
In conclusion, the studies performed so far suggest a link between CNVs and AD but further investigations, involving also cytogenetic or molecular techniques, are needed to better understand the functional role of these chromosomal structural variations in the development of the disease.
ACKNOWLEDGMENTS
The authors gratefully acknowledge Cristina Calí, Alfia Corsino, Maria Patrizia D’Angelo, and Francesco Marino for their administrative and technical assistance. We thank Misael Mongioví for the fruitful discussions and for the feedback provided.
Authors’ disclosures available online (http://j-alz.com/manuscript-disclosures/16-0469r1).
REFERENCES
[1] | Querfurth HW , LaFerla FM ((2010) ) Alzheimer’s disease. N Engl J Med 362: , 329–344. |
[2] | Petersen RC , Roberts RO , Knopman DS , Boeve BF , Geda YE , Ivnik RJ , Smith GE , Jack CR ((2009) ) Mild cognitive impairment: Ten years later. Arch Neurol 66: , 1447–1455. |
[3] | Bertram L , Tanzi RE ((2005) ) The genetic epidemiology of neurodegenerative disease. J Clin Invest 115: , 1449–1457. |
[4] | Gatz M , Reynolds CA , Fratiglioni L , Johansson B , Mortimer JA , Berg S , Fiske A , Pedersen NL ((2006) ) Role of genes and environments for explaining Alzheimer disease. Arch Gen Psychiatry 63: , 168–174. |
[5] | Campion D , Dumanchin C , Hannequin D , Dubois B , Belliard S , Puel M , Thomas-Anterion C , Michon A , Martin C , Charbonnier F , Raux G , Camuzat A , Penet C , Mesnage V , Martinez M , Clerget-Darpoux F , Brice A , Frebourg T ((1999) ) Early-onset autosomal dominant Alzheimer disease: Prevalence, genetic heterogeneity, and mutation spectrum. Am J Hum Genet 65: , 664–670. |
[6] | Goate A , Chartier-Harlin MC , Mullan M , Brown J , Crawford F , Fidani L , Giuffra L , Haynes A , Irving N , James L ((1991) ) Segregation of a missense mutation in the amyloid precursor protein gene with familial Alzheimer’s disease. Nature 349: , 704–706. |
[7] | Sherrington R , Rogaev EI , Liang Y , Rogaeva EA , Levesque G , Ikeda M , Chi H , Lin C , Li G , Holman K , Tsuda T , Mar L , Foncin JF , Bruni AC , Montesi MP , Sorbi S , Rainero I , Pinessi L , Nee L , Chumakov I , Pollen D , Brookes A , Sanseau P , Polinsky RJ , Wasco W , Da Silva HA , Haines JL , Perkicak-Vance MA , Tanzi RE , Roses AD , Fraser PE , Rommens JM , St George-Hyslop PH ((1995) ) Cloning of a gene bearing missense mutations in early-onset familial Alzheimer’s disease. Nature 375: , 754–760. |
[8] | Levy-Lahad E , Wasco W , Poorkaj P , Romano DM , Oshima J , Pettingell WH , Yu CE , Jondro PD , Schmidt SD , Wang K et al. ((1995) ) Candidate gene for the chromosome 1 familial Alzheimer’s disease locus. Science 269: , 973–977. |
[9] | Namba Y , Tomonaga M , Kawasaki H , Otomo E , Ikeda K ((1991) ) Apolipoprotein E immunoreactivity in cerebral amyloid deposits and neurofibrillary tangles in Alzheimer’s disease and kuru plaque amyloid in Creutzfeldt-Jakob disease. Brain Res 541: , 163–166. |
[10] | Holtzman DM , Bales KR , Tenkova T , Fagan AM , Parsadanian M , Sartorius LJ , Mackey B , Olney J , McKeel D , Wozniak D , Paul SM ((2000) ) Apolipoprotein E isoform-dependent amyloid deposition and neuritic degeneration in a mouse model of Alzheimer’s disease. Proc Natl Acad Sci U S A 97: , 2892–2897. |
[11] | Strittmatter WJ , Weisgraber KH , Huang DY , Dong LM , Salvesen GS , Pericak-Vance M , Schmechel D , Saunders AM , Goldgaber D , Roses AD ((1993) ) Binding of human apolipoprotein E to synthetic amyloid beta peptide: Isoform-specific effects and implications for late-onset alzheimer disease. Proc Natl Acad Sci U S A 90: , 8098–8102. |
[12] | Corder E , Saunders A , Strittmatter W , Schmechel D , Gaskell P , Small G , Roses AD , Haines J , Pericak-Vance MA ((1993) ) Gene dose of apolipoprotein E type 4 allele and the risk of Alzheimer’s disease in late onset families. Science 261: , 921–923. |
[13] | Lambert J-C , Ibrahim-Verbaas CA , Harold D , Naj AC , Sims R , Bellenguez C , Jun G , DeStefano AL , Bis JC , Beecham GW ((2013) ) Meta-analysis of 74,046 individuals identifies 11 new susceptibility loci for Alzheimer’s disease. Nat Genet 45: , 1452–1458. |
[14] | Farrer LA , Cupples LA , Haines JL , Hyman B , Kukull WA , Mayeux R , Myers RH , Pericak-Vance MA , Risch N , van Duijn CM ((1997) ) Effects of age, sex, and ethnicity on the association between apolipoprotein E genotype and Alzheimer disease: a meta-analysis. JAMA 278: , 1349–1356. |
[15] | Van Cauwenberghe C , Van Broeckhoven C , Sleegers K ((2015) ) The genetic landscape of Alzheimer disease: Clinical implications and perspectives. Genet Med 18: , 421–430. |
[16] | Cacace R , Sleegers K , Van Broeckhoven C ((2016) ) Molecular genetics of early-onset alzheimer’s disease revisited. Alzheimers Dement 12: , 733–748. |
[17] | Bekris LM , Yu C-E , Bird TD , Tsuang DW ((2010) ) Review article: Genetics of Alzheimer disease. J Geriatr Psychiatry Neurol 23: , 213–227. |
[18] | Tanzi RE ((2012) ) The genetics of Alzheimer disease. Cold Spring Harb Perspect Med 2: , a006296. |
[19] | de Ståhl TD , Sandgren J , Piotrowski A , Nord H , Andersson R , Menzel U , Bogdan A , Thuresson AC , Poplawski A , von Tell D ((2008) ) Profiling of copy number variations (CNVs) in healthy individuals from three ethnic groups using a human genome 32 K BAC-clone-based array. Hum Mutat 29: , 398–408. |
[20] | Zhou J , Lemos B , Dopman EB , Hartl DL ((2011) ) Copy-number variation: The balance between gene dosage and expression in Drosophila melanogaster. Genome Biol Evol 3: , 1014–1024. |
[21] | de Smith AJ , Walters RG , Froguel P , Blakemore AI ((2008) ) Human genes involved in copy number variation: Mechanisms of origin, functional effects and implications for disease. Cytogenet Genome Res 123: , 17–26. |
[22] | Feuk L , Carson AR , Scherer SW ((2006) ) Structural variation in the human genome. Nat Rev Genet 7: , 85–97. |
[23] | Pang AW , MacDonald JR , Pinto D , Wei J , Rafiq MA , Conrad DF , Park H , Hurles ME , Lee C , Venter JC ((2010) ) Towards a comprehensive structural variation map of an individual human genome. Genome Biology 11: , 1. |
[24] | Schuster-Böckler B , Conrad D , Bateman a ((2010) ) Dosage sensitivity shapes the evolution of copy-number varied regions. PloS One 5: , e9474. |
[25] | Storz JF , Opazo JC , Hoffmann FG ((2013) ) Gene duplication, genome duplication, and the functional diversification of vertebrate globins. Mol Phylogenet Evol 66: , 469–478. |
[26] | Nguyen DQ , Webber C , Ponting CP ((2006) ) Bias of selection on human copy-number variants. PLoS Genet 2: , 198–207. |
[27] | Redon R , Ishikawa S , Fitch KR , Feuk L , Perry GH , Andrews TD , Fiegler H , Shapero MH , Carson AR , Chen W , Cho EK , Dallaire S , Freeman JL , González JR , Gratacòs M , Huang J , Kalaitzopoulos D , Komura D , MacDonald JR , Marshall CR , Mei R , Montgomery L , Nishimura K , Okamura K , Shen F , Somerville MJ , Tchinda J , Valsesia A , Woodwark C , Yang F , Zhang J , Zerjal T , Zhang J , Armengol L , Conrad DF , Estivill X , Tyler-Smith C , Carter NP , Aburatani H , Lee C , Jones KW , Scherer SW , Hurles ME ((2006) ) Global variation in copy number in the human genome. Nature 444: , 444–454. |
[28] | Marcinkowska M , Szymanski M , Krzyzosiak WJ , Kozlowski P ((2011) ) Copy number variation of microRNA genes in the human genome. BMC Genomics 12: , 183. |
[29] | Sudmant PH , Mallick S , Nelson BJ , Hormozdiari F , Krumm N , Huddleston J , Coe BP , Baker C , Nordenfelt S , Bamshad M ((2015) ) Global diversity, population stratification, and selection of human copy-number variation. Science 349: , aab3761. |
[30] | Hastings PJ , Lupski JR , Rosenberg SM , Ira G ((2009) ) Mechanisms of change in gene copy number. Nat Rev Genet 10: , 551–564. |
[31] | Stranger BE , Forrest MS , Dunning M , Ingle CE , Beazley C , Thorne N , Redon R , Bird CP , de Grassi A , Lee C , Tyler-Smith C , Carter N , Scherer SW , Tavaré S , Deloukas P , Hurles ME , Dermitzakis ET ((2007) ) Relative impact of nucleotide and copy number variation on gene expression phenotypes. Science 315: , 848–853. |
[32] | Shastry BS ((2009) ) Copy number variation and susceptibility to human disorders (Review). Mol Med Rep 2: , 143–147. |
[33] | de Leeuw N , Dijkhuizen T , Hehir-Kwa JY , Carter NP , Feuk L , Firth HV , Kuhn RM , Ledbetter DH , Martin CL , van Ravenswaaij CMA , Scherer SW , Shams S , Van Vooren S , Sijmons R , Swertz M , Hastings R ((2012) ) Diagnostic interpretation of array data using public databases and internet sources. Hum Mutat 33: , 930–940. |
[34] | Itsara A , Wu H , Smith JD , Nickerson DA , Romieu I , London SJ , Eichler EE ((2010) ) De novo rates and selection of large copy number variation. Genome Res 20: , 1469–1481. |
[35] | McCarroll SA , Altshuler DM ((2007) ) Copy-number variation and association studies of human disease. Nat Genet 39: , S37–S42. |
[36] | Blauw HM , Veldink JH , van Es MA , van Vught PW , Saris CGJ , van der Zwaag B , Franke L , Burbach JPH , Wokke JH , Ophoff RA , van den Berg LH ((2008) ) Copy-number variation in sporadic amyotrophic lateral sclerosis: a genome-wide screen. Lancet Neurol 7: , 319–326. |
[37] | Pinkel D , Segraves R , Sudar D , Clark S , Poole I , Kowbel D , Collins C , Kuo WL , Chen C , Zhai Y , Dairkee SH , Ljung BM , Gray JW , Albertson DG ((1998) ) High resolution analysis of DNA copy number variation using comparative genomic hybridization to microarrays. Nat Genet 20: , 207–211. |
[38] | Huang J , Wei W , Zhang J , Liu G , Bignell GR , Stratton MR , Futreal PA , Wooster R , Jones KW , Shapero MH ((2004) ) Whole genome DNA copy number changes identified by high density oligonucleotide arrays. Hum Genomics 1: , 1–. |
[39] | Armour JA , Sismani C , Patsalis PC , Cross G ((2000) ) Measurement of locus copy number by hybridisation with amplifiable probes. Nucleic Acids Res 28: , 605–609. |
[40] | Conrad DF , Pinto D , Redon R , Feuk L , Gokcumen O , Zhang Y , Aerts J , Andrews TD , Barnes C , Campbell P , Fitzgerald T , Hu M , Ihm CH , Kristiansson K , Macarthur DG , Macdonald JR , Onyiah I , Pang AW , Robson S , Stirrups K , Valsesia A , Walter K , Wei J , Wellcome Trust Case Control C, Tyler-Smith C , Carter NP , Lee C , Scherer SW , Hurles ME ((2010) ) Origins and functional impact of copy number variation in the human genome. Nature 464: , 704–712. |
[41] | Carson AR , Feuk L , Mohammed M , Scherer SW ((2006) ) Strategies for the detection of copy number and other structural variants in the human genome. Hum Genomics 2: , 403–414. |
[42] | Ghani M , Pinto D , Lee JH , Grinberg Y , Sato C , Moreno D , Scherer SW , Mayeux R , George-Hyslop St P , Rogaeva E ((2012) ) Genome-wide survey of large rare copy number variants in Alzheimer’s disease among Caribbean Hispanics. G3 (Bethesda) 2: , 71–78. |
[43] | Wang K , Li M , Hadley D , Liu R , Glessner J , Grant SF , Hakonarson H , Bucan M ((2007) ) PennCNV: An integrated hidden Markov model designed for high-resolution copy number variation detection in whole-genome SNP genotyping data. Genome Res 17: , 1665–1674. |
[44] | Colella S , Yau C , Taylor JM , Mirza G , Butler H , Clouston P , Bassett AS , Seller A , Holmes CC , Ragoussis J ((2007) ) QuantiSNP: An Objective Bayes Hidden-Markov Model to detect and accurately map copy number variation using SNP genotyping data. Nucleic Acids Res 35: , 2013–2025. |
[45] | Pinto D , Pagnamenta AT , Klei L , Anney R , Merico D , Regan R , Conroy J , Magalhaes TR , Correia C , Abrahams BS ((2010) ) Functional impact of global rare copy number variation in autism spectrum disorders. Nature 466: , 368–372. |
[46] | Korbel JO , Urban AE , Affourtit JP , Godwin B , Grubert F , Simons JF , Kim PM , Palejev D , Carriero NJ , Du L , Taillon BE , Chen Z , Tanzer A , Saunders AC , Chi J , Yang F , Carter NP , Hurles ME , Weissman SM , Harkins TT , Gerstein MB , Egholm M , Snyder M ((2007) ) Paired-end mapping reveals extensive structural variation in the human genome. Science 318: , 420–426. |
[47] | Bentley DR , Balasubramanian S , Swerdlow HP , Smith GP , Milton J , Brown CG , Hall KP , Evers DJ , Barnes CL , Bignell HR , Boutell JM , Bryant J , Carter RJ , Keira Cheetham R , Cox AJ , Ellis DJ , Flatbush MR , Gormley NA , Humphray SJ , Irving LJ , Karbelashvili MS , Kirk SM , Li H , Liu X , Maisinger KS , Murray LJ , Obradovic B , Ost T , Parkinson ML , Pratt MR , Rasolonjatovo IM , Reed MT , Rigatti R , Rodighiero C , Ross MT , Sabot A , Sankar SV , Scally A , Schroth GP , Smith ME , Smith VP , Spiridou A , Torrance PE , Tzonev SS , Vermaas EH , Walter K , Wu X , Zhang L , Alam MD , Anastasi C , Aniebo IC , Bailey DM , Bancarz IR , Banerjee S , Barbour SG , Baybayan PA , Benoit VA , Benson KF , Bevis C , Black PJ , Boodhun A , Brennan JS , Bridgham JA , Brown RC , Brown AA , Buermann DH , Bundu AA , Burrows JC , Carter NP , Castillo N , Chiara ECM , Chang S , Neil Cooley R , Crake NR , Dada OO , Diakoumakos KD , Dominguez-Fernandez B , Earnshaw DJ , Egbujor UC , Elmore DW , Etchin SS , Ewan MR , Fedurco M , Fraser LJ , Fuentes Fajardo KV , Scott Furey W , George D , Gietzen KJ , Goddard CP , Golda GS , Granieri PA , Green DE , Gustafson DL , Hansen NF , Harnish K , Haudenschild CD , Heyer NI , Hims MM , Ho JT , Horgan AM , Hoschler K , Hurwitz S , Ivanov DV , Johnson MQ , James T , Huw Jones TA , Kang GD , Kerelska TH , Kersey AD , Khrebtukova I , Kindwall AP , Kingsbury Z , Kokko-Gonzales PI , Kumar A , Laurent MA , Lawley CT , Lee SE , Lee X , Liao AK , Loch JA , Lok M , Luo S , Mammen RM , Martin JW , McCauley PG , McNitt P , Mehta P , Moon KW , Mullens JW , Newington T , Ning Z , Ling Ng B , Novo SM , O’Neill MJ , Osborne MA , Osnowski A , Ostadan O , Paraschos LL , Pickering L , Pike AC , Pike AC , Chris Pinkard D , Pliskin DP , Podhasky J , Quijano VJ , Raczy C , Rae VH , Rawlings SR , Chiva Rodriguez A , Roe PM , Rogers J , Rogert Bacigalupo MC , Romanov N , Romieu A , Roth RK , Rourke NJ , Ruediger ST , Rusman E , Sanches-Kuiper RM , Schenker MR , Seoane JM , Shaw RJ , Shiver MK , Short SW , Sizto NL , Sluis JP , Smith MA , Ernest Sohna Sohna J , Spence EJ , Stevens K , Sutton N , Szajkowski L , Tregidgo CL , Turcatti G , Vandevondele S , Verhovsky Y , Virk SM , Wakelin S , Walcott GC , Wang J , Worsley GJ , Yan J , Yau L , Zuerlein M , Rogers J , Mullikin JC , Hurles ME , McCooke NJ , West JS , Oaks FL , Lundberg PL , Klenerman D , Durbin R , Smith AJ ((2008) ) Accurate whole human genome sequencing using reversible terminator chemistry. Nature 456: , 53–59. |
[48] | McKernan KJ , Peckham HE , Costa GL , McLaughlin SF , Fu Y , Tsung EF , Clouser CR , Duncan C , Ichikawa JK , Lee CC , Zhang Z , Ranade SS , Dimalanta ET , Hyland FC , Sokolsky TD , Zhang L , Sheridan A , Fu H , Hendrickson CL , Li B , Kotler L , Stuart JR , Malek JA , Manning JM , Antipova AA , Perez DS , Moore MP , Hayashibara KC , Lyons MR , Beaudoin RE , Coleman BE , Laptewicz MW , Sannicandro AE , Rhodes MD , Gottimukkala RK , Yang S , Bafna V , Bashir A , MacBride A , Alkan C , Kidd JM , Eichler EE , Reese MG , De La Vega FM , Blanchard AP ((2009) ) Sequence and structural variation in a human genome uncovered by short-read, massively parallel ligation sequencing using two-base encoding. Genome Res 19: , 1527–1541. |
[49] | Margulies M , Egholm M , Altman WE , Attiya S , Bader JS , Bemben LA , Berka J , Braverman MS , Chen YJ , Chen Z , Dewell SB , Du L , Fierro JM , Gomes XV , Godwin BC , He W , Helgesen S , Ho CH , Irzyk GP , Jando SC , Alenquer ML , Jarvie TP , Jirage KB , Kim JB , Knight JR , Lanza JR , Leamon JH , Lefkowitz SM , Lei M , Li J , Lohman KL , Lu H , Makhijani VB , McDade KE , McKenna MP , Myers EW , Nickerson E , Nobile JR , Plant R , Puc BP , Ronan MT , Roth GT , Sarkis GJ , Simons JF , Simpson JW , Srinivasan M , Tartaro KR , Tomasz A , Vogt KA , Volkmer GA , Wang SH , Wang Y , Weiner MP , Yu P , Begley RF , Rothberg JM ((2005) ) Genome sequencing in microfabricated high-density picolitre reactors. Nature 437: , 376–380. |
[50] | Hormozdiari F , Alkan C , Eichler EE , Sahinalp SC ((2009) ) Combinatorial algorithms for structural variation detection in high-throughput sequenced genomes. Genome Res 19: , 1270–1278. |
[51] | Metzker ML ((2010) ) Sequencing technologies - the next generation. Nat Rev Genet 11: , 31–46. |
[52] | Alkan C , Coe BP , Eichler EE ((2011) ) Genome structural variation discovery and genotyping. Nat Rev Genet 12: , 363–376. |
[53] | Meyerson M , Gabriel S , Getz G ((2010) ) Advances in understanding cancer genomes through second-generation sequencing. Nat Rev Genet 11: , 685–696. |
[54] | Zhao M , Wang Q , Wang Q , Jia P , Zhao Z ((2013) ) Computational tools for copy number variation (CNV) detection using next-generation sequencing data: Features and perspectives. BMC Bioinformatics 14: , (Suppl 11) S1. |
[55] | Jamuar SS , Tan E-C ((2015) ) Clinical application of next-generation sequencing for Mendelian diseases. Hum Genomics 9: , 1. |
[56] | Bertram L ((2016) ) Next generation sequencing in Alzheimer’s disease. Methods Mol Biol 1303: , 281–297. |
[57] | Teer JK , Mullikin JC ((2010) ) Exome sequencing: The sweet spot before whole genomes. Hum Mol Genet 19: , R145–R151. |
[58] | Talkowski ME , Ernst C , Heilbut A , Chiang C , Hanscom C , Lindgren A , Kirby A , Liu S , Muddukrishna B , Ohsumi TK ((2011) ) Next-generation sequencing strategies enable routine detection of balanced chromosome rearrangements for clinical diagnostics and genetic research. Am J Hum Genet 88: , 469–481. |
[59] | Heid CA , Stevens J , Livak KJ , Williams PM ((1996) ) Real time quantitative PCR. Genome Res 6: , 986–994. |
[60] | Brouwers N , Van Cauwenberghe C , Engelborghs S , Lambert JC , Bettens K , Le Bastard N , Pasquier F , Montoya AG , Peeters K , Mattheijssens M , Vandenberghe R , Deyn PP , Cruts M , Amouyel P , Sleegers K , Van Broeckhoven C ((2012) ) Alzheimer risk associated with a copy number variation in the complement receptor 1 increasing C3b/C4b binding sites. Mol Psychiatry 17: , 223–233. |
[61] | Schouten JP , McElgunn CJ , Waaijer R , Zwijnenburg D , Diepvens F , Pals G ((2002) ) Relative quantification of 40 nucleic acid sequences by multiplex ligation-dependent probe amplification. Nucleic Acids Res 30: , e57. |
[62] | Lalic T , Vossen RHaM , Coffa J , Schouten JP , Guc-Scekic M , Radivojevic D , Djurisic M , Breuning MH , White SJ , den Dunnen JT ((2005) ) Deletion and duplication screening in the DMD gene using MLPA. Eur J Hum Genet 13: , 1231–1234. |
[63] | Sellner LN , Taylor GR ((2004) ) MLPA and MAPH: New techniques for detection of gene deletions. Hum Mutat 23: , 413–419. |
[64] | Charbonnier F , Raux G , Wang Q , Drouot N , Cordier F , Limacher JM , Saurin JC , Puisieux A , Olschwang S , Frebourg T ((2000) ) Detection of exon deletions and duplications of the mismatch repair genes in hereditary nonpolyposis colorectal cancer families using multiplex polymerase chain reaction of short fluorescent fragments. Cancer Res 60: , 2760–2763. |
[65] | Sleegers K , Brouwers N , Gijselinck I , Theuns J , Goossens D , Wauters J , Del-Favero J , Cruts M , van Duijn CM , Van Broeckhoven C ((2006) ) APP duplication is sufficient to cause early onset alzheimer’s dementia with cerebral amyloid angiopathy. Brain 129: , 2977–2983. |
[66] | Cantsilieris S , Baird PN , White SJ ((2013) ) Molecular methods for genotyping complex copy number polymorphisms. Genomics 101: , 86–93. |
[67] | Purcell S , Neale B , Todd-Brown K , Thomas L , Ferreira MA , Bender D , Maller J , Sklar P , De Bakker PI , Daly MJ ((2007) ) PLINK: a tool set for whole-genome association and population-based linkage analyses. Am J Hum Genet 81: , 559–575. |
[68] | Li Y , Shaw C , Sheffer I , Sule N , Powell S , Dawson B , Zaidi S , Bucasas K , Lupski J , Wilhelmsen K ((2012) ) Integrated copy number and gene expression analysis detects a CREB1 association with Alzheimer’s disease. Transl Psychiatry 2: , e192. |
[69] | Szigeti K , Lal D , Li Y , Doody RS , Wilhelmsen K , Yan L , Liu S , Ma C ((2013) ) Genome-wide scan for copy number variation association with age at onset of Alzheimer’s disease. J Alzheimers Dis 33: , 517–523. |
[70] | Heinzen EL , Need AC , Hayden KM , Chiba-Falek O , Roses AD , Strittmatter WJ , Burke JR , Hulette CM , Welsh-Bohmer KA , Goldstein DB ((2010) ) Genome-wide scan of copy number variation in late-onset alzheimer’s disease. J Alzheimers Dis 19: , 69–77. |
[71] | Zarrei M , MacDonald JR , Merico D , Scherer SW ((2015) ) a copy number variation map of the human genome. Nat Rev Genet 16: , 172–183. |
[72] | De Smith AJ , Tsalenko A , Sampas N , Scheffer A , Yamada NA , Tsang P , Ben-Dor A , Yakhini Z , Ellis RJ , Bruhn L ((2007) ) Array CGH analysis of copy number variation identifies 1284 new genes variant in healthy white males: Implications for association studies of complex diseases. Hum Mol Genet 16: , 2783–2794. |
[73] | Fujita PA , Rhead B , Zweig AS , Hinrichs AS , Karolchik D , Cline MS , Goldman M , Barber GP , Clawson H , Coelho A , Diekhans M , Dreszer TR , Giardine BM , Harte RA , Hillman-Jackson J , Hsu F , Kirkup V , Kuhn RM , Learned K , Li CH , Meyer LR , Pohl A , Raney BJ , Rosenbloom KR , Smith KE , Haussler D , Kent WJ ((2011) ) The UCSC genome browser database: Update 2011. Nucleic Acids Res 39: (Database issue), D876–D882. |
[74] | Rovelet-Lecrux A , Hannequin D , Raux G , Le Meur N , Laquerrière A , Vital A , Dumanchin C , Feuillette S , Brice A , Vercelletto M ((2006) ) APP locus duplication causes autosomal dominant early-onset alzheimer disease with cerebral amyloid angiopathy. Nat Genet 38: , 24–26. |
[75] | Hooli BV , Mohapatra G , Mattheisen M , Parrado AR , Roehr JT , Shen Y , Gusella JF , Moir R , Saunders AJ , Lange C , Tanzi RE , Bertram L ((2012) ) Role of common and rare APP DNA sequence variants in Alzheimer disease. Neurology 78: , 1250–1257. |
[76] | Chapman J , Rees E , Harold D , Ivanov D , Gerrish A , Sims R , Hollingworth P , Stretton A , Holmans P , Owen MJ , O’Donovan MC , Williams J , Kirov G ((2013) ) a genome-wide study shows a limited contribution of rare copy number variants to Alzheimer’s disease risk. Hum Mol Genet 22: , 816–824. |
[77] | Crook R , Verkkoniemi A , Perez-Tur J , Mehta N , Baker M , Houlden H , Farrer M , Hutton M , Lincoln S , Hardy J ((1998) ) a variant of Alzheimer’s disease with spastic paraparesis and unusual plaques due to deletion of exon 9 of presenilin 1. Nat Med 4: , 452–455. |
[78] | Smith MJ , Kwok JB , McLean CA , Kril JJ , Broe GA , Nicholson GA , Cappai R , Hallupp M , Cotton RG , Masters CL ((2001) ) Variable phenotype of Alzheimer’s disease with spastic paraparesis. Ann Neurol 49: , 125–129. |
[79] | Rovelet-Lecrux A , Legallic S , Wallon D , Flaman J-M , Martinaud O , Bombois S , Rollin-Sillaire A , Michon A , Le Ber I , Pariente J , Puel M , Paquet C , Croisile B , Thomas-Antérion C , Vercelletto M , Lévy R , Frébourg T , Hannequin D , Campion D ((2012) ) a genome-wide study reveals rare CNVs exclusive to extreme phenotypes of Alzheimer disease. Eur J Hum Genet 20: , 613–617. |
[80] | Hooli B , Kovacs-Vajna ZM , Mullin K , Blumenthal M , Mattheisen M , Zhang C , Lange C , Mohapatra G , Bertram L , Tanzi R ((2014) ) Rare autosomal copy number variations in early-onset familial Alzheimer’s disease. Mol Psychiatry 19: , 676–681. |
[81] | Swaminathan S , Kim S , Shen L , Risacher SL , Foroud T , Pankratz N , Potkin SG , Huentelman MJ , Craig DW , Weiner MW , Saykin AJ , The Alzheimer’s Disease Neuroimaging Initiative ADNI ((2011) ) Genomic copy number analysis in Alzheimer’s disease and mild cognitive impairment: An ADNI study. Int J Alzheimers Dis 2011: , 729478. |
[82] | Swaminathan S , Shen L , Kim S , Inlow M , West JD , Faber KM , Foroud T , Mayeux R , Saykin AJ ((2012) ) Analysis of copy number variation in Alzheimer’s disease: The NIALOAD/NCRAD Family Study. Curr Alzheimer Res 9: , 801–814. |
[83] | Swaminathan S , Huentelman MJ , Corneveaux JJ , Myers AJ , Faber KM , Foroud T , Mayeux R , Shen L , Kim S , Turk M , Hardy J , Reiman EM , Saykin AJ ((2012) ) Analysis of Copy Number variation in Alzheimer’s disease in a cohort of clinically characterized and neuropathologically verified individuals. PLoS One 7: , e50640. |
[84] | Buettner JA , Glusman G , Ben-Arie N , Ramos P , Lancet D , Evans GA ((1998) ) Organization and evolution of olfactory receptor genes on human chromosome 11. Genomics 53: , 56–68. |
[85] | Abekhoukh S , Bardoni B ((2014) ) CYFIP family proteins between autism and intellectual disability: Links with Fragile X syndrome. Front Cell Neurosci 8: , 81. |
[86] | Rainier S , Chai J , Tokarz D , Nicholls R , Fink J ((2003) ) NIPA1 gene mutations cause autosomal dominant hereditary spastic paraplegia (SPG6). Am J Hum Genet 73: , 967–971. |
[87] | Napoli I , Mercaldo V , Boyl PP , Eleuteri B , Zalfa F , De Rubeis S , Di Marino D , Mohr E , Massimi M , Falconi M ((2008) ) The fragile X syndrome protein represses activity-dependent translation through CYFIP1, a new 4E-BP. Cell 134: , 1042–1054. |
[88] | Mantamadiotis T , Lemberger T , Bleckmann SC , Kern H , Kretz O , Martin Villalba A , Tronche F , Kellendonk C , Gau D , Kapfhammer J , Otto C , Schmid W , Schütz G ((2002) ) Disruption of CREB function in brain leads to neurodegeneration. Nat Genet 31: , 47–54. |
[89] | Guffanti G , Torri F , Rasmussen J , Clark AP , Lakatos A , Turner JA , Fallon JH , Saykin AJ , Weiner M , Vawter MP , Knowles JA , Potkin SG , Macciardi F ((2013) ) Increased CNV-region deletions in mild cognitive impairment (MCI) and Alzheimer’s disease (AD) subjects in the ADNI sample. Genomics 102: , 112–122. |
[90] | Magri C , Sacchetti E , Traversa M , Valsecchi P , Gardella R , Bonvicini C , Minelli A , Gennarelli M , Barlati S ((2010) ) New copy number variations in schizophrenia. PLoS One 5: , 3–8. |
[91] | Ingason A , Rujescu D , Cichon S , Sigurdsson E , Sigmundsson T , Pietilainen OPH , Buizer-Voskamp JE , Strengman E , Francks C , Muglia P , Gylfason A , Gustafsson O , Olason PI , Steinberg S , Hansen T , Jakobsen KD , Rasmussen HB , Giegling I , Moller H-J , Hartmann A , Crombie C , Fraser G , Walker N , Lonnqvist J , Suvisaari J , Tuulio-Henriksson A , Bramon E , Kiemeney LA , Franke B , Murray R , Vassos E , Toulopoulou T , Muhleisen TW , Tosato S , Ruggeri M , Djurovic S , Andreassen OA , Zhang Z , Werge T , Ophoff RA , Rietschel M , Nothen MM , Petursson H , Stefansson H , Peltonen L , Collier D , Stefansson K , Clair St DM ((2011) ) Copy number variations of chromosome 16p13.1 region associated with schizophrenia. Mol Psychiatry 16: , 17–25. |
[92] | Shaw CA ((2011) ) Olfactory copy number association with age at onset of Alzheimer disease. Neurology 76: , 1945–1945. |
[93] | Leek JT , Scharpf RB , Bravo HC , Simcha D , Langmead B , Johnson WE , Geman D , Baggerly K , Irizarry RA ((2010) ) Tackling the widespread and critical impact of batch effects in high-throughput data. Nat Rev Genet 11: , 733–739. |
[94] | Lambert CG , Black LJ ((2012) ) Learning from our GWAS mistakes: From experimental design to scientific method. Biostatistics 13: , 195–203. |
[95] | Fadista J , Manning AK , Florez JC , Groop L ((2016) ) The (in) famous GWASthreshold revisited and updated for low-frequency variants. Eur J Hum Genetics 24: , 1202–1205. |
Figures and Tables
Fig.1
Description of deletion and duplication. Deletion occurs when in the sample genome there is a loss of a DNA segment in comparison with a reference genome while duplication is caused by the repetition of DNA segments.
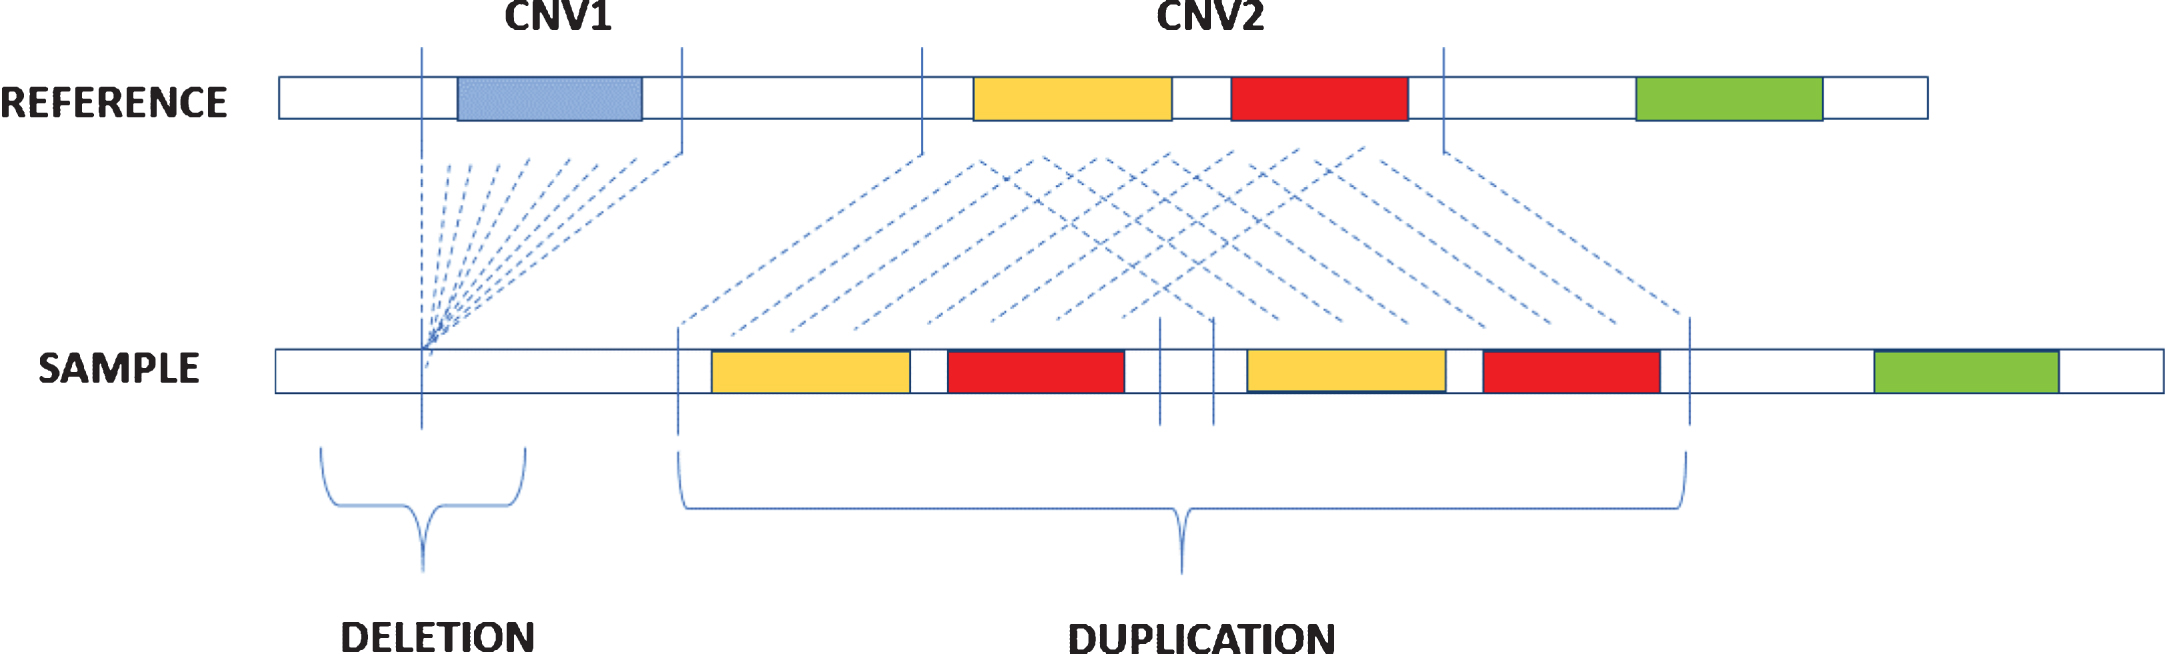
Fig.2
Description of CGH array. Patient DNA and control DNA are labeled with fluorescent dyes and applied to the microarray; they hybridize on the microarray; the microarray scanner measures fluorescent signal intensity; computer software analyzes the data and generates a plot.
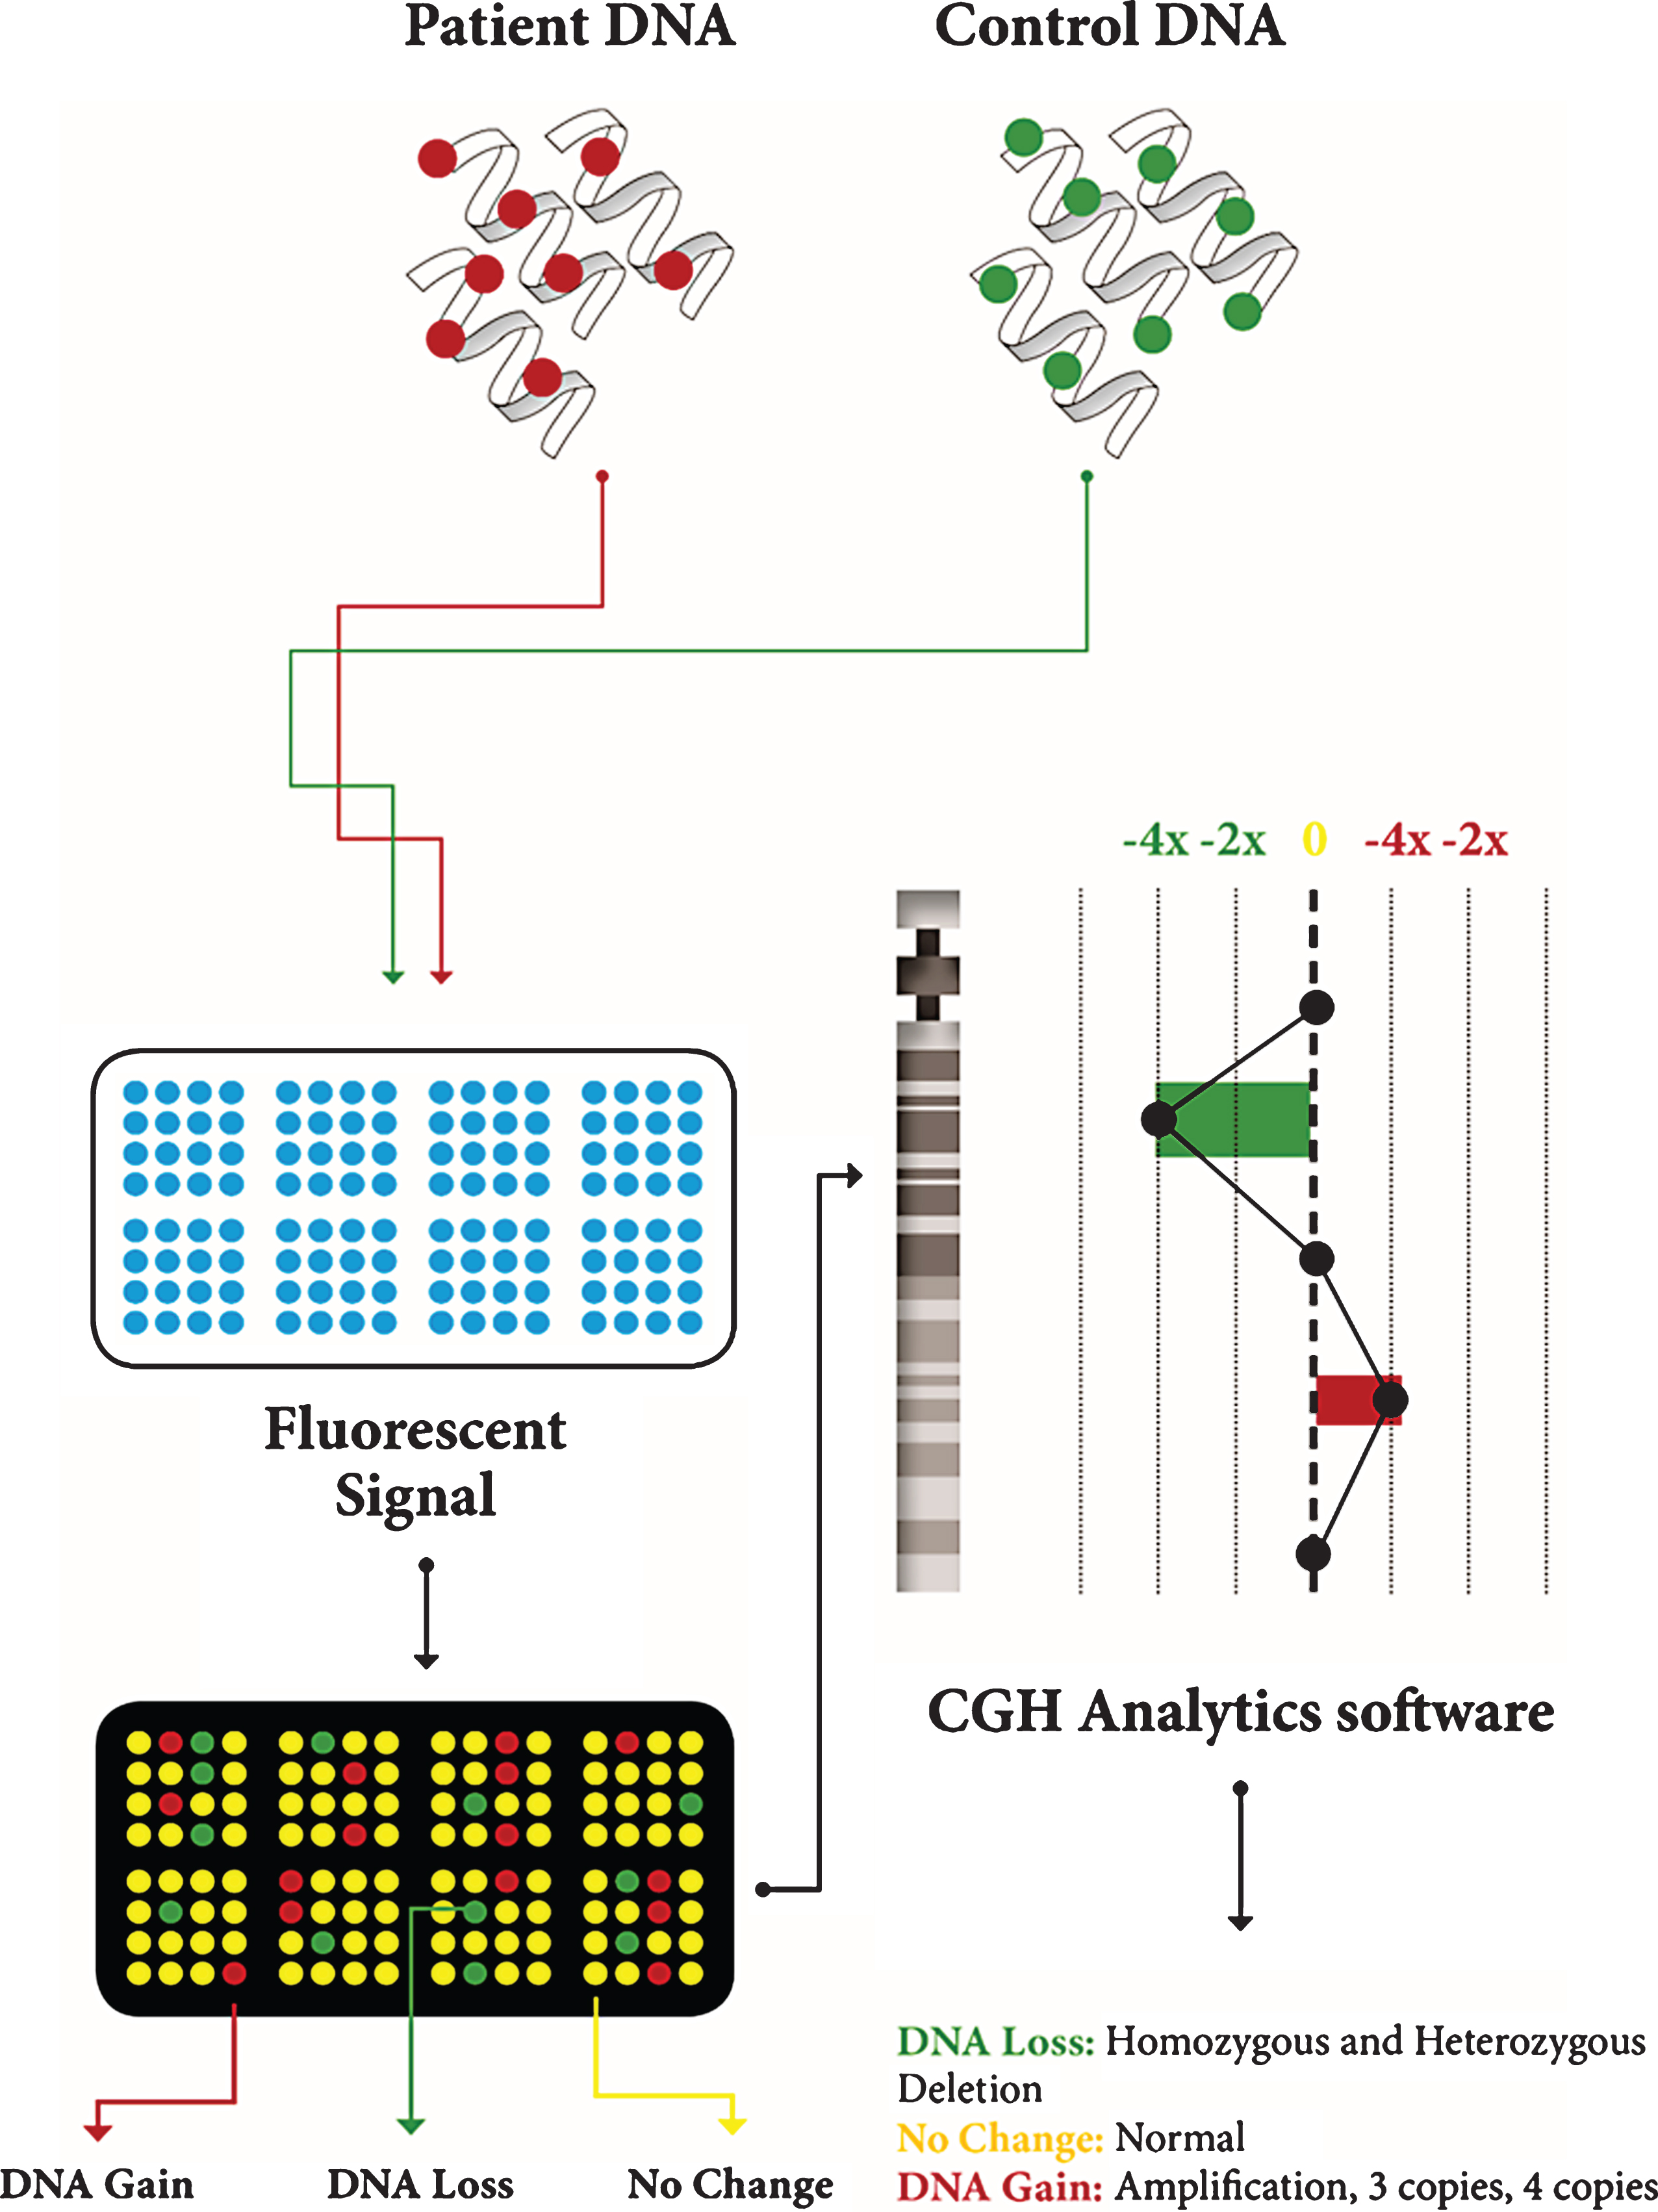
Table 1
Methods for CNVs analysis
| Base | Method | Applicability | Throughput | Minimum | Data Analysis/ | Cost per | Sample Input |
| Technique | Resolution | Time to Result | Sample | Requirements | |||
| NGS | WES | Whole genome | Low/moderate | single base | 2-3 days | High | 1–2 μg DNA |
| WGS | |||||||
| aCGH | ADM-2 algorithm | Whole genome | High | 5–10 kb | >24 h | Moderate | 0.5–1 μg DNA |
| SNP-array | PennCNV | Whole genome | High | 2–10 kb | >24 h | Moderate | 0.5–1 μg DNA |
| QuantiSNP | |||||||
| iPattern | |||||||
| CNVpartition | |||||||
| Affymetrix Genotyping | |||||||
| Console | |||||||
| PCR | Quantitative PCR | Targeted | High | 100 bp | 4 h | Low | 5–10 ng |
| QMPSF | Targeted | ||||||
| MAQ | Targeted | ||||||
| MAPH | Targeted | High | 100 bp | >24 h | Low | 0.5–1 μg DNA | |
| MLPA | Targeted | High | 100 bp | >24 h | Low | 100–200 ng DNA |
Table 2
List of rare CNVs identified in AD patients and related studies*
| Chromosome | Gene | Start –End | Search Method | AD Cases | Positive AD | Healthy | Positive | p-value | Variant | Technique | Reference |
| (NCBI36/hg18) | Cases | Controls | Controls | (corrected) | Type | ||||||
| 1p36.33 | SDF4 | 1142150–1157310 | Whole genome | 381 | – | 191 | – | – | Loss | C | [68] |
| 1q21.1 | NBPF10 | 16762998–146690991 | Whole genome | 381 | – | 191 | – | – | Loss | C | [68] |
| 1q32.2 | CR1 | 205736096–205881733 | Whole genome | 2690 | 2 | 1290 | 0 | – | Gain | A | [76] |
| 205731099–205797985** | Specific targets | 375 | 1 | 180 | 3 | – | Loss and gain | D | [69] | ||
| 2p23.3 | SLC30A3, | 27331816–27365362 | Specific targets | 912 LOAD | 1 sporadic AD | 1078 | 0 | – | Gain | E | [79] |
| DNAJC5G, | 21 ADEOAD | ||||||||||
| TRIM54 (part) | 12 sporadic AD | ||||||||||
| 2q14 | BIN1 | 127505275–127585431** | Specific targets | 375 | 1 | 180 | 1 | – | Loss and gain | D | [69] |
| 2q33.3-q34 | CREB1, FAM119A | 208102930–208171815 | Whole genome | 1230 | 392 | 936 | 262 | 0.008° | Loss | C | [68] |
| 3p11.2-3p11 | CHMP2B, POU1F1 | 87 319 231–87 650 334 | Specific targets | 1009 | 4 | 0 | 0 | Loss | B | [80] | |
| 87 319 617–87 650 334 | |||||||||||
| 3p12.3 | GBE1 | 81538850–81810950 | Whole genome | 711 | 1 | 171 | 0 | Gain | A | [82] | |
| 3q11.2 | EPHA6 | 96 949 558–97 684 405 | Specific targets | 1009 | 2 | 0 | 0 | Gain | B | [80] | |
| 96 937 158–97 678 067 | |||||||||||
| 3q22.1 | CPNE4 | 131253577–131754286** | Specific targets | 375 | 2 | n.a. | 0.033 | Loss | D | [69] | |
| 4q13.1 | EPHA5 | 63 268 479–63 813 833 | Specific targets | 1009 | 2 | 0 | 0 | Gain | B | [80] | |
| 63 268 479–63 809 059 | |||||||||||
| 4p16-4P16.1-4p16.2 | EVC2, EVC, | 5 602 184–5 837 823 | Specific targets | 1009 | 2 | 0 | 0 | Gain | B | [80] | |
| CRMP1 | 5 602 184–5 845 805 | ||||||||||
| 6p21.3 | HLA-DRA | 32515624–32520802 | Specific targets | 728 | 9 | 438 | 0 | 0.0144° | Loss | B | [83] |
| 7p21.2 | MEOX2 | 15654709–16017479 | Specific targets | 912 LOAD | 1 ADEOAD | 1078 | 0 | – | Gain | E | [79] |
| 21 ADEOAD | |||||||||||
| 12 sporadic AD | |||||||||||
| 7q22 | RELN | 102899472–103417198 | Specific targets | 728 | 2 | 438 | 0 | – | Loss | B | [83] |
| Whole genome | 711 | 1 | 171 | 0 | – | Gain | A | [82] | |||
| Whole genome | 222 AD | 0 AD | 143 | 0 | – | – | A | [81] | |||
| 136 MCI | 1 MCI | ||||||||||
| 9p24 | FLJ35024, VLDLR | 2 414 322–2 565 408 | Specific targets | 1009 | 2 | 0 | 0 | Loss | B | [80] | |
| 9p24 | ERMP1 | 5 744 105–5 867 748 | Specific targets | 1009 | 2 | 0 | 0 | Loss | B | [80] | |
| 9p24.3 | KANK1, DMRT1 | 587 476–992 280 | Specific targets | 1009 | 5 | 0 | 0 | Loss | B | [80] | |
| 666 266–992 280 | |||||||||||
| 11q14 | PICALM | 85346132–85457756 | Specific targets | 728 | 1 | 438 | 0 | – | – | B | [83] |
| 14q24.3 | PSEN1 | 72672931–72756862 | Specific targets | 728 | 1 | 438 | 0 | – | – | B | [83] |
| 15q11.2 | TUBGCP5, CYFIP1, | 20269300–20650620 | Specific targets | 392 | 10 | 357 | 3 | 0.037° | Gain | G | [42] |
| NIPA2, NIPA1, | |||||||||||
| WHAMML1 | |||||||||||
| 15q13.1 | CHRFAM7A | 28440735–28473156 | Whole genome | 222 AD | 2 AD | 143 | 0 | – | Loss | A | [81] |
| 136 MCI | 2 MCI | ||||||||||
| Specific targets | 728 | 22 | 438 | 3 | 0.015 | Loss and gain | B | [83] | |||
| Whole genome | 711 | 12 | 171 | 1 | – | Loss | A | [82] | |||
| 15q13.3 | CHRNA7 | 20800000–30300000 | Whole genome | 222 AD | 1 AD | 143 | 2 | – | Loss and gain | A | [81] |
| 136 MCI | 1 MCI | ||||||||||
| Specific targets | 276 | 6 | 322 | 1 | – | Gain | F | [70] | |||
| Specific targets | 392 | 2 | 357 | 2 | – | Gain | G | [42] | |||
| 16p13.3-16p13.2 | A2BP1, ABAT | 7 991 014–8 100 555 | Specific targets | 1009 | 2 | 0 | 0 | Loss | B | [80] | |
| 7 994 156–8 100 555 | |||||||||||
| 17p21.31 | ARL17P1 | 41732281–42012404 | Whole genome | 1230 | – | 936 | – | – | Loss | C | [68] |
| 17q21.1 | MAPT | 41327543–41461546 | Specific targets | 728 | 1 | 438 | 0 | – | – | B | [83] |
| 41 292 942–41 466 517 | Specific targets | 1009 | 6 | 0 | 0 | Gain | B | [80] | |||
| 19q13.41 | HAS1 (part), FPR1, | 56918483–57049433 | Specific targets | 912 LOAD | 1 sporadic AD | 1078 | 0 | – | Gain | E | [79] |
| FPR2, FPR3 | 21 ADEOAD | ||||||||||
| 12 sporadic AD | |||||||||||
| 19q13.3 | KLK6 | 56151516–56166524 | Specific targets | 912 LOAD | 1 ADEOAD | 1078 | 0 | – | Gain | E | [79] |
| 21 ADEOAD | |||||||||||
| 12 sporadic AD | |||||||||||
| 21q21.3 | APP | 26174732–26465009 | Whole genome | 2690 | 1 | 1290 | 0 | – | Gain | A | [76] |
| Specific targets | 728 | 1 | 438 | 0 | – | Gain | B | [83] | |||
| Specific targets | 1009 | 10 | 0 | 0 | B | [80] | |||||
| 21q22.2 | DOPEY2 | 36458708–36588442 | Specific targets | 728 | 4 | 438 | 0 | – | Gain | B | [83] |
| Whole genome | 711 | 2 | 171 | 0 | – | Gain | A | [82] | |||
| Whole genome | 222 AD | 0 AD | 143 | 0 | – | – | A | [81] | |||
| 136 MCI | 1 MCI |
*The studies are classified as whole-genome or specific targets (hypothesis-driven studies in which the relation between target specific genes or regions was previously hypothesized). For each study the method used for the analysis is indicated (legend below). A, Illumina Human610-Quad BeadChip + PennCNV; B, Genome-Wide Human SNP Array 6.0 (Affymetrix) + PennCNV; C, Genome-Wide Human SNP Array 6.0 (Affymetrix) + Genotyping Console 3.0 software (Affymetrix); D, Genome-Wide Human SNP Array 6.0 (Affymetrix) + Their method; E, a-CGH analysis by Human High-Resolution Discovery Microarray Kit 1_1M (Agilent Technologies, Santa Clara, CA, USA) + QMPSF (based on PCR); F, Illumina HumanHap 550 K genotyping platform + PennCNV; G, Illumina HumanHap 650Y arrays + QuantiSNP, iPattern, PennCNV, and CNVpartition (implemented in BeadStudio). n.a., not analyzed; **Assembly GRCh37.1; °uncorrected;-, not referred. The significance level was set at 0.05.


