
Neutrophil Gelatinase-Associated Lipocalin and its Receptors in Alzheimer’s Disease (AD) Brain Regions: Differential Findings in AD with and without Depression
Abstract
Co-existing depression worsens Alzheimer’s disease (AD) pathology. Neutrophil gelatinase-associated lipocalin (NGAL) is a newly identified (neuro)inflammatory mediator in the pathophysiologies of both AD and depression. This study aimed to compare NGAL levels in healthy controls, AD without depression (AD–D), and AD with co-existing depression (AD+D) patients. Protein levels of NGAL and its receptors, 24p3R and megalin, were assessed in nine brain regions from healthy controls (n = 19), AD–D (n = 19), and AD+D (n = 21) patients. NGAL levels in AD–D patients were significantly increased in brain regions commonly associated with AD. In the hippocampus, NGAL levels were even further increased in AD+D subjects. Unexpectedly, NGAL levels in the prefrontal cortex of AD+D patients were comparable to those in controls. Megalin levels were increased in BA11 and amygdala of AD+D patients, while no changes in 24p3R were detected. These findings indicate significant differences in neuroimmunological regulation between AD patients with and without co-existing depression. Considering its known effects, elevated NGAL levels might actively promote neuropathological processes in AD with and without depression.
INTRODUCTION
Alzheimer’s disease (AD) is a multifactorial neurodegenerative disorder [1]. Apart from the classical amyloid-β (Aβ) cascade hypothesis and tau hypothesis of AD, mounting evidence has led to the understanding that more mechanisms are involved in the etiology of AD [2–4]. For example, another important factor in the pathophysiology of AD is neuroinflammation, characterized by pro-inflammatory processes in the brain [5–7]. Increased pro-inflammatory processes have been proposed as a biological constituent linking AD and depression [8, 9]. Depression is a neuropsychiatric symptom that is frequently present in AD [10] and associated with an increased risk for the progression of mild cognitive impairment (MCI) to AD [11–14]. Furthermore, AD patients with co-existing depression (AD+D) have a poorer prognosis than AD patients without depression (AD–D) [15–17]. Interestingly, AD+D patients present aggravated Aβ and tau pathology in the hippocampus, as compared to AD–D patients [17, 18]. Several studies have demonstrated that a low grade inflammatory environment is present in the brain and blood in depressed [19–21] and AD patients [5–7]. However, immune regulation in AD patients with co-existing symptoms of depression is poorly understood and existing studies are limited.
Recently a pro-inflammatory mediator called neutrophil gelatinase-associated lipocalin (NGAL) was identified to be involved in the pathophysiology of both AD and depression [22, 23]. NGAL is also known as lipocalin 2, 24p3, uterocalin, and siderocalin, and belongs to the lipocalin family of small hydrophobic proteins [24–27]. NGAL acts via its two known receptors, megalin (also known as Lrp2) and 24p3R (also known as SLC22A17 and BOCT1) [28, 29]. NGAL functions as an acute phase protein in the innate immune response and plays an important role in the defense against certain bacteria [30]. It exerts various important functions in the central nervous system, depending on the cellular environment, as recently reviewed by Jha and colleagues [31]. NGAL mRNA and protein are expressed in very low levels in the brain under normal physiological conditions [32, 33]. NGAL protein levels are robustly increased in human AD postmortem brain regions affected by AD pathology, particularly the hippocampus [23]. Furthermore, increased plasma NGAL levels were found in people with MCI [34]. In cerebrospinal fluid (CSF), NGAL levels were significantly decreased in AD patients as well as in MCI patients that later converted to AD, which mimics the characteristically lowered CSF Aβ levels in AD [23, 35]. We recently showed that plasma NGAL levels are increased in depressed older persons [22]. In addition, plasma NGAL levels are significantly increased in depressed elderly females with impaired recallmemory [36].
Cell culture experiments showed that NGAL is increased in different brain cell types upon exposure to Aβ and stimulation of tumor necrosis factor-α receptor 1 (TNFR1), and sensitizes primary cortical neurons and astrocytes to Aβ- and oxidativestress-induced cell death [23, 37, 38]. These effects may in part be caused by silencing of neuroprotective tumor necrosis factor-α receptor 2 (TNFR2) signaling [23]. NGAL is significantly increased in the hippocampus of mice following psychological stress, where it reduces dendritic spine formation of hippocampal neurons, potentially by inhibiting Akt phosphorylation of the protein kinase B (PKB)/Akt pathway [23, 33]. Furthermore, increased NGAL aggravates neuroinflammation upon neuronal damage and promotes the pro-inflammatory phenotypes of astrocytes and microglia [39–41].
The above-mentioned studies indicate that NGAL functions as a neuroinflammatory constituent that is involved in the pathophysiology of both depression and AD, and might exacerbate AD pathology in the presence of co-existing depression. Therefore our objectives were (1) to investigate NGAL protein levels in serum, CSF, and human postmortem brain tissue (nine different brain regions) of control subjects, AD–D, and AD+D patients, and (2) to assess whether changes in brain NGAL levels correlate with alterations in the protein expression of its receptors, megalin and 24p3R. We hypothesize that NGAL levels are increased in AD-related brain regions in AD–D patients as compared to healthy age-matched controls, and further increased in AD+D patients in certain brain regions that are involved in both depression and AD.
MATERIALS AND METHODS
Human samples
Human tissue samples (serum, CSF, and brain tissue) from healthy controls, AD–D, and AD+D patients were obtained from the Biobank of the Institute Born-Bunge (University of Antwerp, Belgium) and stored at –80°C until analysis. Informed consent for behavioral assessments and tissue collection was provided by all participants. Ethical approval for human sample collection was granted by the Medical Ethical Committee of the Middelheim General Hospital (Antwerp, Belgium) (approval numbers 2805 and 2806). Participants who were known to suffer from diseases that could influence NGAL levels, such as renal failure and cancer, were excluded. In this respect, C-reactive protein (CRP) levels were measured in serum by ELISA analysis (Abnova, KA0238, performed according to the manufacturer’s protocol) (Table 1). Serum CRP levels in control patients on average were below 10 mg/L, which is withinnormal range for healthy adults, indicating that active inflammation was not present in these participants [42]. Analyses of variance showed that serum CRP levels in AD patients were not significantly different from those in control patients (F = 2.30, df = 2, p = 0.11). Further details and inclusion criteria are described by Vermeiren et al. [43, 44].
Brain tissue samples were collected from nine different brain regions, including the hippocampus, amygdala, thalamus, cerebellum, Brodmann area (BA) 9 (BA9; dorsolateral prefrontal cortex), BA10 (frontopolar cortex), BA11 (orbitofrontal cortex), BA22 (superior temporal cortex), and BA24 (ventral/dorsal anterior cingulate cortex (ACC)). Autopsy and collection procedures were performed as described previously [43, 44]. Briefly, brain autopsy was performed within 6 h after death of consented patients, upon which the left hemisphere was frozen at –80°C for neurochemical analyses, and the right hemisphere was formaldehyde-fixed for neuropathological examination. Neuropathological examination was performed as previously described [44] using the criteria of, among others, Braak and Braak and Montine et al. [2, 45]. Absence of AD pathology was confirmed in all control brains used in this study, and definite AD diagnosis was confirmed in all AD brains (see Table 1 for Braak stages). No significant vascular pathology was detected in the brains. The frozen left hemisphere was routinely dissected into 21 brain regions, following a standard procedure [44]. The inclusion of the nine brain regions selected for this study was based on their involvement in both depression and AD.
Paired AD CSF and serum were not from the same AD patients as those from whom brain tissue was obtained. CSF and serum were from patients that had a diagnosis ranging from probable to definite AD. Numbers and demographic details of participants are listed in Table 1.
Neuropsychiatric evaluation
For all patients, the Cornell Scale for Depression in Dementia (CSDD) was used to distinguish between AD–D and AD+D (see also Table 1). The CSDD scale examines signs of major depression in demented patients [46]. The presence of significant depressive symptoms is suggested by a total score of 8 or more, while scores above 18 are indicative of major depression [14]. For the current study, AD patients with a CSDD score of ≥8 were classified as AD+D patients, whereas patients with a CSDD score of <8 were defined as non-depressed, AD–D patients.
Mini-Mental State Examination (MMSE) scores were determined in all subjects from whom serum was obtained, and in AD patients from whom CSF was collected. In addition, the MiddelheimFrontality Score (MFS) scale was included as a measure of frontal lobe features [47].
For the control patients from whom serum was obtained, the time between behavioral scoring and sampling of serum was on average 0.7 days (SD; 1.83 days), and the time between MMSE scoring and sampling was 4.25 days (SD; 11.65 days). From AD patients, serum and CSF were collected on average 0.36 days (SD; 1.41 days) apart from behavioral rating. For AD patients from whom brain tissue was obtained, the average time from baseline or follow-up (n = 9) behavioral scoring until time of death was 6.23 days (SD; 11.49). No behavioral data was obtained from the control subjects from whom brain tissue was received.
Measurement of NGAL with ELISA
NGAL in serum and CSF samples was quantified via a sandwich ELISA (R&D Systems) according to the manufacturer’s protocol, as described previously [22, 23]. Serum was diluted 1 : 100, and CSF samples were not diluted. The intra- and inter-assay coefficients of variation were 3% and 5%, respectively.
Western blot analyses of NGAL, megalin, and 24p3R levels in brain tissue
Brain NGAL, megalin, and 24p3R levels were determined by western blot as previously described [23]. An NGAL antibody specifically directed against human NGAL was used at a concentration of 1 : 600 (rat anti-human LCN2, MAB17571, R&D systems). Both megalin (rabbit anti-megalin, Ab129198, Abcam) and 24p3R (rabbit anti-24p3R, Ab124506, Abcam) antibodies were used at 1 : 1000 dilution. Actin served as internal standard to control for loading variations and was used at 1 : 1000 000 dilution (mouse anti-actin, 691002, ImmunO, MP Biomedicals Inc.). Appropriate HRP-conjugated secondary antibodies were used at a 1 : 5000 dilution (donkey anti-rabbit, NA934, GE Healthcare; goat anti-mouse, Sc-2005, SantaCruz Biotechnology; goat anti-rat, 112-035-003, Jackson ImmunoResearch Laboratories Inc.). Examples of full western blots for NGAL, 24p3R, and megalin are shown in Supplementary Figure 3.
Immunohistochemistry for fluorescent double stainings
Paraformaldehyde-fixed hippocampal brain tissue from AD patients was used for immunofluorescent double stainings. For double stainings of NGAL with ionized calcium-binding adapter molecule 1 (Iba1) and glial fibrillary acidic protein (GFAP), brain sections were cut from paraffin embedded tissue (10 μm thick). These sections were deparaffinized before start of the staining protocol. For double staining of NGAL with neuronal nuclei (NeuN), brain sections were obtained from frozen, non-paraffin embedded tissue (16 μm thick). Sections were subjected to heat-induced antigen retrieval with 10 mM sodium citrate buffer (pH 6.0, no Tween) in the microwave. Tissue was then blocked with 10% normal serum in PBS+0.3% Triton X-100 for 1 h at room temperature, and incubated with the primary antibody overnight at 4°C. Primary antibodies were diluted in PBS+0.3% Triton X-100, with 1% normal serum. The following primary antibodies were used: anti-NGAL (R&D systems, MAB1757, 1 : 50 dilution), anti-Iba1 (Wako, 019-19741, 1 : 1000 dilution), anti-GFAP (Sigma g3839, 1 : 1500 dilution), and anti-NeuN (Abcam, Ab177487, 1 : 300 dilution). Subsequently, sections were incubated with secondary antibodies for 1 h at RT. Secondary antibodies were labelled with either Alexa Fluor 488 (Abcam Ab150153 or Molecular Probes A-21202, used at 1 : 400 dilution) or Cy3 (Jackson ImmunoResearch 712-165-150 or 711-165-152, used at 1 : 700 dilution). Stainings were mounted with Mowiol, and imaged with the Leica TCS SP8 microscope.
Statistical analysis
Analysis of variance (ANOVA) with Tukey post hoc test for pair-wise comparisons was used to determine differences in NGAL protein levels between healthy controls, AD–D, and AD+D patients. This was followed by analyses of covariance (ANCOVA) with Bonferroni post hoc test with CSF or brain NGAL levels as dependent variable to analyze NGAL levels between the studied groups, adjusted for age and gender as confounding factors for CSF NGAL levels, and age, gender, and use of anti-depressants as confounding factors for brain NGAL levels. Due to the limited number of brain tissue samples, bootstrapping was used with 1000 bootstraps per sample for analyses of brain tissues. Results were considered statistically significant when p-values were <0.05. Pearson correlation was used to examine the association between hippocampal NGAL levels and the severity of depression, and associations between NGAL, megalin, and 24p3R in the studied brain regions. A corrected p-value of less than 0.006 was considered significant for multiple comparisons between NGAL, megalin, and 24p3R in the nine studied brain regions. As the correlations between the MFS with NGAL in the nine brain regions were exploratory, p-values were not corrected and p-values less than 0.05 were considered significant. All analyses were conducted with SPSS version 22.0.
RESULTS
NGAL levels in different brain regions of control, AD–D, and AD+D patients
Mean NGAL/actin ratios in all nine investigated brain regions are displayed in Fig. 1. The data shown is not yet adjusted for age, sex, and use of anti-depressants, which are potential confounding factors. NGAL was ubiquitously expressed throughout the healthy human brain. NGAL levels in the hippocampus were higher in AD–D than in healthy controls, and even higher in AD+D (Fig. 1A). After adjustment for confounders (age, sex, and use of anti-depressants), the increased NGAL levels as compared to controls remained significant for AD–D (p = 0.017) and AD+D (p = 0.003), but the difference between the AD–D and AD+D group was no longer significant (p = 0.112). As depicted in Fig. 2, hippocampal NGAL levels were found to be positively correlated with the severity of depression (as measured by the CSDD depression score) in all of the AD patients (r = 0.359, p = 0.027). The amygdala contains higher NGAL levels in both AD–D and AD+D patients as compared to controls (Fig. 1B); these differences remained significant (AD–D, p = 0.027; AD+D, p = 0.04 compared to control) after adjusting for confounding factors. NGAL in the thalamus showed a similar expression pattern to that found in the amygdala (Fig. 1C). After adjustments for confounding factors, NGAL remained significantly higher in AD–D (p = 0.002) compared to controls. Furthermore, a distinct pattern of NGAL levels was observed for BA9, BA10, BA11, and BA24: NGAL levels were significantly increased in AD–D patients compared to controls, but were not different between controls and AD+D patients and even significantly lower in AD+D as compared to AD–D (Fig. 1D-G). For BA11, these differences were, however, not significant, as shown in Fig. 1F. Moreover, after adjusting for confounding factors, the differences in NGAL levels between control and AD–D were as follows: BA9 (p = 0.029), BA10 (p = 0.073), BA11 (p = 0.098), and BA24 (p = 0.05). Similarly, when comparing AD–D and AD+D participants, adjustment for confounding factors gave the following results: BA9 (p = 0.029), BA10 (p = 0.040), BA11 (p = 0.112), and BA24 (p = 0.069). In BA22 and the cerebellum, no differences between the three groups were found (Fig. 1H, I).
To assess to which brain cell types NGAL is localized in the AD hippocampus, double stainings between NGAL and markers for microglia (Iba1), astrocytes (GFAP), and neurons (NeuN) were performed (Fig. 3). Immunofluorescent stainings showed that there is little co-localization for NGAL with microglia (Fig. 3A-C) and neurons (Fig. 3G-I). NGAL did co-localize with GFAP-positive astrocytes (Fig. 3D-F).
NGAL levels in serum and CSF
Serum NGAL levels were not significantly different between the study groups (ANOVA, F = 0.26, df = 2, p = 0.77) (Fig. 4A). There were, however, differences between the studied groups in CSF NGAL levels (ANOVA, F = 9.52, df = 2, p < 0.001). NGAL levels were significantly lower in AD–D (p < 0.001) and AD+D (p = 0.001) CSF compared to control CSF (Fig. 4B). Further, analyses with ANCOVA (F = 9.30, df = 2, p < 0.001) and Bonferroni post hoc test showed that CSF NGAL levels remained significantly lower in AD–D (p = 0.001) and AD+D (p = 0.001) after including age and gender as covariates.
Megalin and 24p3R levels in different brain regions
Megalin levels were significantly higher in the amygdala of AD+D patients as compared to controls (Fig. 5A); this remained significant (p = 0.022) after adjusting for confounding factors (age, gender, and use of antidepressant medication). A similar pattern was found in BA11 (Fig. 5B), but this difference lost significance after adjusting for covariates (p = 0.059). No differences in megalin levels between the three groups were found in the other brain regions (Supplementary Figure 1). Moreover, for 24p3R, no differences between control, AD–D, and AD+D were found for any of the studied brain regions (Supplementary Figure 2).
Correlation between brain NGAL, megalin, and 24p3R in different brain regions
No significant correlations were found between NGAL and 24p3R or megalin levels. Megalin and 24p3R levels were positively correlated in the hippocampus (r = 0.510, p < 0.001) (Table 2).
Correlations between prefrontal NGAL levels and frontal lobe features
NGAL levels in BA9, BA10, BA11, and BA24 were found to be inversely correlated with the MFS in AD patients (Table 3). There were no significant correlations between MFS scores and megalin or 24p3R, in any of the studied brain regions.
DISCUSSION
This study shows the following three main findings: (1) NGAL levels are significantly higher in regions throughout the brain, which are commonly affected by AD pathology; (2) NGAL levels were significantly increased in the hippocampus in AD, and even more so in AD with co-existing depression. Hippocampal NGAL levels were positively correlated with the severity of depression; (3) Surprisingly, as compared to control patients, AD patients withco-existing depression did not show higher NGAL levels in the studied prefrontal cortical regions and BA24.
NGAL in AD–D brains
We have previously shown that NGAL levels were significantly higher in the entorhinal cortex and especially the hippocampus of AD patients as compared to age-matched controls, while cerebellar NGAL levels remained unchanged [23]. Our current observations confirm these previous findings. Moreover, the previous findings are complemented by the novel findings of increased NGAL levels in several other brain regions, including the prefrontal cortex, which are known to be affected by AD [2, 48, 49]. Whether NGAL expression in the brain merely follows AD pathology or also precedes it remains to beelucidated.
NGAL in AD+D brains
Consistent with our hypothesis, a comparison between controls, AD–D, and AD+D patients showed that hippocampal NGAL levels were higher in AD–D, and even higher in AD+D patients, as compared to controls. This may reflect aggravated hippocampal Aβ and tau pathology in AD+D versus AD–D as described in literature [17, 18], which might contribute to higher NGAL levels since Aβ directly stimulates the production of NGAL [38].
The prefrontal cortical regions BA9, BA10, and BA11 and the anterior cingulate cortical area BA24 unexpectedly had lower NGAL levels in AD+D compared to AD–D patients. Evidence exists of dissimilarities between prefrontal cortex and hippocampus in major depressive disorder that could explain our findings. Circuitries involved in mood regulation may be dysfunctional in late-life depression, due to disruptions in underlying white matter tracts. Such mood-related connections also exist between the hippocampus and prefrontal cortical regions [50–55]. Immunohistochemical staining of human AD postmortem brain tissue illustrated a robust punctate and diffuse distribution of NGAL in the cell bodies, axons, and dendrites of hippocampal pyramidal neurons of the CA1 region [23]. Hypothetically, hippocampal NGAL may normally be transported via neuronal projections to prefrontal cortical regions. Disruptions in such projections, which may be present in co-existing symptoms of depression in AD, might therefore impair transport of NGAL to prefrontal regions, and lead to reduced NGAL levels as shown in this study. This hypothesis is further supported by the finding that prefrontal NGAL levels negatively correlate with the MFS score. The MFS provides a measure of frontal lobe features, with a higher score indicating greater abnormalities in frontal lobe functioning [47]. Interestingly, it has been previously reported that MFS scores are positively correlated with severity of depressive symptoms in AD [56], which we also found in patients in this study (data not shown). Taken together, our current results support the association between higher MFS scores and depression, and suggest that frontal lobe changes (which may be involved in the pathology of depression) may be linked with lower NGAL levels in the prefrontal cortex. However, due to the exploratory nature of the correlations between the MFS with NGAL, these findings should be interpreted with caution.
Of interest, there may be other factors that, like NGAL, show lower levels in AD+D patients than in AD–D patients, in the prefrontal cortex. In a recent study by Vermeiren et al. [44], the levels of monoamines and their metabolites were determined in the same human brain samples as investigated in the current study. Interestingly, the levels of 3-methoxy-4-hydroxyphenylglycol (MHPG), the metabolite of norepinephrine (NE), were found to be significantly decreased in BA9 and BA10 in AD+D patients as compared to AD–D patients. It was suggested by Vermeiren et al. that these lower prefrontal MHPG levels in AD+D patients may be due to altered norepinephrinergic neurotransmission in the prefrontal cortex, caused by a more severe neurodegeneration of the locus coeruleus in AD+D patients. The locus coeruleus is the primary center of NE synthesis in the brain, and has strong connections with the prefrontal cortex. Although the lower prefrontal NGAL and MHPG levels in AD+D patients as compared to AD–D patients probably have different underlying mechanisms, it is interesting to see that they share this feature. Furthermore, it might be that NGAL expression may in part be induced via NE. Although not shown in brain cells, it was reported that NE treatment of adipocytes causes a significant increase in intracellular NGAL levels [57].
NGAL levels in serum and CSF
Corresponding to our previous findings [23], we did not find significant changes in serum NGAL levels between the studied groups. As shown by [34], it may be that increased serum NGAL levels appear especially in early stages of AD. Moreover, although it was previously shown that plasma NGAL levels were elevated in elderly depressed patients [22], this effect may be lost in AD+D patients.
Lower CSF NGAL levels in AD are in accordance with our previous findings [23]. The decreased NGAL levels in CSF of AD patients might in part be explained by lower megalin expression in the choroid plexus of AD patients [58]. Since megalin in the choroid plexus may transport NGAL from the brain into the CSF, lower megalin levels therefore can result in less NGAL clearance from the brain, causing increased brain NGAL levels and decreased CSF NGAL levels in AD. This potential explanation is supported by the findings that megalin can also transport Aβ from the brain to CSF, and that significantly reduced CSF Aβ levels are characteristic for AD [23, 35, 58–63]. Our findings further show that CSF NGAL levels are not affected by the presence of co-existing depression in AD.
Megalin and 24p3R
The neurobiological functions of increased megalin levels in BA11 and the amygdala, shown in this study, are unclear. Megalin is expressed throughout the brain, by different cell types like neurons, microglia, astrocytes, and endothelial cells. It was reported that neuronal and astrocytic megalin may play an important role in modulating Aβ-mediated neurotoxicity, by indirectly reducing Aβ secretion into the extracellular space [64]. Previous studies showed that megalin expression is decreased in the choroid plexus of AD patients [58]. Our findings indicate that this is not the case for the brain regions in this study.
For 24p3R, no differences between control, AD–D, and AD+D were found for any of the studied brain regions. In addition, 24p3R and NGAL levels did not correlate in any region. Brain 24p3R is mostly expressed by neurons and endothelial cells, with high expression in the choroid plexus [32]. It is involved in endocytic iron delivery, and is known to mediate apoptosis upon binding of an iron-free form of NGAL [28]. Moreover, iron-free NGAL decreases hippocampal spine density in cell culture [33]. The effects of NGAL via 24p3R in neurons may depend on the levels of iron-free NGAL rather than the expression levels of the receptor itself.
Interestingly, despite a lack of strong correlation with NGAL levels for both megalin and 24p3R, the receptors positively correlated with one another in the hippocampus. Mechanisms involved in the regulation of the expression of megalin and 24p3R are still unknown. However, Aβ may to a certain degree play a role in the regulation of both receptors by increasing their mRNA levels in cultured neurons andastrocytes [38].
Strengths and limitations
Behavioral assessments were performed close to the patients’ death, increasing the reliability of these measurements. Furthermore, NGAL is a stable marker since it is resistant to proteolytic degradation and possesses great storage stability [65, 66]. A few limitations of this study should be acknowledged. Symptoms of depression were not evaluated in control subjects from whom brain tissue was obtained. Thus presence of depressive symptoms cannot be excluded with certainty. However, the control group of this study did not have chronic diseases and use of anti-depression medication was low (Table 1). Four of the control patients from whom brain tissue was studied had received an anti-depressant on the day of or the day before death. For two of these patients, there was no clinical indication of depression. Of the other two, one patient had a reactive depression after loss of his wife one month before, and another patient suffered pain and was treated with an anti-depressant. Furthermore, behavioral assessments of control patients from whom CSF was obtained, were not available.
Another significant limitation of this study is the realization that depressive symptoms are variable in time. Even though the last neuropsychological assessment was done very shortly before the time of death (on average 6.23 days before death, for patients from whom brain tissue was obtained), it is possible that depressive feelings earlier in life or around time of death may have been different from depressive symptoms around the time of the CSDD assessment. From the 9 patients with whom follow-upneuropsychological assessment was done, 6 showed a stable CSDD score over time, while 2 patients showed a clear increase in CSDD rating in subsequent follow-up assessments. Yet, even when CSDD scores would vary to some extent after the last neuropsychological assessment, the characterization of the AD–D and AD+D groups may remain correct. Namely, the AD+D and AD–D groups had CSDD scores that were either relatively/very high (average CSDD score of 13.3, depressed) or very low (average CSDD score of 4.7, non-depressed), and thus safely distant from the cut-off CSDD score that was set at 8.
Moreover, we did not have information about the life-long history of depression in the studied patients. In future studies it may be of interest to compare patients with a history of multiple/early-onset depressions, with patients that for example suffered a single depression, or depression that had its onset in late life. For the current study, it could be said that we have looked at depressive ‘states’ rather than‘traits’.
Additionally, while the results raise multiple mechanistic questions concerning NGAL regulation and effects of NGAL, molecular and cellular mechanisms were not investigated in this study. As such, the current results cannot imply a causal role of NGAL in AD–/+Depression, and future research has to be done to further determine the importance of NGAL in development and progression of AD–/+Depression. Another aspect that would be of interest to investigate further is the cell type(s) by which NGAL is produced and secreted. We hypothesize that this may be highly dependent on the type of trigger that is present (and possibly the brain region that is involved): it seems that in neurodegenerative conditions astrocytes are the main producers of NGAL [67], while stimuli such as psychological stress might mostly trigger NGAL expression in neurons [33]. In the current study, we found co-localization between NGAL and the astrocyte marker GFAP in the AD hippocampus, and little co-localization between NGAL and markers for microglia and neurons (Fig. 3). It should be noted, however, that these stainingscannot distinguish whether NGAL positive cells are the source of the detected NGAL, or whether the cells have taken up NGAL that was secreted from othercells.
Conclusion
This study shows that NGAL levels are increased in the AD brain, in multiple regions associated with AD pathology. Hippocampal NGAL levels are increased when symptoms of depression are present in AD, and are positively correlated with the severity of depression in AD patients. NGAL is involved in several mechanisms that can contribute to neuronal dysfunction and cell death, as described in the introduction. Thus, increased hippocampal NGAL levels in AD, especially in AD+D, could aggravate the pathophysiology of AD (summarized in Fig. 6). Differential expression levels of NGAL in the prefrontal cortex of AD–D versus AD+D patients indicate that there are differences in neuroinflammatory regulation in AD with and without co-existing symptoms of depression. Moreover, this study provides new insights into NGAL as neuroinflammatory constituent underlying co-existing symptoms of depressionin AD. Authors’ disclosures available online (http://j-alz.com/manuscript-disclosures/16-0330r1).
ACKNOWLEDGMENTS
We very much thank Zhuoran Yin, Erik Boddeke, and Ietje Mantingh-Otter for help with immunohistochemical stainings. This work was supported by a research grant of the Interuniversity Poles of Attraction (IAP Network P7/16) of the Belgian Federal Science Policy Office, Methusalem excellence grant of the Flemish Government, agreement between Institute Born-Bunge and University of Antwerp, the Medical Research Foundation Antwerp, the Thomas Riellaerts research fund, University Research Fund of the University of Antwerp, Neurosearch Antwerp and the Alzheimer Research Center Groningen. Furthermore, ULME and PPDD are supported by Internationale Stichting Alzheimer Onderzoek (ISAO grant #06511). DVD is supported by a SAO-FRA Standard Grant (grant #15002). PJWN, PPDD and ULME are funded by ZonMW Deltaplan Dementie Memorabel, and DWD is supported by a grant of the Research School of Behavioral and Cognitive Neurosciences. PJWN is funded by Alzheimer Nederland (WE. 13-2015-19).
Appendices
The supplementary material is available in the electronic version of this article: http://dx.doi.org/10.3233/JAD-160330.
REFERENCES
[1] | Qiu C , Kivipelto M , von Strauss E ((2009) ) Epidemiology of Alzheimer’s disease: Occurrence, determinants, and strategies toward intervention. Dialogues Clin Neurosci 11: , 111–128. |
[2] | Braak H , Braak E ((1991) ) Neuropathological stageing of Alzheimer-related changes. Acta Neuropathol (Berl) 82: , 239–259. |
[3] | Haass C , Selkoe DJ ((2007) ) Soluble protein oligomers in neurodegeneration: Lessons from the Alzheimer’s amyloid beta-peptide. Nat Rev Mol Cell Biol 8: , 101–112. |
[4] | Ittner LM , Götz J ((2011) ) Amyloid-β and tau–a toxic pas de deux in Alzheimer’s disease. Nat Rev Neurosci 12: , 65–72. |
[5] | Akiyama H , Barger S , Barnum S , Bradt B , Bauer J , Cole GM , Cooper NR , Eikelenboom P , Emmerling M , Fiebich BL , Finch CE , Frautschy S , Griffin WS , Hampel H , Hull M , Landreth G , Lue L , Mrak R , Mackenzie IR , McGeer PL , O’Banion MK , Pachter J , Pasinetti G , Plata-Salaman C , Rogers J , Rydel R , Shen Y , Streit W , Strohmeyer R , Tooyoma I , Van Muiswinkel FL , Veerhuis R , Walker D , Webster S , Wegrzyniak B , Wenk G , Wyss-Coray T ((2000) ) Inflammation and Alzheimer’s disease. Neurobiol Aging 21: , 383–421. |
[6] | Hensley K ((2010) ) Neuroinflammation in Alzheimer’s disease: Mechanisms, pathologic consequences, and potential for therapeutic manipulation. J Alzheimers Dis 21: , 1–14. |
[7] | Krstic D , Knuesel I ((2013) ) Deciphering the mechanism underlying late-onset Alzheimer disease. Nat Rev Neurol 9: , 25–34. |
[8] | Caraci F , Copani A , Nicoletti F , Drago F ((2010) ) Depression and Alzheimer’s disease: Neurobiological links and common pharmacological targets. Eur J Pharmacol 626: , 64–71. |
[9] | Wuwongse S , Chang RC-C , Law ACK ((2010) ) The putative neurodegenerative links between depression and Alzheimer’s disease. Prog Neurobiol 91: , 362–375. |
[10] | Chi S , Wang C , Jiang T , Zhu X-C , Yu J-T , Tan L ((2015) ) The prevalence of depression in Alzheimer’s disease: A systematic review and meta-analysis. Curr Alzheimer Res 12: , 189–198. |
[11] | Barnes DE , Yaffe K , Byers AL , McCormick M , Schaefer C , Whitmer RA ((2012) ) Midlife vs late-life depressive symptoms and risk of dementia: Differential effects for Alzheimer disease and vascular dementia. Arch Gen Psychiatry 69: , 493–498. |
[12] | Diniz BS , Butters MA , Albert SM , Dew MA , Reynolds CF ((2013) ) Late-life depression and risk of vascular dementia and Alzheimer’s disease: Systematic review and meta-analysis of community-based cohort studies. Br J Psychiatry 202: , 329–335. |
[13] | Ownby RL , Crocco E , Acevedo A , John V , Loewenstein D ((2006) ) Depression and risk for Alzheimer disease:Systematic review, meta-analysis, and metaregression analysis. Arch Gen Psychiatry 63: , 530–538. |
[14] | Van der Mussele S , Fransen E , Struyfs H , Luyckx J , Mariën P , Saerens J , Somers N , Goeman J , De Deyn PP , Engelborghs S ((2014) ) Depression in mild cognitive impairment is associated with progression to Alzheimer’s disease: A longitudinal study. J Alzheimers Dis 42: , 1239–1250. |
[15] | Cerejeira J , Lagarto L , Mukaetova-Ladinska EB ((2012) ) Behavioral and psychological symptoms of dementia. Front Neurol 3: , 73. |
[16] | Margari F , Sicolo M , Spinelli L , Mastroianni F , Pastore A , Craig F , Petruzzelli MG ((2012) ) Aggressive behavior, cognitive impairment, and depressive symptoms in elderly subjects. Neuropsychiatr Dis Treat 8: , 347–353. |
[17] | Rapp MA , Schnaider-Beeri M , Grossman HT , Sano M , Perl DP , Purohit DP , Gorman JM , Haroutunian V ((2006) ) Increased hippocampal plaques and tangles in patients with Alzheimer disease with a lifetime history of major depression. Arch Gen Psychiatry 63: , 161–167. |
[18] | Rapp MA , Schnaider-Beeri M , Purohit DP , Perl DP , Haroutunian V , Sano M ((2008) ) Increased neurofibrillary tangles in patients with Alzheimer disease with comorbid depression. Am J Geriatr Psychiatry 16: , 168–174. |
[19] | Bremmer MA , Beekman ATF , Deeg DJH , Penninx BWJH , Dik MG , Hack CE , Hoogendijk WJG ((2008) ) Inflammatory markers in late-life depression: Results from a population-based study. J Affect Disord 106: , 249–255. |
[20] | Penninx BWJH , Kritchevsky SB , Yaffe K , Newman AB , Simonsick EM , Rubin S , Ferrucci L , Harris T , Pahor M ((2003) ) Inflammatory markers and depressed mood in older persons: Results from the Health, Aging and Body Composition study. Biol Psychiatry 54: , 566–572. |
[21] | Shelton RC , Claiborne J , Sidoryk-Wegrzynowicz M , Reddy R , Aschner M , Lewis DA , Mirnics K ((2011) ) Altered expression of genes involved in inflammation and apoptosis in frontal cortex in major depression. Mol Psychiatry 16: , 751–762. |
[22] | Naudé PJW , Eisel ULM , Comijs HC , Groenewold NA , De Deyn PP , Bosker FJ , Luiten PGM , den Boer JA , Oude Voshaar RC ((2013) ) Neutrophil gelatinase-associated lipocalin: A novel inflammatory marker associated with late-life deression. J Psychosom Res 75: , 444–450. |
[23] | Naudé PJW , Nyakas C , Eiden LE , Ait-Ali D , van der Heide R , Engelborghs S , Luiten PGM , De Deyn PP , den Boer JA , Eisel ULM ((2012) ) Lipocalin 2: Novel component of proinflammatory signaling in Alzheimer’s disease. FASEB J 26: , 2811–2823. |
[24] | Bao G , Clifton M , Hoette TM , Mori K , Deng S-X , Qiu A , Viltard M , Williams D , Paragas N , Leete T , Kulkarni R , Li X , Lee B , Kalandadze A , Ratner AJ , Pizarro JC , Schmidt-Ott KM , Landry DW , Raymond KN , Strong RK , Barasch J ((2010) ) Iron traffics in circulation bound to a siderocalin (Ngal)-catechol complex. Nat Chem Biol 6: , 602–609. |
[25] | Borregaard N , Cowland JB ((2006) ) Neutrophil gelatinase-associated lipocalin, a siderophore-binding eukaryotic protein. Biometals 19: , 211–215. |
[26] | Flower DR ((1996) ) The lipocalin protein family: Structure and function. Biochem J 318: (Pt 1), 1–14. |
[27] | Kjeldsen L , Bainton DF , Sengeløv H , Borregaard N ((1994) ) Identification of neutrophil gelatinase-associated lipocalin as a novel matrix protein of specific granules in human neutrophils. Blood 83: , 799–807. |
[28] | Devireddy LR , Gazin C , Zhu X , Green MR ((2005) ) A cell-surface receptor for lipocalin 24p3 selectively mediates apoptosis and iron uptake. Cell 123: , 1293–1305. |
[29] | Hvidberg V , Jacobsen C , Strong RK , Cowland JB , Moestrup SK , Borregaard N ((2005) ) The endocytic receptor megalin binds the iron transporting neutrophil-gelatinase-associated lipocalin with high affinity and mediates its cellular uptake. FEBS Lett 579: , 773–777. |
[30] | Goetz DH , Holmes MA , Borregaard N , Bluhm ME , Raymond KN , Strong RK ((2002) ) The neutrophil lipocalin NGAL is a bacteriostatic agent that interferes with siderophore-mediated iron acquisition. Mol Cell 10: , 1033–1043. |
[31] | Jha MK , Lee S , Park DH , Kook H , Park K-G , Lee I-K , Suk K ((2015) ) Diverse functional roles of lipocalin-2 in the central nervous system. Neurosci Biobehav Rev 49: , 135–156. |
[32] | Ip JPK , Noçon AL , Hofer MJ , Lim SL , Müller M , Campbell IL ((2011) ) Lipocalin 2 in the central nervous system host response to systemic lipopolysaccharide administration. J Neuroinflammation 8: , 124. |
[33] | Mucha M , Skrzypiec AE , Schiavon E , Attwood BK , Kucerova E , Pawlak R ((2011) ) Lipocalin-2 controls neuronal excitability and anxiety by regulating dendritic spine formation and maturation. Proc Natl Acad Sci U S A 108: , 18436–18441. |
[34] | Choi J , Lee H-W , Suk K ((2011) ) Increased plasma levels of lipocalin 2 in mild cognitive impairment. J Neurol Sci 305: , 28–33. |
[35] | Sunderland T , Linker G , Mirza N , Putnam KT , Friedman DL , Kimmel LH , Bergeson J , Manetti GJ , Zimmermann M , Tang B , Bartko JJ , Cohen RM ((2003) ) Decreased beta-amyloid1-42 and increased tau levels in cerebrospinal fluid of patients with Alzheimer disease. JAMA 289: , 2094–2103. |
[36] | Naudé PJW , den Boer JA , Comijs HC , Bosker FJ , Zuidersma M , Groenewold NA , De Deyn PP , Luiten PGM , Eisel ULM , Oude Voshaar RC ((2014) ) Sex-specific associations between Neutrophil Gelatinase-Associated Lipocalin (NGAL) and cognitive domains in late-life depression. Psychoneuroendocrinology 48: , 169–177. |
[37] | Lee S , Park J-Y , Lee W-H , Kim H , Park H-C , Mori K , Suk K ((2009) ) Lipocalin-2 is an autocrine mediator of reactive astrocytosis. J Neurosci 29: , 234–249. |
[38] | Mesquita SD , Ferreira AC , Falcao AM , Sousa JC , Oliveira TG , Correia-Neves M , Sousa N , Marques F , Palha JA ((2014) ) Lipocalin 2 modulates the cellular response to amyloid beta. Cell Death Differ 21: , 1588–1599. |
[39] | Jang E , Kim J-H , Lee S , Kim J-H , Seo J-W , Jin M , Lee M-G , Jang I-S , Lee W-H , Suk K ((2013) ) Phenotypic polarization of activated astrocytes: The critical role of lipocalin-2 in the classical inflammatory activation of astrocytes. J Immunol 191: , 5204–5219. |
[40] | Jang E , Lee S , Kim J-H , Kim J-H , Seo J-W , Lee W-H , Mori K , Nakao K , Suk K ((2013) ) Secreted protein lipocalin-2 promotes microglial M1 polarization. FASEB J 27: , 1176–1190. |
[41] | Rathore KI , Berard JL , Redensek A , Chierzi S , Lopez-Vales R , Santos M , Akira S , David S ((2011) ) Lipocalin 2 plays an immunomodulatory role and has detrimental effects after spinal cord injury. J Neurosci 31: , 13412–13419. |
[42] | McIntyre C , Harper I , Macdougall IC , Raine AE , Williams A , Baker LR ((1997) ) Serum C-reactive protein as a marker for infection and inflammation in regular dialysis patients. Clin Nephrol 48: , 371–374. |
[43] | Vermeiren Y , Van Dam D , Aerts T , Engelborghs S , Martin J-J , De Deyn PP ((2015) ) The monoaminergic footprint of depression and psychosis in dementia with Lewy bodies compared to Alzheimer’s disease. Alzheimers ResTher 7: , 7. |
[44] | Vermeiren Y , Van Dam D , Aerts T , Engelborghs S , De Deyn PP ((2014) ) Monoaminergic neurotransmitter alterations in postmortem brain regions of depressed and aggressive patients with Alzheimer’s disease. Neurobiol Aging 35: , 2691–2700. |
[45] | Montine TJ , Phelps CH , Beach TG , Bigio EH , Cairns NJ , Dickson DW , Duyckaerts C , Frosch MP , Masliah E , Mirra SS , Nelson PT , Schneider JA , Thal DR , Trojanowski JQ , Vinters HV , Hyman BT , National Institute on Aging, Alzheimer’s Association ((2012) ) National Institute on Aging-Alzheimer’s Association guidelines for the neuropathologic assessment of Alzheimer’s disease: A practical approach. Acta Neuropathol (Berl) 123: , 1–11. |
[46] | Alexopoulos GS , Abrams RC , Young RC , Shamoian CA ((1988) ) Cornell scale for depression in dementia. Biol Psychiatry 23: , 271–284. |
[47] | De Deyn PP , Engelborghs S , Saerens J , Goeman J , Mariën P , Maertens K , Nagels G , Martin J-J , Pickut BA ((2005) ) The Middelheim Frontality Score: A behavioural assessment scale that discriminates frontotemporal dementia from Alzheimer’s disease. Int J Geriatr Psychiatry 20: , 70–79. |
[48] | DeKosky ST , Scheff SW ((1990) ) Synapse loss in frontal cortex biopsies in Alzheimer’s disease: Correlation with cognitive severity. Ann Neurol 27: , 457–464. |
[49] | Thal DR , Rüb U , Orantes M , Braak H ((2002) ) Phases of A beta-deposition in the human brain and its relevance for the development of AD. Neurology 58: , 1791–1800. |
[50] | Jay TM , Witter MP ((1991) ) Distribution of hippocampal CA1 and subicular efferents in the prefrontal cortex of the rat studied by means of anterograde transport of Phaseolus vulgaris-leucoagglutinin. J Comp Neurol 313: , 574–586. |
[51] | Li M , Long C , Yang L ((2015) ) Hippocampal-prefrontal circuit and disrupted functional connectivity in psychiatric and neurodegenerative disorders. Biomed Res Int 2015: , 810548. |
[52] | Nakamura H , Katayama Y , Kawakami Y ((2010) ) Hippocampal CA1/subiculum-prefrontal cortical pathways induce plastic changes of nociceptive responses in cingulate and prelimbic areas. BMC Neurosci 11: , 100. |
[53] | Tadayonnejad R , Ajilore O ((2014) ) Brain network dysfunction in late-life depression: A literature review. J Geriatr Psychiatry Neurol 27: , 5–12. |
[54] | Thomas AJ , Perry R , Kalaria RN , Oakley A , McMeekin W , O’Brien JT ((2003) ) Neuropathological evidence for ischemia in the white matter of the dorsolateral prefrontal cortex in late-life depression. Int J Geriatr Psychiatry 18: , 7–13. |
[55] | Wen M-C , Steffens DC , Chen M-K , Zainal NH ((2014) ) Diffusion tensor imaging studies in late-life depression: Systematic review and meta-analysis. Int J Geriatr Psychiatry 29: , 1173–1184. |
[56] | Engelborghs S , Maertens K , Mariën P , Vloeberghs E , Somers N , Nagels G , De Deyn PP ((2006) ) Behavioural and neuropsychological correlates of frontal lobe features in dementia. Psychol Med 36: , 1173–1182. |
[57] | Zhang Y , Foncea R , Deis JA , Guo H , Bernlohr DA , Chen X ((2014) ) Lipocalin 2 expression and secretion is highly regulated by metabolic stress, cytokines, and nutrients in adipocytes. PloS One 9: , e96997. |
[58] | Dietrich MO , Spuch C , Antequera D , Rodal I , de Yébenes JG , Molina JA , Bermejo F , Carro E ((2008) ) Megalin mediates the transport of leptin across the blood-CSF barrier. Neurobiol Aging 29: , 902–912. |
[59] | Alvira-Botero X , Carro EM ((2010) ) Clearance of amyloid-β peptide across the choroid plexus in Alzheimer’s disease. Curr Aging Sci 3: , 219–229. |
[60] | Hammad SM , Ranganathan S , Loukinova E , Twal WO , Argraves WS ((1997) ) Interaction of apolipoproteinJ-amyloid beta-peptide complex with low density lipoprotein receptor-related protein-2/megalin. A mechanism to prevent pathological accumulation of amyloid beta-peptide. J Biol Chem 272: , 18644–18649. |
[61] | Sancesario GM , Cencioni MT , Esposito Z , Borsellino G , Nuccetelli M , Martorana A , Battistini L , Sorge R , Spalletta G , Ferrazzoli D , Bernardi G , Bernardini S , Sancesario G ((2012) ) The load of amyloid-β oligomers is decreased in the cerebrospinal fluid of Alzheimer’s disease patients. J Alzheimers Dis 31: , 865–878. |
[62] | Zlokovic BV ((1996) ) Cerebrovascular transport of Alzheimer’s amyloid beta and apolipoproteins J and E: Possible anti-amyloidogenic role of the blood-brain barrier. Life Sci 59: , 1483–1497. |
[63] | Zlokovic BV , Martel CL , Matsubara E , McComb JG , Zheng G , McCluskey RT , Frangione B , Ghiso J ((1996) ) Glycoprotein 330/megalin: robable role in receptor-mediated transport of apolipoprotein J alone and in a complex with Alzheimer disease amyloid beta at the blood-brain and blood-cerebrospinal fluid barriers. Proc Natl Acad SciU S A 93: , 4229–4234. |
[64] | Alvira-Botero X , Pérez-Gonzalez R , Spuch C , Vargas T , Antequera D , Garzón M , Bermejo-Pareja F , Carro E ((2010) ) Megalin interacts with APP and the intracellular adapter protein FE65 in neurons. Mol Cell Neurosci 45: , 306–315. |
[65] | Kjeldsen L , Johnsen AH , Sengeløv H , Borregaard N ((1993) ) Isolation and primary structure of NGAL, a novel protein associated with human neutrophil gelatinase. J Biol Chem 268: , 10425–10432. |
[66] | Pedersen KR , Ravn HB , Hjortdal VE , Nørregaard R , Povlsen JV ((2010) ) Neutrophil gelatinase-associated lipocalin (NGAL): Validation of commercially available ELISA. Scand J Clin Lab Invest 70: , 374–382. |
[67] | Bi F , Huang C , Tong J , Qiu G , Huang B , Wu Q , Li F , Xu Z , Bowser R , Xia X-G , Zhou H ((2013) ) Reactive astrocytes secrete lcn2 to promote neuron death. Proc Natl Acad SciU S A 110: , 4069–4074. |
Figures and Tables
Fig.1
NGAL levels in nine different brain regions of control, AD–D, and AD+D patients, as assessed by western blot. Brain regions included (A) hippocampus, (B) amygdala, (C) thalamus, (D) BA9, (E) BA10, (F) BA11, (G) BA24, (H) BA22, and (I) cerebellum. Bars indicate the mean ratio between NGAL and the internal control protein actin, ±SEM. AD–D, Alzheimer’s disease without co-existing depression; AD+D, Alzheimer’s disease with co-existing depression; BA, Brodmann area.
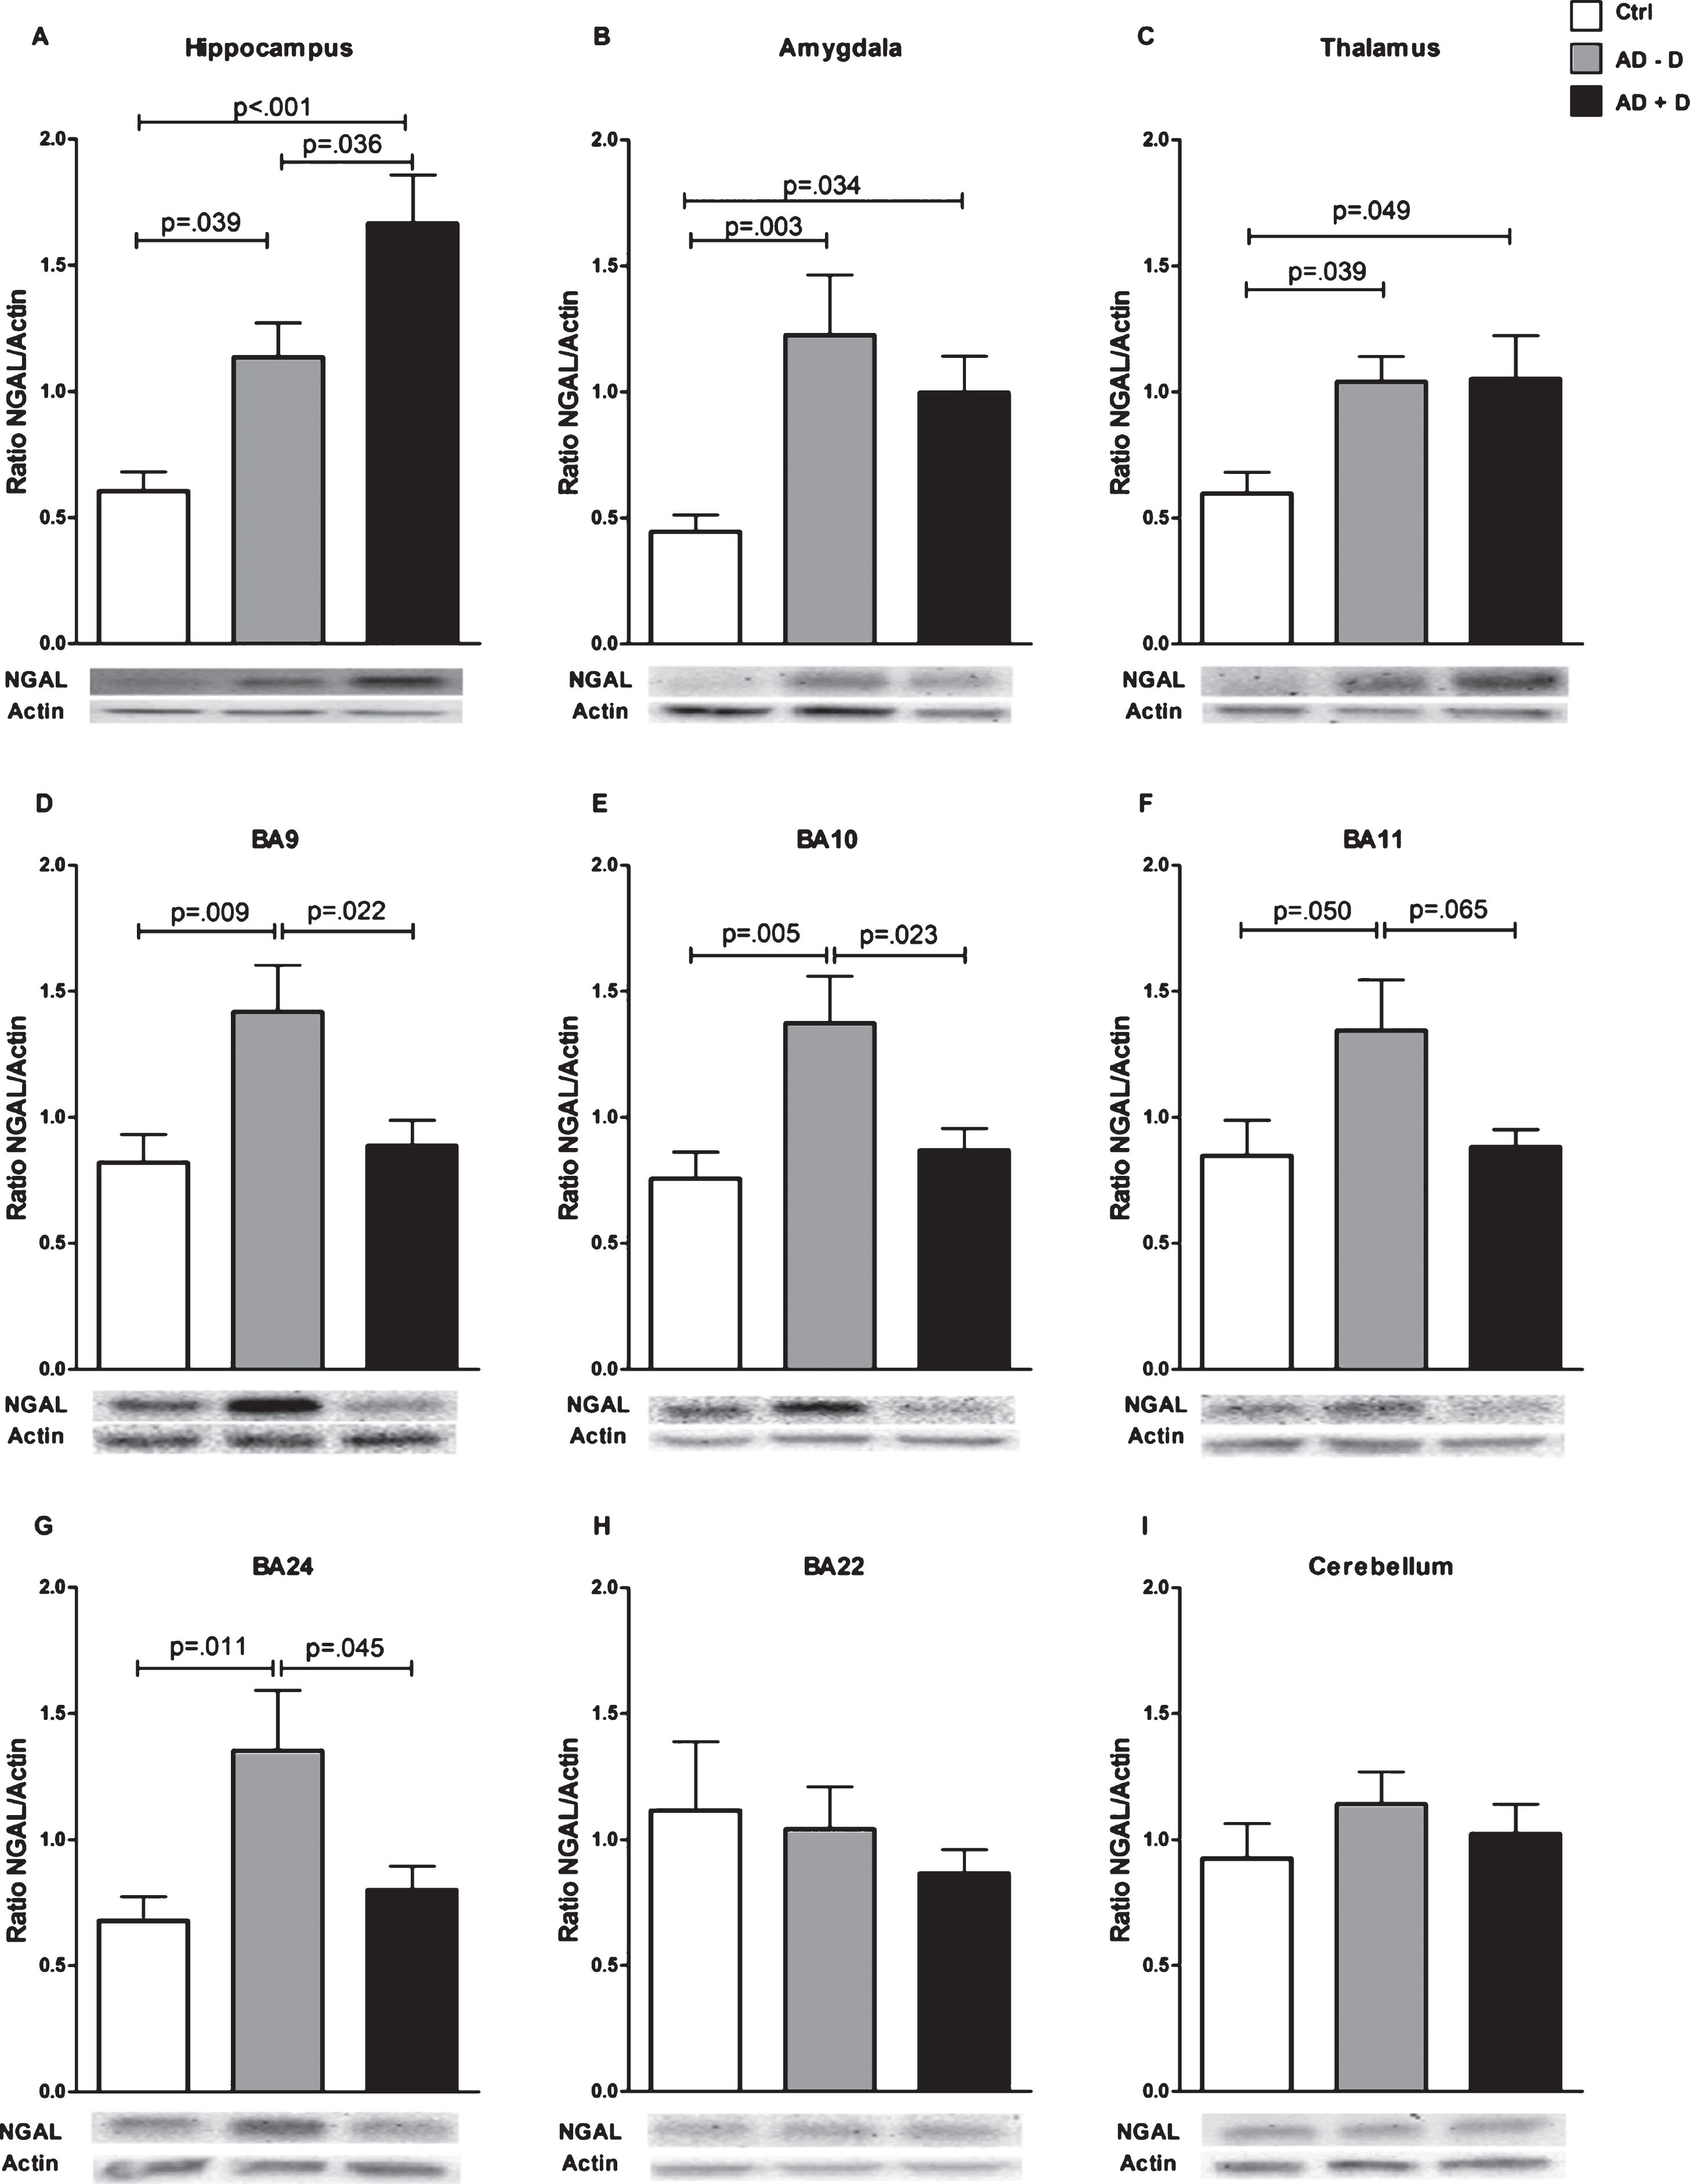
Fig.2
Pearson correlation between hippocampal NGAL levels and CSDD depression score, in all AD patients. r = 0.359 and p = 0.027.
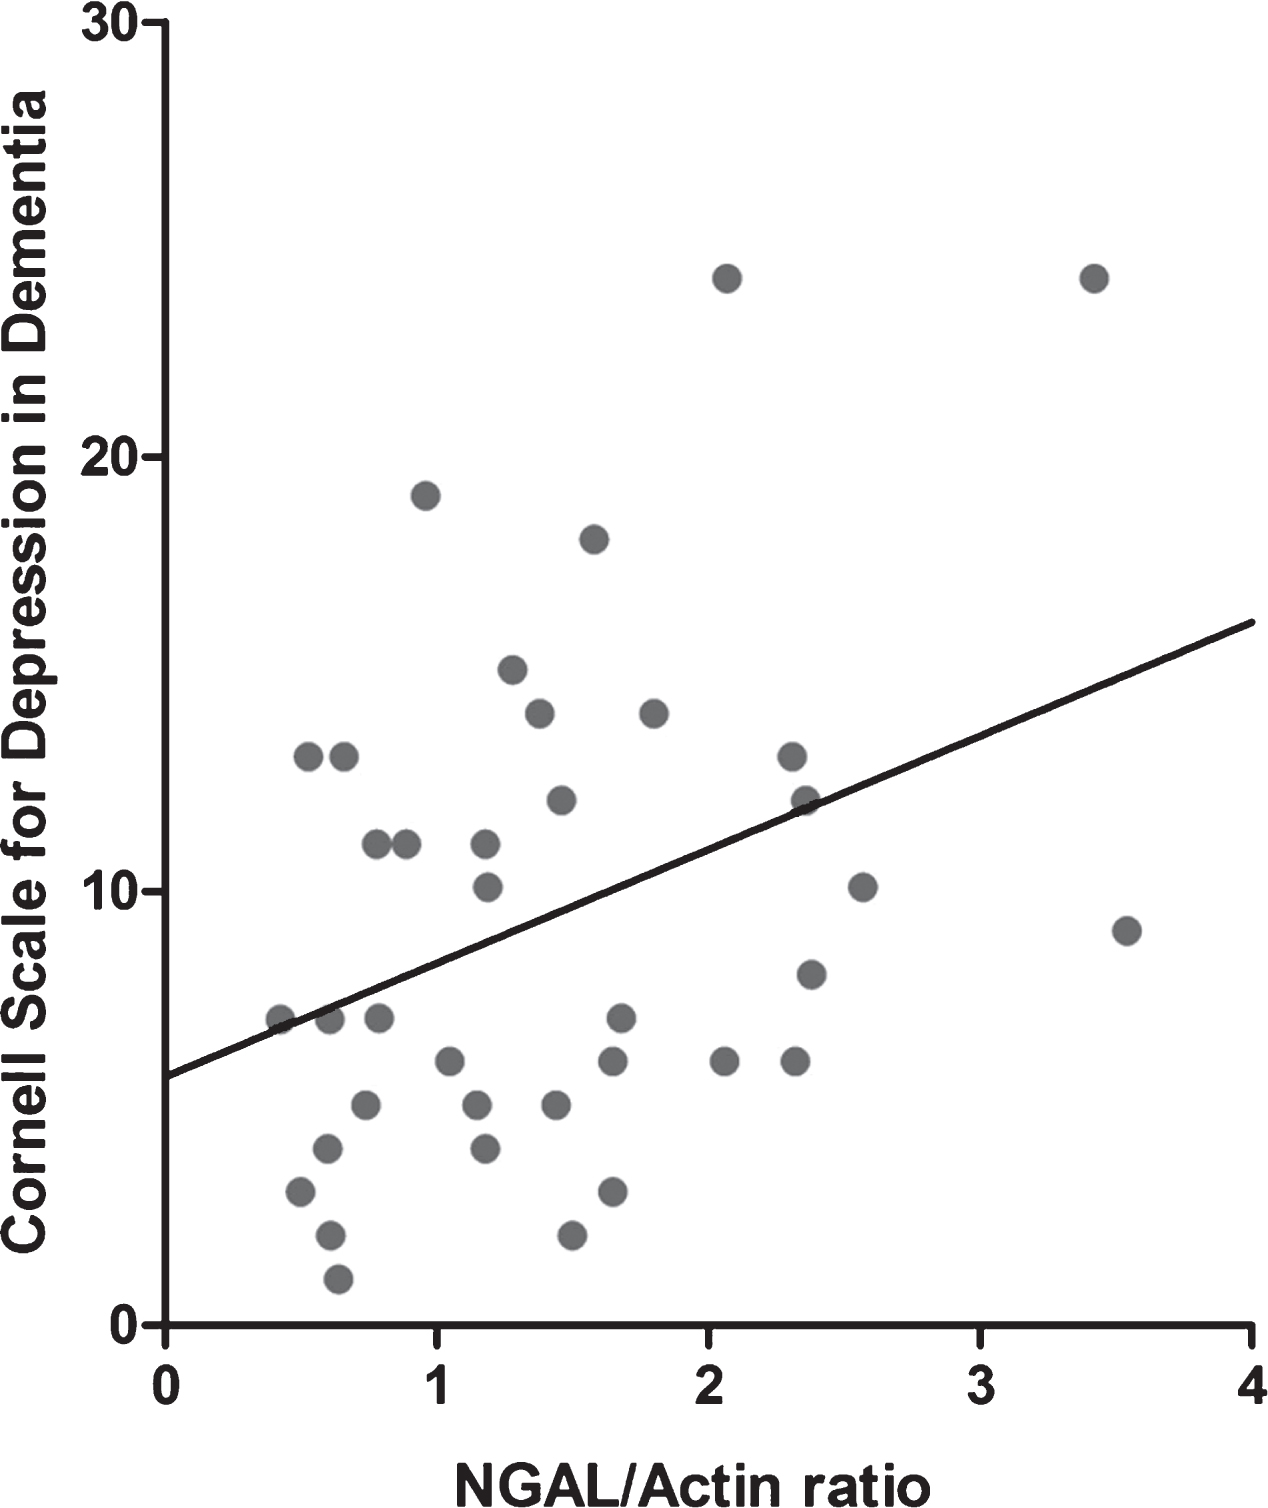
Fig.3
Double stainings for NGAL with Iba1 (A-C), GFAP (D-F), and NeuN (G-I), in AD hippocampal human brain sections. Scale bar: 25 μm.
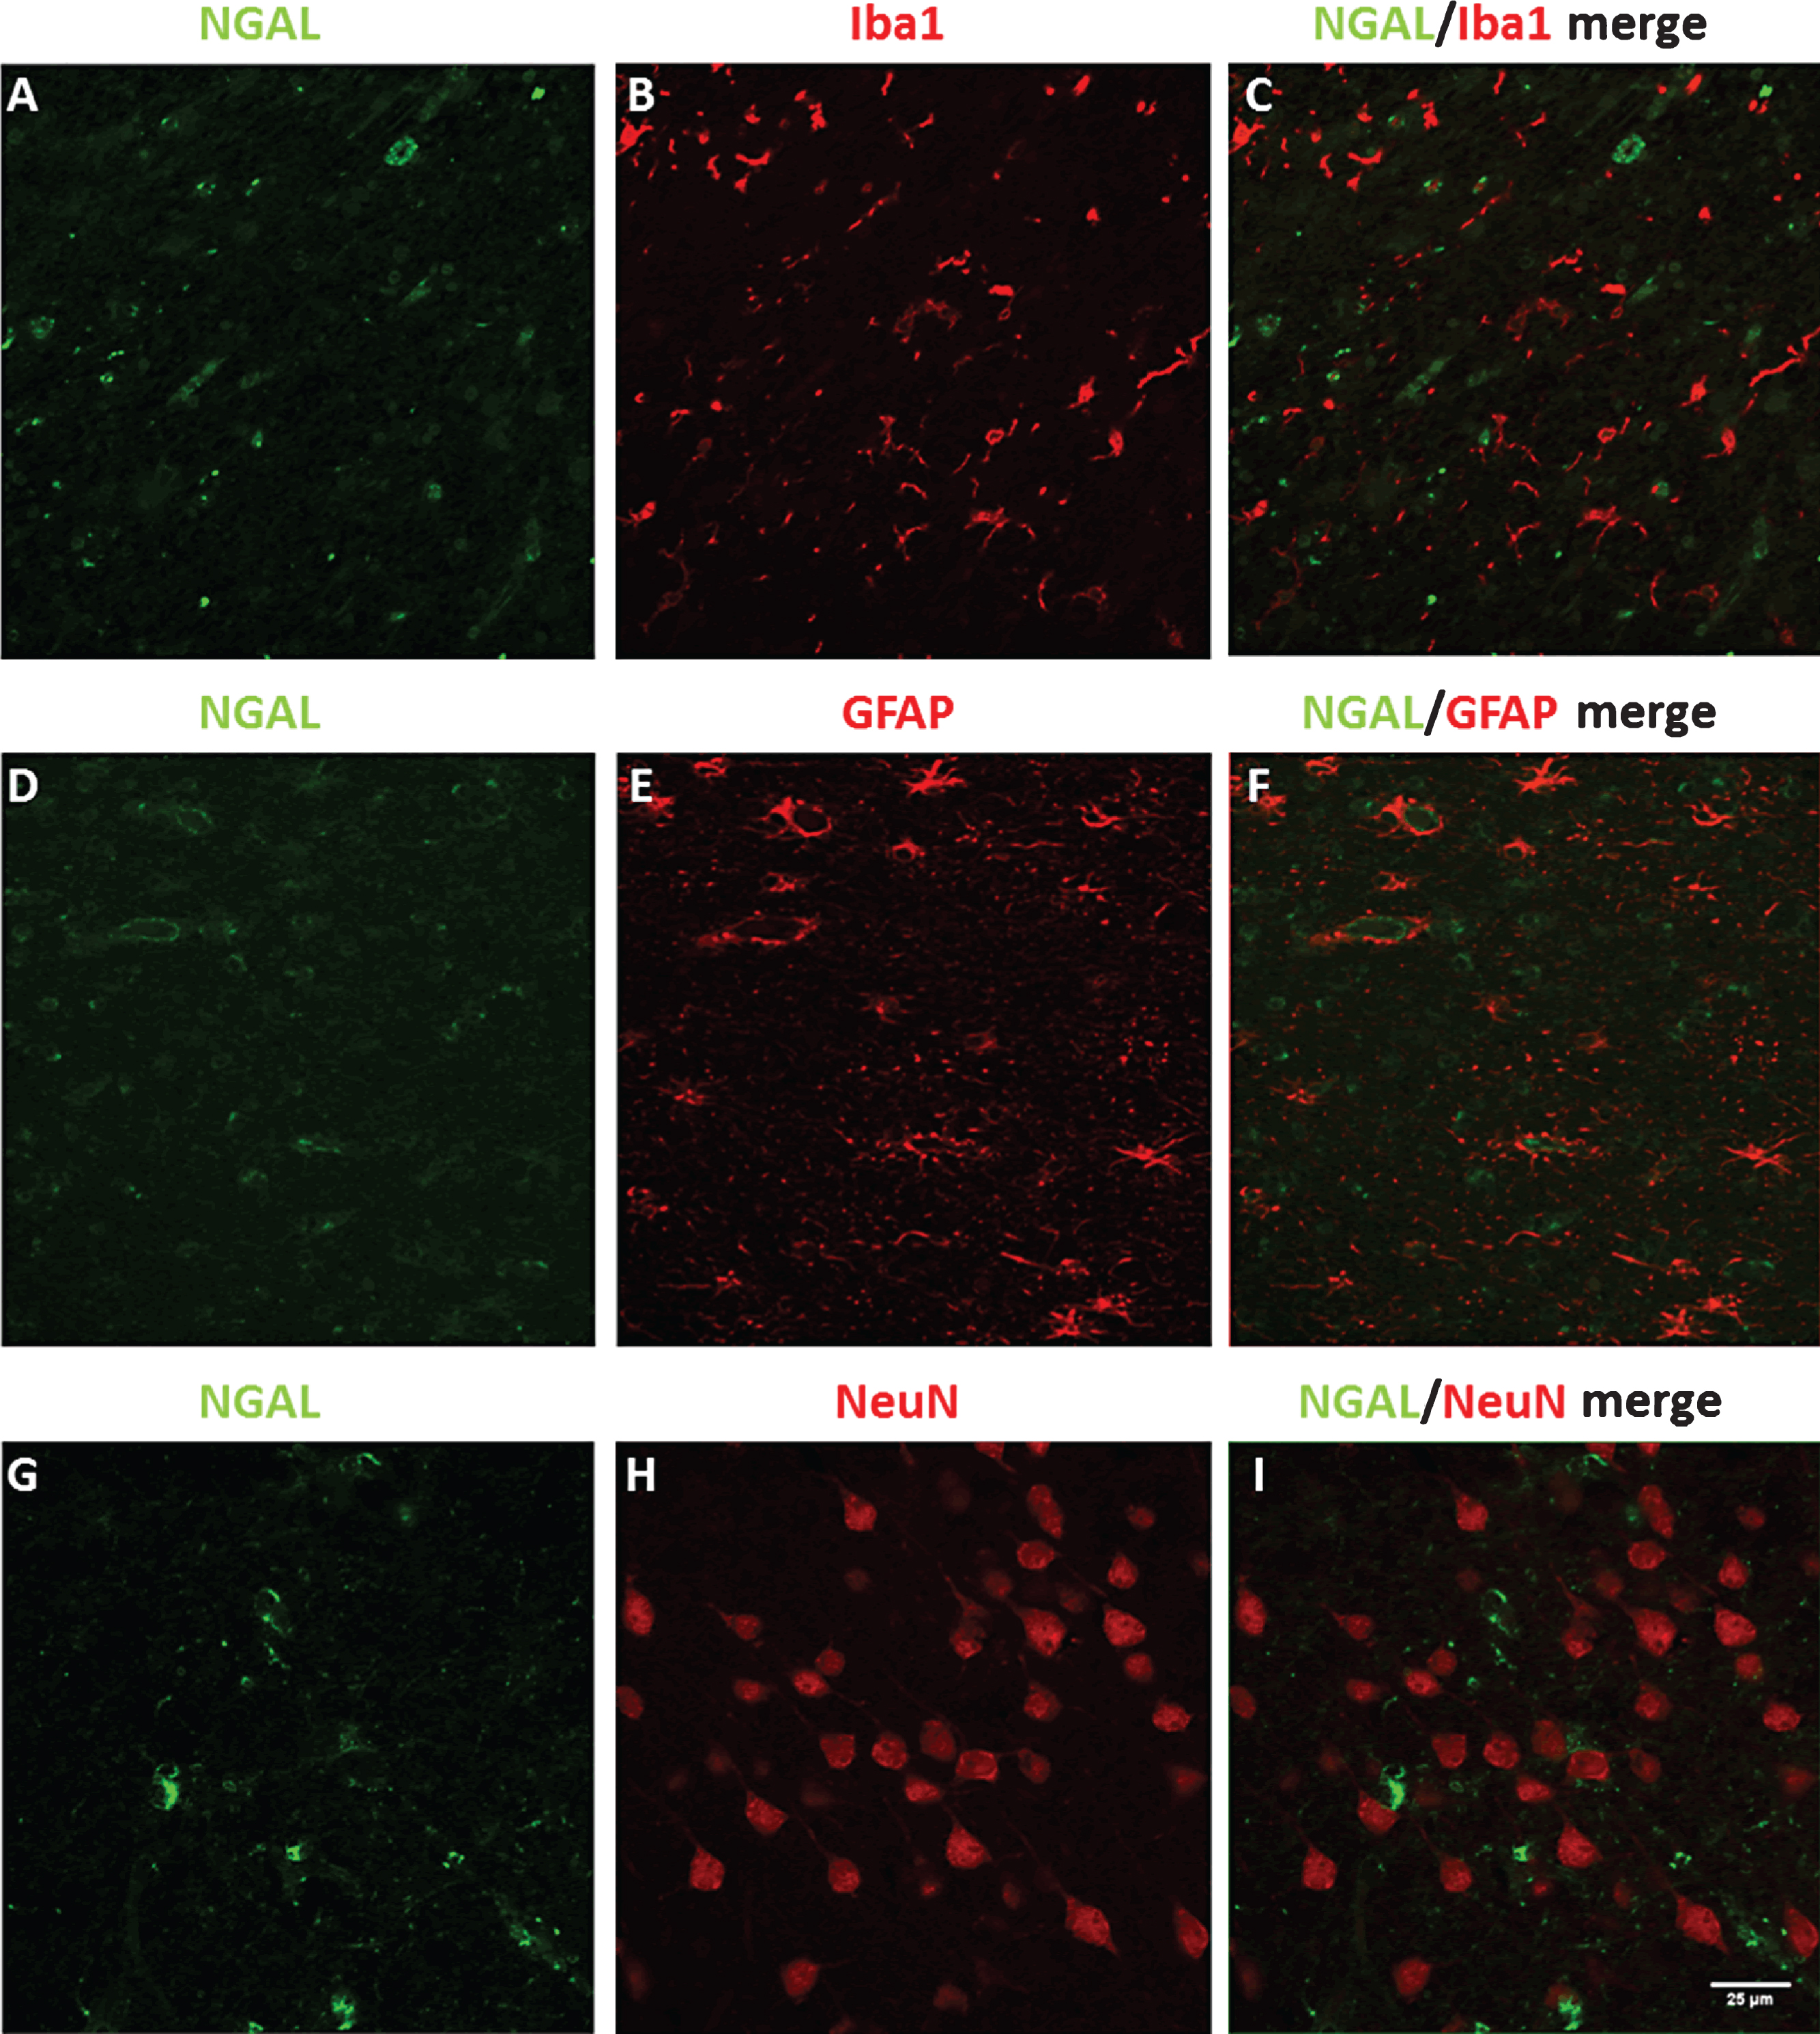
Fig.4
NGAL levels in human (A) serum and (B) CSF of control, AD–D, and AD+D patients, as measured by ELISA. Bars indicate mean protein concentration in ng/ml (for serum) and pg/ml (for CSF). Error bars represent SEM. **p = 0.001, ***p < 0.001. AD–D, Alzheimer’s disease without co-existing depression; AD+D, Alzheimer’s disease with co-existing depression.
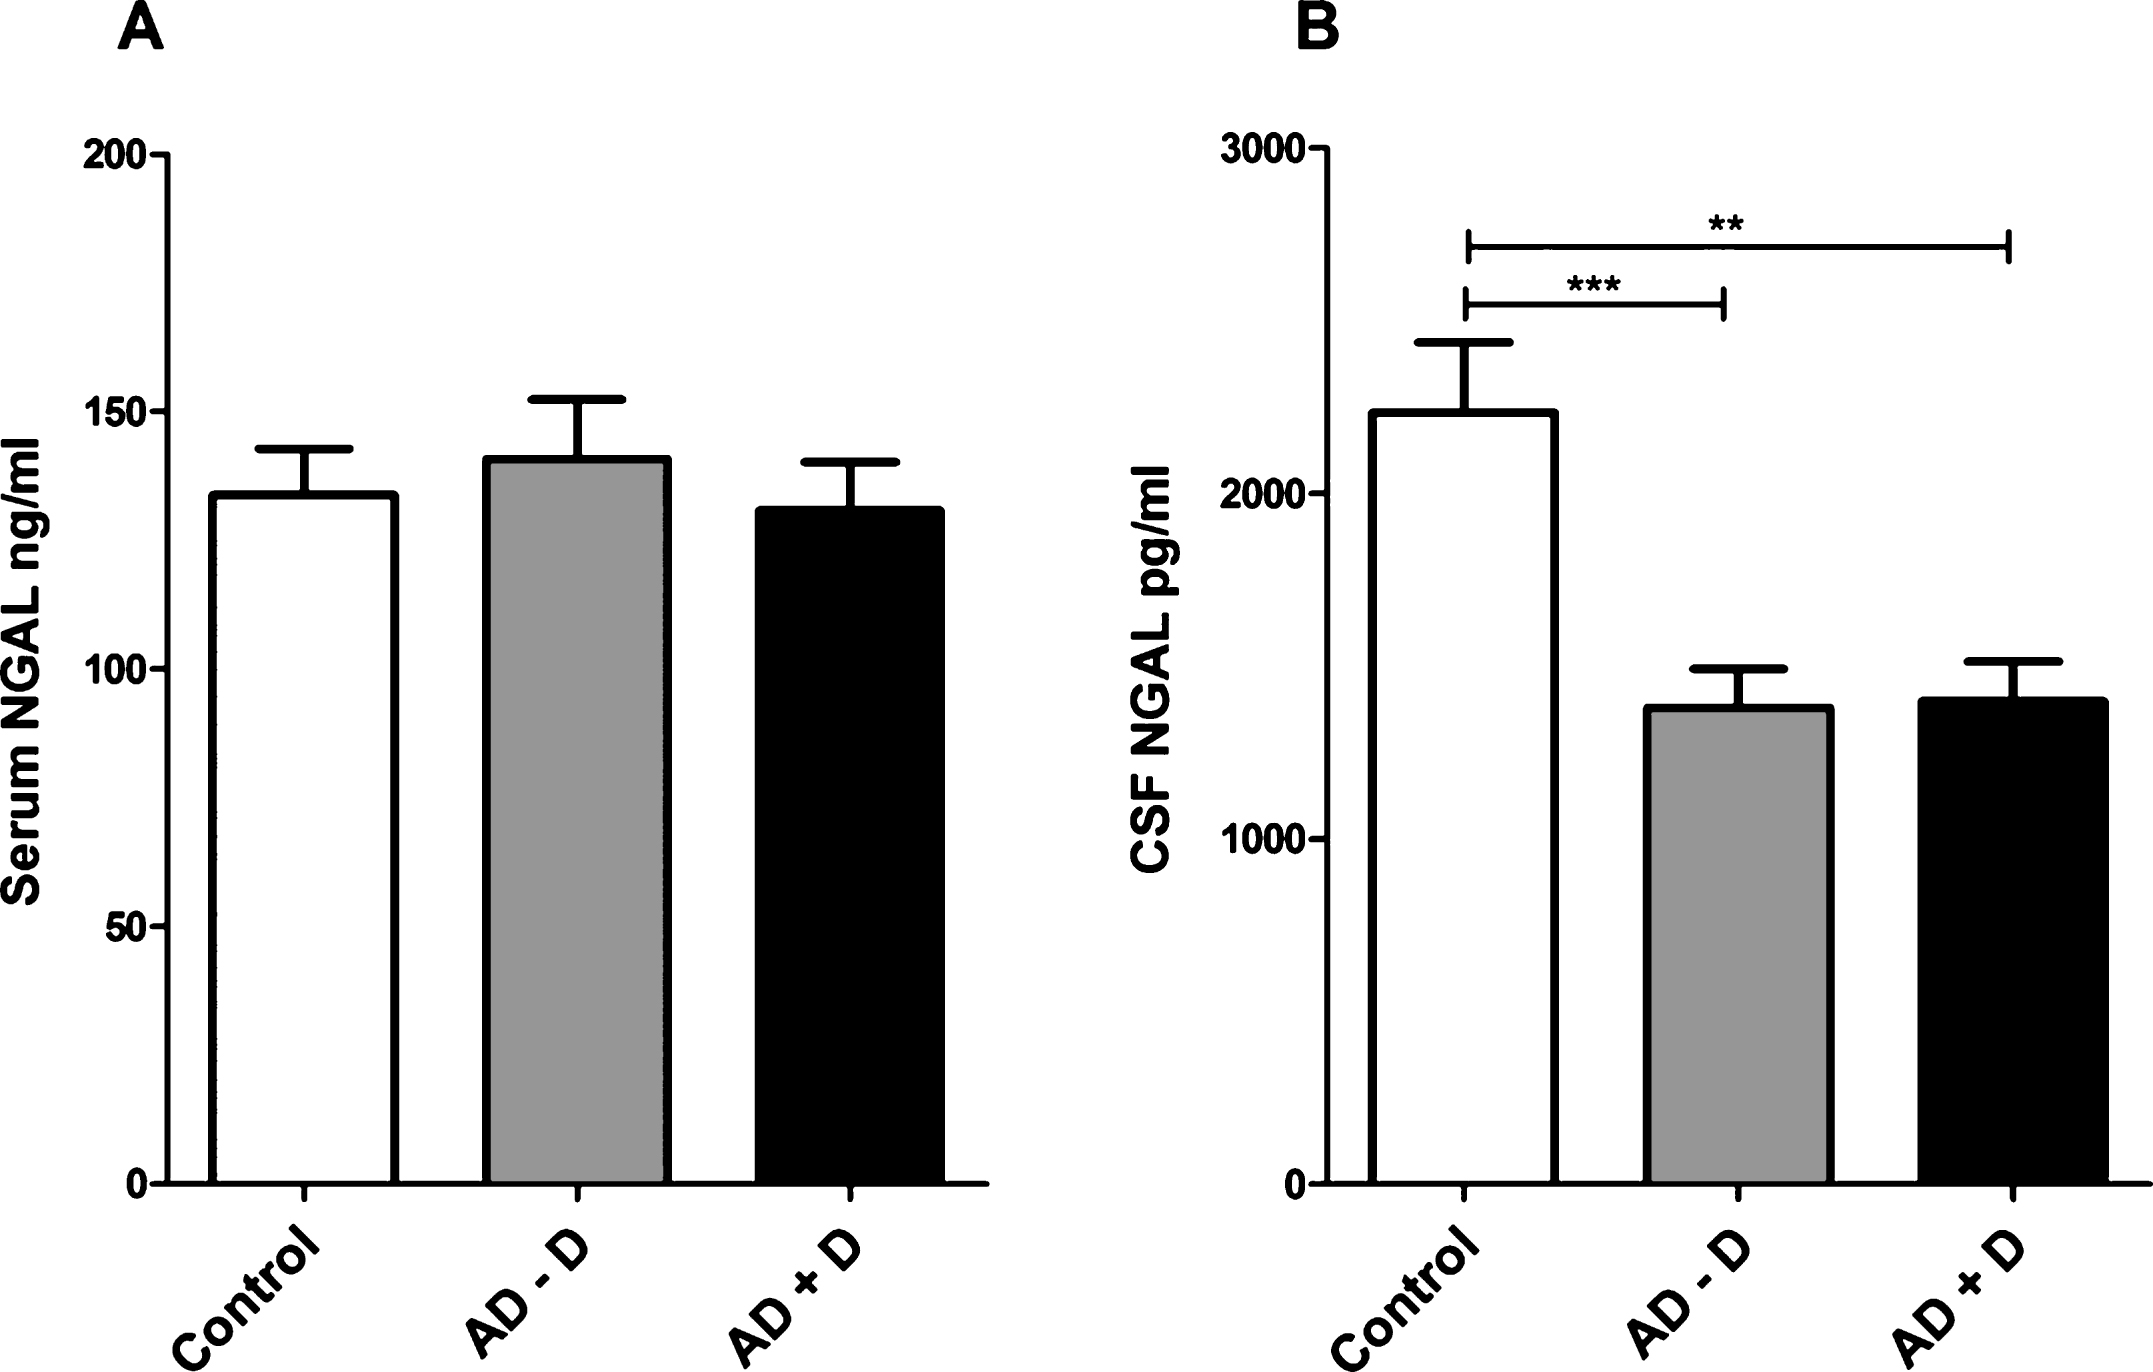
Fig.5
Megalin levels in (A) BA11 and the (B) amygdala of control, AD–D, and AD+D patients. Bars indicate the mean megalin/actin ratio, ±SEM. AD–D, Alzheimer’s disease without co-existing depression; AD+D, Alzheimer’s disease with co-existing depression; BA, Brodmann area.
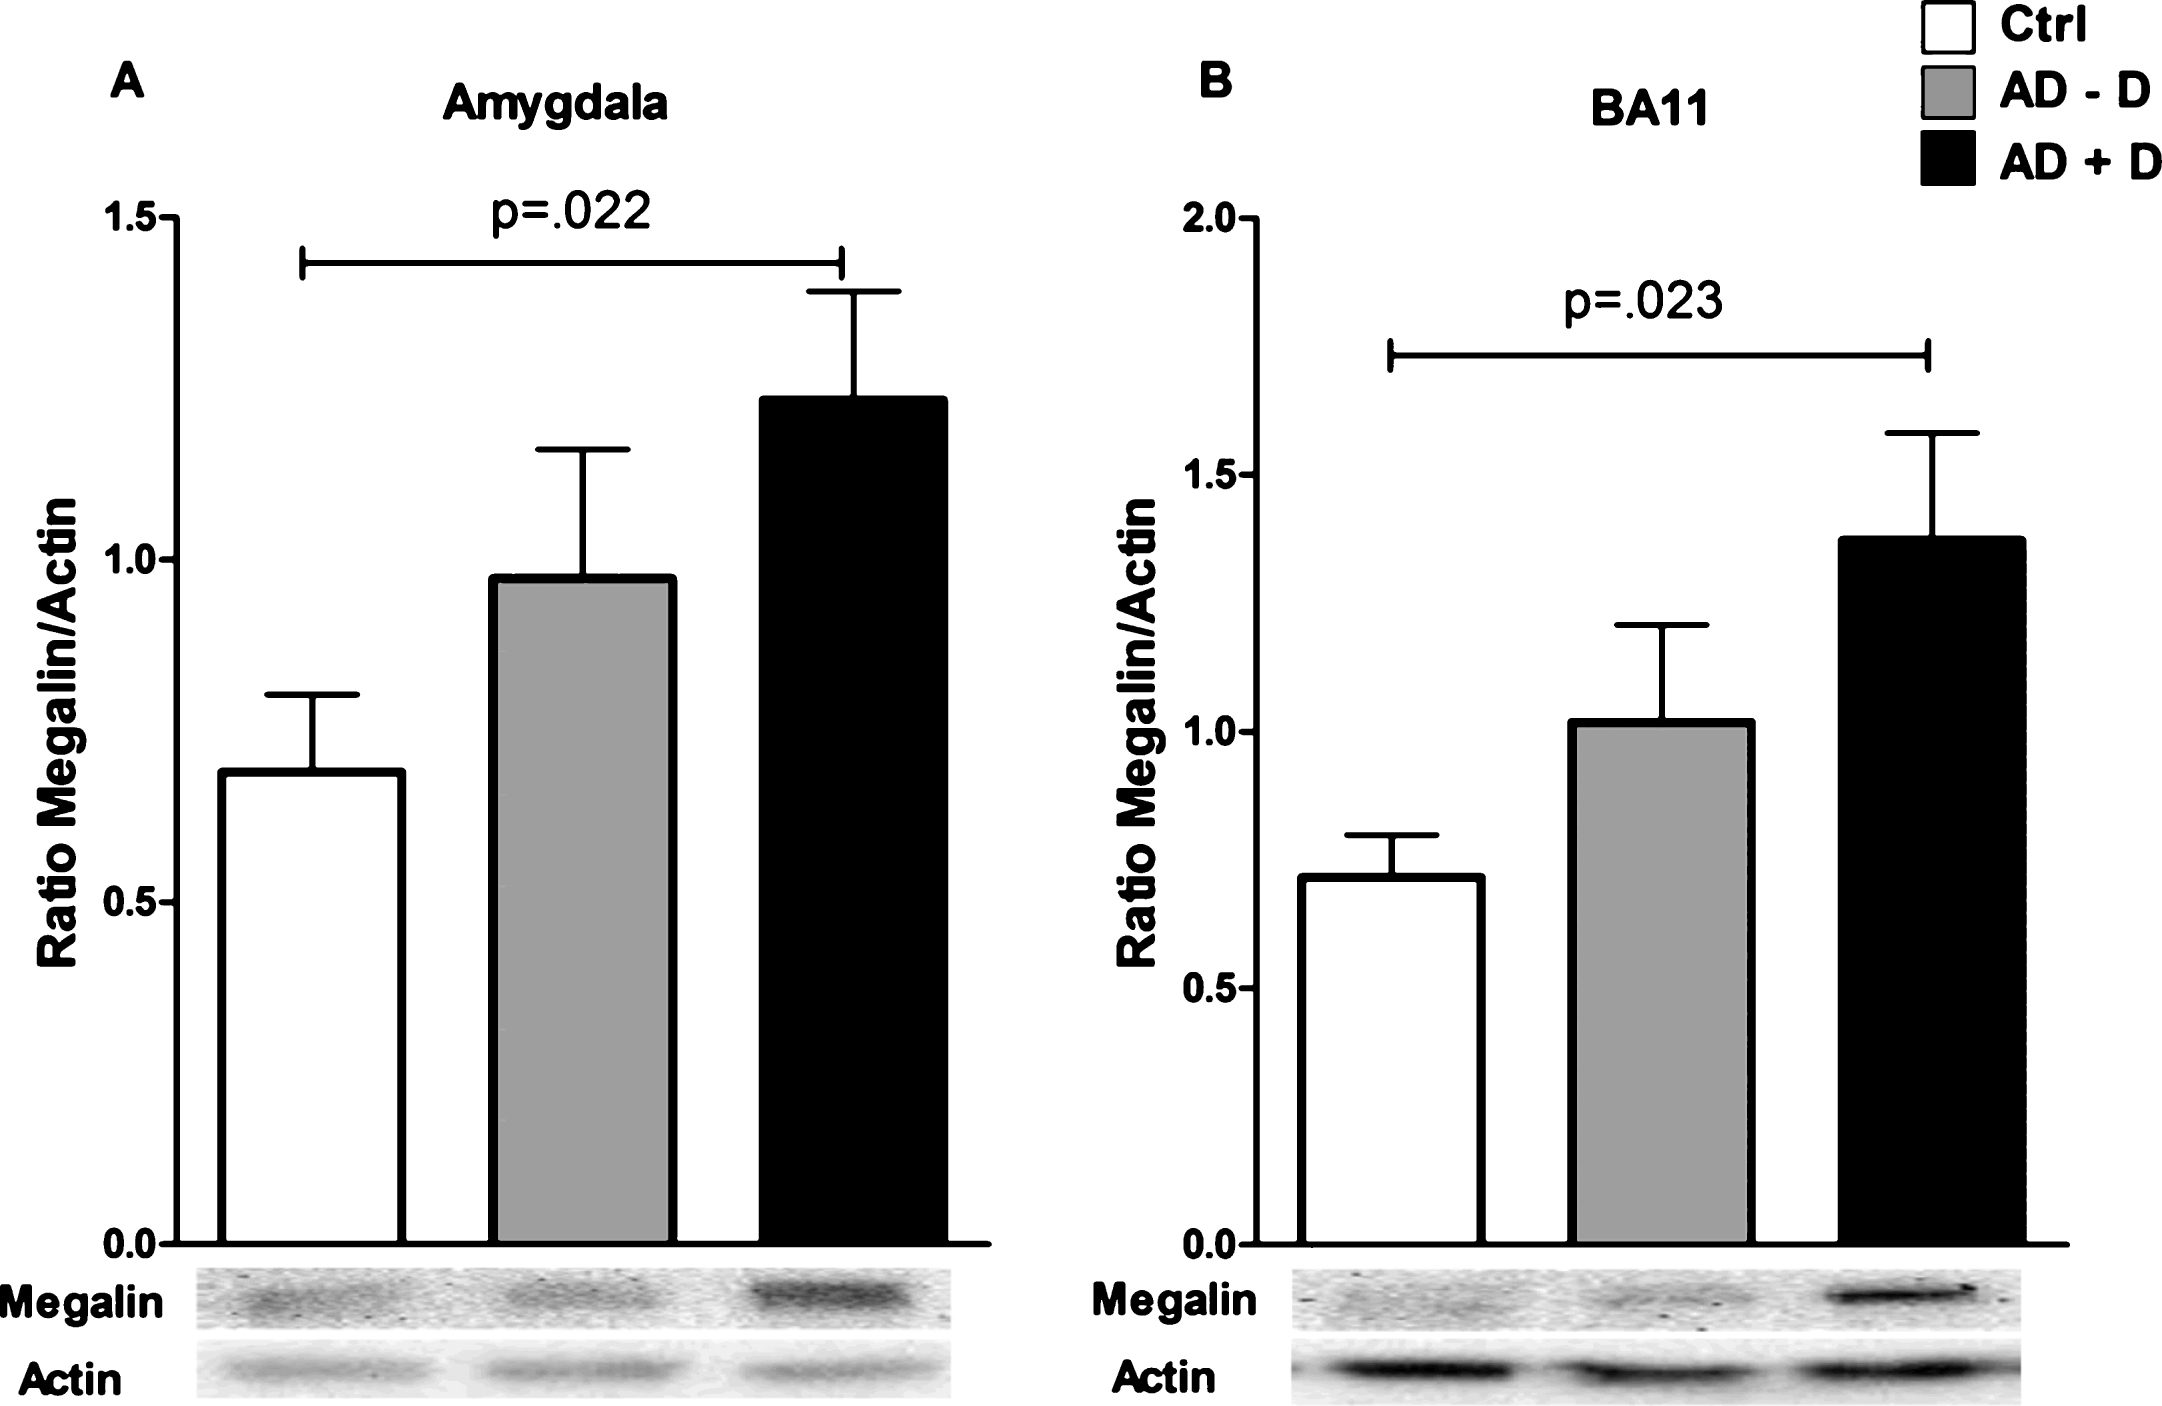
Fig.6
Known and potential triggers of NGAL expression in the hippocampus, with effects of hippocampal NGAL that may hypothetically contribute to pathophysiological processes of AD and depression.
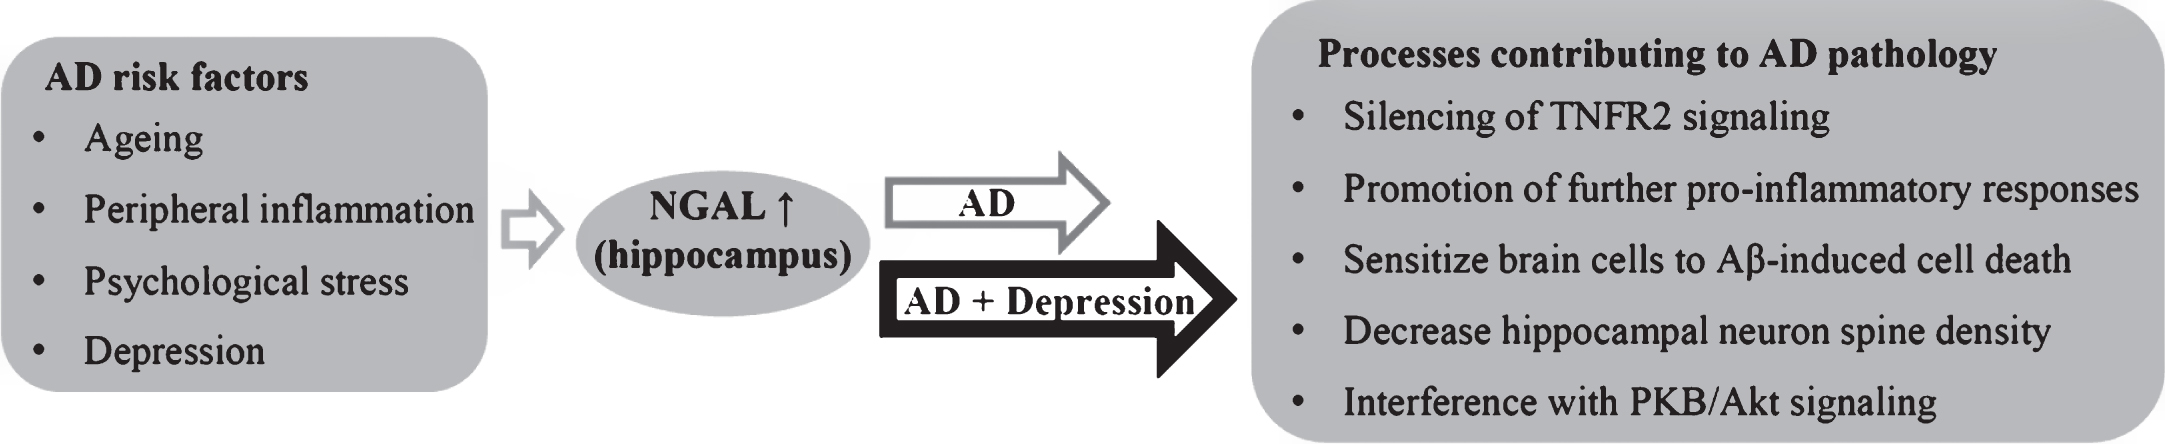
Table 1
Patient demographics, behavioral and cognitive symptoms, and use of anti-depressant medication (administered no more than one daybefore death)
| Parameter | |||
| Serum | Control (n = 40) | AD –D (n = 40) | AD + D (n = 40) |
| Gender, female, n (%) | 20 (50) | 20 (50) | 20 (50) |
| Age (years), mean (SD) | 78.33 (7.19) | 79.50 (9.20) | 79.35 (8.69) |
| CSDD scale, mean (SD) | 2.83 (2.48) | 3.80 (2.15) | 11.05 (2.57) |
| MMSE, mean (SD) | 28.00 (1.62) | 14.97 (6.54) | 12.54 (6.86) |
| Anti-depressant medication, n (%) | 5 (12.5) | 8 (20) | 16 (40) |
| CRP (mg/L), mean (SD) | 9.43 (19.24) | 20.91 (32.38) | 22.78 (36.02) |
| Cerebrospinal Fluid | Control (n = 26) | AD –D (n = 40) | AD + D (n = 40) |
| Gender, female, n (%) | 13 (50) | 20 (50) | 20 (50) |
| Age (years), mean (SD) | 78.90 (5.74) | 79.50 (9.20) | 79.35 (8.69) |
| CSDD, mean (SD) | N.D. | 3.80 (2.15) | 11.05 (2.57) |
| MMSE, mean (SD) | N.D. | 14.97 (6.54) | 12.54 (6.86) |
| Anti-depressant medication, n (%) | N.D. | 8 (20) | 16 (40) |
| Brain tissue | Control (n = 19) | AD –D (n = 19) | AD + D (n = 21) |
| Gender, female, n (%) | 7 (36.84) | 7 (36.84) | 8 (38.10) |
| Age (years), mean (SD) | 73.04 (9.24) | 83.25 (9.09) | 77.74 (10.18) |
| Braak stage, mean (SD) | 0.06 (0.25) | 4.15 (1.02) | 4.58 (1.12) |
| CSDD, mean (SD) | N.D. | 4.74 (1.88) | 13.33 (4.52) |
| Anti-depressant medication, n (%) | 4 (21.05) | 3 (15.79) | 10 (47.62) |
AD–D, Alzheimer’s disease without co-existing depression; AD+D, Alzheimer’s disease with co-existing depression; n, number of patients; SD, standard deviation; N.D., not determined; CSDD, Cornell Scale for Depression in Dementia; MMSE, Mini-Mental State Examination.
Table 2
Correlations between brain levels of NGAL, megalin, and 24p3R
| BA 9 | BA 10 | BA 11 | BA 22 | BA 24 | Cerebellum | Amygdala | Hippocampus | Thalamus | |
| 1 | r = –0.153 | r = 0.016 | r = 0.117 | r = 0.327 | r = –0.096 | r = 0.065 | r = –0.063 | r = 0.159 | r = 0.369 |
| p = 0.259 | p = 0.905 | p = 0.406 | p = 0.026 | p = 0.490 | p = 0.624 | p = 0.659 | p = 0.266 | p = 0.009 | |
| 2 | r = –0.155 | r = 0.005 | r = –0.264 | r = 0.001 | r = –0.193 | r = 0.037 | r = –0.035 | r = –0.057 | r = 0.049 |
| p = 0.254 | p = 0.968 | p = 0.054 | p = 0.995 | p = 0.161 | p = 0.783 | p = 0.814 | p = 0.685 | p = 0.733 | |
| 3 | r = 0.363 | r = 0.238 | r = 0.148 | r = 0.206 | r = 0.338 | r = 0.359 | r = 0.000 | r = 0.510 | r = 0.369 |
| p = 0.006 | p = 0.077 | p = 0.296 | p = 0.179 | p = 0.012 | p = 0.006 | p = 0.999 | p < 0.001 | p = 0.008 |
Pearson correlations in all nine brain regions between: 1) NGAL with megalin (whole population), 2) NGAL with 24p3R (whole population), and 3) Megalin with 24p3R (whole population). Significant correlations are written in bold. BA, Brodmann area. For correction of multiple comparisons, a p-value of less than 0.006 was considered significant.
Table 3
Correlations between the Middelheim Frontality score (MFS) and AD brain levels of NGAL, megalin, and 24p3R
| BA 9 | BA 10 | BA 11 | BA 22 | BA 24 | Cerebellum | Amygdala | Hippocampus | Thalamus | |
| 1 | r = –0.373 | r = –0.452 | r = –0.375 | r = –0.057 | r = –0.399 | r = –0.018 | r = –0.057 | r = 0.078 | r = 0.152 |
| p = 0.023 | p = 0.005 | p = 0.022 | p = 0.736 | p = 0.016 | p = 0.913 | p = 0.754 | p = 0.648 | p = 0.376 | |
| 2 | r = 0.028 | r = 0.050 | r = 0.174 | r = 0.079 | r = 0.001 | r = –0.025 | r = 0.210 | r = 0.047 | r = –0.044 |
| p = 0.872 | p = 0.772 | p = 0.309 | p = 0.651 | p = 0.996 | p = 0.882 | p = 0.233 | p = 0.788 | p = 0.803 | |
| 3 | r = 0.044 | r = 0.009 | r = 0.292 | r = 0.251 | r = 0.131 | r = 0.035 | r = –0.155 | r = –0.160 | r = –0.069 |
| p = 0.797 | p = 0.818 | p = 0.084 | p = 0.141 | p = 0.447 | p = 0.833 | p = 0.413 | p = 0.487 | p = 0.693 |
Pearson correlations in all nine brain regions between: 1) NGAL with MFS (only in AD patients), 2) Megalin with MFS (only in AD patients), and 3) 24p3R with MFS (only in AD patients). Significant correlations are written in bold. BA, Brodmann area.


