
Outstanding Phenotypic Differences in the Profile of Amyloid-β between Tg2576 and APPswe/PS1dE9 Transgenic Mouse Models of Alzheimer’s Disease
Abstract
APPswe/PS1dE9 and Tg2576 are very common transgenic mouse models of Alzheimer’s disease (AD), used in many laboratories as tools to research the mechanistic process leading to the disease. In order to augment our knowledge about the amyloid-β (Aβ) isoforms present in both transgenic mouse models, we have developed two chromatographic methods, one acidic and the other basic, for the characterization of the Aβ species produced in the brains of the two transgenic mouse models. After immunoprecipitation and micro-liquid chromatography-electrospray ionization mass spectrometry/mass spectrometry, 10 species of Aβ, surprisingly all of human origin, were detected in the brain of Tg2576 mouse, whereas 39 species, of both murine and human origin, were detected in the brain of the APP/PS1 mouse. To the best of our knowledge, this is the first study showing the identification of such a high number of Aβ species in the brain of the APP/PS1 transgenic mouse, whereas, in contrast, a much lower number of Aβ species were identified in the Tg2576 mouse. Therefore, this study brings to light a relevant phenotypic difference between these two popular mice models of AD.
INTRODUCTION
Alzheimer’s disease (AD) is the most common type of dementia in the elderly. It is characterized by two neuropathological hallmarks: Amyloid-β (Aβ) plaques and neurofibrillary tangles. Various animal models are used to gain knowledge of the different factors implicated in the development of the disease. Rodents, in particular mouse and rat, are two of the most popular models. The short reproductive cycle of these mammals (21 days of gestation), their high birth rate, and their small size make them relatively easy to maintain and manage [1]. However, the Aβ peptide sequence of these rodents is slightly different to its human counterpart (the amino acids Arg-5, Tyr-10, and His-13 of the human Aβ sequence are substituted by Gly-5, Phe-10, and Arg-13 in the Aβ sequence of both rat and mouse).
In recent years, developments in genetic engineering and biotechnology have led to the production of a number of transgenic mouse models [2]. Theseanimals bear an exogenous gene (normally of human origin) or an endogenous gene deletion, with the objective of gaining information about the effects of the proteins encoded by the modified genes.
The aim of the present work has been to analyze which Aβ peptides are present in the insoluble fraction of the brain of two AD transgenic animal models: APPswe/PS1dE9 (APP/PS1) and Tg2576. In order to achieve this goal, it was necessary to set up two different chromatographic methods, as in the bibliography most studies are focused on the separation of a few large amyloid peptides (predominantly Aβ38, Aβ40, and Aβ42) in cerebrospinal fluid (CSF) [3, 4]. Therefore, the techniques described here are proposed for the analysis of Aβ peptides in murine brains, and could also be applied to other tissues with minor modifications.
MATERIAL AND METHODS
Experimental animals
The mouse models APP/PS1 and Tg2576 were used in this study. The mouse APP/PS1 expresses a chimeric mouse/human AβPP (isoform AβPP695) carrying the double Swedish mutation (K670N/M671L) and the human presenilin-1 (PS1) with exon 9 deletion under the control of the mouse prion protein promoter [5]. The mouse Tg2576 expresses the human AβPP695 with the double Swedish mutation (K670N/M671L) under the control of the hamster prion protein promoter [6].
For each model (Tg2576 or APP/PS1), eight animals (four males and four females) were studied at each time point: 3, 6, 12, and 18 months old. As controls, the same number, sex, and age-matched, non-transgenic littermates (wild type, WT) were also studied.
Animals were housed in individual ventilated cages. Mice had free access to food and normal tap water and were kept at 20–22°C on a 12-h light/dark cycle in 50–60% humidity. All procedures were approved by the ethics committee of the Center of Biomedical Research of La Rioja (CIBIR) in Spain and were conducted according to the NIH-Guide for the Care and Use of Laboratory Animals.
Reagents
Formic acid, sodium chloride, Triton X-100 (TX-100), α-cyano-4-hydroxycinnamic acid (α-CHCA), trifluoroacetic acid (TFA), sodium phosphate dibasic dihydrate, acetonitrile, sodium phosphate monobasic monohydrate, ammonium hydroxide, dimethylsulfoxide (DMSO), trifluoroethanol (TFE), isopropanol, and water were obtained from Sigma (Steimheim, Germany). Tris base was purchased from Calbiochem (Darmstadt, Germany). Citric acid 1-hydrate was acquired from Panreac (Barcelona,Spain).
Sample preparation
All mice were euthanized with an overdose of inhaled isofluorane. Then, the brains were rapidly removed from the skull, longitudinally sectioned and frozen at –80°C until use. The cerebellum was discarded for this analysis.
A three step protein extraction procedure was employed as previously described by our group [7], with some modifications. Briefly, hemi-brains were homogenized with 3 mL of Tris-buffered saline (TBS, 20 mM Tris-HCl, 150 mM NaCl, pH = 7.4) in a gentleMACS Octo Dissociator (Miltenyi Biotec,Bergisch Gladbach, Germany). Disposable tubes were used to avoid cross-contamination. The homogenates were centrifuged at 175,000 × g for 30 min at 4°C and the supernatants (TBS or soluble fraction) were stored at –80°C. Pellets were re-homogenized in 3 mL of TBS supplemented with 1% of Triton X-100 (TX-100), centrifuged as above and the resulting supernatants (TBS-T fraction) were stored at –80°C. The remaining pellets were homogenized with 3 mL of 70% formic acid and were processed as the previous fractions. The resulting supernatants (FA fraction) were stored at –80°C.
Immunoprecipitation procedure (IP)
Two monoclonal antibodies (mAb) were used in this work, mAb 4G8, which is specific to the Aβ peptide and has the epitope at amino acids 18 to 22 (Covance, Princeton, NJ, USA) and our mAb 1F3, which is specific to the amino-terminal end of Aβ. Both antibodies were employed with each mouse model.
The IP procedure was described previously by Sarasa et al. [8]. An aliquot of Aβ-specific antibody (20 μg of 1F3 or 16 μg of 4G8) was incubated separately with 100 μL of Dynabeads Protein G in citrate buffer (Invitrogen Dynal AS, Oslo, Norway) for 4 h at room temperature in a rotary shaker. Following this, the supernatant was discarded and the beads were washed three times with 1 mL of phosphate-buffered saline (PBS: 1 mM NaH2PO4 · H2O, 5 mM Na2HPO4 · 2 H2O, 138 mM NaCl). 200 μL of formic acid brain extract previously neutralized with 6 mL of PBS and 6 mLof 2 M Tris pH = 8.45 was added and incubated overnight at room temperature in a rotary shaker. The sample was removed from the beads with the help of a magnet (DynaMag-2 or DynaMag-15, Invitrogen Dynal AS, Oslo, Norway) and discarded. The beads were washed with PBS and the elution was carried out with 25 μL of 5% formic acid. The eluate was incubated for 5 min at room temperature in an Eppendorf Thermomixer (Hamburg, Germany).
MALDI-TOF and MALDI-TOF/TOF mass spectrometry
The eluted compounds were desalted with ZipTip C18 tips (Millipore, Billerica, MA) for MALDIanalysis. The ZipTip C18 protocol consists of several steps: Tip solvation with acetonitrile, conditioning with 0.1 % TFA (repeating this step several times), sample loading (by pipetting up and down several times), washing with 0.1 % TFA and final elution with 5 μL of α-CHCA (5 mg/mL in acetonitrile-water 70/30, 0.1 % TFA).
For MALDI analysis, 0.8 μL of the eluted sample was placed directly on the MALDI target until complete evaporation. Mass spectra were acquired with an ABI4800 Plus MALDI-TOF/TOF mass spectrometer (AB/Sciex, Concord, Ontario, Canada), obtained in reflector mode and all the experiments were carried out in positive ion mode. For MS/MS experiments, precursor ions were selected by means of a timed ion selector at a resolution value of 200 (full width at half maximum). The Metastable Suppressor lenses were activated in all the MS/MS experiments to avoid the detection of remaining precursor ions and unwanted metastable decay fragments [9].
Data Explorer software was used for the analysis of the spectra (including smoothing and noise filtering). Only monoisotopic m/z ratios are reported. The mass spectrometer was externally calibrated with a peptide mixture provided by the manufacturer.
Liquid chromatography-mass spectrometry (LC-MS)
Immunoprecipitated samples were eluted from the beads with 25 μL of 5 % formic acid, desalted with ZipTip C18 tips, evaporated to dryness and redissolved with 25 μL of initial chromatographic conditions for LC/MS analysis. Micro-LC-MS/MS experiments were performed using a Synapt G2-Si hybrid orthogonal acceleration Quadrupole-Travelling Wave Ion Mobility Spectrometry-TOF mass spectrometer (Waters, Manchester, UK) fitted with a Lock-Mass ESI (electrospray ionization) ion source. Micro-LC separations were performed using a nano-Acquity UPLC system (Waters, Milford, MA, USA). Two different chromatographic methods were used:
Method One (Acidic pH)
Separation was carried out in an Acquity UPLC M-Class BEH C18 column (300Å, 1.7 μm, 300 μm × 100 mm, Waters, Milford, MA, USA). Separation was performed at a flow rate of 5 μL/min with mobile phases A (water 0.1 % formic acid/DMSO, 95/5) and B (acetonitrile 0.1 % formic acid/DMSO, 95/5). Column temperature was kept at 50°C. Injection volume was 1 μl. 0.1% trifluoroacetic acid was used as weak needle wash, while a mixture of acetonitrile, trifluoroethanol and water 80/10/10, 0.1% trifluoroacetic acid was used as strong needle wash. At the initial conditions of 2% B, the organic concentration was increased up to 15% and maintained for 2 min, then a linear gradient up to 45% B, was applied. After the analytical gradient, the organic concentration was raised over 1 min up to 90% and kept at these conditions for 2 minutes before returning to initial conditions over 1 min. The column was allowed to stabilize at initial conditions for 8minutes. Total cycle time was 35 min.
Method Two (Basic pH)
Separation was carried out in a Zorbax 300 Extend-C18 column, (3.5 μm, 300 μm × 100 mm, Agilent, Germany) using a trap column (XBridge Peptide BEH C18 NanoEase 130Å, 5 μm, 300 μm × 50 mm, Waters, MA, USA). Separation was performed at a flow rate of 4 μL/min with mobile phase A (ammonium hydroxide 0.3%) and B (mixture of acetonitrile and trifluoroethanol 90/10). Column temperature was kept at 30°C. Injection volume was 2 μl. A mixture of water and isopropanol 95/5 with 0.3% ammonium hydroxide was used as weak needle wash while a mixture of acetonitrile, isopropanol and ammonium hydroxide (57/38/5%) was used as strong needle wash. After 2 min of sample trapping at a flow rate of 10 μL/min and 2 % mobile phase B, the trap valve was switched to analytical mode. The organic fraction was raised up to 18% mobile phase B and maintained for 3 min, then, a linear gradient was performed up to 35% mobile phase B over 17 min. After the analyticalgradient, the organic concentration was increased over 1 min up to 90% mobile phase B and maintained for 2 min before returning to initial conditions over 1 min. The column was allowed to stabilize under initial conditions for 9 min. Total cycle time was 35 min.
Mass spectrometric initial analyses for identification purposes were performed in data-dependent acquisition mode. After a survey scan (0.2 s) the 5 most intense peaks with charge states 3+ and 4+ were selected for fragmentation by CID using a collision energy ramp (intensity threshold of 6000 cps). When TIC intensity rose above a threshold of 1 × 10⁵ cps, the instrument automatically switched back to MS mode. Ions were dynamically excluded for 10 s. Capillary voltage was set at +3 kV, Cone and Source Offset lenses voltages were set at 90 and 40 V, respectively. Source temperature was 100°C. Nebulizer gas (6 bar) and desolvation gas (800 L/h and 200°C) were also employed. All the analyses were performed in positive ion mode. The instrument was operated in Resolution mode (R∼28000–30000 for m/z 785.8426).
Spectral data analysis
Acquired data were processed with ProteinLynx Global Server (PLGS version 3.0.2, Waters, UK) and converted to “.pkl” format before submission for protein identification using MASCOT (version 2.1, Matrix Science, UK). UniProt Swiss-Prot (Taxonomy: Mammalian) was used as a reference database. Methionine oxidation was selected as variable modification whereas no fixed modification was chosen. No-Enzyme searches were performed. Doubly charged species of [Glu1]-fibrinopeptide at m/z 785.8426 Th was used as lock-mass. Manual validation of the identified species was carried out; MS/MS spectra were centroided, lock-mass corrected and deconvoluted using MassLynx (version 4.1, Waters, UK). Experimental fragmentation profiles were manually compared with the theoretical profiles or using the BioLynx’s Peptide Sequencing Tool (MassLynx, Waters, UK). After complete amyloid species identification (and combining the information obtained by ESI-Q-TOF and MALDI-TOF/TOF), a comparative study among the different transgenic groups (sex and age) was carried out in full scan mode as accurate mass and retention time sufficed for this kind of analysis. Chromatographic peaks were noise-filtered, smoothed and integrated using TargetLynx (Waters, UK). Samples were analyzed in duplicate.
ELISA
Aβ40 and Aβ42 were measured using two proprietary specific ELISA sandwich kits, ABtest40 and ABtest42 (Araclon Biotech, Zaragoza, Spain). An anti-N-terminal Aβ monoclonal antibody was used as capture antibody and two proprietary highly specific anti-C-terminal Aβ polyclonal antibody, pAB002 and pAB031 (Araclon Biotech, Zaragoza, Spain), were used as detection antibodies for Aβ40 and Aβ42, respectively. Thus, levels of Aβ40 and Aβ42 were separately determined in the soluble fraction (TBS), TBS-T fraction and FA fraction. TBS fraction was diluted 1:2 and TBS-T fraction was diluted 1:5 in a formulated sample buffer (PBS 0.5 M, 0.5% Tween 20, 1% blocking polymer) and the FA fraction was neutralized making a dilution 1:20 with 0.5 M Na2HPO4/1 M Tris and then diluted 1:25 in the formulated sample buffer for measurement. Samples were incubated overnight with capture antibody at 4°C without shaking. Subsequent incubations (1 h each) were performed at room temperature by gently shaking the plates in an orbital 3D platform and followed by a 5-min wash. During the last incubation with the chromogen, the absorbance was read at 620 nm until it reached 0.60–0.65. Then, the reaction was stopped and the absorbance read at 450 nm for interpolation in the standard curve.
RNA extraction, reverse transcription, and Real-Time PCR (qPCR)
For the quantification of mouse BACE-1, mouse AβPP and human AβPPswe expression in the brain of the two transgenic mice studied, total RNA from the transgenic and wild type mice was isolated using the TRIzol reagent (Invitrogen, Carlsbad, CA, USA) in accordance with the manufacturer’s recommendations. The concentrations of RNA were measured in a spectrophotometer at 260 nm and the purity was assessed taking into account the absorbance ratio at 260 and 280 nm (A260/A280). RNA extracts were treated with DNase I (Invitrogen, Carlsbad, CA, USA) to eliminate residual DNA contamination. Then, 1 μg of total RNA was transcribed to cDNA using the SuperScript First-Strand Synthesis System for RT-PCR (Invitrogen, Carlsbad, CA, USA) according to the manufacturer’s instructions. Next, quantitative real-time PCR assays were performed in duplicate using Power SYBR Green PCR Master Mix (Applied Biosystems, Warrington, UK), and specific primers to mouse BACE-1 (forward: 5’-TCCCAGTCATTTCACTTTACC -3’; reverse: 5’-TAGGTATTGCTGAGGAAGGATG-3’),mouse AβPP (forward: 5’-TCAGGATTTGAAGTCCGCCA-3’, reverse: 5’-CCACATCTTCAGCAAAGAACAC-3’) and human AβPPswe (forward: 5’-CAGAATTCCGACATGACTCAG-3’, reverse: 5’-GCACCTTTGTTTGAACCCAC-3’). Mouse GAPDH (forward: 5’-GAGAAACCTGCCAAGTATGATG-3’; reverse: 5’-GTCCTCAGTGTAGCCCAAGA -3’) was used as internal control. Real-time PCR was carried out in a StepOne Plus system (Applied Biosystems, Foster City, CA), and data were analyzed with StepOne software v2.3. One brain hemisphere of the 12-month-old mice, in both transgenic models and their corresponding wild type (n = 6 per group), were used in these analyses.
Statistical methods
Statistical analysis for mRNA expression levels were performed with SPSS statistical software package (version 20, IBM, USA). Non-parametric tests (Mann-Withney U test or Kruskal-Wallis H test with post-hoc pairwise comparisons) were employed. Statistical significance was set at a p value less than 0.05 (p < 0.05).
RESULTS AND DISCUSSION
First, IP-MALDI-TOF analyses were performed in both transgenic mouse models using antibodies 1F3 and 4G8. After those initial analyses we decided to use mAb 1F3 for Tg2576 and mAb 4G8 for APP/PS1 brain extracts because APP/PS1 mice generate a large number of N-terminal truncated Aβ species which cannot be recognized by the mAb 1F3, whereas Tg2576 mice generate full-length Aβ species which can be recognized by both antibodies with the exception of Aβ19, not recognized by mAb 4G8, and Aβ20, only partially recognized by this antibody. For the identification of Aβ species by Micro-LC-ESI-MS/MS, an acidic pH chromatographic method was employed. This method was applied in both mice models. However, the resolution achieved with acidic pH chromatography was insufficient to separate all the species present in the APP/PS1 brain extracts. For this reason, a second chromatographic method, at basic pH, had to be developed. Table 1 lists all the species detected for the two transgenic mice models using both techniques, MALDI-TOF and LC-MS, and Fig. 1 shows the MALDI-TOF mass spectrum obtained after immunoprecipitation of a brain extract of Tg2576 mouse (pooled sample, mice aged 18 months). A MALDI-TOF mass spectrum obtained after IP with the mAb 4G8 is shown in the Supplem-entary Material for comparative purposes. Eight (8) Aβ peptides were identified, most of them resulting from the combined activity of β and γ-secretases (Aβ37, Aβ38, Aβ39, Aβ40, Aβ42, and Aβ43). Some of these species of Aβ have been previously reported by others [10–12]. In the low-m/z range of the spectrum (2200–2500 Th), two previously unreported peptides were detected in this study: Aβ19 and Aβ20. These two peptides have been associated with β-secretase activity (BACE-2) [13, 14] in combination with other Aβ degrading enzymes (ADEs) [15–17]. The same peptides were found in the analysis of these samples by Micro-LC-MS/MS as shown in Fig. 2. This figure shows that the peptides elute in order according to their hydrophobicity, which in the case of the Aβ peptides is equivalent to the species’ size due to their particular sequence, with the exception of Aβ38 and Aβ43 which co-elute with their preceding species. The presence of slightly polar aminoacids, such as Gly and Thr, at the C-terminal end of the Aβ38 and Aβ43 sequences, respectively, hinders separation in these conditions. Significant matrix effects (ionization suppression) can be observed for Aβ19 and Aβ20 if the gradient starts just after the injection signal. For this reason we introduced two “trapping” steps at the beginning of the chromatographic acquisition. These 8 species found in Tg2576, 10 if taking into account the oxidized species of Aβ40 and Aβ42, can be analyzed in a relatively short analysis time (35 min). After IP with mAb 4G8, the species Aβ11-40 and Aβ11-42 both human and murine, were not detected in these conditions due to the trace amounts present in the samples previously detected by MALDI-TOF. These species were detected by MALDI-TOF (see Supplementary Material) after accumulating a considerable number of spectra (n = 10,000). We chose to use 300 μm internal diameter columns as they provide a good tradeoff with regard to robustness and sensitivity. Full agreement between MALDI-TOF and Micro-LC-ESI-MS/MS data was observed.
Figure 3 shows the MALDI-TOF mass spectrum obtained after immunoprecipitation of a brain extract from APP/PS1 mouse (pooled sample, mice aged 18 months). When compared with the spectrum of the Tg2576 mice in Fig. 1, several differences can be observed between the two mouse models. First, the number of Aβ species present in the brain of APP/PS1 mice is much higher (32 human and 8 murine Aβ species in the APP/PS1 mice versus 10 human Aβ species in the Tg2576). Second, Aβ42 and Aβ43, both products of combined β- and γ-secretase activities, display relatively more prominent peaks in the spectra of the APP/PS1 mice than in those of the Tg2576 mice. The expression of mutated human presenilin-1 in the APP/PS1 mice can certainly account for a higher γ-secretase activity in this mouse model of AD. Third, the presence of N-terminal-truncated Aβ species between positions 10 and 11 (both human and murine) was easily detectable in the APP/PS1 spectra, while their corresponding signals in the Tg2576 spectra displayed very low intensity (Supplementary Material). Additionally, the mass spectra of APP/PS1 mice revealed other N-terminal truncated Aβ species originated after the cleavage between Ala-2 and Glu-3, along with their pyroglutamate counterparts, which, though scarce, could be relevant. These pyroglutamate peptides result from the action of glutaminyl cyclase, an enzyme that acts over Glu when it is in the first position in the sequence. These pyroglutamate species are more hydrophobic, favoring the formation of β-sheet structures and subsequent aggregation [18, 19].
The complexity of the MALDI-TOF spectra obtained in APP/PS1 mice led us to change the chromatographic conditions in order to deal with the high number of species in Micro-LC-ESI-MS/MS. We decided to shift from the most common system with acidic pH to a new basic pH method. Under these new basic conditions, 31 human and 8 murine Aβ species were clearly visualized by Micro-LC-ESI-MS/MS after IP with mAb 4G8. Figure 4 shows some of the amyloid species detected (all species are shown in the Supplementary Material). In particular, the peaks corresponding to Aβ37 and Aβ38 appear separated, and the separation between peaks for Aβ42 and Aβ43 was also improved, although the peaks were not fully resolved. Figure 5 shows some of the N-terminal truncated Aβ species identified in this study. N-terminal processing of Aβ by different proteases generates progressively shorter species of increasing hydrophobicity. Comparing Figs. 4 and 5, it can be observed that after elimination of Asp-1 (along with Ala-2) in Aβ40 generates Aβ3-40, which changes retention time by more than 1 minute with regard to Aβ40. Its pyroglutamate counterpart (Aβpyr3-40) elutes almost 1.5 min later. The elimination of the first ten amino acids of the sequence generates highly hydrophobic species as a result of the loss of a significant part of the hydrophilic moiety of the molecule. The five most intense murine species are shown in Fig. 6. Murine Aβ11-38, Aβ12-42, and Aβ12-43 were detected by MALDI-TOF but not by Micro-LC-ESI-MS/MS. This result is not surprising as the signal in the MALDI-TOF spectrum was very low. However, murine Aβpyr11-40, Aβpyr11-42 and Aβpyr11-43 overlap with their human unmodified counterparts (Aβ11-40, Aβ11-42, and Aβ11-43) in the MALDI-TOF spectrum but are clearly resolved by Micro-LC-ESI-MS/MS (see Supplementary Figure 1f). No human Aβpyr11-X has been detected in the transgenic mice brain extracts by Micro-LC-ESI-MS/MS in our experimental conditions. Signals corresponding to the theoretical m/z of these Aβpyr11-X species appear in the MALDI-TOF spectrum; however, their low signal to noise ratio hindered their identification. The appearance of these shorter, more hydrophobic and less soluble species, more prone to precipitation, could account for the earlier onset of plaque formation in the APP/PS1 mouse model. There is, however, a lack of studies in the literature addressing the potential toxic effects of these peptides with the exception of the pyroglutamate species [18, 19].
In the APP/PS1 mice, Aβ42 was detected from the first age explored (3 months), with female mice exhibiting higher levels than males at this age. These results are in full agreement with the ELISA results (see Supplementary Table 1) and with the onset of plaque formation, as detected by immunohistochemistry, in previous works in our laboratory and those of others [7, 20–22]. Aβ40 levels were relevant from 6 months of age in both genders, only traces being detected at the age of 3 months. In the Tg2576 mice Aβ42 was first detected in females by the age of 6 months, and in males at 12 months, though it may have appeared earlier (between 6 and 12 months as no sampling was carried out). In this AD model, Aβ40 started to be detected at 12 months of age for both genders. Gender differences have been previously reported in APP/PS1 mice, suggesting that some sex hormones may play an important role in AD [23]. Sex differences in the incidence and severity of the disease have also been reported in the clinical practice [24]. Again, good agreement is found with immunohistochemical results [25]. No Aβ species (murine or human) were detected in brain extracts of wild type mice, supporting the low Aβ production and the absence of brain plaques under non-pathological conditions in mice [26]. Regarding the Aβ species profile, none of the mice models described in this study mirrors the human profile, dominated by AβX-42 species, mainly Aβ4-42, as reported by another group [27]. A representative MALDI-TOF spectrum obtained in our laboratory is shown in the Supplementary Material. Remarkably, only Aβ11-42 and its pyro-Glu counterpart were detected in the human brain. Murine Aβ11-X (X = 40, 42, or 43) and their pyro-Glu counterparts were detected in mouse samples along with human Aβ11-X (X = 40, 42, or 43). No human Aβpyr11-X has been detected in mouse brain extracts but their presence in trace amounts is suspected. Mouse BACE-1 is not an animal species-specific enzyme as suggested by some researchers [28], as we have observed Aβ11-X from human AβPP and from mouse AβPP in the two transgenic mouse models analyzed. In an effort to explain the observed differences in the Aβ11-X profile in the two mouse models, BACE-1 expression levels in the brains of transgenic and wild type mice aged 12 months old were analyzed by qPCR. We chose the age of 12 months as it is the first time point in our experimental design at which these truncated Aβ 11-X species, which are supposedly produced by the activity of BACE-1, are detected.
No differences in BACE-1 were found between the APP/PS1 and Tg2576 mice (Supplementary Figure 5). We then studied AβPP expression levels, observing that Tg2576 mice expressed double the amount of human AβPPswe mRNA when compared to APP/PS1 mice, while no differences were found in murine AβPP expression levels between the two mice models (Supplementary Figure 5). The distinct profile of Aβ11-X peptides between these two AD models could be explained by a different conformation of the AβPP protein due to the chimeric nature of the AβPP expressed in the APP/PS1 model, which could favor the action of BACE-1 and/or other proteases. On the other hand, BACE-1 may not be the only enzyme involved in the cleavage between positions 10 and 11 of the Aβ sequence. In addition, it should be noted that the results obtained by qPCR cannot be extrapolated to protein levels, so further studies will be required in order to prove these hypotheses.
CONCLUSIONS
We have developed two chromatographic methods for the separation and characterization of amyloid species from brain tissue. To our knowledge, this is the first work describing, in-depth, a comprehensive Aβ profile due to the extensive chromatographic work we have developed. We think that this method could be suitable for the analysis of Aβ species from other body fluids or tissues with minor modifications. The robustness of the method, its relatively short chromatographic run time, in addition to the resolution, mass accuracy and sensitivity achievable with orthogonal acceleration Q-TOF instruments, make this method, from our point of view, a good choice for Aβ analysis. MALDI-TOF is a valuable, fast and sensitive technique for species profiling. However, as a drawback, MALDI ionization can be compromised, mainly when there are many compounds present in the sample, as well as when there is a complete or partial spectral overlap (i.e., Aβ40 and Aβ3-42, M+H+ 4328.1552 and 4326.2123, respectively, or murine Aβpyr11-40, Aβpyr11-42, and Aβpyr11-43). It is well recognized that extensive analyte trapping and washing followed by a chromatographic separation greatly reduces matrix effects. Regarding the suitability of the two mouse models analyzed in this study, none of them mimics the amyloid expression profile found in humans, but they show some other advantages as the rapidity of plaque development in their brains and, as already said by many others, could be useful to elucidate key aspects of the disease.
DISCLOSURE STATEMENT
Authors’ disclosures available online (http://j-alz.com/manuscript-disclosures/16-0280r1).
Appendices
The supplementary material is available in the electronic version of this article: http://dx.doi.org/10.3233/JAD-160280.
REFERENCES
[1] | Sarasa M , Pesini P ((2009) ) Natural non-transgenic animal models for research in Alzheimer’s disease. Curr Alzheimer Res 6: , 171–178. |
[2] | Lee JE , Han PL ((2013) ) An update of animal models of Alzheimer disease with a reevaluation of plaque depositions. Exp Neurobiol 22: , 84–95. |
[3] | Bros P , Delatour V , Vialaret J , Lalere B , Barthelemy N , Gabelle A , Lehmann S , Hirtz C ((2015) ) Quantitative detection of amyloid-beta peptides by mass spectrometry: State of the art and clinical applications. Clin Chem Lab Med 53: , 1483–1493. |
[4] | Pannee J , Gobom J , Shaw LM , Korecka M , Chambers EE , Lame M , Jenkins R , Mylott W , Carrillo MC , Zegers I , Zetterberg H , Blennow K , Portelius E ((2015) ) Round robin test on quantification of amyloid-beta 1-42 in cerebrospinal fluid by mass spectrometry. Alzheimers Dement 12: , 55–59. |
[5] | Jankowsky JL , Slunt HH , Ratovitski T , Jenkins NA , Copeland NG , Borchelt DR ((2001) ) Co-expression of multiple transgenes in mouse CNS: A comparison of strategies. Biomol Eng 17: , 157–165 . |
[6] | Hsiao K , Chapman P , Nilsen S , Eckman C , Harigaya Y , Younkin S , Yang F , Cole G ((1996) ) Correlative memory deficits, Abeta elevation, and amyloid plaques in transgenic mice. Science 274: , 99–102. |
[7] | Izco M , Martinez P , Corrales A , Fandos N , Garcia S , Insua D , Montanes M , Perez-Grijalba V , Rueda N , Vidal V , Martinez-Cue C , Pesini P , Sarasa M ((2014) ) Changes in the brain and plasma Abeta peptide levels with age and its relationship with cognitive impairment in the APPswe/PS1dE9 mouse model of Alzheimer’s disease. Neuroscience 263: , 269–279. |
[8] | Sarasa L , Allue JA , Pesini P , Gonzalez-Martinez A , Sarasa M ((2013) ) Identification of beta-amyloid species in canine cerebrospinal fluid by mass spectrometry. Neurobiol Aging 34: , 2125–2134. |
[9] | Spengler B , Chaurand P , Bold P ((1999) ) MALDI Postsource Decay Mass Analysis. Wiley-VCH Verlag GmbH, pp. 197–211. |
[10] | Du P , Wood KM , Rosner MH , Cunningham D , Tate B , Geoghegan KF ((2007) ) Dominance of amyloid precursor protein sequence over host cell secretases in determining beta-amyloid profiles studies of interspecies variation and drug action by internally standardized immunoprecipitation/mass spectrometry. J Pharmacol Exp Ther 320: , 1144–1152. |
[11] | Kalback W , Watson MD , Kokjohn TA , Kuo YM , Weiss N , Luehrs DC , Lopez J , Brune D , Sisodia SS , Staufenbiel M , Emmerling M , Roher AE ((2002) ) APP transgenic mice Tg2576 accumulate Abeta peptides that are distinct from the chemically modified and insoluble peptides deposited in Alzheimer’s disease senile plaques. Biochemistry 41: , 922–928. |
[12] | Mustafiz T , Portelius E , Gustavsson MK , Holtta M , Zetterberg H , Blennow K , Nordberg A , Lithner CU ((2011) ) Characterization of the brain beta-amyloid isoform pattern at different ages of Tg2576 mice. Neurodegener Dis 8: , 352–363. |
[13] | Sun X , He G , Song W ((2006) ) BACE2, as a novel APP theta-secretase, is not responsible for the pathogenesis of Alzheimer’s disease in Down syndrome. FASEB J 20: , 1369–1376. |
[14] | Fluhrer R , Capell A , Westmeyer G , Willem M , Hartung B , Condron MM , Teplow DB , Haass C , Walter J ((2002) ) A non-amyloidogenic function of BACE-2 in the secretory pathway. J Neurochem 81: , 1011–1020. |
[15] | Grasso G ((2011) ) The use of mass spectrometry to study amyloid-beta peptides. Mass Spectrom Rev 30: , 347–365. |
[16] | Portelius E , Westman-Brinkmalm A , Zetterberg H , Blennow K ((2006) ) Determination of beta-amyloid peptide signatures in cerebrospinal fluid using immunopre-cipitation-mass spectrometry. J Proteome Res 5: , 1010–1016. |
[17] | Nalivaeva NN , Beckett C , Belyaev ND , Turner AJ ((2011) ) Are amyloid-degrading enzymes viable therapeutic targets in Alzheimer’s disease?. J Neurochem 120: , 167–185. |
[18] | Jawhar S , Wirths O , Bayer TA ((2011) ) Pyroglutamate amyloid-beta (Abeta): A hatchet man in Alzheimer disease. J Biol Chem 286: , 38825–38832. |
[19] | Sullivan CP , Berg EA , Elliott-Bryant R , Fishman JB , McKee AC , Morin PJ , Shia MA , Fine RE ((2011) ) Pyroglutamate-Abeta 3 and 11 colocalize in amyloid plaques in Alzheimer’s disease cerebral cortex with pyroglutamate-Abeta 11 forming the central core. Neurosci Lett 505: , 109–112. |
[20] | Ruan L , Kang Z , Pei G , Le Y ((2009) ) Amyloid deposition and inflammation in APPswe/PS1dE9 mouse model of Alzheimer’s disease. Curr Alzheimer Res 6: , 531–540. |
[21] | Jankowsky JL , Slunt HH , Gonzales V , Jenkins NA , Copeland NG , Borchelt DR ((2004) ) APP processing and amyloid deposition in mice haplo-insufficient for presenilin 1. Neurobiol Aging 25: , 885–892. |
[22] | Garcia-Alloza M , Robbins EM , Zhang-Nunes SX , Purcell SM , Betensky RA , Raju S , Prada C , Greenberg SM , Bacskai BJ , Frosch MP ((2006) ) Characterization of amyloid deposition in the APPswe/PS1dE9 mouse model of Alzheimer disease. Neurobiol Dis 24: , 516–524. |
[23] | Ordonez-Gutierrez L , Anton M , Wandosell F ((2015) ) Peripheral amyloid levels present gender differences associated with aging in AbetaPP/PS1 mice. J Alzheimers Dis 44: , 1063–1068. |
[24] | Mielke MM , Vemuri P , Rocca WA ((2014) ) Clinical epidemiology of Alzheimer’s disease: Assessing sex and gender differences. Clin Epidemiol 6: , 37–48. |
[25] | Kawarabayashi T , Younkin LH , Saido TC , Shoji M , Ashe KH , Younkin SG ((2001) ) Age-dependent changes in brain, CSF, and plasma amyloid (beta) protein in the Tg2576 transgenic mouse model of Alzheimer’s disease. J Neurosci 21: , 372–381. |
[26] | Deng Y , Wang Z , Wang R , Zhang X , Zhang S , Wu Y , Staufenbiel M , Cai F , Song W ((2013) ) Amyloid-beta protein (Abeta) Glu11 is the major beta-secretase site of beta-site amyloid-beta precursor protein-cleaving enzyme 1(BACE1), and shifting the cleavage site to Abeta Asp1 contributes to Alzheimer pathogenesis. Eur J Neurosci 37: , 1962–1969. |
[27] | Portelius E , Bogdanovic N , Gustavsson MK , Volkmann I , Brinkmalm G , Zetterberg H , Winblad B , Blennow K ((2010) ) Mass spectrometric characterization of brain amyloid beta isoform signatures in familial and sporadic Alzheimer’sdisease. Acta Neuropathol 120: , 185–193. |
[28] | Cai H , Wang Y , McCarthy D , Wen H , Borchelt DR , Price DL , Wong PC ((2001) ) BACE1 is the major beta-secretase for generation of Abeta peptides by neurons. Nat Neurosci 4: , 233–234. |
Figures and Tables
Fig.1
Mass spectrum of a brain extract from Tg2576 mice (aged 18 months) after immunoprecipitation with 1F3.
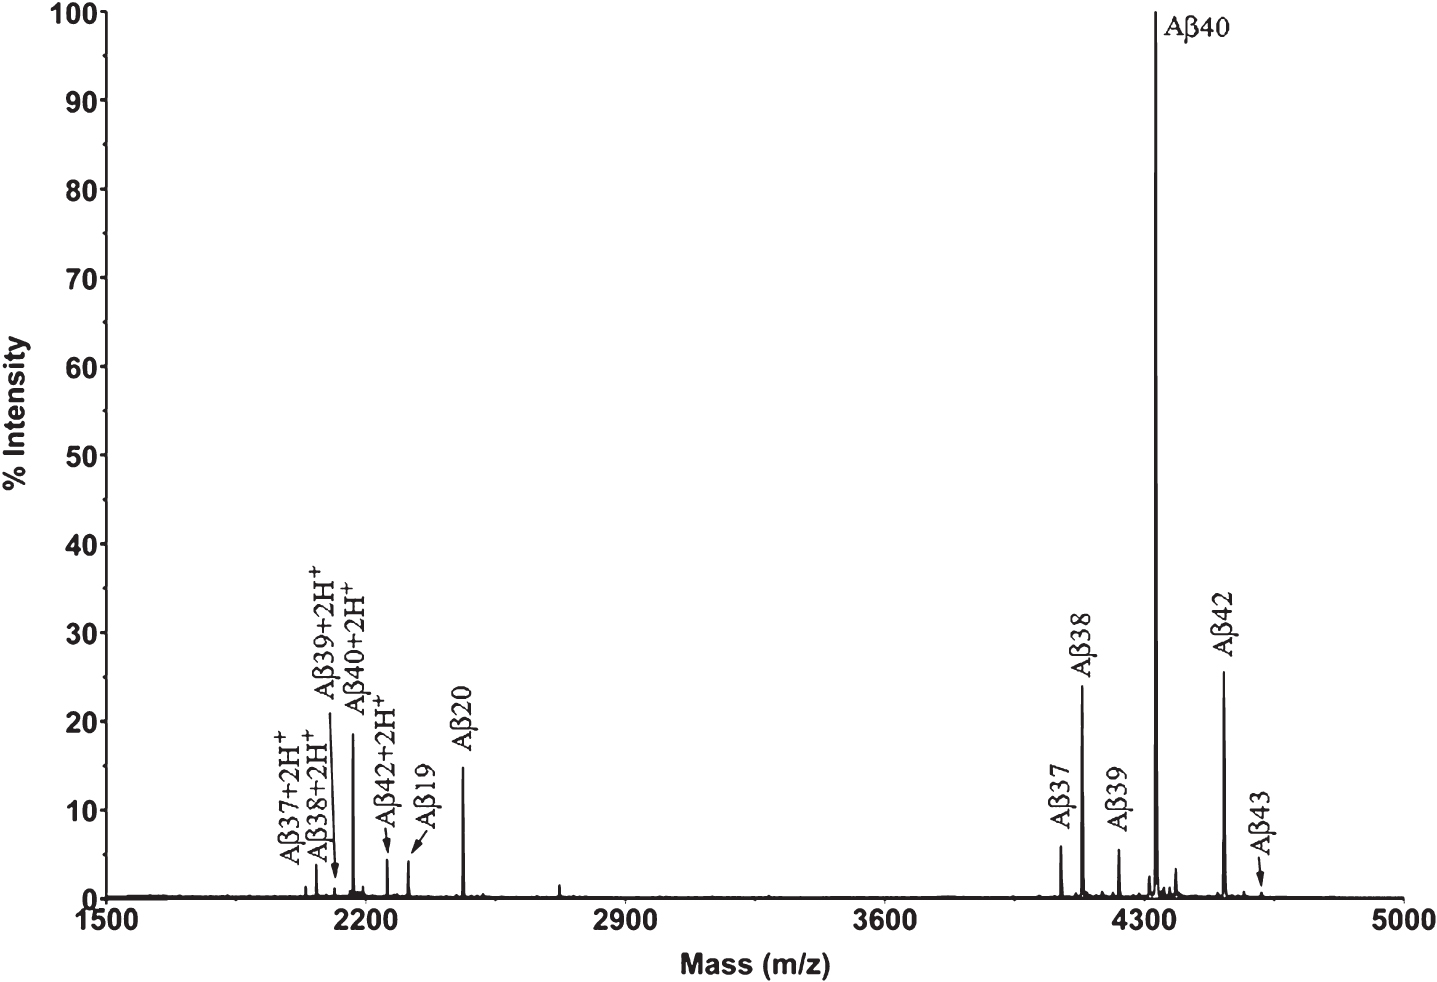
Fig.2
XIC of the Aβ peptides detected by Micro LC-ESI-MS/MS in a brain extract from Tg2576 mice (aged 18 months).
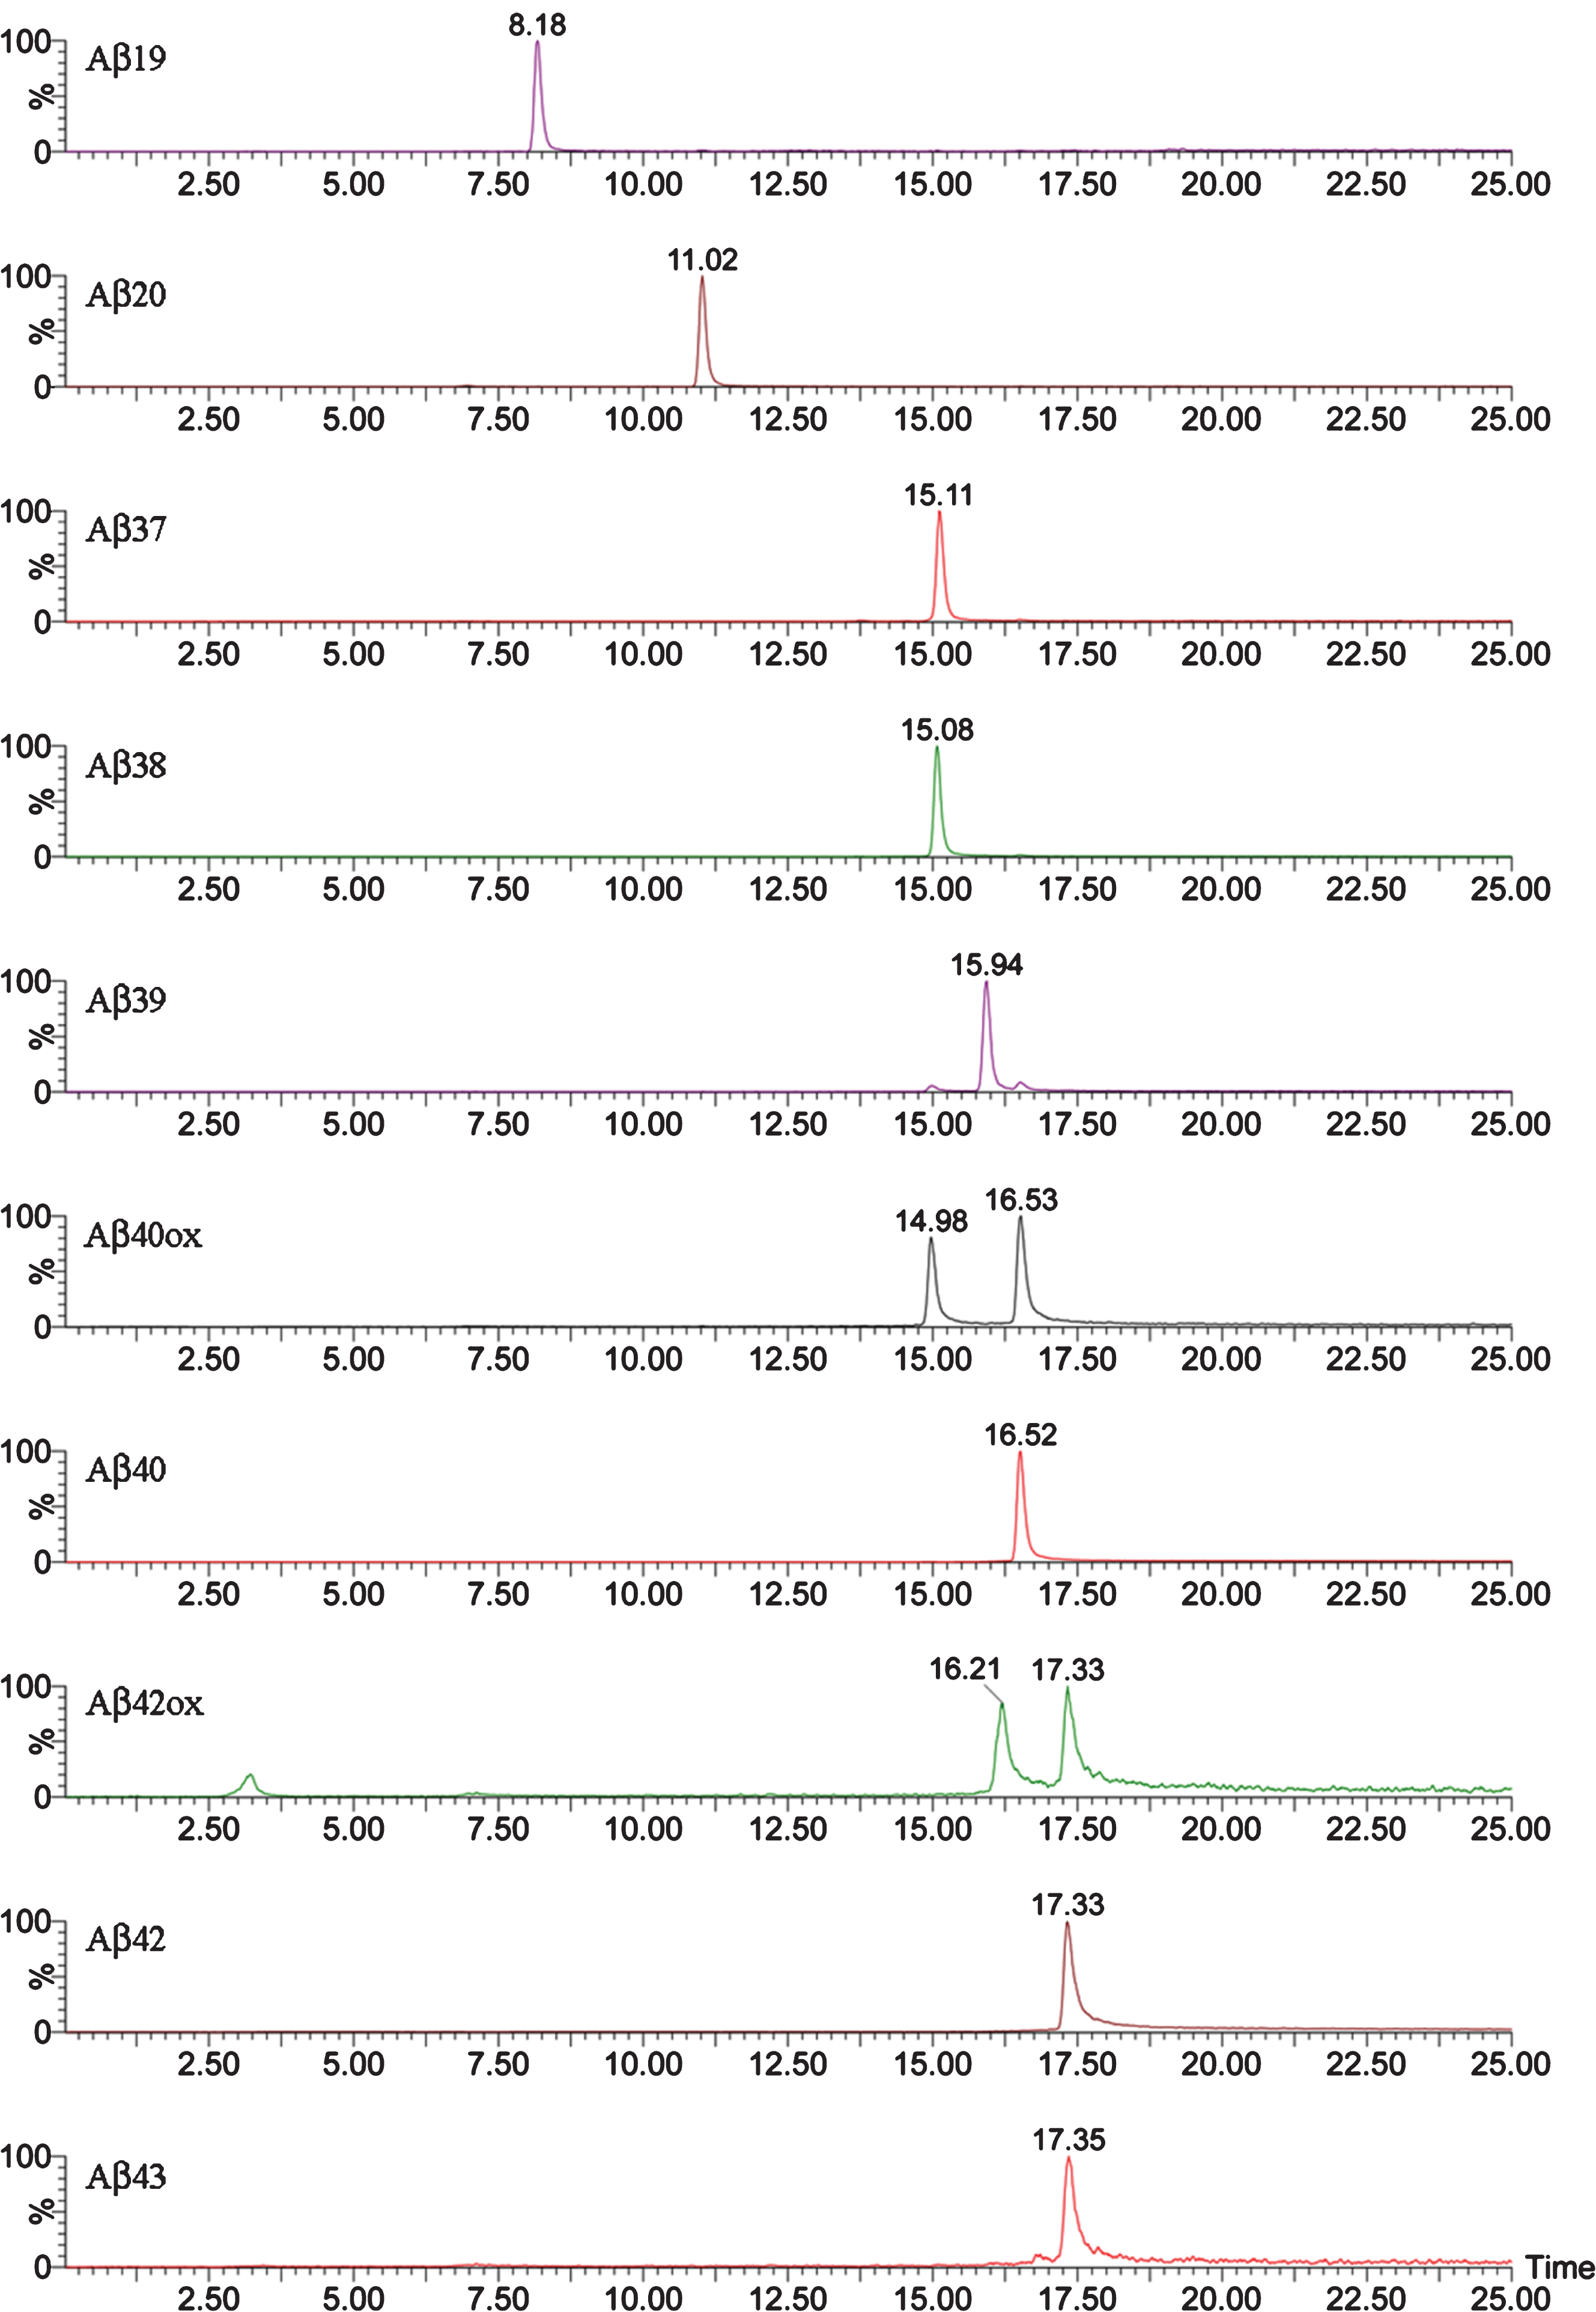
Fig.3
Mass spectrum of a brain extract from APP/PS1 mice (aged 18 months) after immunoprecipitation with mAb 4G8. Full spectral range (A); low-mid mass range (B); high mass range (C).
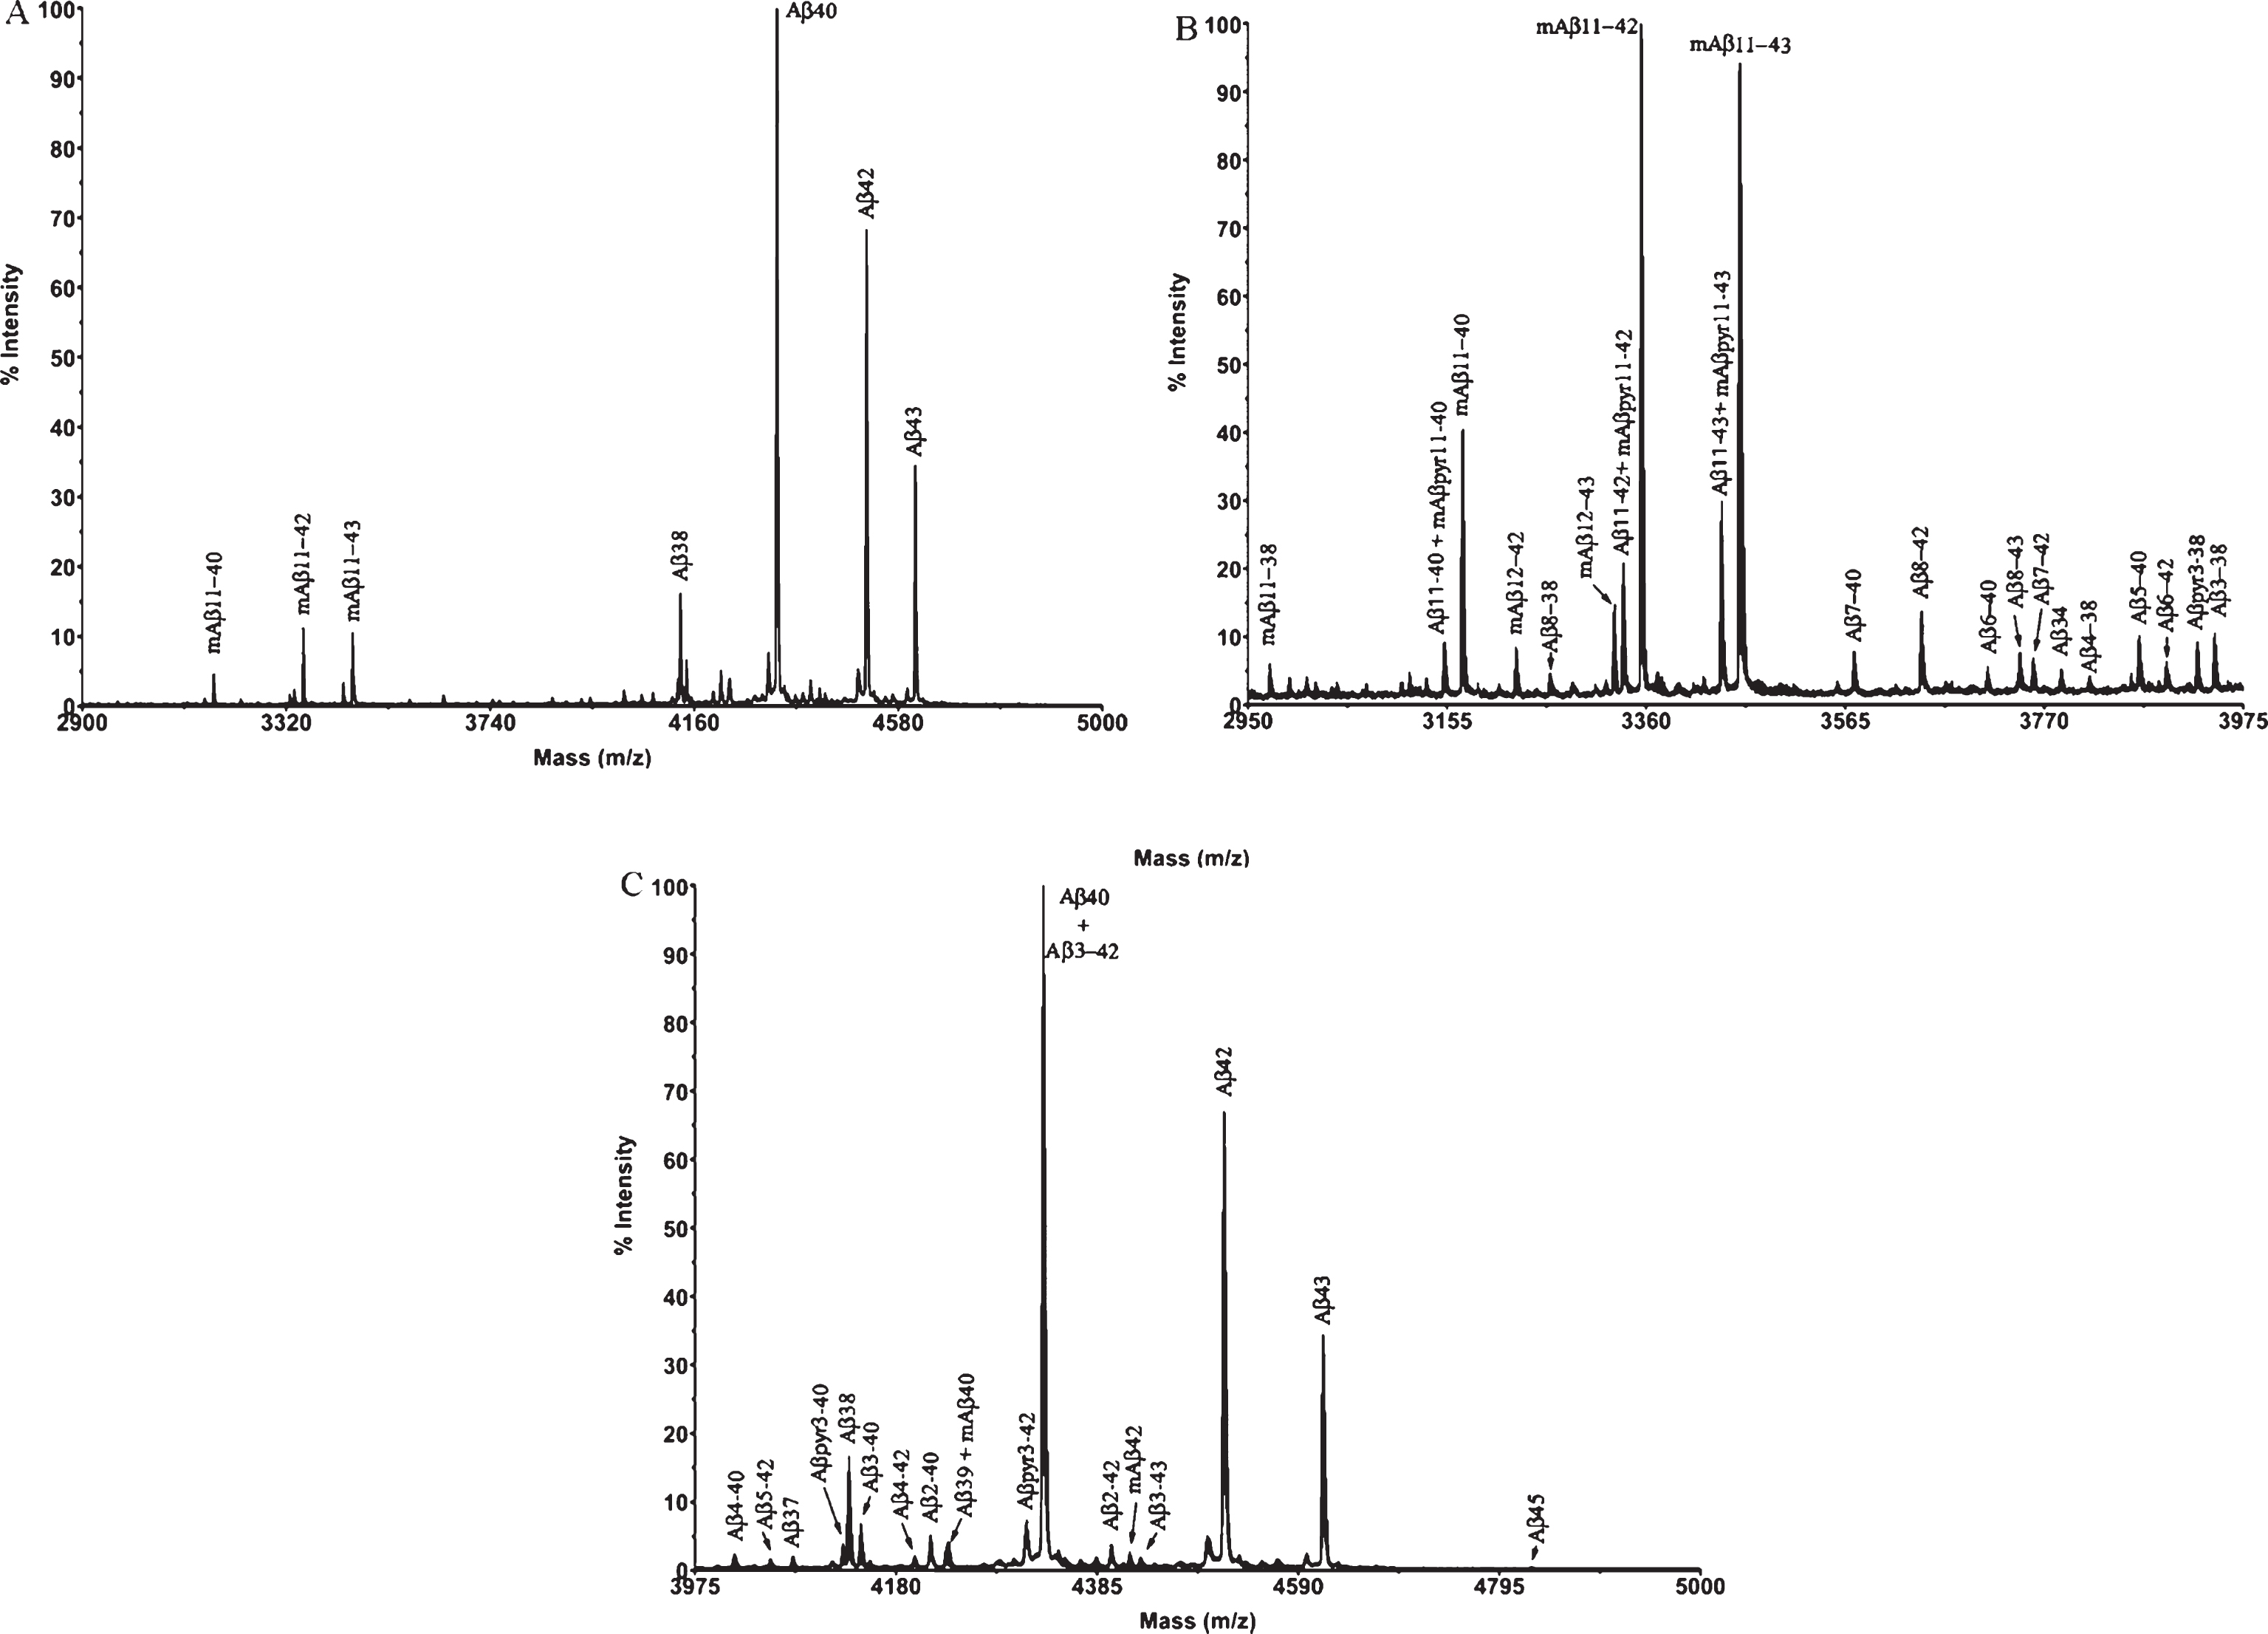
Fig.4
XIC of some of the largest Aβ peptides detected by Micro LC-ESI-MS/MS in brain extract from APP/PS1 mice (aged 18 months).
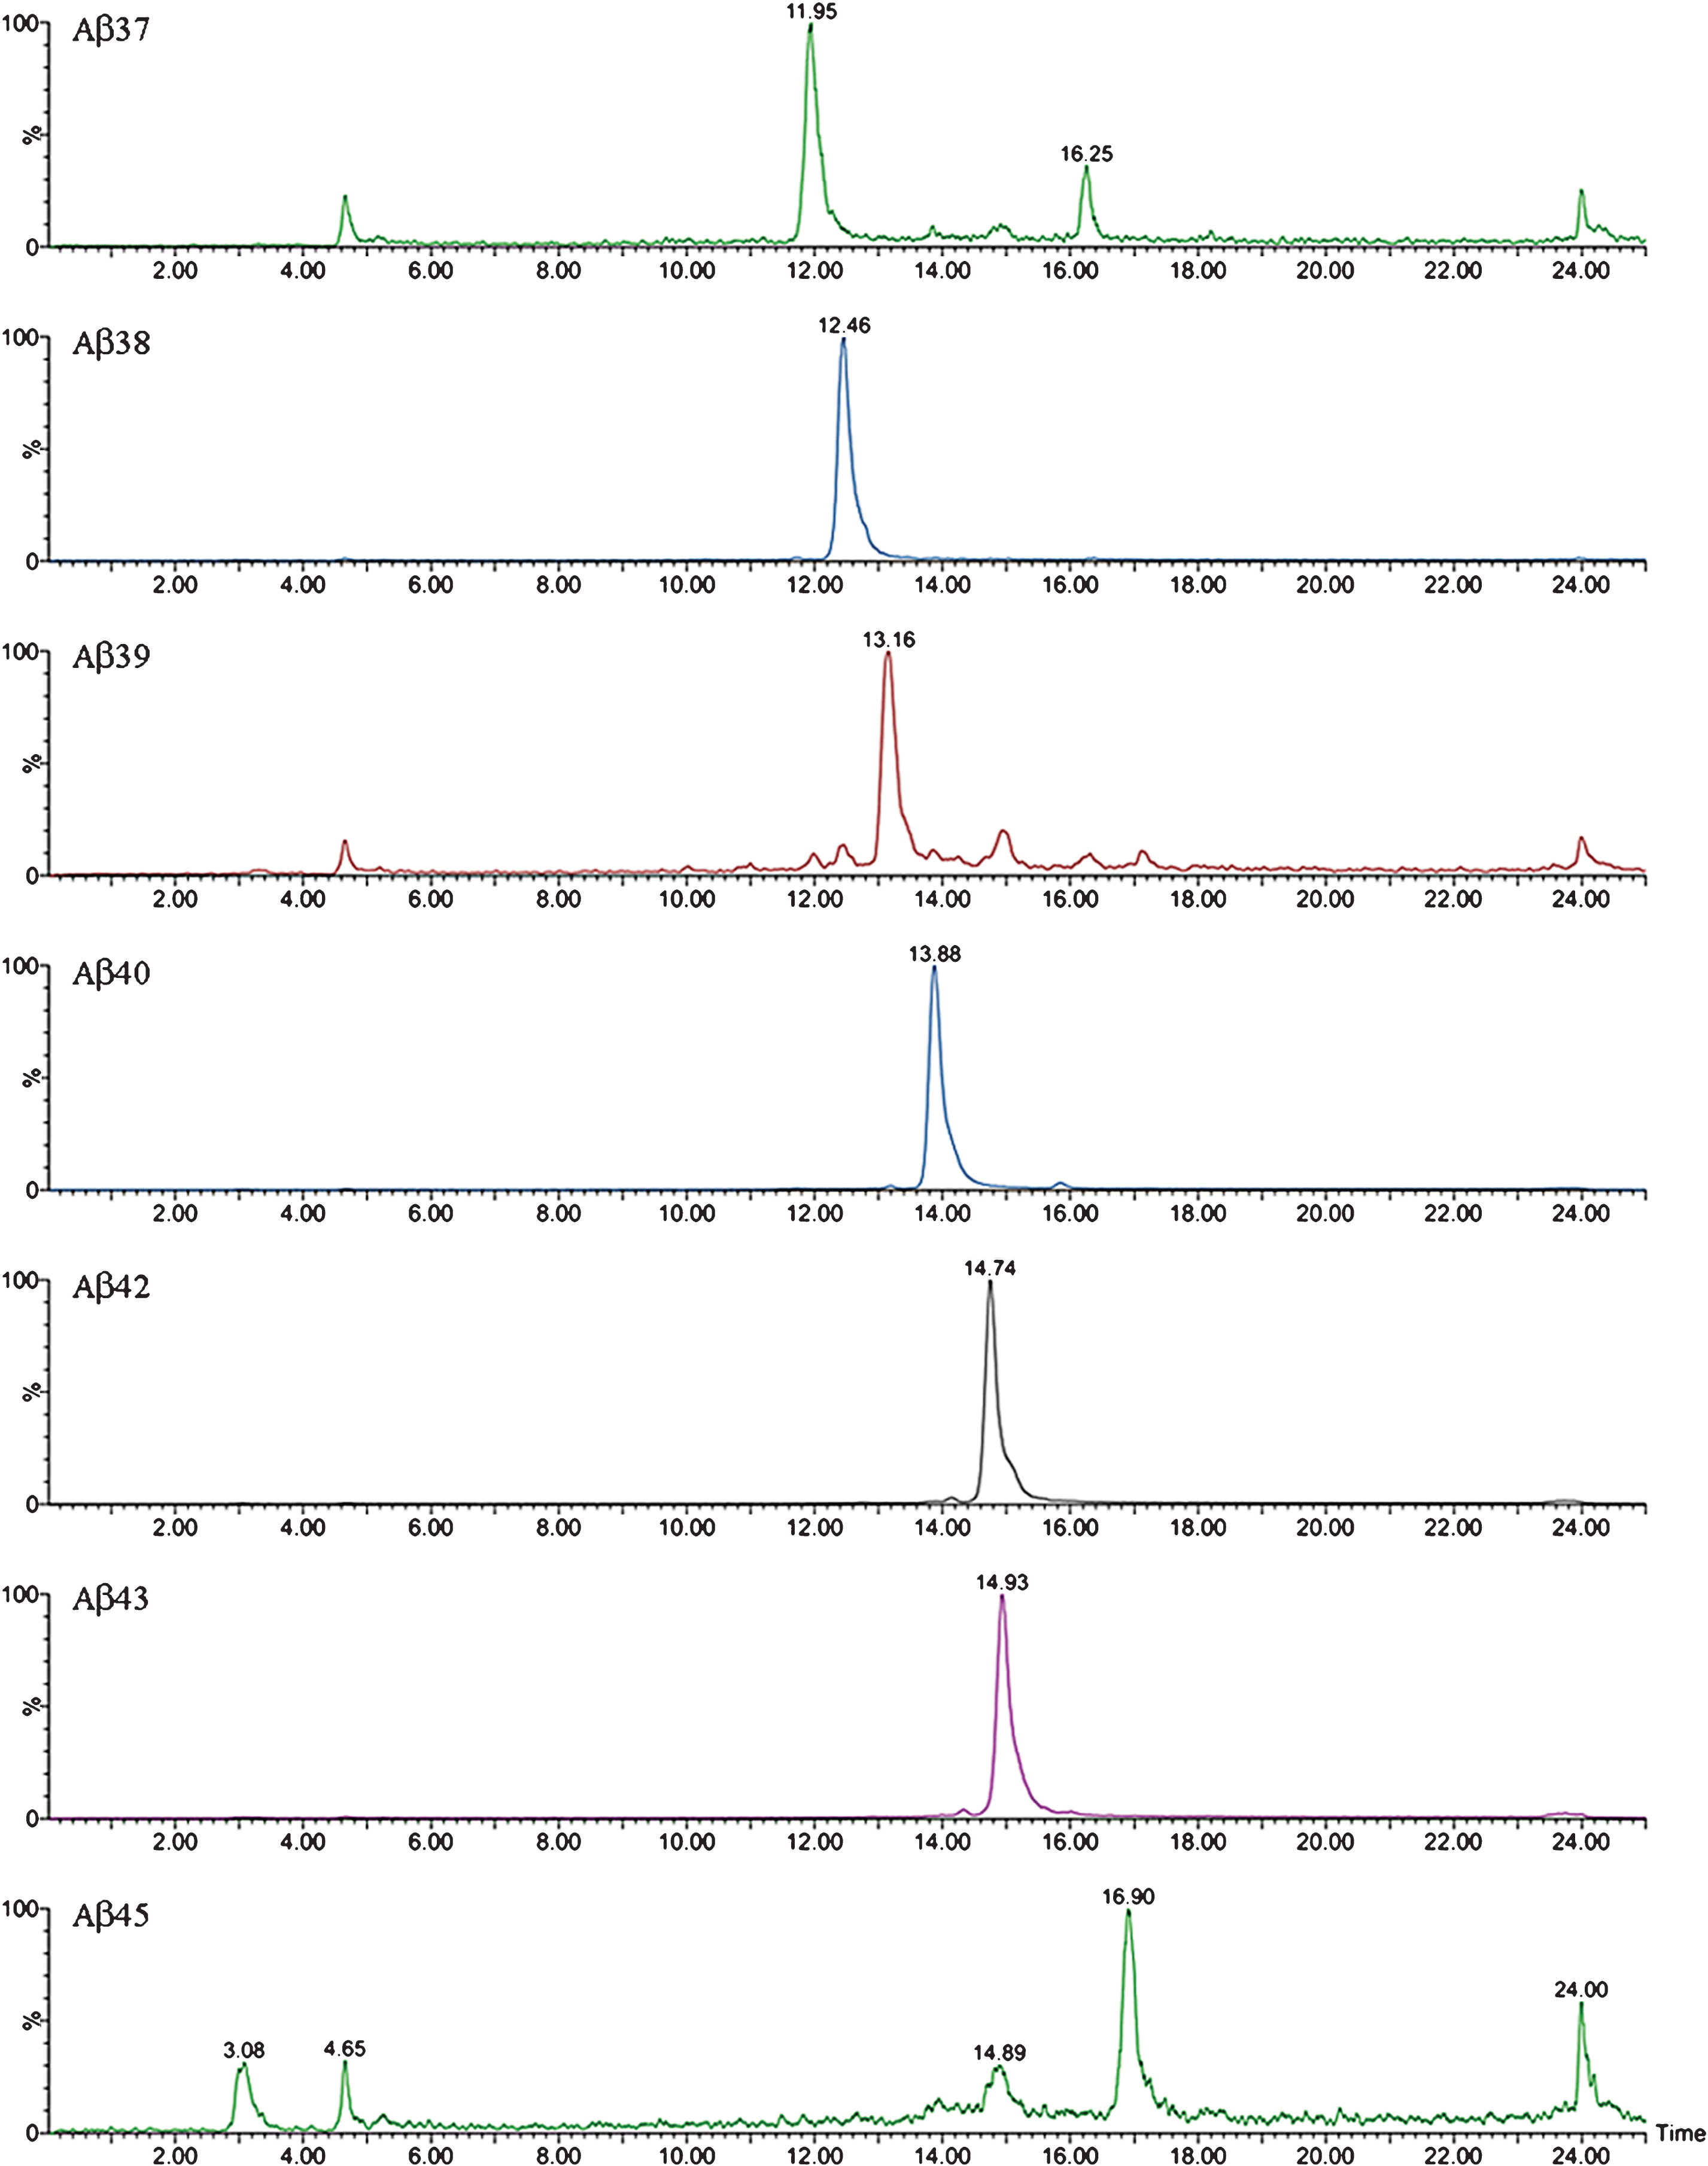
Fig.5
XIC of some of the truncated Aβ peptides detected by Micro LC-ESI-MS/MS in brain extract from APP/PS1 mice (aged 18 months).
Fig.6
XIC of some of the endogenous Aβ peptides detected by Micro LC-ESI-MS/MS in brain extract from APP/PS1 mice (aged 18 months).
Table 1
Summary of the Aβ peptides detected in each transgenic mouse model
| Peptide | APP/PS1 MALDI | Tg2576 MALDI | APP/PS1 LC-MS | Tg2576 LC-MS |
| Aβ1-19 | ✓ | ✓ | ||
| Aβ1-20 | ✓ | ✓ | ✓ | ✓ |
| mAβ11-38 | ✓ | |||
| Aβ11-40 | ✓ | ✓ | ✓ | |
| mAβ11-40 | ✓ | ✓ | ✓ | |
| mAβ12-42 | ✓ | |||
| Aβ8-38 | ✓ | |||
| mAβ12-43 | ✓ | |||
| Aβ11-42 | ✓ | ✓ | ✓ | |
| mAβ11-42 | ✓ | ✓ | ✓ | |
| Aβ11-43 | ✓ | ✓ | ||
| mAβ11-43 | ✓ | ✓ | ||
| Aβ7-40 | ✓ | |||
| Aβ8-40 | ✓ | |||
| Aβ8-42 | ✓ | ✓ | ||
| Aβ6-40 | ✓ | |||
| Aβ8-43 | ✓ | ✓ | ||
| Aβ7-42 | ✓ | |||
| Aβ1-34 | ✓ | ✓ | ||
| Aβ1-35 | ✓ | |||
| Aβ1-36 | ✓ | |||
| Aβ4-38 | ✓ | |||
| Aβ5-40 | ✓ | |||
| Aβ6-42 | ✓ | |||
| Aβpyr3-38 | ✓ | ✓ | ||
| Aβ3-38 | ✓ | ✓ | ||
| Aβ4-40 | ✓ | ✓ | ||
| Aβ5-42 | ✓ | |||
| Aβ1-37 | ✓ | ✓ | ✓ | ✓ |
| Aβpyr3-40 | ✓ | ✓ | ||
| Aβ1-38 | ✓ | ✓ | ✓ | ✓ |
| Aβ3-40 | ✓ | ✓ | ||
| Aβ4-42 | ✓ | |||
| Aβ2-40 | ✓ | ✓ | ||
| Aβ1-39 | ✓ | ✓ | ✓ | ✓ |
| mAβ1-40 | ✓ | ✓ | ||
| Aβpyr3-42 | ✓ | ✓ | ||
| Aβ3-42 | ✓ | ✓ * | ||
| Aβ1-40 | ✓ | ✓ | ✓ | ✓ |
| Aβ1-40ox | ✓ | ✓ | ✓ | |
| Aβ2-42 | ✓ | ✓ | ||
| mAβ1-42 | ✓ | ✓ | ||
| Aβpyr3-43 | ✓ | |||
| Aβ3-43 | ✓ | ✓ | ||
| Aβ1-42 | ✓ | ✓ | ✓ | ✓ |
| Aβ1-42ox | ✓ | ✓ | ✓ | |
| Aβ1-43 | ✓ | ✓ | ✓ | ✓ |
| Aβ1-43ox | ✓ | |||
| Aβ1-45 | ✓ | ✓ | ||
| mAβpyr11-40 | ✓ * | ✓ | ||
| mAβpyr11-42 | ✓ * | ✓ | ||
| mAβpyr11-43 | ✓ * | ✓ |
*Partial spectral overlap.


