
Early Cognitive Deficits in Type 2 Diabetes: A Population-Based Study
Abstract
Evidence links type 2 diabetes to dementia risk. However, our knowledge on the initial cognitive deficits in diabetic individuals and the factors that might promote such deficits is still limited. This study aimed to identify the cognitive domains initially impaired by diabetes and the factors that play a role in this first stage. Within the population-based Swedish National Study on Aging and Care–Kungsholmen, 2305 cognitively intact participants aged ≥60 y were identified. Attention/working memory, perceptual speed, category fluency, letter fluency, semantic memory, and episodic memory were assessed. Diabetes (controlled and uncontrolled) and prediabetes were ascertained by clinicians, who also collected information on vascular disorders (hypertension, heart diseases, and stroke) and vascular risk factors (VRFs, including smoking and overweight/obesity). Data were analyzed with linear regression models. Overall, 196 participants (8.5%) had diabetes, of which 144 (73.5%) had elevated glycaemia (uncontrolled diabetes); 571 (24.8%) persons had prediabetes. In addition, diabetes, mainly uncontrolled, was related to lower performance in perceptual speed (β – 1.10 [95% CI – 1.98, – 0.23]), category fluency (β – 1.27 [95% CI – 2.52, – 0.03]), and digit span forward (β – 0.35 [95% CI – 0.54, – 0.17]). Critically, these associations were present only among APOE ɛ4 non–carriers. The associations of diabetes with perceptual speed and category fluency were present only among participants with VRFs or vascular disorders. Diabetes, especially uncontrolled diabetes, is associated with poorer performance in perceptual speed, category fluency, and attention/primary memory. VRFs, vascular disorders, and APOE status play a role in these associations.
INTRODUCTION
Type 2 diabetes mellitus (hereafter referred to as diabetes) and prediabetes have been associated with an increased risk of cognitive impairment, accelerated cognitive decline, and dementia among older adults [1]. Yet, the cognitive effect of diabetes in non–demented elderly people, especially the initial phases of deterioration related to diabetes, remain insufficiently explored.
Previous research indicates that diabetes is related to decrements in several cognitive domains, including processing speed [2]. Other studies on the association of diabetes with different components of executive functions and memory have reported both positive and negative findings [3, 4]. Discrepancies among studies may reflect differences in study design, the inclusion of people with cognitive impairment and dementia, heterogeneity of tasks for assessing cognitive functions, and a lack of consideration of prediabetes, glycemic control, vascular risk factors (VRFs), and vascular disorders. Apolipoprotein ɛ4 allele (APOE ɛ4) is an established risk factor for late–onset Alzheimer’s disease, and this allele can also exacerbate the harmful effect of diabetes on cognitive functioning [5]. Further research is needed with regard to which factors may modulate the association between diabetes and cognitive functioning.
Thus, in this study we explored: 1) which cognitive domains are impaired early in diabetes; and 2) whether glycemic control, VRFs, vascular disorders, and APOE status modulate the association between diabetes and cognitive functioning among dementia–and cognitive impairment–free older adults.
MATERIAL AND METHODS
Study population
Study participants were derived from the baseline assessment in the population–based Swedish National Study on Aging and Care–Kungsholmen (SNAC–K) [6]. The study population consists of a random sample of individuals aged ≥60 years living at home or in institutions in the Kungsholmen district, Stockholm, Sweden. Of the 5111 persons initially invited for participation, 4590 were alive and eligible at baseline and 3363 (73.3%) agreed to be part of the baseline survey (March 2001 through June 2004). In order to investigate the early cognitive deficits associated with diabetes, participants with dementia, preclinical dementia, and cognitive impairment–no dementia (CIND) were excluded. Thus, the current study included 2305 participants who performed the cognitive protocol and were cognitively intact (Fig. 1). SNAC–K was approved by the Regional Ethical Review Board in Stockholm, Sweden. Written informed consent was obtained from all participants and, in the case of cognitive impairment, from a proxy (i.e., a close family member or guardian).
Data collection
Data on personal characteristics (i.e., age, sex, and education), lifestyle factors (smoking, alcohol consumption, and physical activity), systolic and diastolic blood pressure (SBP and DBP, respectively), and anthropometrics (i.e., height and weight), were collected through interviews and measurements by nurses following a structured protocol (available at http://www.snac.org). A comprehensive clinical examination was conducted by physicians, and trained psychologists assessed cognitive performance.
Educational level was measured as the maximum years of formal schooling and defined as low (≤8 years) or high (>8 years). Body mass index (BMI) was calculated as weight in kilograms divided by squared height in meters (kg/m2) and categorized into four groups: underweight (<18.5), normal weight (18.5–25), overweight (25–30), and obese (≥30). Arterial blood pressure was measured twice at a 5-min interval on the left arm in a sitting position with a sphygmomanometer; the mean of the two readings was used. Alcohol consumption was categorized into no/occasional or drinking (including light-to-moderate and heavy drinking), on the basis of frequency and amount of drinks on a typical drinking day. Smoking status was dichotomized as non-smoking (those who had never smoked or were former smokers) or current smoking. VRFs included smoking and overweight/obese (BMI ≥25). Physical activity was dichotomized as physically inactive (≤2–3 times per month of light-to-intense exercise) or physically active (participating in health- or fitness-enhancing exercise several times per week or every day) [6].
Information on medical conditions was available through the inpatient registry (IR) system that covers all hospitalizations in Stockholm since 1969. The criteria of the ninth and tenth revisions of the International Classification of Diseases (ICD– 9 and ICD– 10) were used. Medical drugs were collected in SNAC–K and classified according to the Anatomical Therapeutic Chemical (ATC) classification system. Medical conditions were ascertained on the basis of clinical examinations, self-reported medical histories, and the IR. Vascular disorders included hypertension, heart disease (arrhythmia, heart failure, coronary heart disease, and atrial fibrillation), and stroke. Hypertension was defined as ≥140/90 mmHg or the use of antihypertensive drugs (ATC codes C02, C03, and C07) and categorized as controlled (SBP <140 mmHg or DBP <90 mmHg) or uncontrolled (SBP ≥140 mmHg or DBP ≥90 mmHg) [7, 8]. Depression was diagnosed according to ICD-10 criteria [9]. Peripheral blood samples were taken from all participants to determine APOE allelic status that was dichotomized into any ɛ4 carriers or ɛ4 non–carriers.
Assessment of diabetes and prediabetes
Glycated hemoglobin (HbA1c) was measured using the Swedish Mono–S High Performance Liquid Chromatography. In accordance with the National Glycohemoglobin Standardization Program, 1.1% was added to the HbA1c value to equate them to international values [10]. Diabetes was ascertained based on medical history, IR (ICD– 9 code 250 and ICD– 10 code E11), use of hypoglycemic medications (ATC code A10), or HbA1c >6.4% (46 mmol/mol) [11, 12]. Prediabetes was defined as HbA1c of 5.7–6.4% (39–46 mmol/mol) in diabetes-free participants [11]. Participants with diabetes were classified as controlled (HbA1c 5.7–6.4%) or uncontrolled (HbA1c >6.4%). Duration of diabetes was calculated as the difference between chronological age at the baseline survey and the age at diagnosis, and dichotomized as short-term (<10 years) or long-term (≥10 years).
Dementia diagnosis and definition of cognitive impairment-no dementia
Global cognitive functioning was assessed with the Mini-Mental State Examination (MMSE). Dementia was diagnosed following The Diagnostic and Statistical Manual of Mental Disorders, Fourth Edition (DSM-IV) criteria, using a validated three–step procedure [12]. Two physicians independently made a preliminary diagnosis and, in case of disagreement, a third opinion was sought to reach a concordant diagnosis. Preclinical dementia referred to those participants who developed dementia during the first follow-up (which occurred after 6 years for cohorts 60–72 years and 3 years for cohorts aged ≥78 years, due to higher attrition among the older participants).
CIND is defined as a state in which a non-demented person shows significant global cognitive deficits. CIND was identified if the MMSE score was ≥2 standard deviations (SDs) below age- and education-specific means on the MMSE for participants aged 75 years [13, 14], and ≥1 SD below age- and education-specific means on the MMSE for participants aged ≥75 years [15]. As the inter–individual variability in cognitive performance is high in older ages, we chose a more conservative cut-off (1 SD) for those aged 75 years and above to exclude participants with even slight global cognitive impairment.
Assessment of cognitive functions in different domains
The cognitive assessment was comprised of a battery of 10 cognitive tests including domains of perceptual speed (digit cancellation, pattern comparison), category fluency (animals, professions), letter fluency (F and A), semantic memory (vocabulary, general knowledge), and episodic memory (word recall and recognition). Latent factor scores for these cognitive domains were generated using structural equation modeling (SEM)— for a detailed description see Laukka et al. [16]. Briefly, through SEM weights were derived to calculate the weighted means of the 10 cognitive tests to define the five cognitive domains [16]. In addition, the digit span forward and backward tests were administered and their original scores were used to assess attention/primary memory and working memory, respectively [17].
Statistical analyses
Multivariable linear regressions were used to estimate the mean difference (β-coefficients) with 95% confidence intervals (CIs) in cognitive performance among diabetes-free (reference), prediabetic, and diabetic persons. A separate linear regression model investigated the associations among diabetes-free participants (reference), prediabetes, controlled diabetes, and uncontrolled diabetes. Each cognitive domain was used as a separate outcome. Cognitive performance in each domain was divided into tertiles (low, middle, high). Multinomial logistic regressions were employed to examine the associations between diabetes and cognitive performance; in all models, the highest tertile (high performance) was used as reference category. Age, sex, education, vascular disorders, depression, APOE ɛ4, VRFs, physical activity, duration of diabetes, diabetes age–of–onset, and treatment of diabetes were considered as potential confounders.
Potential interactions between diabetes or glycemic control and factors such as smoking, overweight/obesity (BMI ≥ 25 kg/m2), vascular disorders, or APOE ɛ4, in predicting cognitive performance across domains were investigated. First, statistical interactions were examined by incorporating the two factors and their cross-product terms in the same model. For those analyses with significant interaction term, a stratified analysis by the factor of interaction was performed. To further investigate the joint association of diabetes with each factor in predicting cognitive performance, indicator variables combining the different levels of diabetes with each factor were created. These linear regression models were adjusted for age, sex, education, and all the remaining covariates.
Since BMI was missing for 51 (2.1%) participants, multiple imputation by chained equation (MICE) was done for missing data to obtain 50 datasets. We pooled the estimates using Rubin’s rule to obtain valid statistical inferences [18]. The sampling was corrected by introducing weights based on the age–and sex–specific structure of the adult population aged ≥ 60 years in the Kungsholmen area in 2001 (women 65.6% and men 34.4%) in all analyses. All tests were two-tailed and p values <0.05 were considered statistically significant. Statistical analyses were performed with Stata SE 14.0 (StataCorp LP, College Station, Texas, USA).
RESULTS
Characteristics of study population
Of all participants, 196 (8.5%) had diabetes, of which 144 (73.5%) with uncontrolled diabetes, and 571 (24.8%) persons had prediabetes. The prevalence of diabetes was comparable with that of another elderly Swedish population [19]. Among participants with diabetes, 121 (61.7%) reported treatment with hypoglycemic medications and/or diet. In comparison to diabetes-free people, participants with diabetes or prediabetes were more likely to be older, men, less educated, to have more vascular disorders and higher BMI, to be physically active, and to have lower MMSE scores (Table 1). Compared to diabetes-free participants, those with diabetes had lower performance in all cognitive domains, and individuals with prediabetes had lower performance in most cognitive domains (Fig. 2).
Diabetes and cognitive functioning
In basic-adjusted (by age, sex, and education) linear regressions, diabetes, mainly uncontrolled, was significantly associated with poorer performance in MMSE, perceptual speed, category fluency, and digit span forward, but not in letter fluency, semantic and episodic memory, or digit span backward (Table 2). In multi-adjusted (by age, sex, education, vascular disorders, depression, VRFs, and physical activity) models, the association between diabetes and digit span forward remained significant (β–coefficient (β) – 0.21, 95% CI – 0.39, – 0.02; p = 0.027), although diabetes was not significantly related to any other cognitive task (Supplementary Table 1). There was no reliable association between prediabetes and cognitive performance (Table 2). In the multinomial logistic regression, when cognitive functioning for each domain was divided into tertiles, diabetes, especially uncontrolled diabetes, was significantly related to increased odds of low (lowest tertile) performance in perceptual speed (Odds Ratio (OR) 1.94, 95% CI 1.15, 3.27; p = 0.014) compared to high (highest tertile) performance in the same domain.
Role of VRFs, vascular disorders, and APOE ɛ4 in the diabetes-cognition link
In stratified analyses by vascular disorders, depression, APOE ɛ4, VRFs, and physical activity, the relationship of diabetes to perceptual speed and category fluency were present only among participants with VRFs, vascular disorders, or APOE ɛ4 non-carriers (Table 3). However, the association between diabetes and digit span forward remained of the same magnitude and statistically significant among participants with and without overweight/obesity or vascular disorders; therefore, this association was not altered by VRFs or vascular disorders. Further, in the stratified analysis by age (younger old <78 years versus older old ≥ 78 years), the significant associations of diabetes with perceptual speed and category fluency were present only in the younger old cohort (Supplementary Figure 1), whereas the association of diabetes with digit span forward remained consistently significant in both age groups. There was a statistically significant interaction of diabetes with APOE ɛ4 (p = 0.020) in predicting digit span forward performance. Participants with diabetes who were ɛ4 non-carriers had poorer performance on digit span forward than those with diabetes who were ɛ4 carriers. We further investigated the joint association of diabetes and VRFs, vascular disorders, or APOE status in predicting cognitive performance across the different domains (Table 3). The association between perceptual speed or category fluency performance and diabetes was independently different across levels of smoking, overweight/obesity, and vascular disorders.
Supplementary analyses
Among participants with diabetes, oral hypoglycemic medication use was associated with an increased odds of low cognitive performance in category fluency (OR 47.2, 95% CI 5.22, 426.3; p = 0.001) and letter fluency (OR 6.4, 95% CI 1.24, 32.66; p = 0.027); insulin use was associated with increased odds for low digit span forward performance (OR 11.6, 95% CI 1.14, 117.4; p = 0.038), and tight glycemic control (HbA1c <6.5% versus HbA1c ≥ 6.5%) was linked to increased odds of low cognitive performance in digit span forward (OR 5.6, 95% CI 1.29, 24.54; p = 0.022), after multi–adjustment for age, sex, education, VRFs, vascular disorders, physical activity, and APOE ɛ4. There was no statistically significant association between duration of diabetes and cognitive performance. Differences in mean cognitive performance by glycemic status among participants with diabetes were further examined. Although individuals with uncontrolled diabetes had lower cognitive performance than those with controlled diabetes, there were no statistically significant differences (Supplementary Figure 2). We also assessed whether participants with diabetes had different cognitive performance by blood pressure management; no statistically significant differences were observed (data not shown).
The percentage of ɛ4 carriers was 28.1% (626/2228) among study participants, whereas it was 36.6% (104/286) among the cognitively impaired participants who were excluded (p = 0.004). Comparing characteristics of APOE ɛ4 carriers and non-carriers, no significant differences in terms of HbA1c, VRFs, vascular disorders, physical activity, or cognitive performance were observed. Analyses using imputed BMI data produced similar results.
DISCUSSION
In this population-based study of cognitively intact older adults, we found that: 1) diabetes, especially uncontrolled, but not prediabetes, was associated with poorer performance in perceptual speed, category fluency, and attention/primary memory; 2) these associations were only found in APOE ɛ4 non-carriers; and 3) the associations of diabetes with perceptual speed and category fluency were present only among older people with VRFs or vascular disorders. Our findings suggest that diabetes might affect cognitive domains differently, and some domains may be more sensitive to diabetes than others.
In the present study, where individuals with CIND and preclinical dementia were excluded, we observed an effect of diabetes on perceptual speed, category fluency, and attention/primary memory, suggesting that these three domains may be primarily affected by diabetes. Previous research examining the relation between diabetes and cognitive functioning has produced equivocal findings [2]. Some clinical studies in non-demented older adults showed that diabetes was associated with impaired processing speed, executive function, and episodic memory [20, 21], although other studies did not find such associations [2, 3]. An Italian population-based study revealed lower MMSE performance, selective attention, and verbal memory in older women with diabetes compared to those without diabetes [22]. However, in these studies CIND was not excluded. Therefore, as cognitive impairment represents an intermediate stage between healthy aging and dementia [23], the observed cognitive deficits associated with diabetes may not represent the initial domains affected, but rather reflect cognitive changes due to causes other than diabetes, such as an underlying degenerative neuropathology.
In addition to lowering the risk of vascular diseases, effective glycemic control may lower the risk of several diabetes-related complications, such as neuropathy. Most studies examining the relation between diabetes and cognitive functioning have not taken glycemic control into account. However, a few studies have reported that diabetes–related cognitive deficits may be attenuated by effective glycemic control [24, 25]. In our study of cognitively intact older adults, uncontrolled diabetes was associated with poorer performance in perceptual speed, but not in episodic and semantic memory. A possible explanation for the lack of association between diabetes and semantic memory is the differential effects of aging and age-related diseases on crystallized abilities (such as semantic memory) and fluid abilities (such as speed and fluency). In normal cognitive aging, crystallized abilities are much more resistant to age effects than fluid abilities [26]. Analogously, the effect of age-related diseases such as diabetes may affect speed and category fluency, but not semantic memory, as shown in the current study. Therefore, fluid abilities might be more sensitive to the effects of both age–related changes and diabetes, especially hyperglycemia. Deficits in perceptual speed could reflect abnormalities in white-matter connectivity, which may be caused by long-term chronic hyperglycemia [27]. Indeed, a recent study in a subsample of SNAC–K showed a link between diabetes and microstructural white-matter integrity [28]. Category fluency involves speed, working memory, and executive function components. A recent study observed altered functional brain activation in the frontal cortex during a working memory task in people with diabetes [29]. In line with this finding, we found an association of diabetes with category fluency. Although episodic memory may be considered a fluid ability, we failed to detect a significant association with diabetes, probably due to the episodic memory task in SNAC-K being demanding for all participants. This raises an important general point regarding group comparisons in neuropsychological research, namely that the performance level of the control group (in this case, diabetic-free people) in a specific task is as important to consider as the performance level of a clinical group.
The digit span test includes two tasks, forward and backward. Although they measure partly different cognitive skills, both depend on short-term memory [17]. However, digit span forward seems to resist deleterious effects of several conditions, such as cognitive decline in normal aging and early stages of dementia, whereas digit span backward is typically more sensitive to neurodegenerative changes and tends to show a more age-related decline compared to the forward task [17, 30]. A meta-analysis has shown that diabetes is associated with poorer performance in both digits forward and backward [2]. We found a robust association between uncontrolled diabetes and lower performance in digit span forward, but not backward. Although this pattern might appear paradoxical, a possible explanation is that digits backward is considerably more demanding than digits forward [17]. Thus, digits backward may have been highly taxing for participants with and without diabetes alike, thus resulting in failure to detect significant group differences.
Hyperglycemia is one of the mechanisms whereby diabetes could cause cognitive deficits. Chronic exposure to high levels of glucose leads to selective death of neurons, which obviously may lead to cognitive deficits [31]. First, chronic hyperglycemia is accompanied by insulin-resistance and compensatory peripheral hyperinsulinemia [32]. Second, hyperglycemia may increase oxidative stress, which stimulates the release of cytokines and other inflammatory agents promoting chronic inflammation and endothelial dysfunction leading to cerebral microvascular damage [33]. Third, in specific brain regions, hyperglycemia can induce progressive changes in the permeability of the blood brain barrier and progressively increase the susceptibility of the barrier to cerebral micro-vessel damages that may disrupt homeostasis and result in cognitive deficits [34]. On the other hand, tight glycemic control increases the risk of hypoglycemia – an additional mechanism that may underlie cognitive deficits in diabetes. Towards this end, antidiabetic medications, which focus on lowering blood sugar, are among the most common causes of hypoglycemia in older diabetic people [35].
Smoking, being overweight or obese, vascular disorders, and APOE ɛ4 are all risk factors for diabetes [36]. After controlling for VRFs and vascular disorders, the relationship of diabetes to perceptual speed and category fluency was attenuated and no longer significant suggesting that these behavioral and clinical factors contributed to the relationships observed in the initial analyses. In the stratified analyses we found that the negative associations between diabetes and cognitive performance were present only among individuals with VRFs and vascular disorders. Thus, VRFs and vascular disorders could modulate the effect of diabetes on cognitive functioning at early stages before the manifestation of overt cognitive impairment. Therefore, at least in the initial phases, diabetes may not be the sole actor; other factors may cause cognitive impairment.
Two population-based longitudinal studies have shown an association between diabetes and increased risk of dementia only among the APOE ɛ4 non-carriers [37, 38]. Relatedly, our results showed that the negative associations between diabetes and cognitive performance were present only in ɛ4 non-carriers. A possible explanation for this finding is that people possessing an ɛ4 allele deposit amyloid-β at a faster rate and have a higher amount of amyloid than those without this allele [38, 39]. Thus, APOE ɛ4 carriers may accumulate sufficient pathology to bring them to the threshold for expressing cognitive impairment or dementia, whereas ɛ4 non-carriers require further physiological insults, such as diabetes, to bring them to this threshold [38]. In support of this hypothesis, we found a greater proportion of ɛ4 carriers among the cognitively impaired participants, who were excluded from the study, than among the cognitively intact participants.
The main strengths of our study are: 1) the community-based cohort design; 2) the comprehensive assessment of cognitive functioning and dementia diagnosis, which enabled us to identify cognitively intact people; 3) the use of latent variables in measuring cognitive performance, thereby removing error variance associated with specific tasks; and 4) the evaluation of the association of diabetes with cognitive performance taking glycemic control and APOE into account. However, some limitations should be noted. First, the cross-sectional design raises concerns as to the temporal nature of the observed associations. Second, we used HbA1c to detect undiagnosed diabetes (diabetes in diabetes-free participants). As the receiver operating curve is 0.895 (95% CI 0.861, 0.930) for detecting diabetes using HbA1c [40], participants with impaired glucose tolerance might have been misclassified as diabetes-free, which would bias the results in the direction of reducing group differences. Third, as the age range of participants is 60 years and older, the generalizability of our results is restricted to this age span. Finally, we were unable to examine the role of insulin-resistance, specific antidiabetic drugs, brain atrophy and lesions in the association of diabetes with cognitive impairment, due to lack of available data for the present sample or the absence of blood-insulin measurement in SNAC–K.
In conclusion, our findings provide evidence that diabetes may affect certain cognitive domains (perceptual speed, category fluency, and attention/primary memory) before other domains. The identification of a combination of well-defined cognitive components affected by diabetes is relevant for several reasons. These include early diagnosis and health care planning, aiding in the selection of appropriate cognitive tests in order to optimize the time and not to stress the patient, and the ability to predict the possible progression from cognitive deficits to cognitive impairment and dementia.
In addition, VRFs, vascular disorders, and APOE ɛ4 play an important role in the diabetes–cognition association. Identification of these factors helps to provide insight into differences among patients in order to identify which diabetic patient would require a more detailed neurological investigation. Our study also highlights the need for better control of blood glucose and VRFs, and an effective treatment of vascular disorders in order to prevent cognitive impairment and dementia in older adults with diabetes.
ACKNOWLEDGMENTS
The authors would like to express their gratitude to the participants and staff involved in the data collection and management in the SNAC-K study. In addition, we are grateful to Emerald Heiland, Aging Research Center, Karolinska Institutet, for her valuable suggestions on the English in the manuscript.
SNAC-K is financially supported by the Swedish Ministry of Health and Social Affairs, the participating County Councils and Municipalities, and the Swedish Research Council. Additional funding was received from the Swedish Research Council for Health, Working Life and Welfare, the Board of Research Karolinska Institute, Ragnhild and Einar Lundströms Minne Lindhés Foundation, Diabetesfonden, the Stiftelsen För Gamla Tjänarinnor, the Gun och Bertil Stohnes Stiftelse (Sweden), Strokefonden, the American Federation for Aging Research (USA), and Karolinska Instituetet (KID-funding). L. Bäckman was also supported by an Alexander von Humboldt Research Award and a donation from the af Jochnick Foundation.
Authors’ disclosures available online (http://j-alz.com/manuscript-disclosures/16-0266r1).
Appendices
The supplementary material is available in the electronic version of this article: http://dx.doi.org/10.3233/JAD-160266.
REFERENCES
[1] | Biessels GJ , Strachan MW , Visseren FL , Kappelle LJ , Whitmer RA ((2014) ) Dementia and cognitive decline in type 2 diabetes and prediabetic stages: Towards targeted interventions. Lancet Diabetes Endocrinol 2: , 246–255. |
[2] | Palta P , Schneider AL , Biessels GJ , Touradji P , Hill-Briggs F ((2014) ) Magnitude of cognitive dysfunction in adults with type 2 diabetes: A meta-analysis of six cognitive domains and the most frequently reported neuropsychological tests within domains. J Int Neuropsychol Soc 20: , 278–291. |
[3] | Reijmer YD , Brundel M , de Bresser J , Kappelle LJ , Leemans A , Biessels GJ ((2013) ) Microstructural white matter abnormalities and cognitive functioning in type 2 diabetes: A diffusion tensor imaging study. Diabetes Care 36: , 137–144. |
[4] | Yeung SE , Fischer AL , Dixon RA ((2009) ) Exploring effects of type 2 diabetes on cognitive functioning in older adults. Neuropsychology 23: , 1–9. |
[5] | Ravona-Springer R , Heymann A , Schmeidler J , Sano M , Preiss R , Koifman K , Hoffman H , Silverman JM , Beeri MS ((2014) ) The ApoE4 genotype modifies the relationship of long-term glycemic control with cognitive functioning in elderly with type 2 diabetes. Eur Neuropsychopharmacol 24: , 1303–1308. |
[6] | Rydwik E , Welmer AK , Kåreholt I , Angleman S , Fratiglioni L , Wang HX ((2013) ) Adherence to physical exercise recommendations in people over 65: The SNAC–Kungsholmen study. Eur J Public Health 23: , 799–804. |
[7] | Chobanian AV , Bakris GL , Black HR , Cushman WC , Green LA , Izzo JL Jr , Jones DW , Materson BJ , Oparil S , Wright JT Jr , Roccella EJ , National Heart, Lung, and Blood Institute Joint National Committee on Prevention, Detection, Evaluation, and Treatment of High Blood Pressure, National High Blood Pressure Education Program Coordinating Committee ((2003) ) The seventh report of the joint national committee on prevention, detection, evaluation, and treatment of high blood pressure: The JNC 7 report. JAMA 289: , 2560–2572. |
[8] | James PA , Oparil S , Carter BL , Cushman WC , Dennison-Himmelfarb C , Handler J , Lackland DT , LeFevre ML , MacKenzie TD , Ogedegbe O , Smith SC Jr , Svetkey LP , Taler SJ , Townsend RR , Wright JT Jr , Narva AS , Ortiz E ((2014) ) 2014 evidence-based guideline for the management of high blood pressure in adults: Report from the panel members appointed to the Eighth Joint National Committee (JNC 8). JAMA 311: , 507–520. |
[9] | Pantzar A , Laukka EJ , Atti AR , Fastbom J , Fratiglioni L , Bäckman L ((2014) ) Cognitive deficits in unipolar old-age depression: A population-based study. Psychol Med 44: , 937–947. |
[10] | Goodall I ((2005) ) HbA1c standardisation destination–global IFCC Standardisation. How, why, where and when–a tortuous pathway from kit manufacturers, via inter-laboratory lyophilized and whole blood comons to designated national comparison schemes. Clin Biochem Rev 26: , 5–19. |
[11] | American Diabetes Association ((2013) ) Diagnosis and classification of diabetes mellitus. Diabetes Care 36: , S67–S74. |
[12] | Xu WL , Pedersen NL , Keller L , Kalpouzos G , Wang HX , Graff C , Winblad B , Bäckman L , Fratiglioni L ((2015) ) HHEX_23 AA genotype exacerbates effect of diabetes on dementia and Alzheimer disease: A population-based longitudinal study. PLoS Med 12: , e1001853. |
[13] | De Ronchi D , Berardi D , Menchetti M , Ferrari G , Serretti A , Dalmonte E , Fratiglioni L ((2005) ) Occurrence of cognitive impairment and dementia after the age of 60: A population-based study from Northern Italy. Dement Geriatr Cogn Disord 19: , 97–105. |
[14] | Magni E , Binetti G , Bianchetti A , Rozzini R , Trabucchi M ((1996) ) Mini-Mental State Examination: A normative study in Italian elderly population. Eur J Neurol 3: , 198–202. |
[15] | Caracciolo B , Palmer K , Monastero R , Winblad B , Backman L , Fratiglioni L ((2008) ) Occurrence of cognitive impairment and dementia in the community: A 9-year-long prospective study. Neurology 70: , 1778–1785. |
[16] | Laukka EJ , Lövdén M , Herlitz A , Karlsson S , Ferencz B , Pantzar A , Keller L , Graff C , Fratiglioni L , Bäckman L ((2013) ) Genetic effects on old-age cognitive functioning: A population-based study. Psychol Aging 28: , 262–274. |
[17] | Lezack M , Howieson DB , Bigler ED , Tranel D ((2012) ) Neuropsychological assessment, 5th ed, Oxford University Press, New York. |
[18] | Rizzuto D , Orsini N , Qiu C , Wang HX , Fratiglioni L ((2012) ) Lifestyle, social factors, and survival after age 75: Population based study. BMJ 345: , e5568. |
[19] | Xu WL , Qiu CX , Wahlin A , Winblad B , Fratiglioni L ((2004) ) Diabetes mellitus and risk of dementia in the Kungsholmen project: A 6-year follow-up study. Neurology 63: , 1181–1186. |
[20] | van den Berg E , Reijmer YD , de Bresser J , Kessels RP , Kappelle LJ , Biessels GJ ((2010) ) A 4 year follow-up study of cognitive functioning in patients with type 2 diabetes mellitus. Diabetologia 53: , 58–65. |
[21] | Takeuchi A , Matsushima E , Kato M , Konishi M , Izumiyama H , Murata Y , Hirata Y ((2012) ) Characteristics of neuropsychological functions in inpatients with poorly-controlled type 2 diabetes mellitus. J Diabetes Investig 3: , 325–330. |
[22] | Maggi S , Limongi F , Noale M , Romanato G , Tonin P , Rozzini R , Scafato E , Crepaldi G , ILSA Study Group ((2009) ) Diabetes as a risk factor for cognitive decline in older patients. Dement Geriatr Cogn Disord 27: , 24–33. |
[23] | Petersen RC , Caracciolo B , Brayne C , Gauthier S , Jelic V , Fratiglioni L ((2014) ) Mild cognitive impairment: A concept in evolution. J Intern Med 275: , 214–228. |
[24] | Gao L , Matthews FE , Sargeant LA , Brayne C ((2008) ) An investigation of the population impact of variation in HbA1c levels in older people in England and Wales: From a population based multi-centre longitudinal study. BMC Public Health 8: , 54. |
[25] | Shorr RI , de Rekeneire N , Resnick HE , Yaffe K , Somes GW , Kanaya AM , Simonsick EM , Newman AB , Harris TB ((2006) ) Glycemia and cognitive function in older adults using glucose-lowering drugs. J Nutr Health Aging 10: , 297–301. |
[26] | Bergman I , Almkvist O ((2013) ) The effect of age on fluid intelligence is fully mediated by physical health. Arch Gerontol Geriatr 57: , 100–109. |
[27] | Reijmer YD , Leemans A , Brundel M , Kappelle LJ , Biessels GJ ((2013) ) Disruption of the cerebral white matter network is related to slowing of information processing speed in patients with type 2 diabetes. Diabetes 62: , 2112–2115. |
[28] | Wang R , Fratiglioni L , Laukka EJ , Lövdén M , Kalpouzos G , Keller L , Graff C , Salami A , Bäckman L , Qiu C ((2015) ) Effects of vascular risk factors and APOE ɛ4 on white matter integrity and cognitive decline. Neurology 84: , 1128–1135. |
[29] | He XS , Wang ZX , Zhu YZ , Wang N , Hu X , Zhang DR , Zhu DF , Zhou JN ((2015) ) Hyperactivation of working memory-related brain circuits in newly diagnosed middle-aged type 2 diabetics. Acta Diabetol 52: , 133–142. |
[30] | Hester RL , Kinsella GJ , Ong B ((2004) ) Effect of age on forward and backward span tasks. J Int Neuropsychol Soc 10: , 475–481. |
[31] | Ghasemi R , Haeri A , Dargahi L , Mohamed Z , Ahmadiani A ((2012) ) Insulin in the brain: Sources, localization and functions. Mol Neurobiol 47: , 145–171. |
[32] | Craft S , Cholerton B , Baker LD ((2013) ) Insulin and Alzheimer’s disease: Untangling the web. J Alzheimers Dis 33: (Suppl 1), S263–S275. |
[33] | Rochette L , Zeller M , Cottin Y , Vergely C ((2014) ) Diabetes, oxidative stress and therapeutic strategies. Biochim Biophys Acta 1840: , 2709–2729. |
[34] | Huber JD , VanGilder RL , Houser KA ((2006) ) Streptozotocin-induced diabetes progressively increases blood-brain barrier permeability in specific brain regions in rats. Am J Physiol Heart Circ Physiol 291: , H2260–H2668. |
[35] | Thorpe CT , Gelland WF , Good CB , Zhang A , Zhao X , Mor M , Fine MJ ((2015) ) Tight glycemic control and use of hypoglycemic medications in older veterans with type 2 diabetes and comorbid dementia. Diabetes Care 38: , 588–595. |
[36] | Koekkoek PS , Kappelle LJ , van den Berg E , Rutten GE , Biessels GJ ((2015) ) Cognitive function in patients with diabetes mellitus: Guidance for daily care. Lancet Neurol 14: , 329–340. |
[37] | Xu W , Qiu C , Winblad B , Fratiglioni L ((2007) ) The effect of borderline diabetes on the risk of dementia and Alzheimer’s disease. Diabetes 56: , 211–216. |
[38] | Borenstein AR , Wu Y , Mortimer JA , Schellenberg GD , McCormick WC , Bowen JD , McCurry S , Larson EB ((2005) ) Developmental and vascular risk factors for Alzheimer’s disease. Neurobiol Aging 26: , 325–334. |
[39] | Wirth M , Villeneuve S , La Joie R , Marks SM , Jagust WJ ((2014) ) Gene-environment interactions: Lifetime cognitive activity, APOE genotype, and beta-amyloid burden. J Neurosci 34: , 8612–8617. |
[40] | van ‘t Riet E , Alssema M , Rijkelijkhuizen JM , Kostense PJ , Nijpels G , Dekker JM ((2010) ) Relationship between A1C and glucose levels in the general Dutch population: The new Hoorn study. Diabetes Care 33: , 61–66. |
Figures and Tables
Fig.1
Flowchart of the baseline study population in SNAC–K. MMSE, Mini-Mental State Examination.
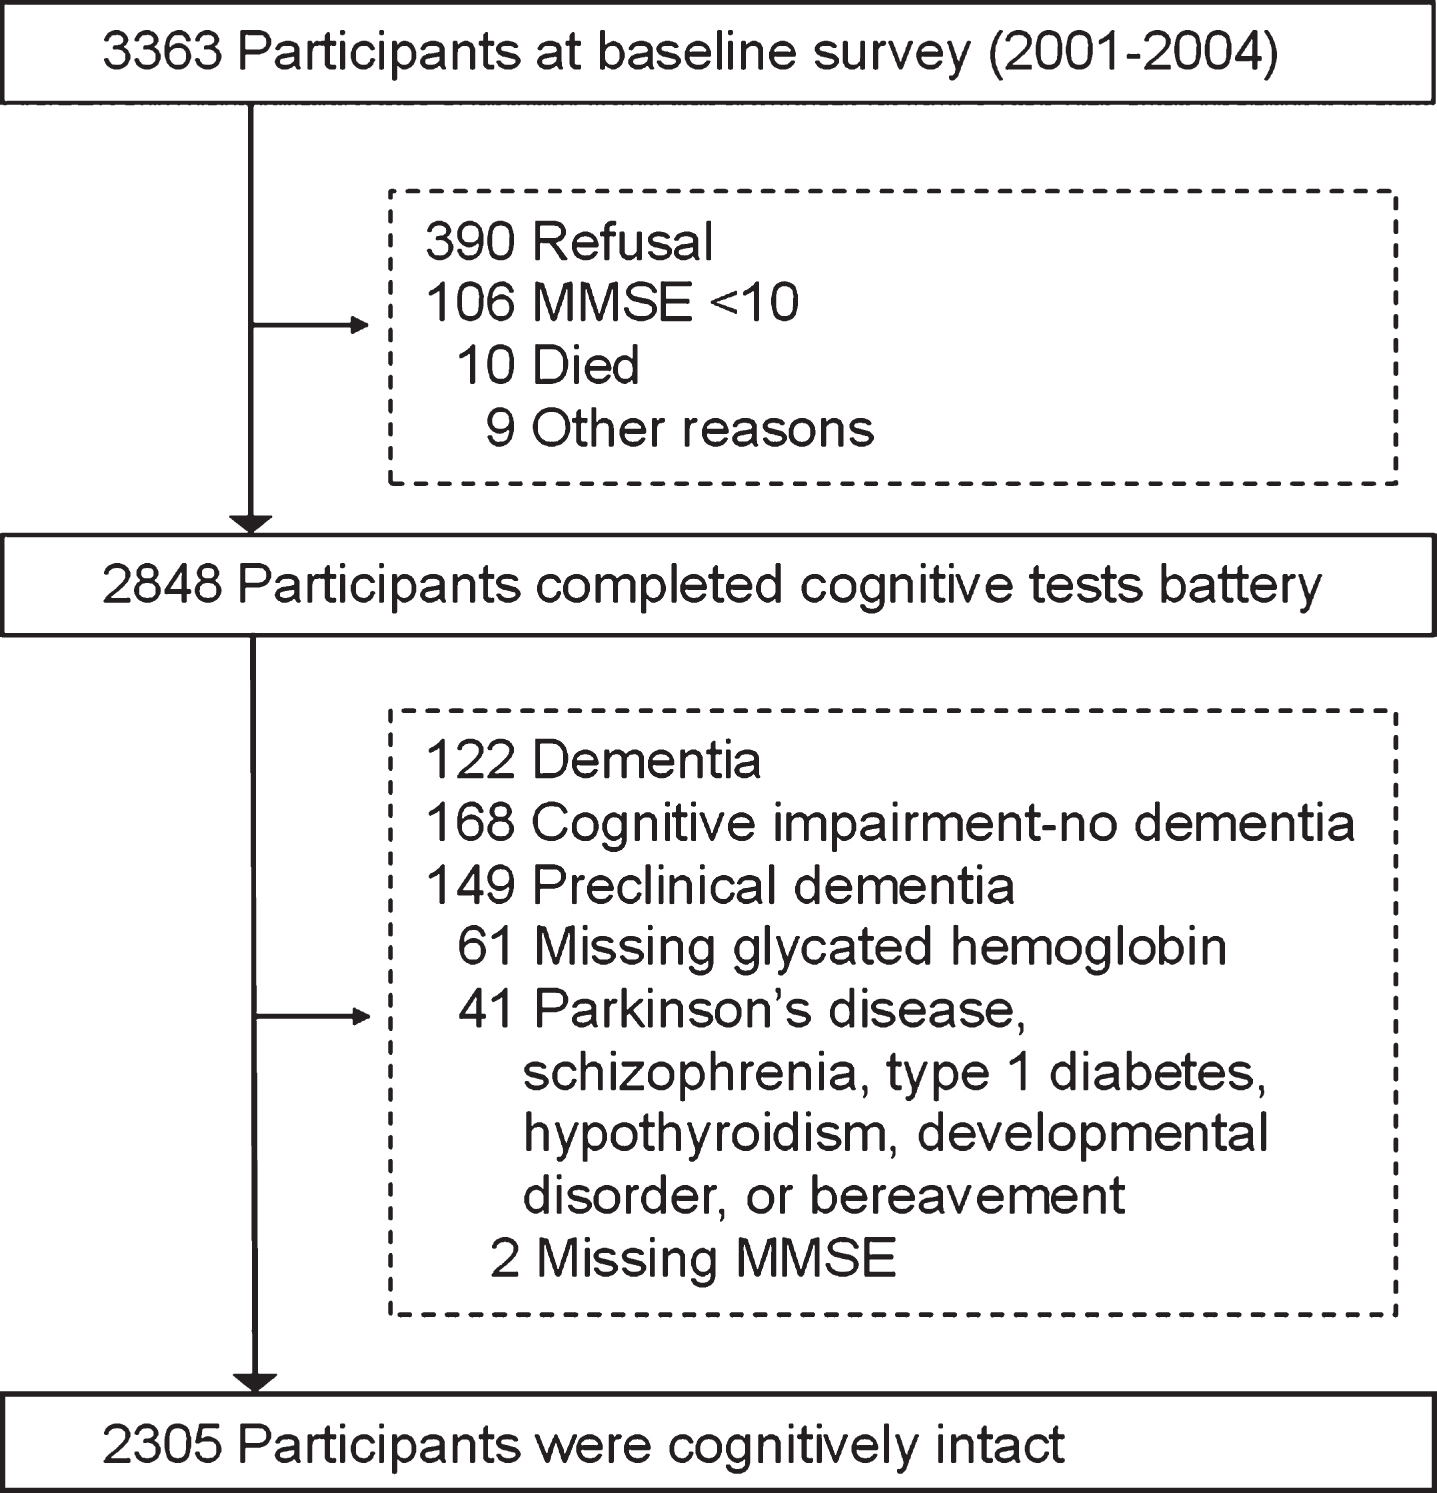
Fig.2
Cognitive characteristics of the study sample by diabetes. Pairwise multiple comparisons: *p<0.05 (reference group included diabetes-free participants). All latent factor scores were multiplied by 100. Missing data: 48 for perceptual speed, 8 for category fluency, 11 for letter fluency, 6 for semantic memory, 20 for episodic memory, 57 for digit span forward, and 62 for digit span backward.
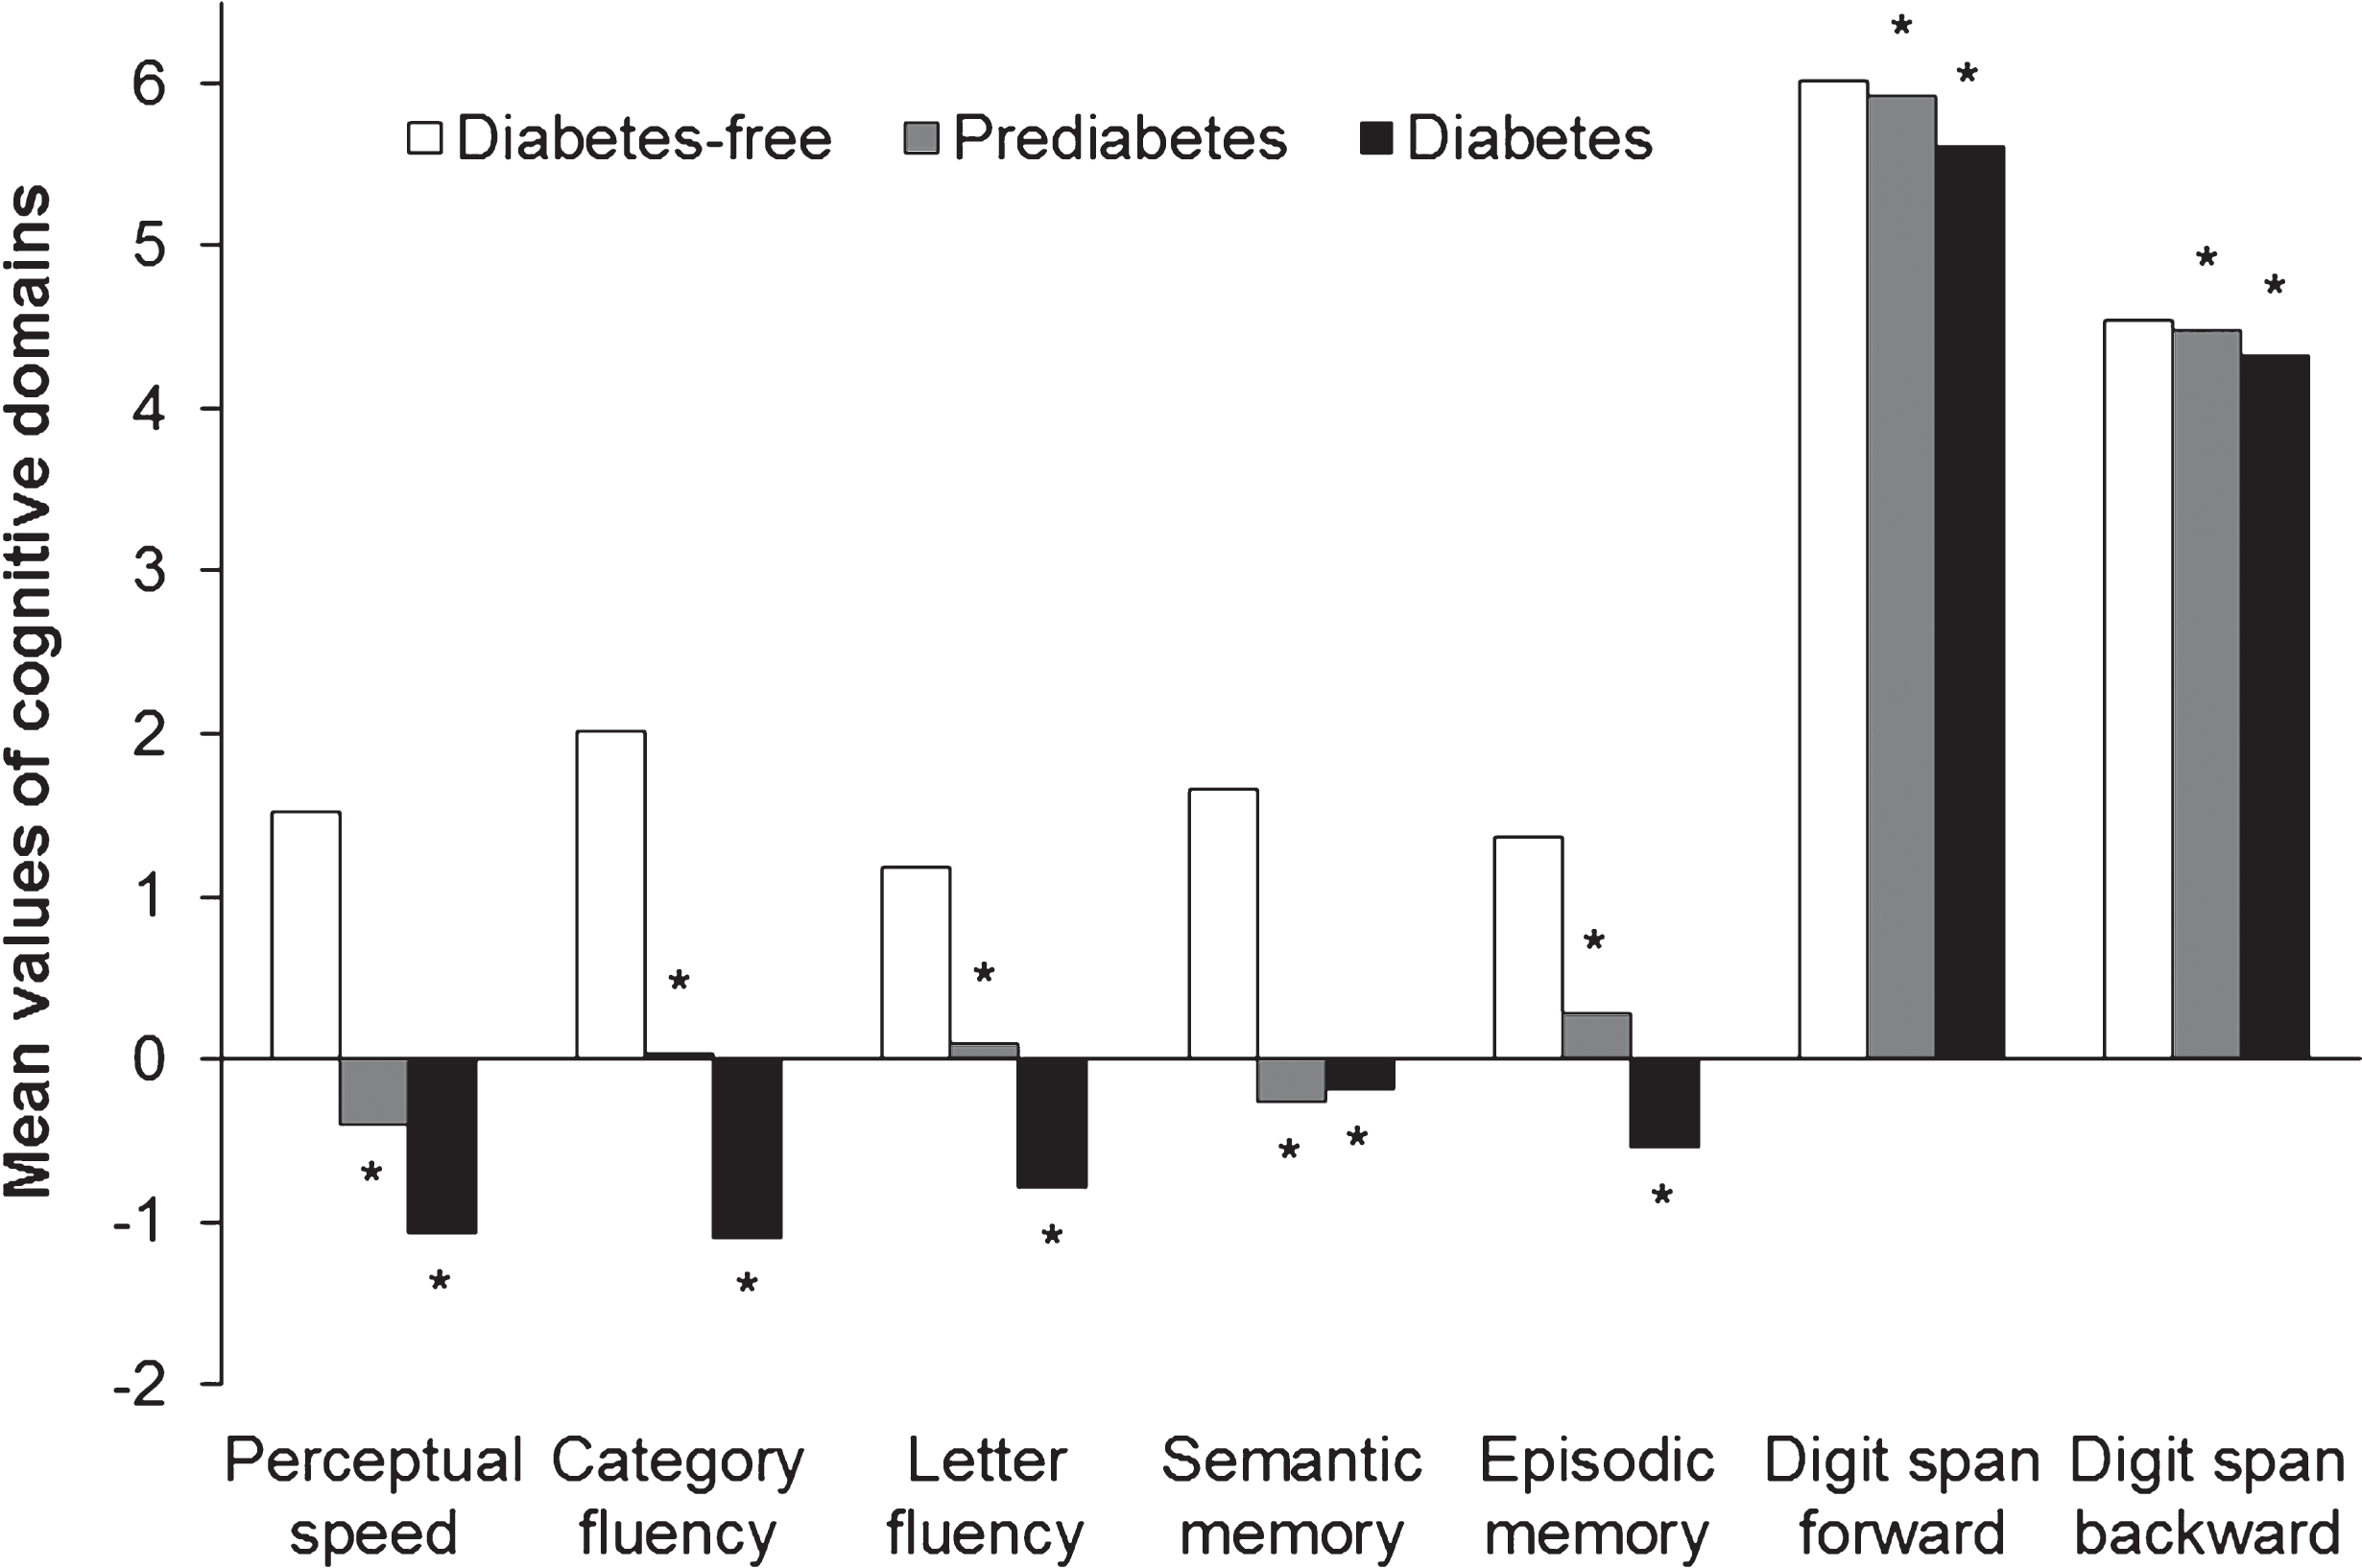
Table 1
Sociodemographic, clinical, and lifestyle related characteristics of the study sample (n = 2305) by diabetes status
| Characteristics | Diabetes-free | Prediabetes | Diabetes | p |
| (n = 1538) | (n = 571) | (n = 196) | ||
| Age (y) | 71±10 | 74±10 | 73±9 | < 0.001 |
| Female | 965 (62.7) | 372 (65.2) | 86 (43.9) | < 0.001 |
| Education | ||||
| Low (≤8 y) | 288 (18.7) | 155 (27.2) | 57 (29.1) | < 0.001 |
| High (>8 y) | 1250 (81.3) | 416 (72.9) | 139 (70.9) | |
| MMSE, mean (SD) | 29.0±1.0 | 29.0±1.0 | 28.0±2.0 | < 0.001 |
| Hypertension | 1094 (71.2) | 450 (79.0) | 173 (88.3) | < 0.001 |
| Heart disease | 366 (23.8) | 193 (33.8) | 98 (46.9) | < 0.001 |
| Stroke | 102 (6.6) | 53 (9.3) | 18 (9.2) | 0.079 |
| Depression | 58 (3.8) | 11 (1.9) | 5 (2.6) | 0.088 |
| HbA1c (%)* | 5.4 (5.2–5.6) | 5.9 (5.8–6.1) | 7.1 (6.3–7.3) | < 0.001 |
| Any APOE ɛ4 | 422 (28.7) | 155 (28.7) | 42 (22.7) | 0.217 |
| BMI (kg/m2)* | 25.1 (23.0–27.6) | 25.8 (23.5–28.5) | 27.7 (24.8–30.6) | < 0.001 |
| Underweight (<18.5) | 71 (4.6) | 21 (3.7) | 8 (4.1) | < 0.001 |
| Normal (18.5–25) | 666 (43.3) | 207 (36.3) | 44 (22.5) | |
| Overweight (25–30) | 625 (40.6) | 232 (40.6) | 76 (38.8) | |
| Obese (≥30) | 152 (9.9) | 98 (17.2) | 63 (32.1) | |
| Missing | 24 (1.6) | 13 (2.3) | 5 (2.6) | |
| Current smoking | 832 (54.4) | 312 (54.8) | 115 (59.3) | 0.434 |
| Alcohol drinking | 1189 (77.4) | 354 (62.2) | 120 (61.9) | < 0.001 |
| Physically active | 328 (21.3) | 159 (27.9) | 72 (36.7) | < 0.001 |
Data are presented as mean±SD, n (%), or *median (25th– 75th percentile; p calculated with quantile regression). Missing data: 2 for hypertension, and 113 for APOE. APOE, apolipoprotein; BMI, body mass index; HbA1c, glycated hemoglobin; MMSE, Mini-Mental State Examination; SD, standard deviation.
Table 2
Mean differences (β– coefficients) and 95% confidence intervals (CIs) of the association between diabetes and cognitive performance across domains
| Diabetes | n | MMSE | Perceptual speed | Category fluency | Letter fluency | ||||
| β (95% CI) | p | β (95% CI) | p | β (95% CI) | p | β (95% CI) | p | ||
| No | 1538 | Reference | Reference | Reference | Reference | ||||
| Prediabetes | 571 | – 0.01 (– 0.12 to 0.12) | 0.913 | – 0.23 (– 0.78 to 0.32) | 0.417 | 0.05 (– 0.75 to 0.85) | 0.899 | – 0.17 (– 1.02 to 0.68) | 0.696 |
| Diabetes | 196 | – 0.16 (– 0.32 to 0.01) | 0.059 | – 1.10 (– 1.98 to – 0.23) | 0.014 | – 1.27 (– 2.52 to – 0.03) | 0.045 | – 0.77 (– 2.08 to 0.54) | 0.250 |
| Controlled | 52 | – 0.03 (– 0.34 to 0.29) | 0.864 | – 0.54 (– 2.41 to 1.32) | 0.569 | – 0.91 (– 2.87 to 1.05) | 0.362 | – 0.36 (– 2.63 to 1.92) | 0.758 |
| Uncontrolled | 144 | – 0.21 (– 0.39 to – 0.02) | 0.030 | – 1.31 (– 2.25 to – 0.37) | 0.006 | – 1.40 (– 2.89 to 0.09) | 0.065 | – 0.92 (– 2.45 to 0.62) | 0.241 |
| Diabetes | Semantic memory | Episodic memory | Digit span forward | Digit span backward | |||||
| β (95% CI) | p | β (95% CI) | p | β (95% CI) | p | β (95% CI) | p | ||
| No | 1538 | Reference | Reference | Reference | Reference | ||||
| Prediabetes | 571 | – 0.69 (– 1.60 to 0.23) | 0.140 | 0.24 (– 0.47 to 0.95) | 0.505 | – 0.01 (– 0.14 to 0.11) | 0.853 | 0.02 (– 0.09 to 0.14) | 0.694 |
| Diabetes | 196 | – 0.61 (– 1.97 to 0.75) | 0.379 | – 0.48 (– 1.64 to 0.68) | 0.418 | – 0.35 (– 0.54 to – 0.17) | 0.000 | – 0.14 (– 0.31 to 0.04) | 0.119 |
| Controlled | 52 | 1.11 (– 1.01 to 3.22) | 0.305 | – 0.72 (– 1.22 to 2.66) | 0.470 | – 0.38 (– 0.72 to – 0.04) | 0.031 | – 0.13 (– 0.41 to 0.14) | 0.337 |
| Uncontrolled | 144 | – 1.22 (– 2.84 to 0.39) | 0.138 | – 0.92 (– 2.28 to 0.44) | 0.184 | – 0.35 (– 0.56 to – 0.14) | 0.001 | – 0.14 (– 0.34 to 0.07) | 0.185 |
Basic–adjusted model: adjusted for age, sex, and education. MMSE, Mini-Mental State Examination.
Table 3
Multivariable–adjusted mean differences (β– coefficients) and 95% confidence intervals (CIs) across cognitive domains, according to specific joint levels of diabetes with smoking, overweight/obesity (BMI ≥25), vascular disorders, or APOE status
| Factors | Diabetes | MMSE | Perceptual speed | Category fluency | Digit span forward | ||||
| β (95% CI) | p | β (95% CI) | p | β (95% CI) | p | β (95% CI) | p | ||
| Smoking | |||||||||
| No | No | Reference | Reference | Reference | Reference | ||||
| No | Yes | 0.07 (– 0.18 to 0.31) | 0.600 | – 0.05 (– 1.32 to 1.38) | 0.946 | 0.46 (– 1.27 to 2.20) | 0.600 | – 0.33 (– 0.64 to – 0.02) | 0.037 |
| Yes | No | 0.04 (– 0.07 to 0.15) | 0.525 | 0.23 (– 0.38 to 0.83) | 0.453 | 0.46 (– 0.39 to 1.33) | 0.290 | 0.05 (– 0.09 to 0.18) | 0.490 |
| Yes | Yes | – 0.15 (– 0.36 to 0.05) | 0.144 | – 1.59 (– 2.50 to – 0.35) | 0.004 | – 1.69 (– 3.21 to – 0.18) | 0.029 | – 0.15 (– 0.38 to 0.10) | 0.200 |
| BMI ≥25 | |||||||||
| No | No | Reference | Reference | Reference | Reference | ||||
| No | Yes | 0.06 (– 0.20 to 0.32) | 0.644 | – 0.27 (– 1.85 to 1.32) | 0.742 | – 0.56 (– 2.87 to 1.75) | 0.633 | – 0.44 (– 0.80 to – 0.07) | 0.019 |
| Yes | No | 0.04 (– 0.05 to 0.12) | 0.359 | 0.02 (– 0.51 to 0.54) | 0.949 | 0.13 (– 0.64 to 0.91) | 0.741 | – 0.22 (– 0.34 to – 0.09) | 0.001 |
| Yes | Yes | – 0.07 (– 0.23 to 0.08) | 0.356 | – 1.63 (– 2.58 to – 0.67) | 0.001 | – 1.36 (– 2.75 to 0.04) | 0.058 | – 0.41 (– 0.63 to – 0.19) | 0.000 |
| Vascular | |||||||||
| disorders | |||||||||
| No | No | Reference | Reference | Reference | Reference | ||||
| No | Yes | – 0.01 (– 0.20 to 0.17) | 0.904 | – 0.68 (– 1.80 to 0.43) | 0.231 | – 1.21 (– 2.86 to 0.44) | 0.151 | – 0.33 (– 0.59 to – 0.07) | 0.014 |
| Yes | No | – 0.02 (– 0.12 to 0.08) | 0.680 | – 0.97 (– 1.57 to – 0.37) | 0.001 | – 1.14 (– 2.02 to – 0.26) | 0.011 | – 0.10 (– 0.24 to 0.04) | 0.171 |
| Yes | Yes | – 0.15 (– 0.33 to 0.03) | 0.104 | – 2.90 (– 4.01 to – 1.80) | 0.000 | – 2.44 (– 4.05 to – 0.83) | 0.003 | – 0.28 (– 0.53 to – 0.02) | 0.033 |
| APOE ɛ4 | |||||||||
| No | No | Reference | Reference | Reference | Reference | ||||
| No | Yes | – 0.14 (– 0.34 to 0.05) | 0.138 | – 1.11 (– 2.15 to – 0.06) | 0.038 | – 1.07 (– 2.42 to 0.29) | 0.123 | – 0.36 (– 0.58 to – 0.14) | 0.001 |
| Yes | No | – 0.04 (– 0.16 to 0.08) | 0.523 | – 0.86 (– 1.47 to 0.25) | 0.006 | 0.27 (– 0.68 to 1.22) | 0.576 | – 0.05 (– 0.20 to 0.11) | 0.554 |
| Yes | Yes | 0.18 (– 0.02 to 0.37) | 0.076 | – 1.31 (– 2.89 to 0.25) | 0.100 | 0.08 (– 2.15 to 2.32) | 0.941 | 0.04 (– 0.32 to 0.41) | 0.814 |
Four separate models are presented in this table. In each model, we introduced an interaction term between diabetes and one of the factors adjusted for age, sex, education, and all the remaining factors. APOE, apolipoprotein; BMI, body mass index; MMSE, Mini-Mental State Examination.


