
Altered Energy Metabolism Pathways in the Posterior Cingulate in Young Adult Apolipoprotein E ɛ4 Carriers
Abstract
The APOE gene, encoding apolipoprotein E, is the primary genetic risk factor for late-onset Alzheimer’s disease (AD). Apolipoprotein E ɛ4 allele (APOE4) carriers have alterations in brain structure and function (as measured by brain imaging) even as young adults. Examination of this population is valuable in further identifying details of these functional changes and their association with vulnerability to AD decades later. Previous work demonstrates functional declines in mitochondrial activity in the posterior cingulate cortex, a key region in the default mode network, which appears to be strongly associated with functional changes relevant to AD risk. Here, we demonstrate alterations in the pathways underlying glucose, ketone, and mitochondrial energy metabolism. Young adult APOE4 carriers displayed upregulation of specific glucose (GLUT1 & GLUT3) and monocarboxylate (MCT2) transporters, the glucose metabolism enzyme hexokinase, the SCOT & AACS enzymes involved in ketone metabolism, and complexes I, II, and IV of the mitochondrial electron transport chain. The monocarboxylate transporter (MCT4) was found to be downregulated in APOE4 carriers. These data suggest that widespread dysregulation of energy metabolism in this at-risk population, even decades before possible disease onset. Therefore, these findings support the idea that alterations in brain energy metabolism may contribute significantly to the risk that APOE4 confers for AD.
INTRODUCTION
Alzheimer’s disease (AD) is the most common cause of dementia and the sixth-leading cause of death in the United States [1]. The prevalence of this devastating and costly disease is expected to more than triple worldwide by 2040 [2], highlighting the need to develop an improved understanding of its pathophysiology. APOE is the primary genetic factor associated with late-onset AD, which comprises the vast majority of AD cases [3]. There are three major APOE alleles in humans: ɛ2 (frequency ∼6%; associated with decreased risk for AD), ɛ3 (∼78%; neutral risk), and ɛ4 (∼15%; increased risk) [4–6]. The effect of the apolipoprotein ɛ4 allele (APOE4) on disease status is dramatic, with APOE4 homozygotes having up to 15 times, and APOE4 heterozygotes up to 4 times, the risk for AD when compared to risk-neutral APOE3 homozygotes [3, 7]. Despite this influence, the role of APOE, which encodes apolipoprotein E (apoE), in AD remains incompletely understood, although there is much evidence that it is pleiotropic and may exert an influence in AD pathophysiology via effects on metabolism, synaptic function, neurodevelopment, inflammation, and amyloid-β (Aβ) aggregation and clearance [8–12]. Due to this clear impact of APOE genotype on AD risk, investigation of young adult APOE4 carriers (who are decades from possible disease onset) represents a valuable opportunity to examine physiological alterations that may increase vulnerability to AD and therefore provide unique insight into the pathophysiology of the disease.
Brain imaging research has previously described significant functional and structural variations in APOE4 carriers across the lifespan, although results in certain imaging modalities (e.g., functional MRI) have not always been consistent, possibly due to methodological differences [13–16]. The use of FDG PET imaging, which measures the cerebral metabolic rate for glucose (CMRglu) has consistently demonstrated a pattern of decrements in CMRglu (hypometabolism) in AD patients [14]. Notably, defects in energy metabolism are known to influence AD pathophysiology [17, 18]. Additional work in APOE4 carriers has identified similar patterns of hypometabolism in the late-middle aged, who also show longitudinal declines in CMRglu, and in young adults [19–21], making CMRglu a strong marker for AD-related physiological vulnerability. Similarly, others at risk for AD also display altered patterns of metabolism [22]. The posterior cingulate cortex (PCC), a functional hub in the default mode network (DMN), a brain network highly active at rest, exhibits consistent metabolic decrements in APOE4 carriers. Imaging studies demonstrate that the PCC has high energy demand and is among the brain regions that make heavy use of glycolysis, particularly aerobic glycolysis, which is defined as glucose utilization in excess of that used for oxidative phosphorylation despite sufficient available oxygen [23, 24]. Interestingly, there is substantial overlap between regions of the DMN, utilization of aerobic glycolysis, and amyloid deposition, further pointing to the PCC as a candidate region for detailed investigation of metabolic dysfunction leading to AD susceptibility [25–27]. In an attempt to resolve early brain alterations associated with AD susceptibility in the PCC, we previously examined PCC tissue from young adult APOE4 carriers and found reductions in mitochondrial oxidative function in the superficial cortical layers in the absence of apparent Aβ or tau pathology [28]. These superficial layers contain many dendritic tufts of deeper neurons (e.g., layer III pyramidal), and thus these reductions in mitochondrial oxidative function might relate to synaptic or local metabolic alterations. Notably, apoE4 has been linked to metabolic dysfunction [11, 29] and also to altered synaptic development and function [11, 30] in cell culture and animal studies. Importantly, these PCC histochemistry results in young adult APOE4 carriers mirrored our earlier study of AD patients, who demonstrated superficial laminar metabolic deficits across the neocortex and most strongly in the PCC [31, 32], again hinting at alterations in metabolic function playing a role in AD risk.
As the human brain utilizes up to 20% of the total energy used by the body, multiple methods of energy metabolism are employed to maintain its function [33–36]. Depending on context, the brain may variably utilize pathways involved in aspects of glucose metabolism, ketone metabolism, and mitochondrial oxidative function variably. Therefore, a central and outstanding question is how specific energy metabolism pathways, which are tightly coupled to synaptic function and neural efficiency, may be altered in APOE4 carriers. These alterations represent functional changes linked to APOE4 status, and further, they may function as a physiological substrate for AD risk. Here, we survey the metabolic pathways underlying glucose, ketone, and mitochondrial energy metabolism in the AD-vulnerable PCC in order to examine the differential effects of APOE4 status on these physiological parameters in a novel population of young adult subjects.
MATERIALS AND METHODS
Frozen blocks of PCC tissue were obtained from the University of Maryland Brain and Tissue Bank, which is a brain and tissue repository of the NIH NeuroBioBank. The samples analyzed represent a subset of samples from our previous work [28], matched to minimize group differences in postmortem interval and age between the APOE4 carriers and non-carriers.
For relative quantitation of select protein targets, small samples were cut from each frozen cortical tissue block, quickly weighed, and placed in a chilled Dounce glass-glass homogenizer with cold RIPA buffer (150 mM NaCl, 1.0% NP-40, 1.0% SDS, 50 mM Tris HCl, and HALT protease inhibitor cocktail [Pierce]) and homogenized using a minimum of 20 pestle strokes. Samples were rotated at 4°C for 30 min, and then centrifuged at 14100 RCF for 15 min at 4°C. The clarified supernatant was aliquoted to multiple chilled tubes and stored at –80°C until analyzed. Protein quantification in each sample was via detergent-compatible (DC) Lowry assay (BioRad) per manufacturer’s instructions, and 25μg protein/lane was loaded into 4–12% Bis-Tris mini-gels (Life Technologies). Gels were run at 125–150V for approximately 2 h under denaturing and reducing conditions, then proteins were transferred to nitrocellulose membrane. Transfer efficiency was verified via Ponceau S staining and membranes were blocked with 5% non-fat dry milk or BSA in Tris-buffered saline (50 mM Tris-base, 0.9% NaCl) with 0.01% Tween 20 (Fisher; TBST). Primary antibodies were suspended in 5% non-fat dry milk in TBST; HRP-conjugated and DyLight-conjugated secondary antibodies were suspended in 5% non-fat dry milk or BSA in TBST with 0.01% SDS. Blots labeled with HRP-conjugated antibodies were developed with chemiluminescent reagent (Pierce) and imaged on film. Images of the film were captured with a high-resolution CCD camera mounted over a fiber-optic backlight under uniform lighting conditions. Blots labeled with DyLight-conjugated antibodies were imaged on an Odyssey Infrared Imaging System (LI-COR). Bands were checked for saturation using a thresholding function and analyzed in Image Studio (Li-Cor) software.
Antibodies and dilutions were optimized for the following targets: GLUT1 (EMD Millipore; 1:1000), GLUT3 (Protein Tech; 1:2000), hexokinase-1 (Cell Signaling; 1:2000), caveolin-1 (Cell Signaling; 1:1000), MCT1 (EMD Millipore; 1:1000), MCT2 (Santa Cruz; 1:1500), MCT4 (Protein Tech; 1:1500), AACS (EMD Millipore; 1:1000), SCOT (Protein Tech; 1:3000), a cocktail of 5 OXPHOS subunits (Abcam; 1:5000), apoE (EMD Millipore; 1:1000), and α-tubulin (Cell Signaling; anti-rabbit 1:2000; anti-mouse 1:150,000). Secondary antibodies consisted of goat anti-mouse IgG-HRP (Santa Cruz), goat anti-rabbit IgG-HRP (Santa Cruz), donkey anti-goat IgG-HRP (Santa Cruz), goat anti-rabbit DyLight 800 (Thermo Scientific), and goat anti-mouse DyLight 680 (Thermo Scientific).
Protein data was collected across triplicate western blots and was first normalized to the average signal per blot; each lane was corrected by normalized α-tubulin. The triplicate results for each subject were then averaged. Each blot contained equal numbers of APOE4 carrier and non-carrier samples. Statistical analysis was conducted using 2-tailed unpaired Student’s t-tests, following Levene’s test for equal variances and NPP plot inspection for normality, with the significance level corrected from p < 0.05 for multiple comparisons with the Benjamini-Hochberg procedure to control the false discovery rate (spreadsheet from Manuel Weinkauf, MARUM, https://marum.de/software_and_programs.html) [37]. Statistical analyses were performed in IBM SPSS or Microsoft Excel.
For RNA quantitation, small samples were cut from each frozen tissue block, quickly weighed and placed in RNase-free microcentrifuge tubes. Samples were analyzed using either an array platform based on quantitative real time PCR (qRT-PCR) or by using individual pre-validated qRT-PCR primers. RNA was extracted using TRIZOL reagent (Invitrogen) followed by purification via the Qiagen RNeasy kit. An on-column DNase treatment was used to remove residual genomic DNA and absence of genomic DNA was confirmed prior to use. cDNA was synthesized from 1μg total RNA using SA Biosciences RT2 First-Strand Kit. Array platform gene expression profiling was then performed using the RT2 Profiler PCR Array System (SA Biosciences) which analyzes a panel of 84 genes in related biological pathways using reliable SYBR Green-optimized primer assays. Array analysis was performed using the Human Mitochondrial Energy Metabolism Array (PAHS-008YC), which primarily profiles genes involved in the electron transport chain. The expression of additional genes was analyzed by qRT-PCR using individual pre-validated human primers from SA Biosciences (GLUT1, GLUT3, Hexokinase1, Caveolin1, MCT1, MCT2, MCT4). Experiments used an ABI StepOne Plus qRT-PCR machine. Ct thresholds were manually set within the linear phase of the logarithmic amplification plots using the StepOne Plus software. Data from logarithmic plots was analyzed using the downloadable Excel PCR Array Data Analysis Template v.4.0 by SA Biosciences (GeneGlobe Data Analysis Center). This template uses the ΔΔCt method to establish the fold change between control and experimental groups. The template also employs a two-tailed Student’s t-test to establish statistical significance using p < 0.05. A set of housekeeping genes (Gapdh, Actb, and RPLP0) which are included on the array plates, was used for normalization of qRT-PCR array data by subtracting the average Ct value of the housekeeping genes in each sample from the Ct values of the genes of interest in that sample. The expression of genes measured by individual qRT-PCR primer analysis was normalized using the beta-2 microglobulin housekeeping gene.
RESULTS
The non-carrier subjects (7 males, 5 females; 9 Caucasian, 2 African-American, 1 Hispanic) were made up of 11 APOE 3/3 homozygotes and 1 APOE 2/3 heterozygote; the carrier subjects (6 males, 7 females; 8 Caucasian, 5 African-American) consisted of 11 APOE 3/4 heterozygotes and 2 APOE 4/4 homozygotes (Table 1). None of the APOE 2/3 or APOE 4/4 subjects displayed protein results that stood apart within their respective groups; however, they did increase variability within the qPCR analysis and thus the final qPCR results reflect only APOE 3/3 and APOE 3/4 subjects. One APOE 3/3 subject and one APOE 3/4 subject were removed from western blot analysis due to abnormal α-tubulin signal and insufficient tissue available to run all blots, respectively. Between APOE4 non-carrier and carrier groups there were no significant differences in age (non-carriers: 27.4±6.0y, carriers: 31.7±6.5 [mean±standard deviation]; Student’s t-test, p = 0.112). There were also no significant differences in postmortem interval (non-carriers: 13.3±4.2h, carriers: 16.5±4.1 [mean±standard deviation]; Student’s t-test, p = 0.065).
This subset of subjects did display group differences in mitochondrial cytochrome oxidase function, from data included in our previous analysis [28], indicating a reduction in oxidative phosphorylation capacity. Specifically, this prior analysis utilized quantitative histochemistry on PCC slices in order to measure the enzymatic activity of cytochrome c oxidase (Complex IV) of the electron transport chain [32]. As in the previous analysis, cortical lamina layer I activity was significantly decreased in this subset of the same APOE4 carrier subjects (non-carriers: 372.0±25.8, carriers 340.9±15.4 [mean±standard deviation]; Student’s t-test, p < 0.001), as well as in layer II (non-carriers: 373.2±13.0, carriers 348.5±11.5; Student’s t-test, p < 0.001), and layer III (non-carriers: 379.3±14.6, carriers 358.0±12.9; Student’s t-test, p < 0.001). Notably, these subjects were also previously shown to lack any group differences in pathology markers including from ELISA (soluble Aβ1 - 40, insoluble Aβ1 - 40, and soluble Aβ1 - 42, insoluble Aβ1 - 42) or Aβ Immunohistochemistry, Thioflavin S, AT8 Immunohistochemistry, or Campbell-Switzer analyses (data not shown) [28]. The relative levels of apoE were quantified and no differences were found (non-carriers: 106.5±51.7; carriers: 101.7±22.2 [normalized mean±SEM], Student’s t-test, p = 0.82).
Overall, despite manifesting a significant decline in cortical energy metabolism, these young APOE4 carriers displayed significant increases in the apparent expression of many of the key proteins underlying energy metabolism (Fig. 1). Since the cerebral metabolic rate for glucose (CMRglu) has been shown to be decreased in similarly-aged young adult APOE4 carriers [20], we assessed protein levels and RNA expression for glucose transport (GLUT1, GLUT3), metabolism (hexokinase), and associated membrane domains (caveolin). Results are shown in Fig. 2. GLUT1 (non-carriers: 80.5±7.9, carriers: 119.1±16.9 [normalized mean±SEM]; Student’s t-test, p = 0.035), GLUT3 (non-carriers: 64.2±16.7, carriers: 132.9±23.2; Student’s t-test, p = 0.022), and hexokinase-1 (non-carriers: 74.5±16.7, carriers: 125.5±11.4; Student’s t-test, p = 0.004), but not caveolin (non-carriers: 98.9±1.51, carriers: 99.9± 2.7; Student’s t-test, p = 0.757), were significantly altered in the APOE4 carriers. Quantification of total mRNA validated the changes in GLUT3 (1.65x; Student’s t-test, p = 0.024) and hexokinase-1 (1.64x; Student’s t-test, p = 0.007), matched the lack of significant change in caveolin (1.04x; Student’s t-test, p = 0.790), but did not correlate with the increase in GLUT1 protein (1.1x; Student’s t-test, p = 0.79).
Considering the observation that APOE4-positive AD patients do not appear to benefit from ketogenic therapies [38, 39], we assessed protein and RNA expression for monocarboxylate (ketone/lactate/ pyruvate) transport and ketone metabolism. Results are shown in Fig. 3. MCT2 (non-carriers: 67.7± 13.7, carriers: 147.3±19.9 [normalized mean± SEM], Student’s t-test, p = 0.003), ketolytic enzyme succinyl-CoA:3-ketoacid CoA transferase (SCOT) (non-carriers: 80.9±10.6, carriers: 121.1±8.2, Student’s t-test, p = 0.006), and ketone-utilizing acetoacetyl-CoA synthetase (AACS) (non-carriers: 77.2±13.1, carriers: 119.5±13.4, Student’s t-test, p = 0.031) showed altered protein levels. Also evaluated for altered protein levels were MCT1 (non-carriers: 122.1±13.6, carriers: 79.2±17.0 [normalized mean±SEM], Student’s t-test, p = 0.058) and MCT4 (non-carriers: 150.9±29.3, carriers: 51.7± 18.6, Student’s t-test, p = 0.008), which are monocarboxylate transporters on astroglia and endothelial cells. In the mRNA quantification (applied only to the transporters), the increase in MCT2 was validated (1.55x; Student’s t-test, p = 0.008), and the lack of change in MCT1 was similarly validated (1.02x; Student’s t-test, p = 0.85), but the decline in MCT4 was not matched by the mRNA quantification (1.03x; Student’s t-test, p = 0.74).
Since our previous results in these APOE4-positive subjects indicated a decline in oxidative phosphorylation capacity, we assessed select OXPHOS protein subunits using a cocktail of antibodies targeting a subunit from each of the five OXPHOS complexes. Results are shown in Fig. 4. Multiple subunit proteins showed increased expression, including Complex I (non-carriers: 59.2±15.1, carriers: 146.4.3±31.6 [normalized mean±SEM], Student’s t-test, p = 0.020), Complex II (non-carriers: 63.9± 12.6, carriers: 137.3±26.1, Student’s t-test, p = 0.018), and Complex IV (non-carriers: 55.6±15.2, carriers: 147.4±32.1, Student’s t-test, p = 0.017). Complex III (non-carriers: 87.3±10.7, carriers: 127.1±17.3, Student’s t-test, p = 0.057) and Complex V were not significantly altered (non-carriers: 103.4±11.5, carriers: 120.1±15.5, Student’s t-test, p = 0.384). The Mitochondrial Energy Metabolism qPCR array demonstrated only 3 (of 84) significant gene expression changes, each with small fold-changes (NDUFB5 1.08x, Student’s t-test, p = 0.048; NDUFS7 -1.18x, Student’s t-test, p = 0.048; ARRDC3 -1.39x, Student’s t-test, p = 0.018). It should be noted that the Complex IV subunit is encoded within mitochondrial DNA; the others are encoded in nuclear DNA.
DISCUSSION
APOE4 is strongly associated with an elevated risk for late-onset AD, but how this increased risk is mediated is not well understood. In brain imaging and histochemical studies, APOE4 carriers consistently demonstrate reductions (when compared to APOE4 non-carriers) in energy metabolism via measures of mitochondrial function and glucose metabolism, even decades before possible disease onset [20, 28] and in a pattern consistent with findings in AD patients [19, 31, 40]. Here, we report that these findings are accompanied by underlying alterations in the PCC, a key region in AD-associated functional brain changes, in components of energy metabolism in a set of young adult APOE4 carriers previously demonstrated to have declines in mitochondrial function in the absence of apparent amyloid or tau pathology [28]. Our focus here is on details of altered function and potential proximal causes explainable by cell biology. We do not argue that these findings are necessarily indicative of a primary defect in energy metabolism, although in some cases this is possible. Fundamentally, these findings may represent alterations or compensation in metabolic processes as a result of the altered synaptic structure [41–43] and function [30] that may exist in APOE4 carriers.
In this study, we examined GLUT1 (primary blood-brain barrier glucose transporter) and GLUT3 (neuronal glucose transporter), key proteins in glucose metabolism. In the context of AD, GLUT1 reductions have been found in AD patients [44] and GLUT1 deficiency and APOE4 have been linked to an exacerbation of amyloid induced pathophysiological effects on the blood-brain barrier in mice [45–47]. A study of AD patients with reduced protein levels of GLUT1 indicated that mRNA levels were not impacted, pointing to possible alterations in post-transcriptional regulation [48]. Here we demonstrate increased protein levels for GLUT1 in the absence of changes in mRNA levels, again indicating regulation by a potential shift in translational activity. Studies in aged APOE4 targeted replacement mice, in which the human protein is expressed under the control of the endogenous APOE promoter [49] have found that these mice display decrements in glucose transport across the blood-brain barrier, but do not have altered levels of GLUT1 protein or mRNA [50]. Further investigation will be needed to resolve these discrepancies, which may arise from the specific patterns and timing of blood-brain barrier effects, or from differences in GLUT1 post-transcriptional regulation [51]. Regarding GLUT3 (neuronal glucose transporter), we found increased levels of protein accompanied by increased mRNA. AD patients have been shown to have reduced levels of GLUT3 protein [44]. It is possible in APOE4 young adults that this increase in expression is a compensatory response to defective trafficking of GLUT3 to the surface membrane of the neuron. GLUT3 trafficking in neurons is known to be regulated by synaptic activity [52]; perhaps the aberrant synaptic activity associated with APOE4 plays a role in this process leading to more protein being produced as less protein is functional (i.e., less is localized at the surface membrane). Interestingly, apoE binds rab11, a protein involved in the surface trafficking of GLUT3, which may modulate or interfere with the transporter trafficking process [53, 54]. While we might expect protein levels to be down in a pattern more intuitively consistent with hypometabolism (and consistent with AD patients), mechanisms effecting functional distribution of protein are equally important and may lead to compensatory changes. However, comparison with AD patients is often complex, as it is often unclear if findings in AD patients are the result of a disrupted physiological process (earlier disease) or simply evidence of gross degradation (later disease). Notably, hexokinase-1 (which functions to sequester imported glucose in cells via phosphorylation) protein levels were also elevated in APOE4 carriers, possibly as a compensatory response to changes in functional glucose transport. Overall, it is also possible that increases in proteins involved in glucose metabolism are reflective of the dysregulation of peripheral metabolism that is a feature of APOE4 mouse models [55]. Due to the importance of finely tuned energy metabolism processes for proper synaptic function [34], any defects in young adults could play an important role in AD risk.
In addition to these alterations in the metabolism of glucose, we detected altered levels of two key proteins involved in monocarboxylate transport, MCT2 and MCT4, which transport lactate and ketones across the blood-brain barrier and astrocytic membranes [56]. Ketone metabolism has been linked to AD pathophysiology [57], and ketone therapies have been associated with therapeutic benefit in small clinical studies [38, 39]. While ketone therapies have a long history of effectiveness in treating forms of epilepsy, the mechanisms underlying neurologic benefit remain under active investigation [58]. Since APOE4 AD patients do not appear to show cognitive benefit in response to ketogenic therapy that are observed in other AD patients [39], the apparent effects on MCT4 may be an underlying cellular-level mechanism for this discrepancy. Notably, MCT4 protein levels were lower in APOE4 carriers, while other metabolic proteins were increased. Of note, endoplasmic reticulum stress (e.g., unfolded protein response) has been found in astrocyte cultures as a result of apoE4 and has been shown to impair receptor processing [59, 60]. Such a mechanism could account for the decreased MCT4 levels demonstrated in the present study. Interestingly, MCT2, the primary neuronal transporter, was found to have increased protein and mRNA levels. While, to our knowledge, MCT2 has not been assessed in AD patients, MCT2 protein levels are known to be decreased in Aβ-treated rats [61]. This is a pattern consistent with our findings regarding glucose metabolism, as detailed above. MCTs also transport lactate, a known neuroprotectant [62], in addition to ketones, revealing an additional risk mechanism with alterations in this energy metabolism pathway. Notably, enzymes involved in ketone metabolism (AACS and SCOT) also showed increases in protein levels indicating additional alterations in this pathway associated with the expression of apoE4. Similar to the protein expression changes in the glucose pathway, these changes in monocarboxylate transport may also be linked to peripheral metabolic dysregulation.
Mitochondrial dysfunction has long been linked to AD pathophysiology [63–69]. Here, mitochondrial oxidative metabolism is altered in young adult APOE4 carriers in a manner that is opposite to what is seen in the disease state. We and others have previously reported diminished brain cytochrome oxidase activity in AD patients and in these same young adult subjects [28, 31]. In this study we demonstrate increased protein levels in complexes I, II, and IV of the ETC in carriers. However, in AD, using nearly identical techniques, we demonstrated significantly lower expression of these ETC proteins in the same brain region [70]. Our qRT-PCR array analysis of genes involved in mitochondrial energy metabolism failed to identify altered transcriptional expression of the ETC subunit genes, indicating that the APOE4 allele is not directly affecting transcription. ApoE4 has been linked to ETC dysfunction via binding of cleaved fragments to ETC subunits causing a decrease in functional activity [71]. Hence, it is possible that this is the mechanism underlying the increases in protein levels (perhaps compensatory as discussed above) and the decreased functional activity found in prior histochemical studies. A prior study of postmortem and biopsied tissues from AD patients also demonstrated deficits in the quantity and quality of mitochondria, with cytochrome c oxidase subunit I protein levels and mtDNA increased several fold in comparison to controls, with high brain-regional specificity and apparent localization in autophagosomes [67]. This is suggestive of mitochondrial protein levels being upregulated as a compensatory response to dysfunction, potentially in a manner similar to what may be occurring in APOE4 carriers decades before possible AD onset. Again, mitochondria are a fundamental player in neural energy metabolism, and any alteration in these physiological processes may impair synaptic function [66]. TOMM40, a gene encoding Tom40, a protein involved in transporting proteins into the mitochondria, has been proposed as a genetic risk factor for AD, although the extent to which individual variants of TOMM40 impact AD risk is not yet clear [72–76]. Notably, TOMM40 and APOE are in linkage disequilibrium on chromosome 19, and due to this fact, parsing out the respective contributions of these genes is complex [72]. It is possible that altered Tom40 function causes a defect in protein import into the mitochondria and leads to increased protein levels due to buildup in the cytoplasm. Notably, many ETC proteins subunits are encoded in the nuclear (not mitochondrial) genome. Further studies incorporating TOMM40 status may play an important role in examining this intriguing possibility.
This study has multiple strengths. First, to our knowledge this is the first study to attempt to analyze energy metabolism pathways in the at-risk APOE4 population in order to characterize some of the physiological alterations underlying the well-established finding of hypometabolism. Here we present detailed findings of different pathways, several of which have previously been associated with AD, but have been unexplored in APOE4 subjects. Second, we focus on the PCC, a highly metabolically-active brain region that is a functional hub for brain networks that are disrupted in AD, indicating that it may show altered function early in AD risk-associated processes [23, 27, 77–79]. Third, our analysis was done in young adults, who as APOE4 carriers demonstrate a vulnerability to AD, but who are also decades from possible disease onset and free from apparent AD-related pathology.
There are several opportunities for future investigation that arise from this study. The subjects presented here were selected from an existing, previously analyzed pool, and thus the APOE4 carriers were known to show functional metabolic decline a priori. Thus, these findings should be replicated in a larger and independent group of subjects. Additionally, while we have identified alterations in metabolic pathways in APOE4 carriers, the mechanics of how these alterations occur remain unclear (above). While APOE4 has been linked to altered dendritic complexity [41] and modification of synaptic plasticity [30] that may be associated with these functional findings, the effects of these structural factors, in addition to potential primary energy defects, are difficult to parse in human subjects. Further investigation in robust experimental models would not only allow for the confirmation of our results, but for a more complete understanding of how APOE4-induced changes in metabolism affect the pathogenesis of, and potential resistance to, AD. In this context, efficient metabolism may serve as a buffer (i.e., reserve) to help maintain function in the face of AD-related changes [80, 81]. Further exploring the link between metabolism and synaptic function, and how this relationship is modulated by APOE4 will also be of fundamental importance [82]. It is also possible that alterations in metabolism are reflective of some AD-related pathophysiological process not associated with APOE4 or that metabolic changes are a readout of risk, but not a risk factor per se. In this case, further understanding of metabolic changes may lead to the development of more specific and sensitive biomarkers; some specific metabolic pathways that become altered may be more appropriate than looking at FDG PET alone. For instance, new imaging tools examining aerobic glycolysis have demonstrated interesting patterns of glucose utilization in the brain, but to our knowledge these tools have not been used in longitudinal examination of at-risk populations [24, 26]. A point to consider is that we did not approach this survey of energy metabolism from an unbiased perspective, as we selected specific pathways with prior evidence of their involvement in AD. Ongoing work utilizing next-generation techniques such as RNA-seq with cell-type specificity [83] is addressing this issue and providing a valuable alternative approach.
ACKNOWLEDGMENTS
This work was supported by Midwestern University and the State of Arizona via the Arizona Alzheimer’s Consortium, including an Arizona Alzheimer’s Consortium Pilot Project award to GJ. DS and JPM were supported by Midwestern University Kenneth A. Suarez Summer Research Fellowships, and LB was supported by the Midwestern University Biomedical Sciences Program. We thank the University of Maryland Brain and Tissue Bank, which is a brain and tissue repository of the NIH NeuroBioBank.
Authors’ disclosures available online (http://j-alz.com/manuscript-disclosures/15-1205r1).
REFERENCES
[1] | Fargo K ((2014) ) Alzheimer’s Association Report: Alzheimer’s disease facts and figures. Alzheimers Dement 10: , e47–e92. |
[2] | Ferri CP , Prince M , Brayne C , Brodaty H , Fratiglioni L , Ganguli M , Hall K , Hasegawa K , Hendrie H , Huang Y , Jorm A , Mathers C , Menezes PR , Rimmer E , Scazufca M ((2005) ) Global prevalence of dementia: A Delphi consensus study. Lancet 366: , 2112–2117. |
[3] | Ashford JW , Mortimer JA ((2002) ) Non-familial Alzheimer’s disease is mainly due to genetic factors. J Alzheimers Dis 4: , 169–177. |
[4] | Gomez-Isla T , West HL , Rebeck GW , Harr SD , Growdon JH , Locascio JJ , Perls TT , Lipsitz LA , Hyman BT ((1996) ) Clinical and pathological correlates of apolipoprotein E ɛ4 in Alzheimer’s disease. Ann Neurol 39: , 62–70. |
[5] | Bertram L , Tanzi RE ((2008) ) Thirty years of Alzheimer’s disease genetics: The implications of systematic meta-analyses. Nat Rev Neurosci 9: , 768–778. |
[6] | Eisenberg DTA , Kuzawa CW , Hayes MG ((2010) ) Worldwide allele frequencies of the human apolipoprotein E gene: Climate, local adaptations, and evolutionary history. Am J Phys Anthropol 143: , 100–111. |
[7] | Raber J , Huang Y , Ashford JW ((2004) ) ApoE genotype accounts for the vast majority of AD risk and AD pathology. Neurobiol Aging 25: , 641–650. |
[8] | Wolf AB , Valla J , Bu G , Kim J , Ladu MJ , Reiman EM , Caselli RJ ((2013) ) Apolipoprotein E as a β-amyloid-independent factor in Alzheimer’s disease. Alzheimers Res Ther 5: , 38. |
[9] | Kim J , Basak JM , Holtzman DM ((2009) ) The role of apolipoprotein E in Alzheimer’s disease. Neuron 63: , 287–303. |
[10] | Kanekiyo T , Xu H , Bu G ((2014) ) ApoE and Aβ in Alzheimer’s disease: Accidental encounters or partners? Neuron 81: , 740–754. |
[11] | Mahley RW , Huang Y ((2012) ) Apolipoprotein E sets the stage: Response to injury triggers neuropathology. Neuron 76: , 871–885. |
[12] | Mahley RW , Weisgraber KH , Huang Y ((2006) ) Apolipoprotein E4: A causative factor and therapeutic target in neuropathology, including Alzheimer’s disease. Proc Natl Acad Sci U S A 103: , 5644–5651. |
[13] | Wolf AB , Caselli RJ , Reiman EM , Valla J ((2013) ) APOE and neuroenergetics: An emerging paradigm in Alzheimer’s disease. Neurobiol Aging 34: , 1007–1017. |
[14] | Reiman EM , Jagust WJ ((2012) ) Brain imaging in the study of Alzheimer’s disease. Neuroimage 61: , 505–516. |
[15] | Trachtenberg AJ , Filippini N , Mackay CE ((2012) ) The effects of APOE ɛ4 on the BOLD response. Neurobiol Aging 33: , 323–334. |
[16] | Liu Y , Yu J-T , Wang H-F , Han P-R , Tan C-C , Wang C , Meng X-F , Risacher SL , Saykin AJ , Tan L ((2015) ) APOE genotype and neuroimaging markers of Alzheimer’s disease: Systematic review and meta-analysis. J Neurol Neurosurg Psychiatry 86: , 127–134. |
[17] | Atamna H , Frey WH ((2007) ) Mechanisms of mitochondrial dysfunction and energy deficiency in Alzheimer’s disease. Mitochondrion 7: , 297–310. |
[18] | Swerdlow RH ((2014) ) Bioenergetic medicine. Br J Pharmacol 171: , 1854–1869. |
[19] | Reiman EM , Caselli RJ , Yun L , Chen K , Bandy D , Minoshima S , Thibodeau S , Osborne D ((1996) ) Preclinical evidence of Alzheimer’s disease in persons homozygous for the ɛ4 allele for apolipoprotein E. N Engl J Med 334: , 752–758. |
[20] | Reiman EM , Chen K , Alexander GE , Caselli RJ , Bandy D , Osborne D , Saunders A , Hardy J ((2004) ) Functional brain abnormalities in young adults at genetic risk for late-onset Alzheimer’s dementia. Proc Natl Acad Sci U S A 101: , 284–289. |
[21] | Reiman EM , Chen K , Alexander GE , Caselli RJ , Bandy D , Osborne D , Saunders A , Hardy J ((2005) ) Correlations between apolipoprotein E ɛ4 gene dose and brain-imaging measurements of regional hypometabolism. Proc Natl Acad Sci U S A 102: , 8299–8302. |
[22] | Mosconi L , Pupi A , De Leon MJ ((2008) ) Brain glucose hypometabolism and oxidative stress in preclinical Alzheimer’s disease. Ann N Y Acad Sci 1147: , 180–195. |
[23] | Tomasi D , Wang G , Volkow N ((2013) ) Energetic cost of brain functional connectivity. Proc Natl Acad Sci U S A 110: , 13642–13647. |
[24] | Vaishnavi SN , Vlassenko AG , Rundle MM , Snyder AZ , Mintun MA , Raichle ME ((2010) ) Regional aerobic glycolysis in the human brain. Proc Natl Acad Sci U S A 107: , 17757–17762. |
[25] | Vlassenko AG , Benzinger TLS , Morris JC ((2012) ) PET amyloid-beta imaging in preclinical Alzheimer’s disease. Biochim Biophys Acta 1822: , 370–379. |
[26] | Vlassenko AG , Vaishnavi SN , Couture L , Sacco D , Shannon BJ , Mach RH , Morris JC , Raichle ME , Mintun MA ((2010) ) Spatial correlation between brain aerobic glycolysis and amyloid-β (Aβ) deposition. Proc Natl Acad Sci U S A 107: , 17763–17767. |
[27] | Buckner RL , Snyder AZ , Shannon BJ , LaRossa G , Sachs R , Fotenos AF , Sheline YI , Klunk WE , Mathis CA , Morris JC , Mintun MA ((2005) ) Molecular, structural, and functional characterization of Alzheimer’s disease: Evidence for a relationship between default activity, amyloid, and memory. J Neurosci 25: , 7709–7717. |
[28] | Valla J , Yaari R , Wolf AB , Kusne Y , Beach TG , Roher AE , Corneveaux JJ , Huentelman MJ , Caselli RJ , Reiman EM ((2010) ) Reduced posterior cingulate mitochondrial activity in expired young adult carriers of the APOE ɛ4 allele, the major late-onset Alzheimer’s susceptibility gene. J Alzheimers Dis 22: , 307–313. |
[29] | Huang Y ((2010) ) Abeta-independent roles of apolipoprotein E4 in the pathogenesis of Alzheimer’s disease. Trends Mol Med 16: , 287–294. |
[30] | Kim J , Yoon H , Basak J , Kim J ((2014) ) Apolipoprotein E in synaptic plasticity and Alzheimer’s disease: Potential cellular and molecular mechanisms. Mol Cells 37: , 767–776. |
[31] | Valla J , Berndt JD , Gonzalez-Lima F ((2001) ) Energy hypometabolism in posterior cingulate cortex of Alzheimer’s patients: Superficial laminar cytochrome oxidase associated with disease duration. J Neurosci 21: , 4923–4930. |
[32] | Valla J , Schneider L , Small A , Gonzalez-Lima F ((2007) ) Quantitative cytochrome oxidase histochemistry: Applications in human Alzheimer’s disease and animal models. J Histotechnol 30: , 235–247. |
[33] | Attwell D , Laughlin SB ((2001) ) An energy budget for signaling in the grey matter of the brain. J Cereb Blood Flow Metab 21: , 1133–1145. |
[34] | Magistretti PJ , Pellerin L ((1999) ) Cellular mechanisms of brain energy metabolism and their relevance to functional brain imaging. Philos Trans R Soc Lond B Biol Sci 354: , 1155–1163. |
[35] | Magistretti PJ , Allaman I ((2015) ) A cellular perspective on brain energy metabolism and functional imaging. Neuron 86: , 883–901. |
[36] | Pfrieger FW ((2003) ) Outsourcing in the brain: Do neurons deend on cholesterol delivery by astrocytes? BioEssays 25: , 72–78. |
[37] | Hochberg Y , Benjamini Y ((1990) ) More powerful procedures for multiple significance testing. Stat Med 9: , 811–818. |
[38] | Reger MA , Henderson ST , Hale C , Cholerton B , Baker LD , Watson GS , Hyde K , Chapman D , Craft S ((2004) ) Effects of beta-hydroxybutyrate on cognition in memory-impaired adults. Neurobiol Aging 25: , 311–314. |
[39] | Henderson ST , Vogel JL , Barr LJ , Garvin F , Jones JJ , Costantini LC ((2009) ) Study of the ketogenic agent AC-1202 in mild to moderate Alzheimer’s disease: A randomized, double-blind, placebo-controlled, multicenter trial. Nutr Metab 6: , 31. |
[40] | Minoshima S , Foster NL , Kuhl DE ((1994) ) Posterior cingulate cortex in Alzheimer’s disease. Lancet 344: , 895. |
[41] | Dumanis SB , Tesoriero JA , Babus LW , Nguyen MT , Trotter JH , Ladu MJ , Weeber EJ , Turner RS , Xu B , Rebeck GW , Hoe H-S ((2009) ) ApoE4 decreases spine density and dendritic complexity in cortical neurons in vivo. J Neurosci 29: , 15317–15322. |
[42] | Douglas D , Jerskey B , Chen K , Protas H , Thiyyagura P , Roontiva A , Muircheartaigh JO , Dirks H , Waskiewicz N , Lehman K , Siniard AL , Turk MN , Hua X , Madsen SK , Thompson PM , Fleisher AS , Huentelman MJ , Deoni SCL , Reiman EM ((2014) ) Brain differences in infants at differential genetic risk for late-onset Alzheimer disease a cross-sectional imaging study. JAMA Neurol 71: , 11–22. |
[43] | Knickmeyer RC , Wang J , Zhu H , Geng X , Woolson S , Hamer RM , Konneker T , Lin W , Styner M , Gilmore JH ((2014) ) Common variants in psychiatric risk genes predict brain structure at birth. Cereb Cortex 24: , 1230–1246. |
[44] | Simpson IA , Chundu KR , Davies-Hill T , Honer WG , Davies P ((1994) ) Decreased concentrations of GLUT1 and GLUT3 glucose transporters in the brains of patients with Alzheimer’s disease. Ann Neurol 35: , 546–551. |
[45] | Winkler EA , Nishida Y , Sagare AP , Rege SV , Bell RD , Perlmutter D , Sengillo JD , Hillman S , Kong P , Nelson AR , Sullivan JS , Zhao Z , Meiselman HJ , Wenby RB , Soto J , Abel ED , Makshanoff J , Zuniga E , Vivo De DC , Zlokovic BV ((2015) ) GLUT1 reductions exacerbate Alzheimer’s disease vasculo-neuronal dysfunction and degeneration. Nat Neurosci 18: , 521–530. |
[46] | Bell RD , Winkler EA , Singh I , Sagare AP , Deane R , Wu Z , Holtzman DM , Betsholtz C , Armulik A , Sallstrom J , Berk BC , Zlokovic BV ((2012) ) Apolipoprotein E controls cerebrovascular integrity via cyclophilin A. Nature 485: , 512–516. |
[47] | Zlokovic BV ((2013) ) Cerebrovascular effects of apolipoprotein E. JAMA Neurol 70: , 440–444. |
[48] | Mooradian AD , Chung HC , Shah GN ((1997) ) GLUT1 expression in the cerebra of patients with Alzheimer’s disease. Neurobiol Aging 18: , 469–474. |
[49] | Huang Y ((2011) ) Roles of apolipoprotein E4 (ApoE4) in the pathogenesis of Alzheimer’s disease: Lessons from ApoE mouse models. Biochem Soc Trans 39: , 924–932. |
[50] | Alata W , Ye Y , St-Amour I , Vandal M , Calon F ((2015) ) Human apolipoprotein E ɛ4 expression impairs cerebral vascularization and blood-brain barrier function in mice. J Cereb Blood Flow Metab 35: , 86–94. |
[51] | Boado RJ ((2001) ) Amplification of blood-brain barrier GLUT1 glucose transporter gene expression by brain-derived peptides. Neurosci Res 40: , 337–342. |
[52] | Ferreira JM , Burnett AL , Rameau GA ((2011) ) Activity-dependent regulation of surface glucose transporter-3. J Neurosci 31: , 1991–1999. |
[53] | McClory H , Williams D , Sapp E , Gatune LW , Wang P , DiFiglia M , Li X ((2014) ) Glucose transporter 3 is a rab11-dependent trafficking cargo and its transport to the cell surface is reduced in neurons of CAG140 Huntington’s disease mice. Acta Neuropathol Commun 2: , 179. |
[54] | Braun NA ((2006) ) Intracellular trafficking of recycling apolipoprotein E in Chinese hamster ovary cells. J Lipid Res 47: , 1176–1186. |
[55] | Pendse AA , Arbones-Mainar JM , Johnson LA , Altenburg MK , Maeda N ((2008) ) Apolipoprotein E knock-out and knock-in mice: Atherosclerosis, metabolic syndrome, and beyond. J Lipid Res 50: , S178–S182. |
[56] | Pierre K , Pellerin L ((2005) ) Monocarboxylate transporters in the central nervous system: Distribution, regulation and function. J Neurochem 94: , 1–14. |
[57] | Hertz L , Chen Y , Waagepetersen HS ((2015) ) Effects of ketone bodies in Alzheimer’s disease in relation to neural hypometabolism, β-amyloid toxicity and astrocyte function. J Neurochem 134: , 7–20. |
[58] | McNally MA , Hartman AL ((2012) ) Ketone bodies in epilepsy. J Neurochem 121: , 28–35. |
[59] | Zhong N , Weisgraber KH ((2009) ) Understanding the association of apolipoprotein E4 with Alzheimer disease: Clues from its structure. J Biol Chem 284: , 6027–6031. |
[60] | Zhong N , Ramaswamy G , Weisgraber KH ((2009) ) Apolipoprotein E4 domain interaction induces endoplasmic reticulum stress and impairs astrocyte function. J Biol Chem 284: , 27273–27280. |
[61] | Lu W , Huang J , Sun S , Huang S , Gan S , Xu J , Yang M , Xu S , Jiang X ((2015) ) Changes in lactate content and monocarboxylate transporter 2 expression in Aβ25-35-treated rat model of Alzheimer’s disease. Neurol Sci 36: , 871–876. |
[62] | Newington JT , Rappon T , Albers S , Wong DY , Rylett RJ , Cumming RC ((2012) ) Overexpression of pyruvate dehydrogenase kinase 1 and lactate dehydrogenase A in nerve cells confers resistance to amyloid β and other toxins by decreasing mitochondrial respiration and reactive oxygen species production. J Biol Chem 287: , 37245–37258. |
[63] | Swerdlow RH , Burns JM , Khan SM ((2010) ) The Alzheimer’s disease mitochondrial cascade hypothesis. J Alzheimers Dis 20: , 265–279. |
[64] | Parker W , Filley C , Parks JK ((1990) ) Cytochrome oxidase deficiency in Alzheimer’s disease. Neurology 40: , 1302–1303. |
[65] | Parker W , Parks JK , Filley C , Kleinschmidt-DeMasters B ((1994) ) Electron transport chain defects in Alzheimer’s disease brain. Neurology 44: , 1090–1096. |
[66] | Ankarcrona M , Mangialasche F , Winblad B ((2010) ) Rethinking Alzheimer’s disease therapy: Are mitochondria the key? J Alzheimers Dis 20: (Suppl 2), S579–S590. |
[67] | Hirai K , Aliev G , Nunomura A , Fujioka H , Russell RL , Atwood CS , Johnson AB , Kress Y , Vinters HV , Tabaton M , Shimohama S , Cash AD , Siedlak SL , Harris PLR , Jones PK , Petersen RB , Perry G , Smith MA ((2001) ) Mitochondrial abnormalities in Alzheimer’ s disease. J Neurosci 21: , 3017–3023. |
[68] | Wolf AB , Braden BB , Bimonte-Nelson H , Kusne Y , Young N , Engler-Chiurazzi E , Garcia AN , Walker DG , Moses GSD , Tran H , Laferla F , Lue L , Emerson Lombardo N , Valla J ((2012) ) Broad-based nutritional supplementation in 3xTg mice corrects mitochondrial function and indicates sex-specificity in response to Alzheimer’s disease intervention. J Alzheimers Dis 32: , 217–232. |
[69] | Nicholson RM , Kusne Y , Nowak LA , LaFerla FM , Reiman EM , Valla J ((2010) ) Regional cerebral glucose uptake in the 3xTG model of Alzheimer’s disease highlights common regional vulnerability across AD mouse models. Brain Res 1347: , 179–185. |
[70] | Liang WS , Reiman EM , Valla J , Dunckley T , Beach TG , Grover A , Niedzielko TL , Schneider LE , Mastroeni D , Caselli RJ , Kukull WA , Morris JC , Hulette C , Schmechel D , Rogers J , Stephan DA ((2008) ) Alzheimer’s disease is associated with reduced expression of energy metabolism genes in posterior cingulate neurons. Proc Natl Acad Sci U S A 105: , 4441–4446. |
[71] | Nakamura T , Watanabe A , Fujino T , Hosono T , Michikawa M ((2009) ) Apolipoprotein E4 (1-272) fragment is associated with mitochondrial proteins and affects mitochondrial function in neuronal cells. Mol Neurodegener 4: , 35. |
[72] | Roses AD , Lutz MW , Amrine-Madsen H , Saunders AM , Crenshaw DG , Sundseth SS , Huentelman MJ , Welsh-Bohmer KA , Reiman EM ((2010) ) A TOMM40 variable-length polymorphism predicts the age of late-onset Alzheimer’s disease. Pharmacogenomics J 10: , 375–384. |
[73] | DeMichele-Sweet MAA , Klei L , Devlin B , Ferrell RE , Weamer EA , Emanuel JE , Lopez OL , Sweet RA ((2011) ) No association of psychosis in Alzheimer disease with neurodegenerative pathway genes.555.e. Neurobiol Aging 32: , 9–11. |
[74] | Cruchaga C , Nowotny P , Kauwe JSK , Ridge PG , Mayo K , Bertelsen S , Hinrichs A , Fagan AM , Holtzman DM , Morris JC , Goate AM ((2011) ) Association and expression analyses with single-nucleotide polymorphisms in TOMM40 in Alzheimer disease. Arch Neurol 68: , 1013–1019. |
[75] | Maruszak A , Pepłońska B , Safranow K , Chodakowska-Żebrowska M , Barcikowska M , Zekanowski C ((2012) ) TOMM40 rs10524523 polymorphism’s role in late-onset Alzheimer’s disease and in longevity. J Alzheimers Dis 28: , 309–322. |
[76] | Roses AD ((2010) ) An inherited variable poly-T repeat genotype in TOMM40 in Alzheimer disease. Arch Neurol 67: , 536–541. |
[77] | Riha PD , Rojas JC , Gonzalez-Lima F ((2011) ) Beneficial network effects of methylene blue in an amnestic model. Neuroimage 54: , 2623–2634. |
[78] | Buckner RL , Andrews-Hanna JR , Schacter DL ((2008) ) The brain’s default network: Anatomy, function, and relevance to disease. Ann N Y Acad Sci 1124: , 1–38. |
[79] | Leech R , Sharp DJ ((2014) ) The role of the posterior cingulate cortex in cognition and disease. Brain 137: , 12–32. |
[80] | Stranahan AM , Mattson MP ((2011) ) Metabolic reserve as a determinant of cognitive aging. J Alzheimers Dis 28: , 1–9. |
[81] | Cohen AD , Price JC , Weissfeld LA , James J , Rosario BL , Bi W , Nebes RD , Saxton JA , Snitz BE , Aizenstein HA , Wolk D , Dekosky ST , Mathis CA , Klunk WE ((2009) ) Basal cerebral metabolism may modulate the cognitive effects of Abeta in mild cognitive impairment: An example of brain reserve. J Neurosci 29: , 14770–14778. |
[82] | Jagust WJ , Landau SM ((2012) ) Apolipoprotein E, not fibrillar β-amyloid, reduces cerebral glucose metabolism in normal aging. J Neurosci 32: , 18227–18233. |
[83] | Sekar S , McDonald J , Cuyugan L , Aldrich J , Kurdoglu A , Adkins J , Serrano G , Beach TG , Craig DW , Valla J , Reiman EM , Liang WS ((2015) ) Alzheimer’s disease is associated with altered expression of genes involved in immune response and mitochondrial processes in astrocytes. Neurobiol Aging 36: , 583–591. |
Figures and Tables
Fig.1
Several key metabolic proteins show altered expression in APOE4 carriers. A) Representative western blots of proteins underlying brain glucose and ketone metabolism. Each protein target was analyzed with a separate probe; however, GLUT1, GLUT3, MCT1, and MCT4 results shown here align to the same subjects. Similarly, HEX1, MCT2, SCOT, and AACS shown here align to the same second set of subjects. Analysis proceeded on three such sets in total for each target (N = 24), in triplicate. B) A representative western blot resulting from application of the antibody cocktail against mitochondrial oxidative phosphorylation protein subunits. Analysis proceeded on three such sets (N = 24), in triplicate.
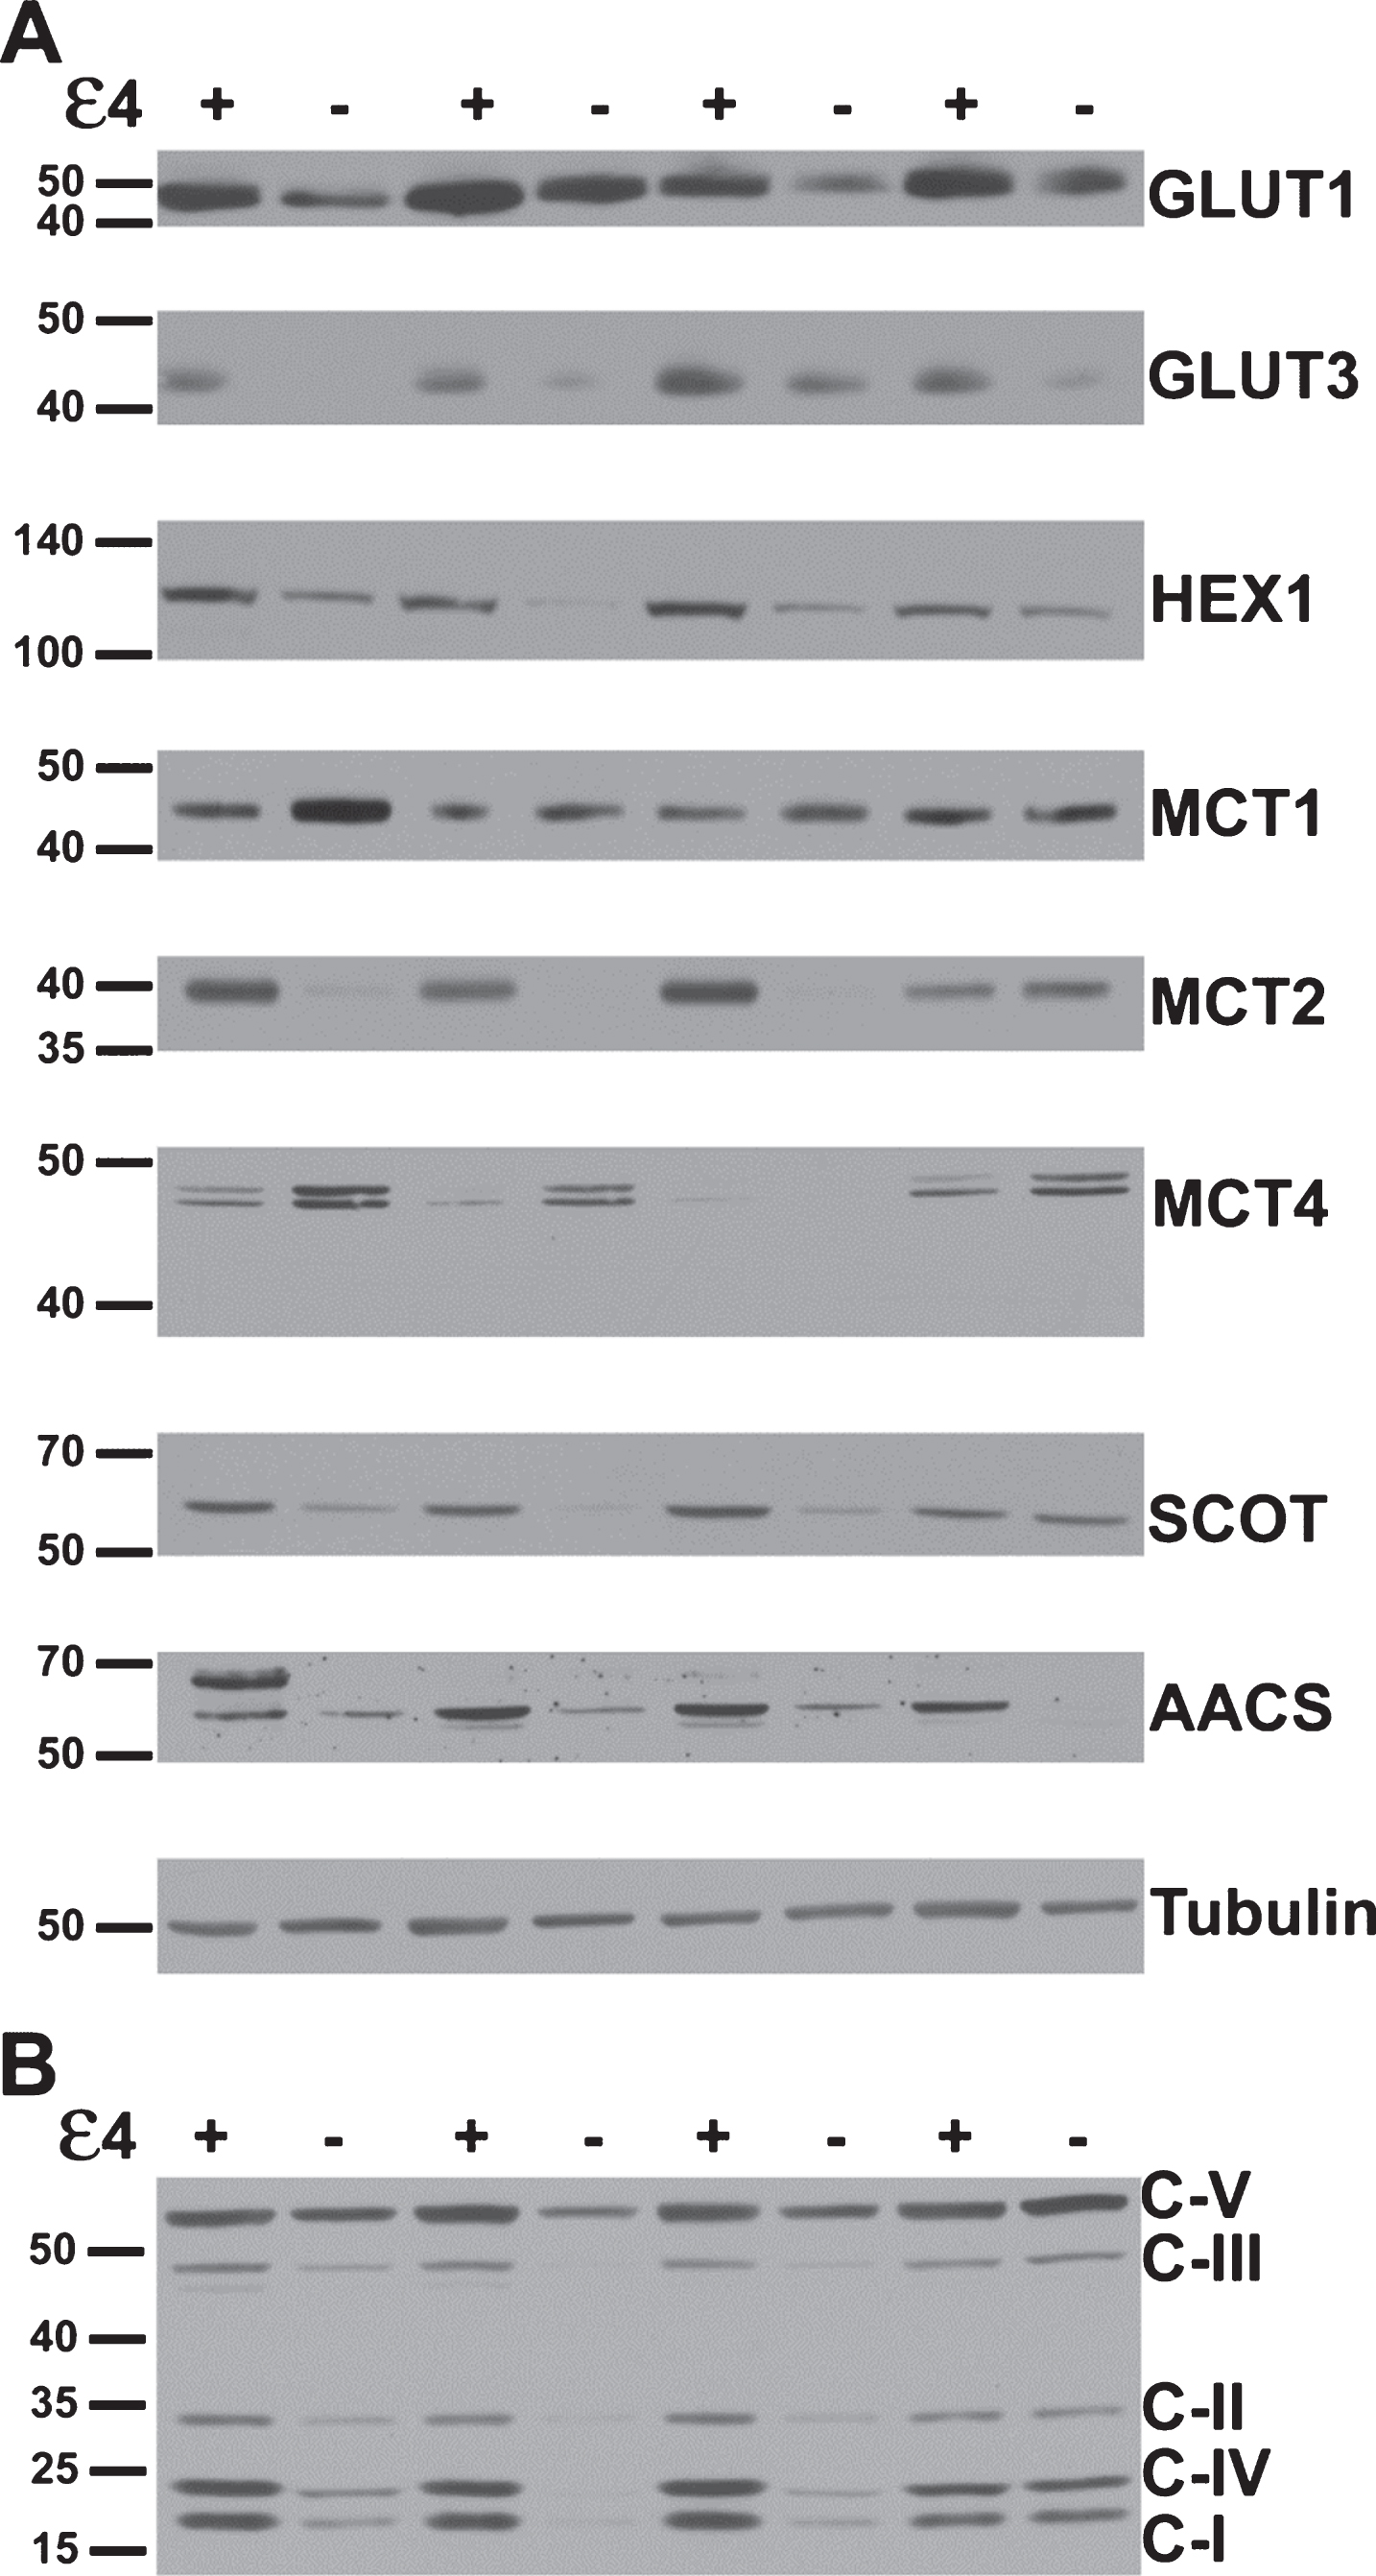
Fig.2
Alterations in glucose metabolism in APOE4 carriers. Western blot results demonstrating significantly higher protein levels of glucose metabolism proteins in APOE4 carriers, except CAV1 (normalized mean±SEM). mRNA transcripts for GLUT3 and hexokinase-1 were shown to be increased in qPCR analysis (table right); GLUT1 and caveolin-1 were not significantly higher in the qPCR analysis. GLUT1, GLUT3, glucose transporters; HEX1, hexokinase-1; CAV1, caveolin-1. APOE4(+), carriers; APOE4(–), non-carriers. * p < 0.0375 (Benjamini-Hochberg adjusted significance level), 2-tailed Student’s t-test.
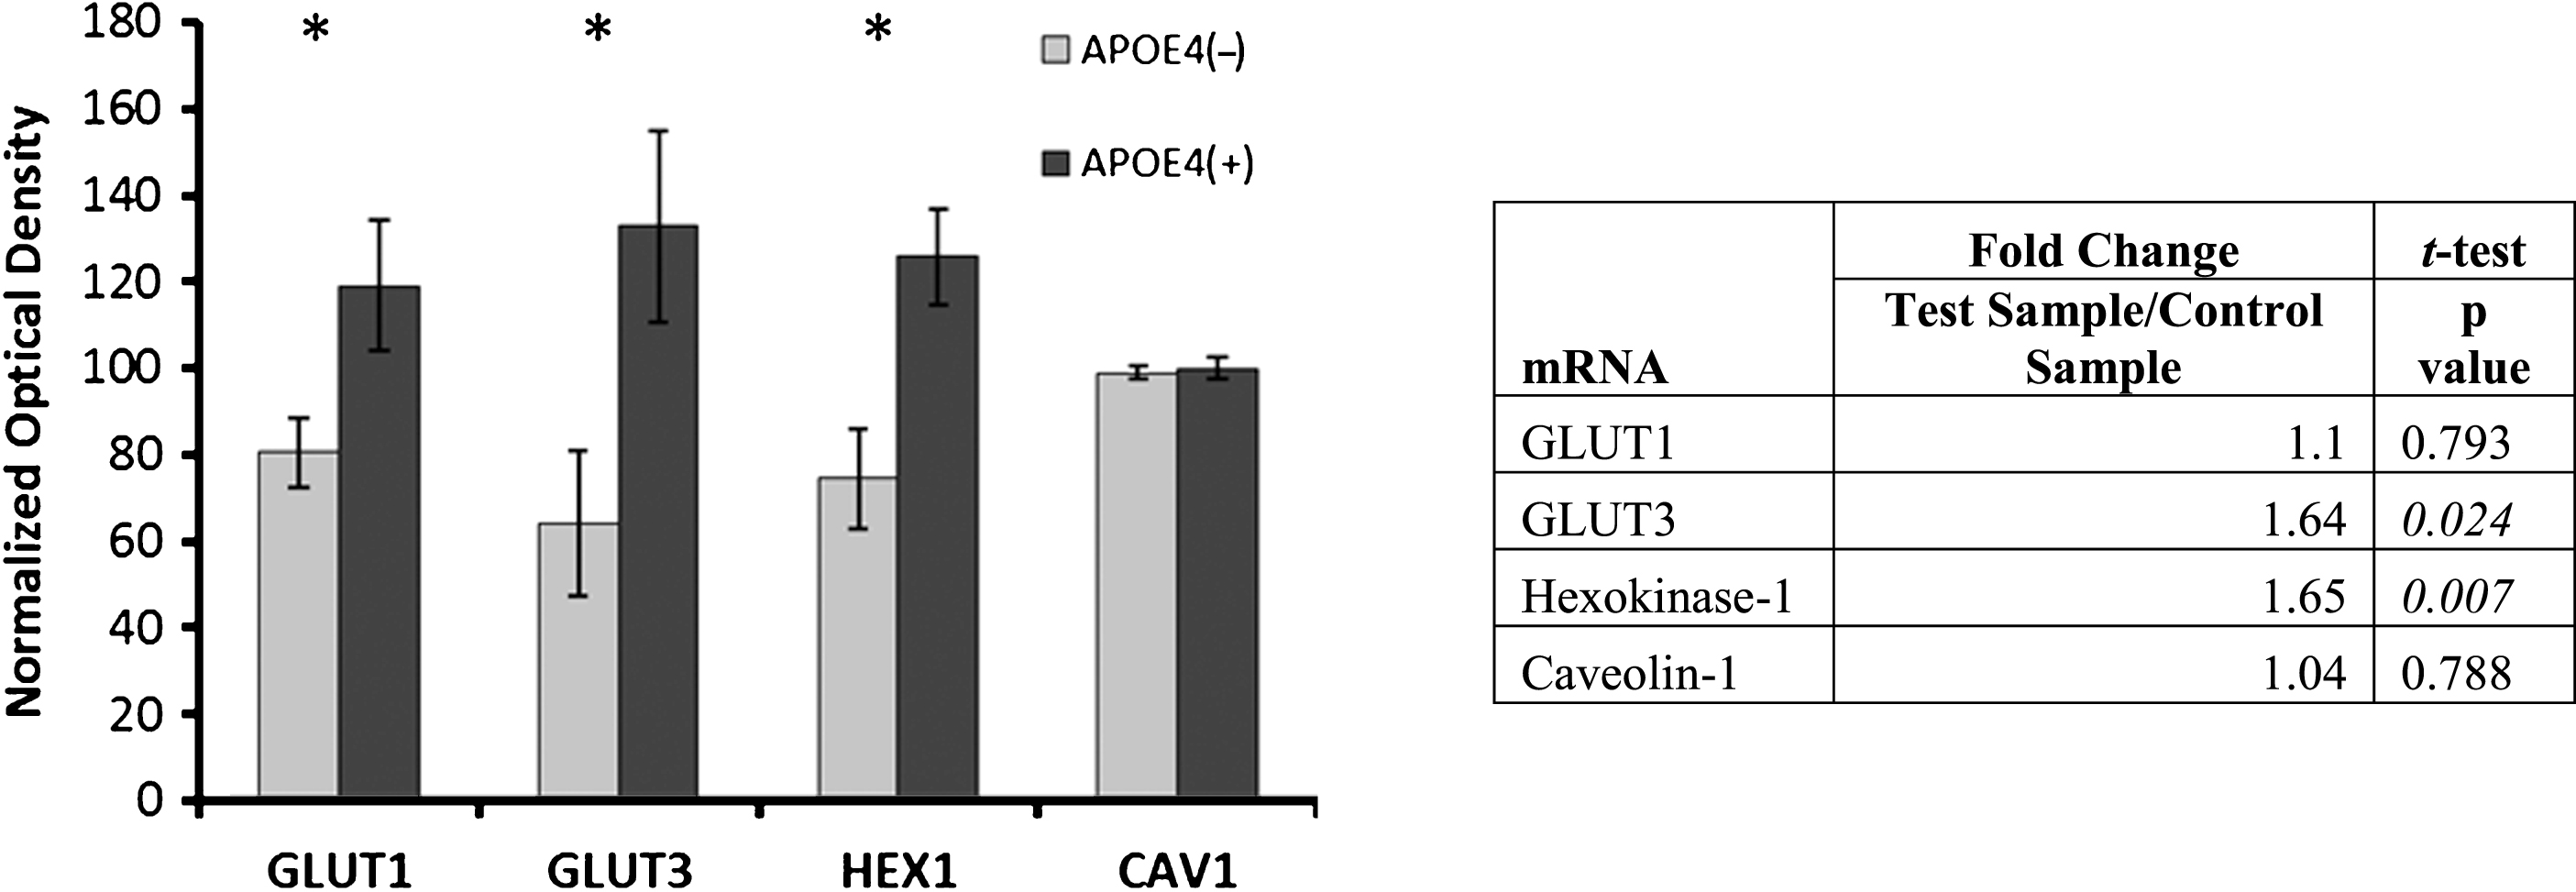
Fig.3
Alterations in ketone metabolism in APOE4 carriers. Western blot results demonstrating significantly altered protein levels for ketone metabolism in APOE4 carriers (normalized mean±SEM). MCT2, SCOT, and AACS were significantly increased, and MCT4 was significantly decreased. MCT2 mRNA transcript increases were demonstrated via qPCR. MCT1, MCT2, MCT 4, monocarboxylate transporters; SCOT, succinyl-CoA:3-ketoacid CoA transferase; AACS, acetoacetyl CoA synthetase; APOE4(+), carriers; APOE4(–), non-carriers. *p < 0.040 (Benjamini-Hochberg adjusted significance level), 2-tailed Student’s t-test.
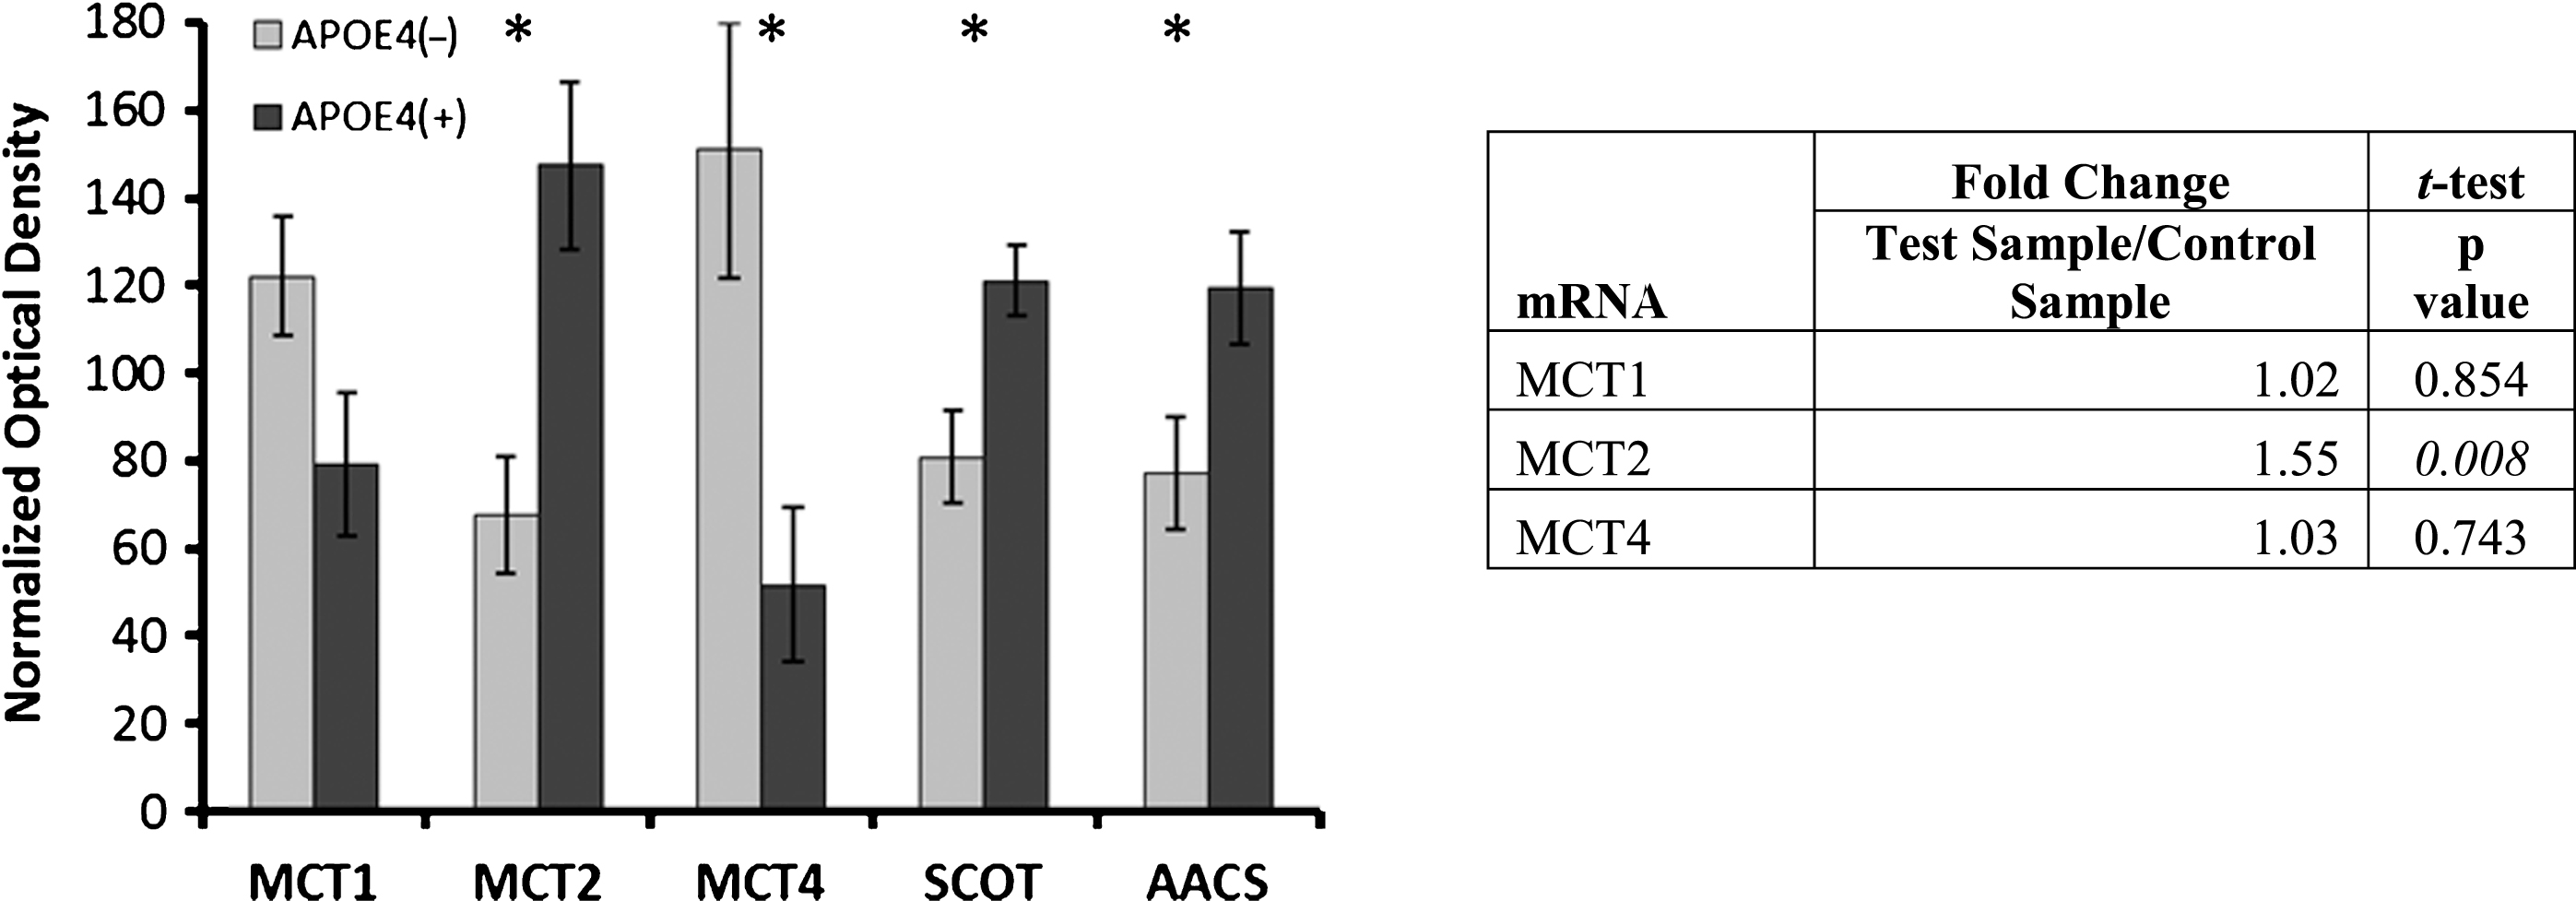
Fig.4
Alterations in electron transport chain protein expression in APOE4 carriers. Western blot results demonstrating significantly increased expression of ETC complex I, II and IV subunits in APOE4 carriers (normalized mean±SEM). CI-CV, ETC Complexes I-V, respectively; APOE4(+), carriers; APOE4(–), non-carriers. *p < 0.030 (Benjamini-Hochberg adjusted significance level), 2-tailed Student’s t-test.
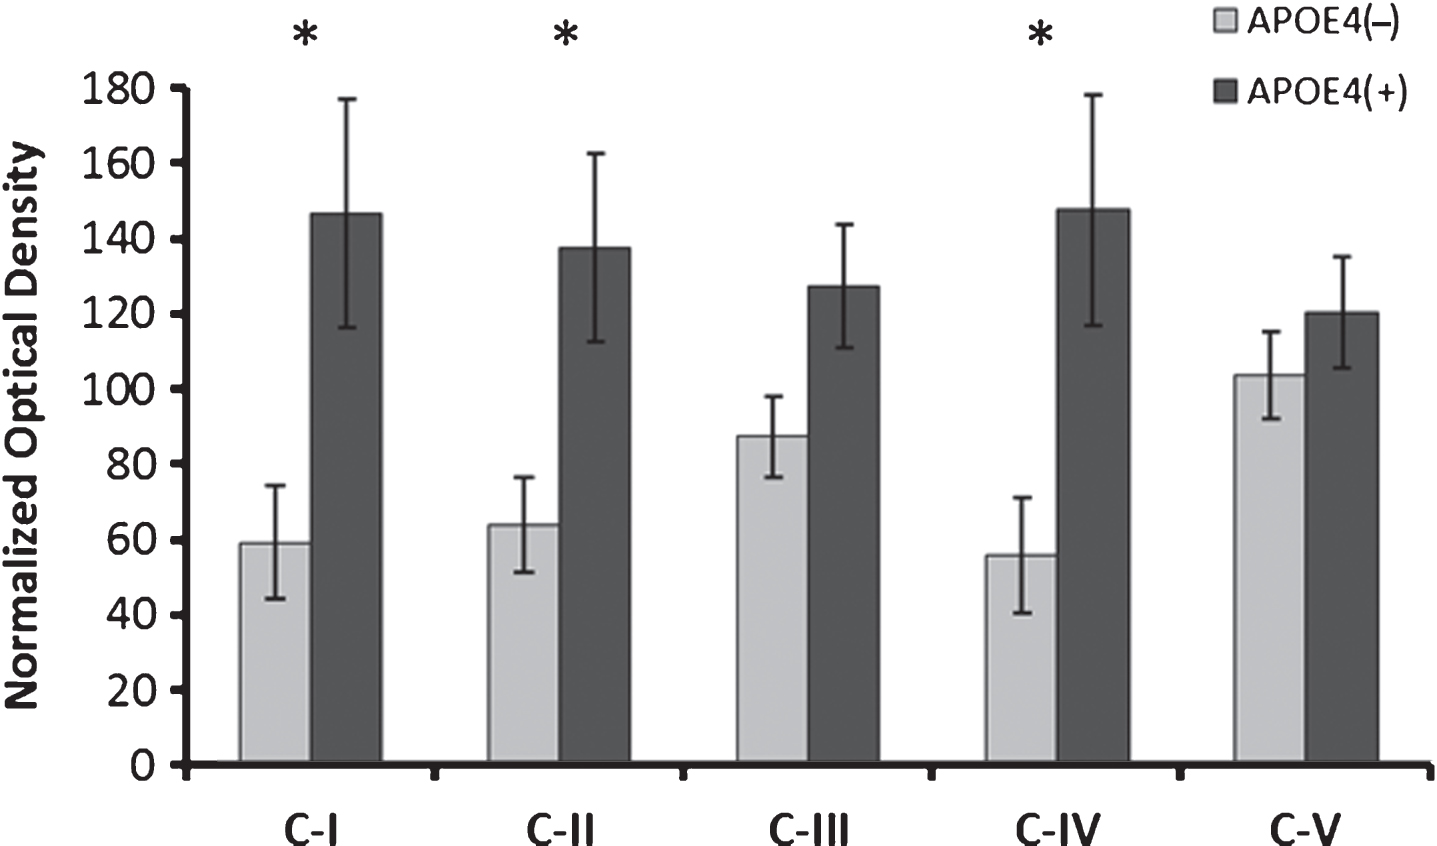
Table 1
Demographics of analyzed subjects
| APOE | Sex | Age (y) | PMI (h) | Race | COD |
| ɛ4 non-carriers | |||||
| 3/3 | M | 29 | 12 | H | MVA |
| 3/3 | M | 19 | 11 | C | narcotic intoxication |
| 3/3 | M | 35 | 12 | C | MVA |
| 3/3 | F | 33 | 19 | C | ASCVD |
| 3/3 | M | 23 | 8 | AA | cardiomyopathy |
| 3/3 | F | 20 | 19 | C | MVA |
| 2/3 | F | 18 | 15 | C | MVA |
| 3/3 | F | 26 | 12 | C | cardiac tamponade |
| 3/3 | M | 30 | 20 | C | MVA |
| 3/3 | M | 33 | 7 | AA | coronary thrombosis |
| 3/3 | M | 31 | 13 | C | MVA |
| 3/3 | F | 32 | 12 | C | MVA |
| ɛ 4 carriers | |||||
| 3/4 | F | 39 | 17 | C | MVA |
| 3/4 | M | 24 | 8 | C | compressional asphyxia |
| 3/4 | M | 35 | 20 | C | ASCVD |
| 3/4 | F | 33 | 20 | AA | MVA |
| 3/4 | M | 28 | 17 | C | MVA |
| 3/4 | M | 37 | 12 | AA | ASCVD |
| 3/4 | M | 21 | 13 | AA | drowning |
| 4/4 | F | 34 | 12 | AA | asthma |
| 3/4 | F | 21 | 22 | AA | asthma |
| 4/4 | F | 27 | 18 | C | gunshot wound |
| 3/4 | F | 33 | 17 | C | asthma |
| 3/4 | M | 40 | 20 | C | HASCVD |
| 3/4 | F | 40 | 19 | C | narcotic intoxication |
PMI, postmortem interval; AA, African American; C, Caucasian; H, Hispanic; ASCVD, arteriosclerotic cardiovascular disease; HASCVD, hypertensive arteriosclerotic cardiovascular disease; MVA, motor vehicle accident.


