
Transcriptomics Profiling of Alzheimer’s Disease Reveal Neurovascular Defects, Altered Amyloid-β Homeostasis, and Deregulated Expression of Long Noncoding RNAs
Abstract
The underlying genetic variations of late-onset Alzheimer’s disease (LOAD) cases remain largely unknown. A combination of genetic variations with variable penetrance and lifetime epigenetic factors may converge on transcriptomic alterations that drive LOAD pathological process. Transcriptome profiling using deep sequencing technology offers insight into common altered pathways regardless of underpinning genetic or epigenetic factors and thus represents an ideal tool to investigate molecular mechanisms related to the pathophysiology of LOAD. We performed directional RNA sequencing on high quality RNA samples extracted from hippocampi of LOAD and age-matched controls. We further validated our data using qRT-PCR on a larger set of postmortem brain tissues, confirming downregulation of the gene encoding substance P (TAC1) and upregulation of the gene encoding the plasminogen activator inhibitor-1 (SERPINE1). Pathway analysis indicates dysregulation in neural communication, cerebral vasculature, and amyloid-β clearance. Beside protein coding genes, we identified several annotated and non-annotated long noncoding RNAs that are differentially expressed in LOAD brain tissues, three of them are activity-dependent regulated and one is induced by Aβ1 - 42 exposure of human neural cells. Our data provide a comprehensive list of transcriptomics alterations in LOAD hippocampi and warrant holistic approach including both coding and non-coding RNAs in functional studies aimed to understand the pathophysiology of LOAD.
INTRODUCTION
Alzheimer’s disease (AD) is a complex age-related neurodegenerative disorder characterized by progressive loss of synapses and neurons in the hippocampus and cortex, which is associated with gradual decline in short-term memory and cognitive functions. It affects more than 36 million people worldwide, and by the year 2050, the number of people affected by AD may triple [1, 2]. At the molecular level, the hallmarks of AD are the presence of amyloid-β (Aβ) plaques and neurofibrillary tangles (NFTs) in the brains of patients affected by the disease. Mutations in genes involved in Aβ biogenesis (APP, PS1, and PS2) have been found in the small percentage (∼13% ) of cases of familial early-onset AD. Despite an enormous research effort, causative genetic alterations responsible for the most cases of late-onset AD (LOAD) remain largely unknown, suggesting a polygenic multifactorial type of inheritance. The ɛ4 allele of apolipoprotein E (APOE) is the major genetic risk factor of LOAD [3]; however, recent genome wide association studies have found common low-penetrance variants associated with LOAD in more than 20 genomic loci [4–8]. Current research is still a long way from the ultimate goal of revealing clear factors that can help in the diagnosis, prevention, and treatment of the disease. Based on the ‘Common Disease, Common Variant’ hypothesis, genetic variations with high frequency and low penetrance might be the major contributors to LOAD. Alternatively, the ‘Common Disease, Rare Variant’ hypothesis suggests that rare variations with high penetrance might explain genetic susceptibility to LOAD. Above both of these genetic variation hypotheses, epigenetic factors and lifelong environmental or nutritional impetuses might contribute to disease without any apparent genetic background. The low heritability and absence of clear genetic correlates implies that LOAD may represent a common pathogenic process resulting from an interplay of different genetic, environmental, and epigenetic factors [9]. In an attempt to investigate transcriptomic changes that take place in LOAD, several gene expression profile studies on postmortem brain tissues from AD patients have been performed mostly using microarray technology [10]. These studies identified AD specific alterations in cellular processes such as mitochondrial activity, intracellular signaling, and neuroinflammation but, unfortunately, little consensus among these studies or meaningful insight into AD pathophysiology has been obtained (reviewed in [10]). This is likely due to inherent limitations of microarray technology, which has since been largely replaced by next generation RNA sequencing (RNAseq) [11]. RNAseq provides a more comprehensive and accurate transcriptomic analysis with the main advantage being the accurate analysis of all RNA species, including non-protein coding RNAs (ncRNAs) [12] and alternatively spliced isoforms, thus representing an extraordinary tool to study transcriptomic changes associated with complex diseases pathogenesis [13].
Here we investigated transcriptomic changes in the hippocampus of AD patients with directional RNA sequencing and analyzed the data using an experimentally validated bioinformatics pipeline that allows the discovery of novel RNA transcripts and the precise measurements of protein- and non protein-coding genes expression. Our study provides for the first time a comprehensive and experimentally validated data set of transcriptomic changes occurring in the hippocampus of LOAD patients and identifies conceptually novel molecular targets that may play a role in the pathogenesis of LOAD.
MATERIAL AND METHODS
Brain samples
Human brain samples were prepared from rapid autopsy brain tissue that had been obtained from The Branner Sun Health Research Institute. The average postmortem interval (PMI) for all the samples is 2.48 h (Supplementary File 1). All enrolled subjects or legal representatives had signed a Sun Health Research Institutional Review Board–approved informed consent form allowing both clinical assessments during life and several options for brain and bodily organ donation after death. Total RNA was isolated via CsCl purification from tissue dissected from specific regions of brain. Although not all regions were available from all cases, we examined a total of 118 RNA samples from superior frontal gyrus, entorhinal cortex, hippocampus, and cerebellum in this study. Drs. Douglas E. Wood and Barbara G. Sahagan at Central Nervous System Discovery, Pfizer Global Research and Development, USA previously gifted these RNA samples to our laboratory, which were utilized in our published work [14]. Tissue sample information was received from the Banner Sun Health Research Institute. Complete clinicopathological information on the samples are provided as Supplementary File 1.
Average plaque density was scored in different brain regions (frontal, temporal, and parietal lobes, hippocampus, and entorhinal cortex) according to the CERAD templates [15]. Values: 0 = none; 1 = sparse; 2 = moderate; 3 = frequent; 9 = unknown or unavailable. Average NFT density was scored in different brain regions (frontal, temporal, and parietal lobes, hippocampus, and entorhinal cortex) according to the CERAD templates [15]. Values: 0 = none; 1 = sparse; 2 = moderate; 3 = frequent; 9 = unknown or unavailable. The Braak stage describes the topographical progression of NFTs, as well as associated dystrophic neurites and neuropil threads, throughout the transentorhinal and entorhinal areas, CA1 subfield of the hippocampus, amygdala, and cerebral neocortex. Evaluations was made according to the original publication [16]. NIA-Regan criteria are consensus recommendation for the diagnosis of AD developed by a consensus committee jointly sponsored by the National Institute on Aging (NIA) and the Reagan Institute [17]. The guidelines suggested that certain combinations of CERAD neuritic plaque density and Braak neurofibrillary stage confer probabilistic estimates of their likelihood for being responsible for dementia. Thus, there are low, intermediate, and high likelihoods for dementia due to AD histopathology. The category “not AD” is checked off if there are either no plaques at all or no tangles at all. The category “criteria not met” is checked off if the subject was not demented.
Library preparation
RNA quality was measured using Agilent Bioanalyzer RNA nano chip and the RNA integrity number (RIN) of the samples was between 6.5 and 8.6. RNA samples were prepared for directional RNA sequencing using a modified version of the Illumina Directional mRNA-Seq sample preparation protocol. Briefly, 1μg of total RNA was processed using Ribo-ZeroTM rRNA Removal Kits (Epibio) to remove ribosomal RNAs. Ribosome-depleted RNA was treated with phosphatase before being treated with T4 polynucleotide kinase (PNK). PNK-treated RNA was then purified with the QIAGEN RNeasy column purification kit and different 3’ and 5’ RNA adapters were ligated to both ends of the RNA in separate reactions. Next, the RNA was reverse transcribed and PCR amplified on regular thermo cyclers for 15 cycles. PCR products were purified using AMPure beads. RNA sequencing libraries were validated using the Agilent Bioanalyzer High Sensitivity DNA kit and sequenced using the Illumina HiSeq2000 platform at the Genomics sequencing core at the Hussman Institute for Human Genomics, University of Miami. Each sample was run in a single lane of a flow cell to increase depth of sequencing.
Differential gene expression analysis
RankProd R package [18] was used to perform gene expression analysis of RNAseq data. First, genes were filtered based on read coverage and only genes having average coverage of at least 20 reads in one of the two groups were retained. These FPKM values were used as input for RankProd analysis, which ranks genes in each replicate from the experimental group based on their up- or downregulation compared to the control group. Then, it derives rank product (RP), which is the product of all the individual ranks for a given gene in each replicate. Genes with small RP are consistently up- or downregulated in several experimental replicate conditions. P value for each gene is calculated based on permutation tests and reflects the number of times RP values smaller than or equal to a given experimental RP value occur in the 100 random experiments. To correct for multiple comparisons, the percentage of false-positives (pfp) equivalent to FDR is calculated by dividing the p value by the relative rank of a gene in the gene list. pfp value of 0.1 was used as the cutoff for statistical significance.
Pathway analysis
Differentially expressed protein-coding genes were utilized as the input list to perform enrichment analysis with GeneGo MetaCore from Thomson Reuters. GeneGo Enrichment analysis tool uses manually annotated reference pathways to calculate the enrichment of a given list of genes in each pathway and provides p value and FDR value that reflect the chance the given number of genes from a pathway would appear in the list by chance. Only pathways with FDR less than 0.1 were considered as significantly enriched.
Quantitative real time PCR (qRT-PCR)
All RNA samples were treated with DNase to remove any contaminant genomic DNA. RNA was then reverse transcribed using Superscript first strand kit (Life Technologies) and the cDNA was diluted and used as template for SYBR Green or TaqMan qPCR on the ABI 7900 (Life Technologies). RNA from human brain, heart, kidney, liver, lung, and muscle was purchased from Life Technologies. Human neurons and astrocytes RNA have been purchased from ScienceCell Research Laboratories, cat# 1525 and cat# 1585 respectively. SERPINE1, TAC1, PGK1 and β-ACTIN TaqMan assays were purchased from Life Technologies. Primers used for SYBR green qRT-PCR to validate and measure the expression of novel ncRNAs are listed in Supplementary File 7. Non-coding RNAs expression was measured using Power SYBR Green (Life Technologies). For all qRT-PCR reactions, we included three technical replicates. To compare the expression of genes across different cellular compartment, GraphPad prism software was used to perform ANOVA followed by Tukey post-hoc test. A p value of below 0.05 was considered as statistically significant. The Student’s t-test was used to compare the expression between the normal brain and LOAD.
Human neural stem cells (hNSCs) culture, differentiation, and treatment
Human NSCs are isolated from three human fetal brains collected from 3rd trimester aborted fetuses, that we receive from the Birth Defects Research Lab at the University of Washington in Seattle, and maintained in culture as neurospheres as previously reported [19]. Briefly, dissected brain tissues are mechanically dissociated into single cell suspensions and seeded at a density of 5×10⁶ cells in 75-mm tissue culture flasks in Human Neural Progenitor Media from Lonza in the presence of EGF and FGF2. After 7–10 days of culture, NSCs cells form neurospheres colonies, whereas other cell types remain in suspension as single cells or attach to the bottom of the flask. The isolated hNSCs can be cultured as neurospheres in suspension for several months. Alternatively hNSCs can be differentiated in vitro into a mixed population of neurons and astrocytes. Briefly, to induce differentiation, neurospheres are disaggregated into single cells and plated in 6-well plates coated with poly-L-Ornythine (PLO) and laminin in the presence of B27/Neurobasal media in absence of growth factors for 21 days. The differentiated culture contains a mix of neural cell lineages including astrocytes and neurons as well as their progenitor cells.
KCL depolarization
To induce cellular depolarization, NSCs are differentiated for 21 days in the presence of B27 (without retinoic acid) into a mixed population of neurons and astrocytes. This mixed population of neural cells is depolarized utilizing 50 mM KCl for 1 h prior to RNA extraction.
Preparation of soluble Aβ42 peptides and cell treatment
1 mg of lyophilized Aβ42 peptide ωασ purchased from Sigma Aldrich (Catalog Number A9810) and dissolved in 1 mL of 1,1,1,3,3,3-hexafluoro-2-propanol (HFIP) to promote formation of α-helix and minimize β-sheet structure. The solution was air-dried in a fume hood and the resulting clear film was re-suspended in DMSO to a stock concentration of 1 mM. NSCs are differentiated for 21 days in the presence of B27 (without retinoic acid) into a mixed population of neurons and astrocytes. This mixed population of neural cells is exposed to 10μM of soluble Aβ42 for 48 h prior to RNA extraction.
Cellular fractionation
Human NSCs were fractionated into cytosol, nucleoplasm and chromatin using a modified NE-PER Kit (PIERCE) and RNA was isolated using a combination of two protocols: Trizol (Life Technologies) and RNeasy Mini Kit (QIAGEN). The kit was used as described in the protocol except the insoluble pellet after nucleoplasm extraction was washed with PBS once and re-suspended in Trizol reagent until completely dissolved before proceeding to RNA extraction from the chromatin fraction.
Immunostaining
Human neural stem cells were plated on 8-well glass chamber slides (Millipore, PEZGS0816) coated with poly-l-ornithine for 3 h and laminin overnight. Cells were plated at the density of 40,000 cells per well and differentiated in Neurobasal media containing B27 supplement without vitamin A in absence of growth factors for 21 days before staining. After 21 days, cells were fixed with 4% formaldehyde for 10 min, permeabilized with 0.2% triton X, and incubated for 1 h in 20% goat serum to prevent non-specific binding of primary antibodies. Cells were then incubated with primary antibody overnight at 4°C, subsequently cells were washed 3 times with PBS and incubated with fluorescently labeled secondary antibodies for 2 h at room temperature. Antibodies used: rabbit anti-βIII-tubulin (Covance, MRB-435P), chicken anti-MAP2 (Abcam, ab5392), mouse anti-GFAP (Millipore, MAB360).
RESULTS
Development of a bioinformatics pipeline for novel RNAs discovery and accurate gene expression analysis of RNA sequencing data
RNA deep sequencing (RNAseq) data analysis currently represents the bottleneck for the application of this powerful technology since an experimentally validated and globally accepted pipeline for data analysis is still missing. In this study, we developed and experimentally validated a computational approach based on TopHat [20] and Cufflinks [21] packages to accurately measure gene expression and to discover and annotate novel RNA transcripts. As schematically represented in Fig. 1A, TopHat is used to align reads to the human genome, while transcriptome reconstruction of each individual sample is performed using Cufflinks. Reconstructed transcriptomes for each individual samples are compared to each other using Cuffcompare that also merges overlapping constructs and annotates them according to the reference transcriptome provided (Ensembl GRCh37) [22]. In order to discriminate real transcripts from sequencing artifacts we adopted a filtering strategy based of two main criteria: 1) the presence of at least one splice junction in the transcripts and 2) the recurrent expression of single exon transcripts across multiple samples. We noted that applying this filtering strategy dramatically reduces the number of fragments originating from introns, repeat transcripts and polymerase run-off RNAs.
After filtering, annotated transcripts are subdivided based on Ensembl classification in protein coding genes, long intergenic non-coding RNAs (lincRNAs) and natural antisense RNAs transcripts (NATs) (Fig. 1A). Non-annotated transcripts are divided into intergenic RNAs, located in between and non-overlapping other transcripts; and NATs, overlapping other transcripts in the opposite orientation. These novel transcripts may encode for novel proteins or may be noncoding RNAs. To assess the protein coding potential of these novel transcripts we used the coding potential assessment tool (CPAT), an alignment free method that rapidly recognizes coding and noncoding RNAs [23]. Cuffdiff module of Cufflinks is utilized to retrieve Fragment Per Kilobase per Million fragments mapped (FPKM) values for both annotated and novel genes that are then used to calculate differential gene expression applying Rank Products. Importantly, we noted a certain level of reads coverage to be necessary in order to obtain reliable differential expression analysis. By comparing qRT-PCR with RNAseq data we established coverage of 20 reads per transcript to be the minimum number of reads required to achieve reliable differential expression analysis.
The Alzheimer’s disease transcriptome
We performed directional RNA sequencing using Illumina Hiseq 2000 on RNA extracted from the hippocampi of four patients affected by LOAD and of four age-matched control individuals (Table 1 and Supplementary File 1). Directional RNAseq was performed running one sample per lane and we generated ∼177.000.000 reads per sample, yielding excellent coverage and sequencing depth (Tables 2 and 3). Directional sequencing technique, unlike conventional sequencing methods, keeps strand-of-origin information in order to accurately align reads from positive and negative DNA strands. The strand-specific alignment helps identifying NATs and to accurately measure expression values of both sense and antisense RNA transcripts. We applied our bioinformatics pipeline and identified 13,054 annotated genes to be expressed in at least one of the sequenced samples (Fig. 1B). We further subdivided these annotated genes based on Ensembl classification into protein coding genes (12,132), lincRNAs (499), and NATs (423) (Fig. 1B). We also found 2,082 novel lincRNAs and 443 novel NATs to be expressed in at least one of the analyzed samples. Of these novel transcripts, 51 intergenic RNAs and 32 antisense RNAs are predicted to have protein-coding potential by CPAT analysis, thus representing potential novel protein-coding genes (Fig. 1B). A complete list of all RNA transcripts retrieved from sequencing is provided as additional material (Supplementary File 2) and the raw data discussed in this publication have been deposited in NCBI’s Gene Expression Omnibus [24, 25] and are accessible through GEO Series accession number GSE67333.
In order to validate the accuracy of reconstruction and expression of novel RNA transcripts, we designed primers spanning exons junctions and performed qRT-PCR on RNA extracted from human hippocampus, cerebellum, and prefrontal cortex. With this method, we were able to validate the expression of 14 not-previously annotated ncRNAs, confirming the accuracy of our bioinformatics analysis in reconstructing and detecting expression of novel ncRNA transcripts (Fig. 1C).
To identify AD specific transcriptomic changes, we retrieved FPKM values for genes utilizing Cuffdiff and performed Rank Products analysis [18, 26] to obtain q values corrected for multiple comparison. As a criterion for determine differentially expressed genes, we used percentage of false positive (pfp), which is the equivalent of false discovery rate, at <0.1. In order to detect potential outlier samples, we utilized hierarchical clustering followed by plotting a heatmap of log transformed FPKM values for each sample. The hierarchical clustering was performed by calculating Euclidian distance of logarithm of FPKM values for differentially expressed
genes between each of the 4 control and 4 AD samples. As shown in Fig. 1D, control samples clustered together, as well as AD samples, indicating the absence of obvious outlier samples in our analysis. Differential expression analysis identified 143 protein coding genes, 90 lincRNAs, 31 antisense RNAs, and 1 novel putative protein coding gene to be differentially expressed between AD and control (Fig. 2A and Supplementary File 3). Three of the AD samples we selected for sequencing were Braak stage VI and the remaining sample was stage V. Braak stage of V and VI indicate the presence of NFT in neocortical regions and this typically indicates with high probability an advanced stage of the disease. These cases of AD could be characterized by extensive neuronal cell death and presence of gliosis in the brain, and this could results in differential expression of cell-type specific genes in our data set. To verify this possibility, we looked at the expression of known neuronal, astroglial, and microglial markers in Control and AD hippocampi from our RNAseq data. We observed no changes in the expression of neuronal markers: DCX (Fc: 1.02, pfp: 1.07), MAP2 (Fc: 0.74, pfp: 0.99), NFH (Fc: 0.73, pfp: 0.99), NEFM (Fc: 0.71, pfp: 0.99), RBFOX3 (Fc: 0.92, pfp: 1). No changes in the expression of astroglial markers: GFAP (Fc: 1.4, pfp: 0.8), AQP4 (Fc: 1.2, pfp: 0.99), ALDH1L1 (Fc: 1.22, pfp: 0.98), SLC1A3 (Fc: 1.08, pfp: 0.99). No changes in the expression of microglial markers: PTPRC (Fc: 0.74, pfp: 0.99), AIF1 (Fc: 0.74, pfp: 1.01). These data indicate that, although the AD samples we analyzed have high Braak score, they were not depleted of neurons and enriched of astroglia and microglia cells and that the differentially expressed genes from our analysis are not the results of an imbalance between the cellular populations between AD and CTRL hippocampi.
Interestingly, the proportion of differentially expressed genes is much higher for lincRNAs and NATs compared to protein coding genes, suggesting substantial alteration of noncoding part of the genome in complex disorders such as LOAD and underestimated importance of long ncRNAs in pathophysiological processes underlying AD. Next, we achieved technical validation of RNAseq differential expression data by performing qRT-PCR analysis on the same RNA samples used for sequencing (Fig. 2B). From RNAseq data we selected protein coding genes, lincRNAs and NATs with different expression levels and with a wide range of differential expression changes. We observed a high degree of correlation between log2 fold change differences from the two techniques for protein coding genes (n = 6, p = 0.0255, R = 0.8666), lincRNAs (n = 6, p = 0.0121, R = 0.9086), and AS (n = 6, p = 0.004, r = 0.9481) (Fig. 2B, Supplementary File 4). Our RNAseq data provide an accurate assessment of gene expression levels and provide an experimentally validated and comprehensive catalog of expression changes of both protein-coding and non-coding genes in the hippocampus of patients suffering from LOAD.
Dysregulation of neural communication and cerebral vasculature
Among the differentially expressed genes, we identified 61 protein coding genes to be expressed at lower levels and 82 at higher levels in AD hippocampi compared to control samples (pfp < 0.1) (Supplementary File 3). We utilized GeneGo MetaCore from Thomson Reuters to perform pathway analysis of differentially expressed genes, focusing our attention on process networks. This represents a comprehensive classification of biological processes based on a specific functional theme and defines involvement of genes in a process based on both the gene function and its known interactions with others genes related to the process. The two most enriched process networks are related to nerve impulse transmission and neuropeptide signaling (Table 4). The analysis of neuropeptide signaling pathways enriched for differentially regulated genes in our dataset revealed that the gene encoding substance P (TAC1) is downregulated in the hippocampi of AD patients compared to controls. The neurotrophic and neuroprotective activity of substance P, a neuropeptide involved in pain perception, has been demonstrated both in vitro and in vivo and reduced substance P levels and degeneration of substance P-immunopositive neurons in the brain of AD patients have been reported [27, 28]. In order to confirm our RNAseq results and to investigate the expression of TAC1 in other brain regions, we decided to perform qRT-PCR analysis of the hippocampus, cerebellum, superior frontal gyrus, and entorhinal cortex of LOAD and control patients. We used a cohort of postmortem brain tissues representing four brain regions of 24 LOAD and 23 age- and gender-matched controls (Supplementary File 1). Although not all of the brain regions were available from every individual, we had access to RNA form the cerebellum of 24 patients and 20 controls, hippocampus of 12 patients and 10 controls, entorhinal cortex of 8 patients and 9 controls, and superior frontal gyrus 17 patients and 18 controls. We could validate downregulation of substance P expression in the hippocampus and we observed a clear reduction, although not statistically significant, in the entorhinal cortex of AD patients compared to control (Fig. 3A). There were no significant changes in TAC1 expression in the superior frontal gyrus, or in the cerebellum (Fig. 3A). Hippocampus and enthorinal cortex are among the first areas of the brain to be affected in AD, thus substance P loss in these two regions may represent an early event during the pathogenesis of the disease.
The other two statistically enriched process networks were muscle contraction and development blood vessel morphogenesis, indicating alterations in hippocampus vascularization in LOAD patients (Table 4).
Beside the genes belonging to this networks, we noticed, among the most differentially expressed protein coding genes in our RNAseq dataset, SERPINE1 which is a regulator of vascular function and was previously associated with AD [29, 30]. According to our RNAseq data, SERPINE1 was upregulated more than 3-fold in LOAD hippocampi. SERPINE1 codes for the plasminogen activator inhibitor type-1 (PAI-1), which negatively regulates plasminogen activator proteins thus reducing the production of plasmin, a serine protease that plays a critical role in fibrinolysis, but also in mediating Aβ clearance [31]. Because of this dual role of SERPINE1, we decide to further study the expression of this gene in our bigger cohort of AD samples. qRT-PCR analysis of SERPINE1 expression in different areas of the brain confirmed the abundant overexpression of SERPINE1 in LOAD brain regions known to be affected by the disease: hippocampus (∼11 fold), superior frontal gyrus (∼5 fold), and entorhinal cortex (∼10 fold) (Fig. 3B). On the other hand, no differences in the expression of SERPINE1 were observed in cerebellum, the brain region that is typically not affected by the disease (Fig. 3B). Thus SERPINE1 overexpression in specific areas of the brain may result in alteration of the cerebral vasculature and reduction of Aβ degradation.
LOAD-dysregulated natural antisense transcripts
NATs are a class of lncRNAs that are transcribed from the opposite DNA strand of other RNA transcripts for which they share sequence complementarity. Antisense RNAs exert regulatory functions on protein-coding gene expression by different mechanisms both at the transcriptional and post-transcriptional level and the involvement of NATs in the pathophysiology of neuropsychiatric disorders has been previously demonstrated [32–35]. Among the 31 differentially expressed NATs we noticed 21 (9 novel and 12 annotated) to be upregulated and 10 to be downregulated (4 novel and 6 annotated) in LOAD compared to control individuals (Supplementary File 3). Among the most differentially expressed NATs are two multi-exonic RNAs that were not previously annotated and that we named HAO2-AS (XLOC_051561) and EBF3-AS (XLOC_083817). HAO2-AS is a 5 exons RNA of 488 nt transcribed from the opposite strand of the protein-coding gene HAO2 on chromosome 1 (Fig. 4A), while EBF3-AS is a 2-exons RNA of 842 nt transcribed from the opposite strand of the protein-coding gene EBF3 on chromosome 10 (Fig. 4A). 5’ RACE experiments validated the structure of these novel antisense ncRNAs and confirmed the accuracy of our RNAseq analysis in reconstructing and annotating novel transcripts (Table 5). These two antisense ncRNAs show tissue specific expression profiles with HAO2-AS most abundantly expresses in the heart and EBF3-AS most abundantly expressed in the brain (Fig. 4B). Differential expression of these NATs in LOAD cases and their tissue-specific pattern of expression suggest that these NATs are not spurious random transcripts and further suggest that these transcripts might have important regulatory function in heart and brain.
In order to better characterized HAO2-AS and EBF3-AS, we performed subcellular fractionation of hNSCs isolated from three fetal brain tissues and extracted RNA from three separated fractions: cytosol, nucleoplasm, and chromatin. While protein coding genes are enriched in the cytoplasm (data not shown), both of the NATs are more abundantly expressed in the nucleoplasm and in the chromatin fractions (Fig. 4C), suggesting their involvement in nuclear-related cellular processes such as epigenetic modification of histones that has been demonstrated for many long noncoding RNAs (lncRNAs) [32]. qRT-PCR analysis of EBF3-AS expression in different areas of the brain of AD cases and controls revealed the abundant overexpression of this NATs in AD brain regions known to be severely affected by the pathology (hippocampus, superior frontal gyrus, and entorhinal cortex) while no differences were observed in cerebellum (Fig. 4D, E). Similar expression analysis for HAO2-AS revealed its upregulation in hippocampus and superior frontal gyrus while no differences were observed in the entorhinal cortex or cerebellum. Our data demonstrate that NATs are specifically dysregulated in brain regions affected by LOAD pathology and suggest involvement of this class of lncRNAs in nuclear-related cellular processes.
LOAD-dysregulated long intergenic non-coding RNAs
LincRNAs are lncRNAs transcribed in intergenic regions [36, 37] that can exert regulatory functions at different levels and by different mechanisms [38]. Several independent studies confirmed lincRNAs to function as enhancer (eRNAs) to regulate gene expression of neighboring genes [39–41] or to act as scaffold for the recruitment of chromatin modifying enzymes to regulate the epigenetic state of specific genomic loci [42–44]. In our RNAseq analysis, we identified 89 lincRNAs to be differentially expressed in LOAD hippocampi compared to control, 72 of these are novel non-annotated RNA transcripts (Supplementary File 3). Among the differentially expressed lincRNAs, two multiexonic lincRNAs were selected for qRT-PCR validation in our larger cohort of brain specimens of LOAD cases and control. AD-linc1 (XLOC_753726) is a 264 nt long transcript composed of 14 exons transcribed from chromosome 9, while AD-linc2 (XLOC_612449) is a 3 exon, 246 nt long transcript transcribed from chromosome 6 (Fig. 5A). Both of these transcripts were upregulated in AD compared to control and because they were among the most highly expressed lincRNAs in our dataset, we decided to focus our attention on them. Expression of these two RNAs is tissue specific with AD-linc1 being mostly expressed in the brain while AD-linc2 is abundantly expressed in the heart and kidney and almost not detectable in the normal brain (Fig. 5B). Similarly to what we have observed for antisense transcripts, we noticed a clear localization of these two lincRNAs in the chromatin compartment, suggesting their role in regulating chromatin structure (Fig. 5C). qRT-PCR analysis of AD-linc1 and AD-linc2 expression in different brain regions of AD cases compare to controls revealed increased expression of these two ncRNAs in the hippocampus and superior frontal gyrus of AD patients while no differences were observed in cerebellum (Fig. 5D, E). Although non-statistically significant, due to the limited number of cases available, we also observed the same trend in the entorhinal cortex where these two ncRNAs are more abundantly expressed in AD than in controls (Fig. 5D, E).
LOAD-lncRNAs are enriched in neuronal cells and are activity-dependent regulated
To evaluate in which specific cell type (neuronal or astroglial) LOAD-lncRNAs are enriched, we compared their expression in commercially available RNA extracted from human neurons and astrocytes. As shown in Fig. 6A AD-linc1, AD-linc2, HAO2-AS, and EBF3-AS are all enriched, although at different degrees, in neurons compared to astrocytes. Recent studies revealed that the expression of a subset of long ncRNAs is dynamically regulated during neuronal activation, thus suggesting their involvement in activity-dependent neuronal processes [45, 46]. To investigate LOAD-dysregulated lncRNAs transcriptional changes in response to activity and identify potential novel activity-dependent players in the pathology, we depolarized human neurons derived from the in vitro differentiation of human neural stem cells (hNSCs) (Fig. 6B, C and Supplementary File 5) and we measured the expression of AD-linc1, AD-linc2, HAO2-AS, and EBF3-AS using qRT-PCR. NSCs were isolated from human fetal brain and were cultured as floating neurospheres as previously described [47, 48]. KCl depolarization induced a canonical activity-dependent transcription of the immediate early gene c-FOS, thus confirming the ability of our neuronal culture to activate transcription of activity-dependent genes upon depolarization. Among the analyzed ncRNAs, AD-linc2, HAO2-AS, and EBF3-AS show activity-dependent transcription activation (Fig. 6C). Recent studies have shown that lncRNAs expression changes in cells exposed to different stress conditions [49, 50]. To exclude the possibility that KCl treatment caused a generalized increase in lncRNAs transcription, we measured the expression of BDNF-AS, MALT1, and BACE1-AS, the last two being previously shown to be modulated by stress conditions [14, 51]. As shown in Fig. 6C, expression of BDNF-AS, MALAT1, and BACE1-AS does not change in response to KCl treatment thus excluding a generalized increase of lncRNAs. Activity-dependent transcriptional regulation implies that these LOAD-lncRNAs might have functional regulatory significance. One possibility was that these activity-dependent lncRNAs could regulate the expression of nearby genes in cis. To test this hypothesis, we looked at changes in the expression of genes located in the same locus after KCl treatment. Interestingly we did not observe any changes upon KCl depolarization in the expression of nearby genes (Supplementary File 6), indicating that transcriptional regulation of these activity-regulated lncRNAs is independent of nearby genes and suggesting a trans-acting mechanisms of function for these lncRNAs. Together our data suggest involvement of these lncRNAs in LOAD pathophysiology.
Expression of AD-linc1 is induced by Aβ42
Different long ncRNAs have been previously implicated in distinctive aspect of AβPP processing and a μψλoιδ generation [14, 52–54]; however, the effects of Aβ ɛξπoσυρɛ on the expression of lncRNAs in human neural cells have not been previously investigated. Iν oρδɛ to assess whether the expression of LOAD-dysregulated lncRNAs was altered by Aβ ɛξπoσυρɛ, we treated differentiated hNSCs with 10μM of soluble Aβ42 and then measured the expression of AD-linc1, AD-linc2, HAO2-AS, and EBF3-AS using qRT-PCR. We observed that 48 h exposure of Aβ42 triggers the expression of the novel lincRNA overexpressed in LOAD, AD-linc1. As expected, exposure to Aβ42 also induces activation of c-FOS [55] in differentiated neural cells. These data imply that accumulation of Aβ42 in LOAD induces the expression of AD-linc1, which might contribute to Aβ42 induced neurotoxicity.
DISCUSSION
The complex etiology of LOAD suggests that the pathology results from intricate interplay of genetic predisposition and environmental factors. This interplay is reflected in epigenomic and transcriptomic alteration of neural cells during disease progression [56–58]. Transcriptome profiling is an important tool in studying complex disorders to identify end-stage alterations that converge from interaction of multiple genetic, epigenetic, and environmental factors. The intricate nature of contributing factors might be hard to identify without studying their end products of transcriptome alterations in the affected brain tissues. Historically, transcriptome profiling was performed using microarray technology with the major limitation of measuring only previously identified probes. Second major limitation of studying transcriptome is quality of RNA samples, particularly human variations, comorbidities, tissue type, and long PMIs. Recent advances in RNA sequencing technologies have greatly contributed to understand the extent and complexity of mammalian transcriptomes and to unravel molecular mechanisms involved in the pathogenesis of complex diseases.
In this study, we used RNAseq to profile the expression of coding and non-protein coding RNA transcripts in the hippocampus of 4 LOAD patients compared to 4 healthy age-matched control individuals. We identified known and novel RNA transcripts, including protein-coding genes, lincRNAs, and NATs to be dysregulated in the brain of LOAD patients. We validated sequencing data using qRT-PCR in a larger set of high quality, short PMI RNA samples and we confirmed dysregulation of candidate genes in other brain regions affected by the disease. Moreover, we demonstrated that expression of several lncRNAs dysregulated in LOAD is dependent on neuronal activity, further indicating their role in disease-related alteration in neuronal function. We found more than a hundred protein coding genes to be differentially expressed in LOAD and pathways analysis suggested alteration in neural communication and cerebral vasculature. According to the “two-hit vascular hypothesis” of AD [59], a vascular-related dysfunction represents the first hit in the etiology of the disease. This initial hit is the cause of neurovascular defects like blood-brain barrier (BBB) dysfunction and oligaemia, which have been repeatedly observed in LOAD patients, and which may be directly responsible for both neuronal dysfunction and alteration in Aβ production and clearance [60]. In healthy physiological conditions, the BBB protects the brain by regulating the entrance of blood-born molecules through the activity of specific transporters or receptors [61–63]. Thus BBB breakdown and the uncontrolled trafficking of molecules, peptides, and cells from the blood to the brain and from the brain to the blood may participate in the activation of neuroinflammation and directly influence Aβ homeostasis in the brain [64]. The imbalance in Aβ homeostasis caused by the first hit culminates with the accumulation of Aβ in the brain and represents the second hit necessary for the progression of the pathology. When we mined our dataset looking for genes potentially implicated in both regulating vasculature function and Aβ homeostasis, our attention was caught by SERPINE1, which was among the most over-expressed protein-coding genes. SERPINE1 codes for PAI-1, which is the main activator of the plasmin cascade and fibrinolysis. In the brain, PAI-1 is mainly produced by endothelial cells, but it is also present in astrocytes and pericytes [65]. Increased expression of SERPINE1 and impairment of the fibrinolytic cascade are associable with thrombotic conditions, stroke, artery disease, atherosclerosis, and diabetes [66]. Interestingly all these conditions have been reported by epidemiological studies to be risk factors for AD [67]. Moreover, increased expression of SERPINE1 has been observed in the brain of AβPP/PS1 transgenic mice and in the cortex of AD patients and knockout of SERPINE1 in AβPP/PS1 mice reduces the amounts of both soluble and insoluble Aβ and plaques in the brain [68–70]. In our study, using qRT-PCR we demonstrated robust overexpression of SERPINE1 in AD brain regions that are characterized by Aβ accumulation during the pathogenesis of the disease, but not in non-affected regions like cerebellum. Our findings open the possibility that the increased expression of SERPINE1 and the suppression of fibrinolysis may play a dual role in LOAD. First, it may lead to neurovascular dysfunction and second, it may cause impairment in amyloid clearance, thus resulting in increased Aβ levels. SERPINE1 overexpression in LOAD cases, as we reported here, and the crucial involvement of this protein in both the pathophysiology of cerebral vasculature and regulation of amyloid homeostasis strongly support the “two-hit vascular hypothesis” for AD.
Data generated in the past 10 years mostly from the effort of two international research consortiums, the ENCODE and the FANTOM, demonstrated that the majority of the human genome is transcribed mostly in non-protein coding RNAs [27]. A clear functional classification of these RNA transcripts is still not available due to the paucity of functionally validated examples; however, ncRNAs can be classified by their length into short ncRNAs (<30 nt) and long ncRNAs (>200 nt). In the brain and nervous system, lncRNAs are particularly abundant [71], have cell-type and activity-dependent specificity of expression [45], and play fundamental roles in a variety of biological processes and diseases, including AD [28]. For instance, our previous works demonstrated the pivotal role of the antisense long ncRNA (lncRNA) BACE1-AS in the pathophysiology of LOAD [14, 72, 73]. Even thought catalogs of lncRNAs have been described in many human cell types and in multiple types of cancer [74], demonstrating the existence of cell-specific and disease-specific lncRNAs, a signature of lncRNAs for LOAD is still missing. We identified several annotated and non-annotated lncRNAs differentially expressed in LOAD hippocampi compared to control, thus providing for the first time a list of unexplored potential targets that could be involved in the pathogenesis of the disease. We went further to investigate the expression of four lncRNA candidates using qRT-PCR in a bigger cohort of brain samples. Interestingly, we noted clear changes in the expression of these lncRNAs not only in the hippocampus but also in the entorhinal cortex and superior frontal gyrus of LOAD patients. As a control for our study, we analyzed expression of these ncRNA in the cerebellum, a brain region only partially affected by the disease, and we could not detect any statistical changes in the expression of these four lncRNAs between patients and control samples. Interestingly all the four ncRNAs are enriched in the nuclear or chromatin compartment and the expression of three of them is triggered in response to neuronal activity, thus suggesting involvement of these ncRNAs in activity-dependent, nuclear-associated cellular processes. In cultured human neural cells, the expression of one of the discovered lincRNA, AD-linc1, is triggered by Aβ1 - 42 exposure. These data suggest that the observed overexpression of AD-linc1 in LOAD is due to Aβ1 - 42 accumulation and open the possibility that AD-linc1 is involved in amyloid-induced neurotoxicity. Alternations of activities of specific neuronal networks during AD are thought to be important contributors to the development and progression of the pathology, in part through regional vulnerability to Aβ deposition [75]. Differential expression of these lncRNAs in LOAD cases, tissue-specific pattern of expression and their nuclear localization suggest involvement of noncoding part of genome in complex disorders such as LOAD and warrant holistic approaches to consider these transcripts together with protein-coding genes in studies aim to understand pathological processes leading to LOAD.
CONCLUSIONS
Our data demonstrate the existence of region specific transcriptomic changes in the brain of LOAD patients in protein and non-protein coding genes and represent an important resource of LOAD-specific transcriptomic changes that can help to better understand alterations in biological cellular pathways that contribute to the pathophysiology of AD.
ACKNOWLEDGMENTS
This work was supported by the US NIH NINDS R01NS081208-01A1 awarded to Mohammad Ali Faghihi. Dr. Magistri was supported by the fellowship for Prospective Researcher from the Swiss National Science Foundation, which covered the first year of his postdoctoral training.
Authors’ disclosures available online (http://j-alz.com/manuscript-disclosures/15-0398r2).
Appendices
The supplementary material is available in the electronic version of this article: http://dx.doi.org/10.3233/JAD-150398.
REFERENCES
1 | Hebert LE, Weuve J, Scherr PA, Evans DA(2013) Alzheimer disease in the United States (2010-2050) estimated using the 2010 censusNeurology80: 17781783 |
2 | Barnes DE, Yaffe K(2011) The projected effect of risk factor reduction on Alzheimer’s disease prevalenceLancet Neurol10: 819828 |
3 | Liu CC, Kanekiyo T, Xu H, Bu G(2013) Apolipoprotein E and Alzheimer disease: Risk, mechanisms and therapyNat Rev Neurol9: 106118 |
4 | Harold D, Abraham R, Hollingworth P, Sims R, Gerrish A, Hamshere ML, Pahwa JS, Moskvina V, Dowzell K, Williams A, Jones N, Thomas C, Stretton A, Morgan AR, Lovestone S, Powell J, Proitsi P, Lupton MK, Brayne C, Rubinsztein DC, Gill M, Lawlor B, Lynch A, Morgan K, Brown KS, Passmore PA, Craig D, McGuinness B, Todd S, Holmes C, Mann D, Smith AD, Love S, Kehoe PG, Hardy J, Mead S, Fox N, Rossor M, Collinge J, Maier W, Jessen F, Schurmann B, Heun R, van den Bussche H, Heuser I, Kornhuber J, Wiltfang J, Dichgans M, Frolich L, Hampel H, Hull M, Rujescu D, Goate AM, Kauwe JS, Cruchaga C, Nowotny P, Morris JC, Mayo K, Sleegers K, Bettens K, Engelborghs S, De Deyn PP, Van Broeckhoven C, Livingston G, Bass NJ, Gurling H, McQuillin A, Gwilliam R, Deloukas P, Al-Chalabi A, Shaw CE, Tsolaki M, Singleton AB, Guerreiro R, Muhleisen TW, Nothen MM, Moebus S, Jockel KH, Klopp N, Wichmann HE, Carrasquillo MM, Pankratz VS, Younkin SG, Holmans PA, O’Donovan M, Owen MJ, Williams J(2009) Genome-wide association study identifies variants at CLU and PICALM associated with Alzheimer’s diseaseNat Genet41: 10881093 |
5 | Lambert JC, Heath S, Even G, Campion D, Sleegers K, Hiltunen M, Combarros O, Zelenika D, Bullido MJ, Tavernier B, Letenneur L, Bettens K, Berr C, Pasquier F, Fievet N, Barberger-Gateau P, Engelborghs S, De Deyn P, Mateo I, Franck A, Helisalmi S, Porcellini E, Hanon O, de Pancorbo MM, Lendon C, Dufouil C, Jaillard C, Leveillard T, Alvarez V, Bosco P, Mancuso M, Panza F, Nacmias B, Bossu P, Piccardi P, Annoni G, Seripa D, Galimberti D, Hannequin D, Licastro F, Soininen H, Ritchie K, Blanche H, Dartigues JF, Tzourio C, Gut I, Van Broeckhoven C, Alperovitch A, Lathrop M, Amouyel P(2009) Genome-wide association study identifies variants at CLU and CR1 associated with Alzheimer’s diseaseNat Genet41: 10941099 |
6 | Hollingworth P, Harold D, Sims R, Gerrish A, Lambert JC, Carrasquillo MM, Abraham R, Hamshere ML, Pahwa JS, Moskvina V, Dowzell K, Jones N, Stretton A, Thomas C, Richards A, Ivanov D, Widdowson C, Chapman J, Lovestone S, Powell J, Proitsi P, Lupton MK, Brayne C, Rubinsztein DC, Gill M, Lawlor B, Lynch A, Brown KS, Passmore PA, Craig D, McGuinness B, Todd S, Holmes C, Mann D, Smith AD, Beaumont H, Warden D, Wilcock G, Love S, Kehoe PG, Hooper NM, Vardy ER, Hardy J, Mead S, Fox NC, Rossor M, Collinge J, Maier W, Jessen F, Ruther E, Schurmann B, Heun R, Kolsch H, van den Bussche H, Heuser I, Kornhuber J, Wiltfang J, Dichgans M, Frolich L, Hampel H, Gallacher J, Hull M, Rujescu D, Giegling I, Goate AM, Kauwe JS, Cruchaga C, Nowotny P, Morris JC, Mayo K, Sleegers K, Bettens K, Engelborghs S, De Deyn PP, Van Broeckhoven C, Livingston G, Bass NJ, Gurling H, McQuillin A, Gwilliam R, Deloukas P, Al-Chalabi A, Shaw CE, Tsolaki M, Singleton AB, Guerreiro R, Muhleisen TW, Nothen MM, Moebus S, Jockel KH, Klopp N, Wichmann HE, Pankratz VS, Sando SB, Aasly JO, Barcikowska M, Wszolek ZK, Dickson DW, Graff-Radford NR, Petersen RC, van Duijn CM, Breteler MM, Ikram MA, DeStefano AL, Fitzpatrick AL, Lopez O, Launer LJ, Seshadri S, Berr C, Campion D, Epelbaum J, Dartigues JF, Tzourio C, Alperovitch A, Lathrop M, Feulner TM, Friedrich P, Riehle C, Krawczak M, Schreiber S, Mayhaus M, Nicolhaus S, Wagenpfeil S, Steinberg S, Stefansson H, Stefansson K, Snaedal J, Bjornsson S, Jonsson PV, Chouraki V, Genier-Boley B, Hiltunen M, Soininen H, Combarros O, Zelenika D, Delepine M, Bullido MJ, Pasquier F, Mateo I, Frank-Garcia A, Porcellini E, Hanon O, Coto E, Alvarez V, Bosco P, Siciliano G, Mancuso M, Panza F, Solfrizzi V, Nacmias B, Sorbi S, Bossu P, Piccardi P, Arosio B, Annoni G, Seripa D, Pilotto A, Scarpini E, Galimberti D, Brice A, Hannequin D, Licastro F, Jones L, Holmans PA, Jonsson T, Riemenschneider M, Morgan K, Younkin SG, Owen MJ, O’Donovan M, Amouyel P, Williams J(2011) Common variants at ABCA7, MS4A6A/MS4A4E, EPHA1, CD33 and CD2AP are associated with Alzheimer’s diseaseNat Genet43: 429435 |
7 | Naj AC, Jun G, Beecham GW, Wang LS, Vardarajan BN, Buros J, Gallins PJ, Buxbaum JD, Jarvik GP, Crane PK, Larson EB, Bird TD, Boeve BF, Graff-Radford NR, De Jager PL, Evans D, Schneider JA, Carrasquillo MM, Ertekin-Taner N, Younkin SG, Cruchaga C, Kauwe JS, Nowotny P, Kramer P, Hardy J, Huentelman MJ, Myers AJ, Barmada MM, Demirci FY, Baldwin CT, Green RC, Rogaeva E, St George-Hyslop P, Arnold SE, Barber R, Beach T, Bigio EH, Bowen JD, Boxer A, Burke JR, Cairns NJ, Carlson CS, Carney RM, Carroll SL, Chui HC, Clark DG, Corneveaux J, Cotman CW, Cummings JL, DeCarli C, DeKosky ST, Diaz-Arrastia R, Dick M, Dickson DW, Ellis WG, Faber KM, Fallon KB, Farlow MR, Ferris S, Frosch MP, Galasko DR, Ganguli M, Gearing M, Geschwind DH, Ghetti B, Gilbert JR, Gilman S, Giordani B, Glass JD, Growdon JH, Hamilton RL, Harrell LE, Head E, Honig LS, Hulette CM, Hyman BT, Jicha GA, Jin LW, Johnson N, Karlawish J, Karydas A, Kaye JA, Kim R, Koo EH, Kowall NW, Lah JJ, Levey AI, Lieberman AP, Lopez OL, Mack WJ, Marson DC, Martiniuk F, Mash DC, Masliah E, McCormick WC, McCurry SM, McDavid AN, McKee AC, Mesulam M, Miller BL, Miller CA, Miller JW, Parisi JE, Perl DP, Peskind E, Petersen RC, Poon WW, Quinn JF, Rajbhandary RA, Raskind M, Reisberg B, Ringman JM, Roberson ED, Rosenberg RN, Sano M, Schneider LS, Seeley W, Shelanski ML, Slifer MA, Smith CD, Sonnen JA, Spina S, Stern RA, Tanzi RE, Trojanowski JQ, Troncoso JC, Van Deerlin VM, Vinters HV, Vonsattel JP, Weintraub S, Welsh-Bohmer KA, Williamson J, Woltjer RL, Cantwell LB, Dombroski BA, Beekly D, Lunetta KL, Martin ER, Kamboh MI, Saykin AJ, Reiman EM, Bennett DA, Morris JC, Montine TJ, Goate AM, Blacker D, Tsuang DW, Hakonarson H, Kukull WA, Foroud TM, Haines JL, Mayeux R, Pericak-Vance MA, Farrer LA, Schellenberg GD(2011) Common variants at MS4A4/MS4A6E, CD2AP, CD33 and EPHA1 are associated with late-onset Alzheimer’s diseaseNat Genet43: 436441 |
8 | Lambert JC, Ibrahim-Verbaas CA, Harold D, Naj AC, Sims R, Bellenguez C, DeStafano AL, Bis JC, Beecham GW, Grenier-Boley B, Russo G, Thorton-Wells TA, Jones N, Smith AV, Chouraki V, Thomas C, Ikram MA, Zelenika D, Vardarajan BN, Kamatani Y, Lin CF, Gerrish A, Schmidt H, Kunkle B, Dunstan ML, Ruiz A, Bihoreau MT, Choi SH, Reitz C, Pasquier F, Cruchaga C, Craig D, Amin N, Berr C, Lopez OL, De Jager PL, Deramecourt V, Johnston JA, Evans D, Lovestone S, Letenneur L, Moron FJ, Rubinsztein DC, Eiriksdottir G, Sleegers K, Goate AM, Fievet N, Huentelman MW, Gill M, Brown K, Kamboh MI, Keller L, Barberger-Gateau P, McGuiness B, Larson EB, Green R, Myers AJ, Dufouil C, Todd S, Wallon D, Love S, Rogaeva E, Gallacher J, St George-Hyslop P, Clarimon J, Lleo A, Bayer A, Tsuang DW, Yu L, Tsolaki M, Bossu P, Spalletta G, Proitsi P, Collinge J, Sorbi S, Sanchez-Garcia F, Fox NC, Hardy J, Deniz Naranjo MC, Bosco P, Clarke R, Brayne C, Galimberti D, Mancuso M, Matthews F, Moebus S, Mecocci P, Del Zompo M, Maier W, Hampel H, Pilotto A, Bullido M, Panza F, Caffarra P, Nacmias B, Gilbert JR, Mayhaus M, Lannefelt L, Hakonarson H, Pichler S, Carrasquillo MM, Ingelsson M, Beekly D, Alvarez V, Zou F, Valladares O, Younkin SG, Coto E, Hamilton-Nelson KL, Gu W, Razquin C, Pastor P, Mateo I, Owen MJ, Faber KM, Jonsson PV, Combarros O, O’Donovan MC, Cantwell LB, Soininen H, Blacker D, Mead S, Mosley THJr, Bennett DA, Harris TB, Fratiglioni L, Holmes C, de Bruijn RF, Passmore P, Montine TJ, Bettens K, Rotter JI, Brice A, Morgan K, Foroud TM, Kukull WA, Hannequin D, Powell JF, Nalls MA, Ritchie K, Lunetta KL, Kauwe JS, Boerwinkle E, Riemenschneider M, Boada M, Hiltuenen M, Martin ER, Schmidt R, Rujescu D, Wang LS, Dartigues JF, Mayeux R, Tzourio C, Hofman A, Nothen MM, Graff C, Psaty BM, Jones L, Haines JL, Holmans PA, Lathrop M, Pericak-Vance MA, Launer LJ, Farrer LA, van Duijn CM, Van Broeckhoven C, Moskvina V, Seshadri S, Williams J, Schellenberg GD, Amouyel P(2013) Meta-analysis of 74,046 individuals identifies 11 new susceptibility loci for Alzheimer’s diseaseNat Genet45: 14521458 |
9 | Daniilidou M, Koutroumani M, Tsolaki M(2011) Epigenetic mechanisms in Alzheimer’s diseaseCurr Med Chem18: 17511756 |
10 | Cooper-Knock J, Kirby J, Ferraiuolo L, Heath PR, Rattray M, Shaw PJ(2012) Gene expression profiling in human neurodegenerative diseaseNat Rev Neurol8: 518530 |
11 | Handel AE, Disanto G, Ramagopalan SV(2013) Next-generation sequencing in understanding complex neurological diseaseExpert Rev Neurother13: 215227 |
12 | Ozsolak F, Milos PM(2011) RNA sequencing: Advances, challenges and opportunitiesNat Rev Genet12: 8798 |
13 | Sutherland GT, Janitz M, Kril JJ(2011) Understanding the pathogenesis of Alzheimer’s disease: Will RNA-Seq realize the promise of transcriptomics?J Neurochem116: 937946 |
14 | Faghihi MA, Modarresi F, Khalil AM, Wood DE, Sahagan BG, Morgan TE, Finch CE, St Laurent G3rd, Kenny PJ, Wahlestedt C(2008) Expression of a noncoding RNA is elevated in Alzheimer’s disease and drives rapid feed-forward regulation of beta-secretaseNat Med14: 723730 |
15 | Mirra SS, Heyman A, McKeel D, Sumi SM, Crain BJ, Brownlee LM, Vogel FS, Hughes JP, van Belle G, Berg L(1991) The Consortium to Establish a Registry for Alzheimer’s Disease (CERAD). Part II. Standardization of the neuropathologic assessment of Alzheimer’s diseaseNeurology41: 479486 |
16 | Braak H, Braak E(1991) Demonstration of amyloid deposits and neurofibrillary changes in whole brain sectionsBrain Pathol1: 213216 |
17 | (1997) Consensus recommendations for the postmortem diagnosis of Alzheimer’s disease. The National Institute on Aging, and Reagan Institute Working Group on Diagnostic Criteria for the Neuropathological Assessment of Alzheimer’s DiseaseNeurobiol Aging18: S1S2 |
18 | Hong F, Breitling R, McEntee CW, Wittner BS, Nemhauser JL, Chory J(2006) RankProd: A bioconductor package for detecting differentially expressed genes in meta-analysisBioinformatics22: 28252827 |
19 | McCarthy M, Vidaurre I, Geffin R(2006) Maturing neurons are selectively sensitive to human immunodeficiency virus type 1 exposure in differentiating human neuroepithelial progenitor cell culturesJ Neurovirol12: 333348 |
20 | Trapnell C, Pachter L, Salzberg SL(2009) TopHat: Discovering splice junctions with RNA-SeqBioinformatics25: 11051111 |
21 | Trapnell C, Williams BA, Pertea G, Mortazavi A, Kwan G, van Baren MJ, Salzberg SL, Wold BJ, Pachter L(2010) Transcript assembly and quantification by RNA-Seq reveals unannotated transcripts and isoform switching during cell differentiationNat Biotechnol28: 511515 |
22 | Trapnell C, Roberts A, Goff L, Pertea G, Kim D, Kelley DR, Pimentel H, Salzberg SL, Rinn JL, Pachter L(2012) Differential gene and transcript expression analysis of RNA-seq experiments with TopHat and CufflinksNat Protoc7: 562578 |
23 | Wang L, Park HJ, Dasari S, Wang S, Kocher JP, Li W(2013) CPAT: Coding-Potential Assessment Tool using an alignment-free logistic regression modelNucleic Acids Res41: e74 |
24 | Edgar R, Domrachev M, Lash AE(2002) Gene Expression Omnibus: NCBI gene expression and hybridization array data repositoryNucleic Acids Res30: 207210 |
25 | Barrett T, Wilhite SE, Ledoux P, Evangelista C, Kim IF, Tomashevsky M, Marshall KA, Phillippy KH, Sherman PM, Holko M, Yefanov A, Lee H, Zhang N, Robertson CL, Serova N, Davis S, Soboleva A(2013) NCBI GEO: Archive for functional genomics data sets–updateNucleic Acids Res41: D991D995 |
26 | Breitling R, Armengaud P, Amtmann A, Herzyk P(2004) Rank products: A simple, yet powerful, new method to detect differentially regulated genes in replicated microarray experimentsFEBS Lett573: 8392 |
27 | Willis M, Hutter-Paier B, Wietzorrek G, Windisch M, Humpel C, Knaus HG, Marksteiner J(2007) Localization and expression of substance P in transgenic mice overexpressing human APP751 with the London (V717I) and Swedish (K670M/N671L) mutationsBrain Res1143: 199207 |
28 | Beal MF, Mazurek MF(1987) Substance P-like immunoreactivity is reduced in Alzheimer’s disease cerebral cortexNeurology37: 12051209 |
29 | Melchor JP, Pawlak R, Strickland S(2003) The tissue plasminogen activator-plasminogen proteolytic cascade accelerates amyloid-beta (Abeta) degradation and inhibits Abeta-induced neurodegenerationJ Neurosci23: 88678871 |
30 | Oh J, Lee HJ, Song JH, Park SI, Kim H(2014) Plasminogen activator inhibitor-1 as an early potential diagnostic marker for Alzheimer’s diseaseExp Gerontol60: 8791 |
31 | Zhao J, Pei G(2008) Evoking plasmin for beta-amyloid clearanceCell Res18: 803804 |
32 | Magistri M, Faghihi MA, St Laurent G3rd, Wahlestedt C(2012) Regulation of chromatin structure by long noncoding RNAs: Focus on natural antisense transcriptsTrends Genet28: 389396 |
33 | Faghihi MA, Wahlestedt C(2009) Regulatory roles of natural antisense transcriptsNat Rev Mol Cell Biol10: 637643 |
34 | Pastori C, Magistri M, Napoli S, Carbone GM, Catapano CV(2010) Small RNA-directed transcriptional control: New insights into mechanisms and therapeutic applicationsCell Cycle9: 23532362 |
35 | Velmeshev D, Magistri M, Faghihi MA(2013) Expression of non-protein-coding antisense RNAs in genomic regions related to autism spectrum disordersMol Autism4: 32 |
36 | Guttman M, Amit I, Garber M, French C, Lin MF, Feldser D, Huarte M, Zuk O, Carey BW, Cassady JP, Cabili MN, Jaenisch R, Mikkelsen TS, Jacks T, Hacohen N, Bernstein BE, Kellis M, Regev A, Rinn JL, Lander ES(2009) Chromatin signature reveals over a thousand highly conserved large non-coding RNAs in mammalsNature458: 223227 |
37 | Khalil AM, Guttman M, Huarte M, Garber M, Raj A, Rivea Morales D, Thomas K, Presser A, Bernstein BE, van Oudenaarden A, Regev A, Lander ES, Rinn JL(2009) Many human large intergenic noncoding RNAs associate with chromatin-modifying complexes and affect gene expressionProc Natl Acad Sci U S A106: 1166711672 |
38 | Wang KC, Chang HY(2011) Molecular mechanisms of long noncoding RNAsMol Cell43: 904914 |
39 | Lai F, Orom UA, Cesaroni M, Beringer M, Taatjes DJ, Blobel GA, Shiekhattar R(2013) Activating RNAs associate with Mediator to enhance chromatin architecture and transcriptionNature494: 497501 |
40 | Orom UA, Derrien T, Beringer M, Gumireddy K, Gardini A, Bussotti G, Lai F, Zytnicki M, Notredame C, Huang Q, Guigo R, Shiekhattar R(2010) Long noncoding RNAs with enhancer-like function in human cellsCell143: 4658 |
41 | Li W, Notani D, Ma Q, Tanasa B, Nunez E, Chen AY, Merkurjev D, Zhang J, Ohgi K, Song X, Oh S, Kim HS, Glass CK, Rosenfeld MG(2013) Functional roles of enhancer RNAs for oestrogen-dependent transcriptional activationNature498: 516520 |
42 | Tsai MC, Manor O, Wan Y, Mosammaparast N, Wang JK, Lan F, Shi Y, Segal E, Chang HY(2010) Long noncoding RNA as modular scaffold of histone modification complexesScience329: 689693 |
43 | Guttman M, Donaghey J, Carey BW, Garber M, Grenier JK, Munson G, Young G, Lucas AB, Ach R, Bruhn L, Yang X, Amit I, Meissner A, Regev A, Rinn JL, Root DE, Lander ES(2011) lincRNAs act in the circuitry controlling pluripotency and differentiationNature477: 295300 |
44 | Di Ruscio A, Ebralidze AK, Benoukraf T, Amabile G, Goff LA, Terragni J, Figueroa ME, De Figueiredo Pontes LL, Alberich-Jorda M, Zhang P, Wu M, D’Alo F, Melnick A, Leone G, Ebralidze KK, Pradhan S, Rinn JL, Tenen DG(2013) DNMT1-interacting RNAs block gene-specific DNA methylationNature503: 371376 |
45 | Barry G, Briggs JA, Vanichkina DP, Poth EM, Beveridge NJ, Ratnu VS, Nayler SP, Nones K, Hu J, Bredy TW, Nakagawa S, Rigo F, Taft RJ, Cairns MJ, Blackshaw S, Wolvetang EJ, Mattick JS(2013) The long non-coding RNA Gomafu is acutely regulated in response to neuronal activation and involved in schizophrenia-associated alternative splicingMol Psychiatry19: 486494 |
46 | Kim TK, Hemberg M, Gray JM, Costa AM, Bear DM, Wu J, Harmin DA, Laptewicz M, Barbara-Haley K, Kuersten S, Markenscoff-Papadimitriou E, Kuhl D, Bito H, Worley PF, Kreiman G, Greenberg ME(2010) Widespread transcription at neuronal activity-regulated enhancersNature465: 182187 |
47 | Gritti A, Parati EA, Cova L, Frolichsthal P, Galli R, Wanke E, Faravelli L, Morassutti DJ, Roisen F, Nickel DD, Vescovi AL(1996) Multipotential stem cells from the adult mouse brain proliferate and self-renew in response to basic fibroblast growth factorJ Neurosci16: 10911100 |
48 | Tropepe V, Sibilia M, Ciruna BG, Rossant J, Wagner EF, van der Kooy D(1999) Distinct neural stem cells proliferate in response to EGF and FGF in the developing mouse telencephalonDev Biol208: 166188 |
49 | Han P, Li W, Lin CH, Yang J, Shang C, Nurnberg ST, Jin KK, Xu W, Lin CY, Lin CJ, Xiong Y, Chien HC, Zhou B, Ashley E, Bernstein D, Chen PS, Chen HS, Quertermous T, Chang CP(2014) A long noncoding RNA protects the heart from pathological hypertrophyNature514: 102106 |
50 | Lakhotia SC(2012) Long non-coding RNAs coordinate cellular responses to stressWiley Interdiscip Rev RNA3: 779796 |
51 | Ozgur E, Mert U, Isin M, Okutan M, Dalay N, Gezer U(2013) Differential expression of long non-coding RNAs during genotoxic stress-induced apoptosis in HeLa and MCF-7 cellsClin Exp Med13: 119126 |
52 | Massone S, Ciarlo E, Vella S, Nizzari M, Florio T, Russo C, Cancedda R, Pagano A(2012) NDM29, a RNA polymerase III-dependent non coding RNA, promotes amyloidogenic processing of APP and amyloid beta secretionBiochim Biophys Acta1823: 11701177 |
53 | Liu T, Huang Y, Chen J, Chi H, Yu Z, Wang J, Chen C(2014) Attenuated ability of BACE1 to cleave the amyloid precursor protein via silencing long noncoding RNA BACE1AS expressionMol Med Rep10: 12751281 |
54 | Kang MJ, Abdelmohsen K, Hutchison ER, Mitchell SJ, Grammatikakis I, Guo R, Noh JH, Martindale JL, Yang X, Lee EK, Faghihi MA, Wahlestedt C, Troncoso JC, Pletnikova O, Perrone-Bizzozero N, Resnick SM, de Cabo R, Mattson MP, Gorospe M(2014) HuD regulates coding and noncoding RNA to induce APP–>Abeta processingCell Rep7: 14011409 |
55 | Gillardon F, Skutella T, Uhlmann E, Holsboer F, Zimmermann M, Behl C(1996) Activation of c-Fos contributes to amyloid beta-peptide-induced neurotoxicityBrain Res706: 169172 |
56 | Mastroeni D, Grover A, Delvaux E, Whiteside C, Coleman PD, Rogers J(2010) Epigenetic changes in Alzheimer’s disease: Decrements in DNA methylationNeurobiol Aging31: 20252037 |
57 | Lahiri DK, Maloney B(2010) The “LEARn” (Latent Early-life Associated Regulation) model integrates environmental risk factors and the developmental basis of Alzheimer’s disease, and proposes remedial stepsExp Gerontol45: 291296 |
58 | Wang SC, Oelze B, Schumacher A(2008) Age-specific epigenetic drift in late-onset Alzheimer’s diseasePLoS One3: e2698 |
59 | Zlokovic BV(2011) Neurovascular pathways to neurodegeneration in Alzheimer’s disease and other disordersNat Rev Neurosci12: 723738 |
60 | Sagare AP, Bell RD, Zlokovic BV(2013) Neurovascular defects and faulty amyloid-beta vascular clearance in Alzheimer’s diseaseJ Alzheimers Dis33: Suppl 1S87S100 |
61 | Zlokovic BV, Begley DJ, Chain-Eliash DG(1985) Blood-brain barrier permeability to leucine-enkephalin, D-alanine2-D-leucine5-enkephalin and their N-terminal amino acid (tyrosine)Brain Res336: 125132 |
62 | Zlokovic BV(1995) Cerebrovascular permeability to peptides: Manipulations of transport systems at the blood-brain barrierPharm Res12: 13951406 |
63 | Zlokovic BV, Lipovac MN, Begley DJ, Davson H, Rakic L(1987) Transport of leucine-enkephalin across the blood-brain barrier in the perfused guinea pig brainJ Neurochem49: 310315 |
64 | Marques F, Sousa JC, Sousa N, Palha JA(2013) Blood-brain-barriers in aging and in Alzheimer’s diseaseMol Neurodegener8: 38 |
65 | Kim JA, Tran ND, Li Z, Yang F, Zhou W, Fisher MJ(2006) Brain endothelial hemostasis regulation by pericytesJ Cereb Blood Flow Metab26: 209217 |
66 | Cesari M, Pahor M, Incalzi RA(2010) Plasminogen activator inhibitor-1 (PAI-1): A key factor linking fibrinolysis and age-related subclinical and clinical conditionsCardiovasc Ther28: e72e91 |
67 | de la Torre JC(2002) Alzheimer disease as a vascular disorder: Nosological evidenceStroke33: 11521162 |
68 | Liu RM, van Groen T, Katre A, Cao D, Kadisha I, Ballinger C, Wang L, Carroll SL, Li L(2011) Knockout of plasminogen activator inhibitor 1 gene reduces amyloid beta peptide burden in a mouse model of Alzheimer’s diseaseNeurobiol Aging32: 10791089 |
69 | Jacobsen JS, Comery TA, Martone RL, Elokdah H, Crandall DL, Oganesian A, Aschmies S, Kirksey Y, Gonzales C, Xu J, Zhou H, Atchison K, Wagner E, Zaleska MM, Das I, Arias RL, Bard J, Riddell D, Gardell SJ, Abou-Gharbia M, Robichaud A, Magolda R, Vlasuk GP, Bjornsson T, Reinhart PH, Pangalos MN(2008) Enhanced clearance of Abeta in brain by sustaining the plasmin proteolysis cascadeProc Natl Acad Sci U S A105: 87548759 |
70 | Melchor JP, Pawlak R, Strickland S(2003) The tissue plasminogen activator-plasminogen proteolytic cascade accelerates amyloid-beta (Abeta) degradation and inhibits Abeta-induced neurodegenerationJ Neurosci23: 88678871 |
71 | Mercer TR, Qureshi IA, Gokhan S, Dinger ME, Li G, Mattick JS, Mehler MF(2010) Long noncoding RNAs in neuronal-glial fate specification and oligodendrocyte lineage maturationBMC Neurosci11: 14 |
72 | Faghihi MA, Zhang M, Huang J, Modarresi F, Van der Brug MP, Nalls MA, Cookson MR, St-Laurent G3rd, Wahlestedt C(2010) Evidence for natural antisense transcript-mediated inhibition of microRNA functionGenome Biol11: R56 |
73 | Modarresi F, Faghihi MA, Patel NS, Sahagan BG, Wahlestedt C, Lopez-Toledano MA(2011) Knockdown of BACE1-AS nonprotein-coding transcript modulates beta-amyloid-related hippocampal neurogenesisInt J Alzheimers Dis2011: 929042 |
74 | Prensner JR, Iyer MK, Balbin OA, Dhanasekaran SM, Cao Q, Brenner JC, Laxman B, Asangani IA, Grasso CS, Kominsky HD, Cao X, Jing X, Wang X, Siddiqui J, Wei JT, Robinson D, Iyer HK, Palanisamy N, Maher CA, Chinnaiyan AM(2011) Transcriptome sequencing across a prostate cancer cohort identifies PCAT-1, an unannotated lincRNA implicated in disease progressionNat Biotechnol29: 742749 |
75 | Bero AW, Yan P, Roh JH, Cirrito JR, Stewart FR, Raichle ME, Lee JM, Holtzman DM(2011) Neuronal activity regulates the regional vulnerability to amyloid-beta depositionNat Neurosci14: 750756 |
Figures and Tables
Fig.1
RNAseq analysis. A) Schematic representation of the bioinformatics pipeline we used for RNAseq data analysis. This experimentally validated computational approach is suitable for the accurate measurement of gene expression and to discover and annotate novel RNA transcripts. B) Pie chart showing the number of annotated and non-annotated RNA transcripts expressed in at least one of the sequenced hippocampi RNA samples. C) qRT-PCR analysis of novel non-annotated lncRNAs identified by RNAseq. β-ACTIN was used as endogenous control to normalize gene expression analysis. On the Y axe is depicted the expression of the analyzed gene relative to the housekeeping gene β-ACTIN. Error bars are S.D. Hippo: Hippocampus, PFC: Prefrontal Cortex, Cere: Cerebellum. D) Heatmap showing log2(FPKM) values and hierarchical clustering analysis for differentially expressed genes in LOAD versus control hippocampi.
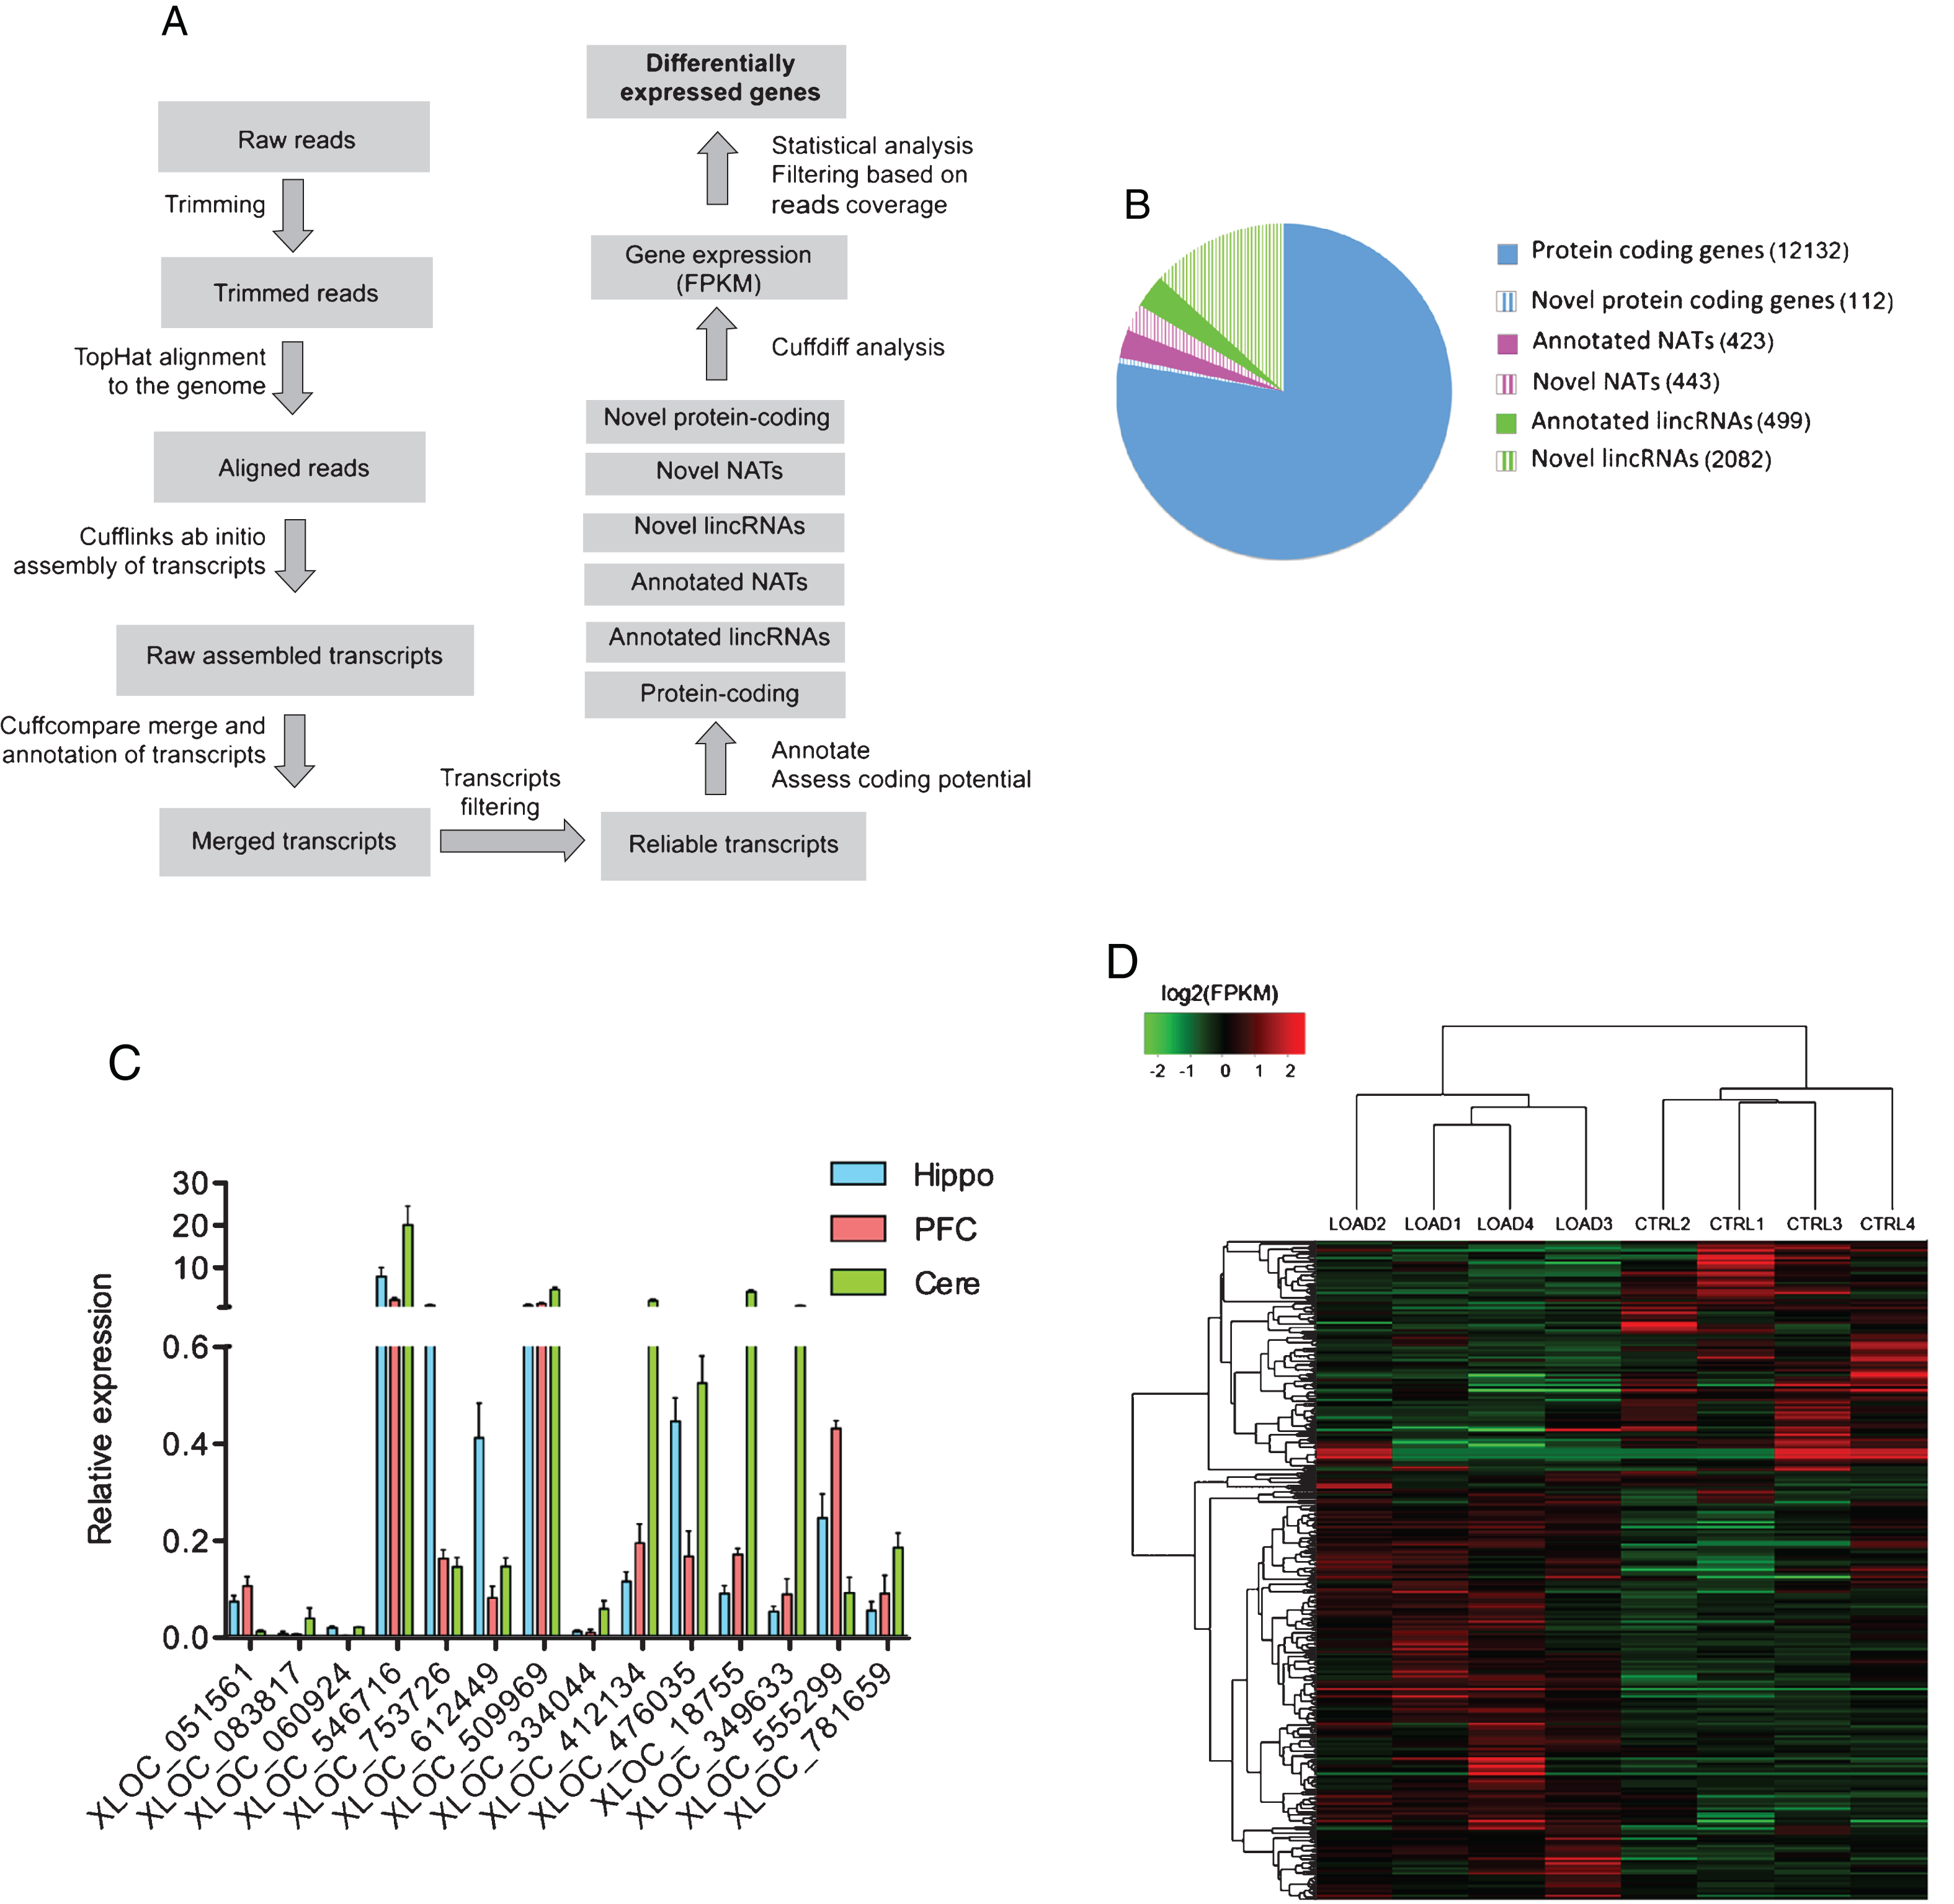
Fig.2
Differential expression analysis. A) Volcano plots revealing significant changes (Blue points; pfp < 0.1: minimum reads coverage of 20) in the expression of protein coding genes, antisense and lincRNAs in the hippocampi of AD patients (n = 4) compared to control (n = 4). B) Technical validation of RNAseq differential expression analysis using qRT-PCR showing high degree of correlation between log2 fold change differences from RNAseq and qRT-PCR data for 6 different protein coding genes, 6 lincRNAs and 6 AS RNA transcripts.
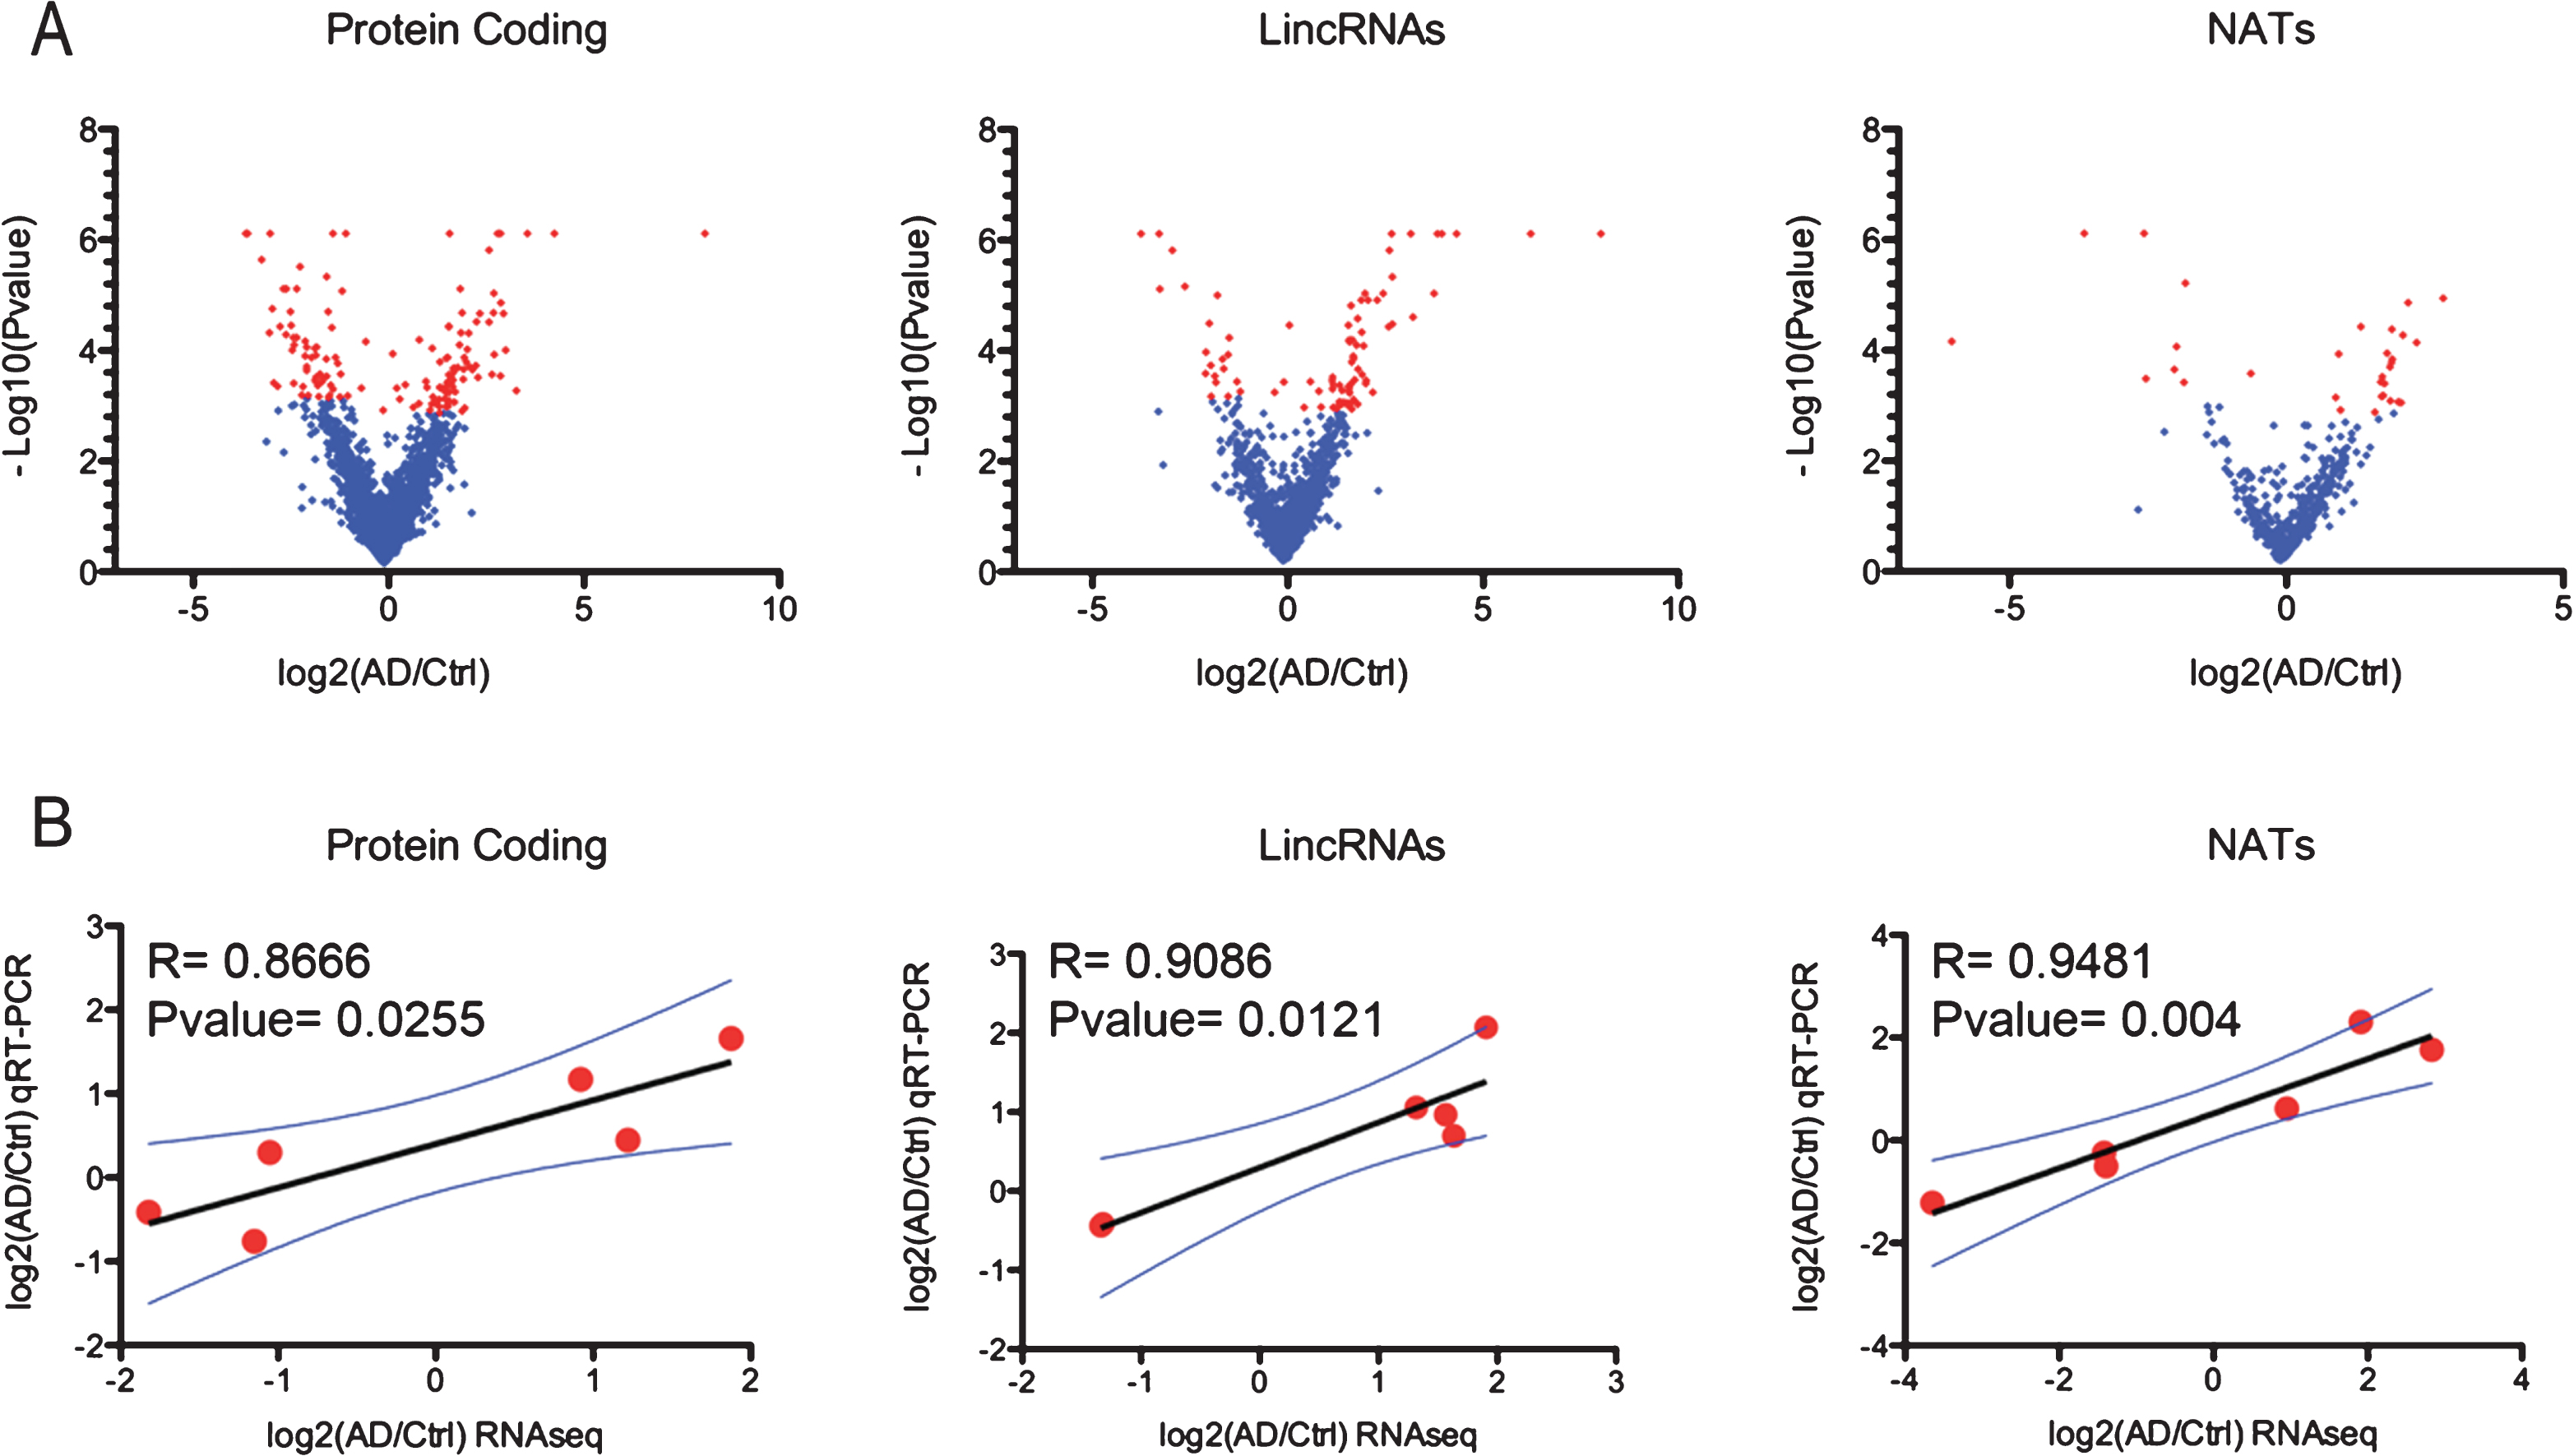
Fig.3
Dysregulation of protein-coding genes and pathways in LOAD. qRT-PCR expression analysis of TAC1 (A) and SERPINE1 (B) mRNA in postmortem brain tissues from four different regions of LOAD and age-matched control. Gene expression is normalized to CTRL. Cer = Cerebellum (24 patients, 20 controls), SFG = Superior frontal Gyrus (17 patients, 18 controls), Ectx = Entorhinal cortex (8 patients, 9 controls), Hipp = Hippocampus (12 patients, 10 controls). PGK1 was used as endogenous control to normalize gene expression analysis. Error bars are S.E.M.; *p < 0.05; **p < 0.01.
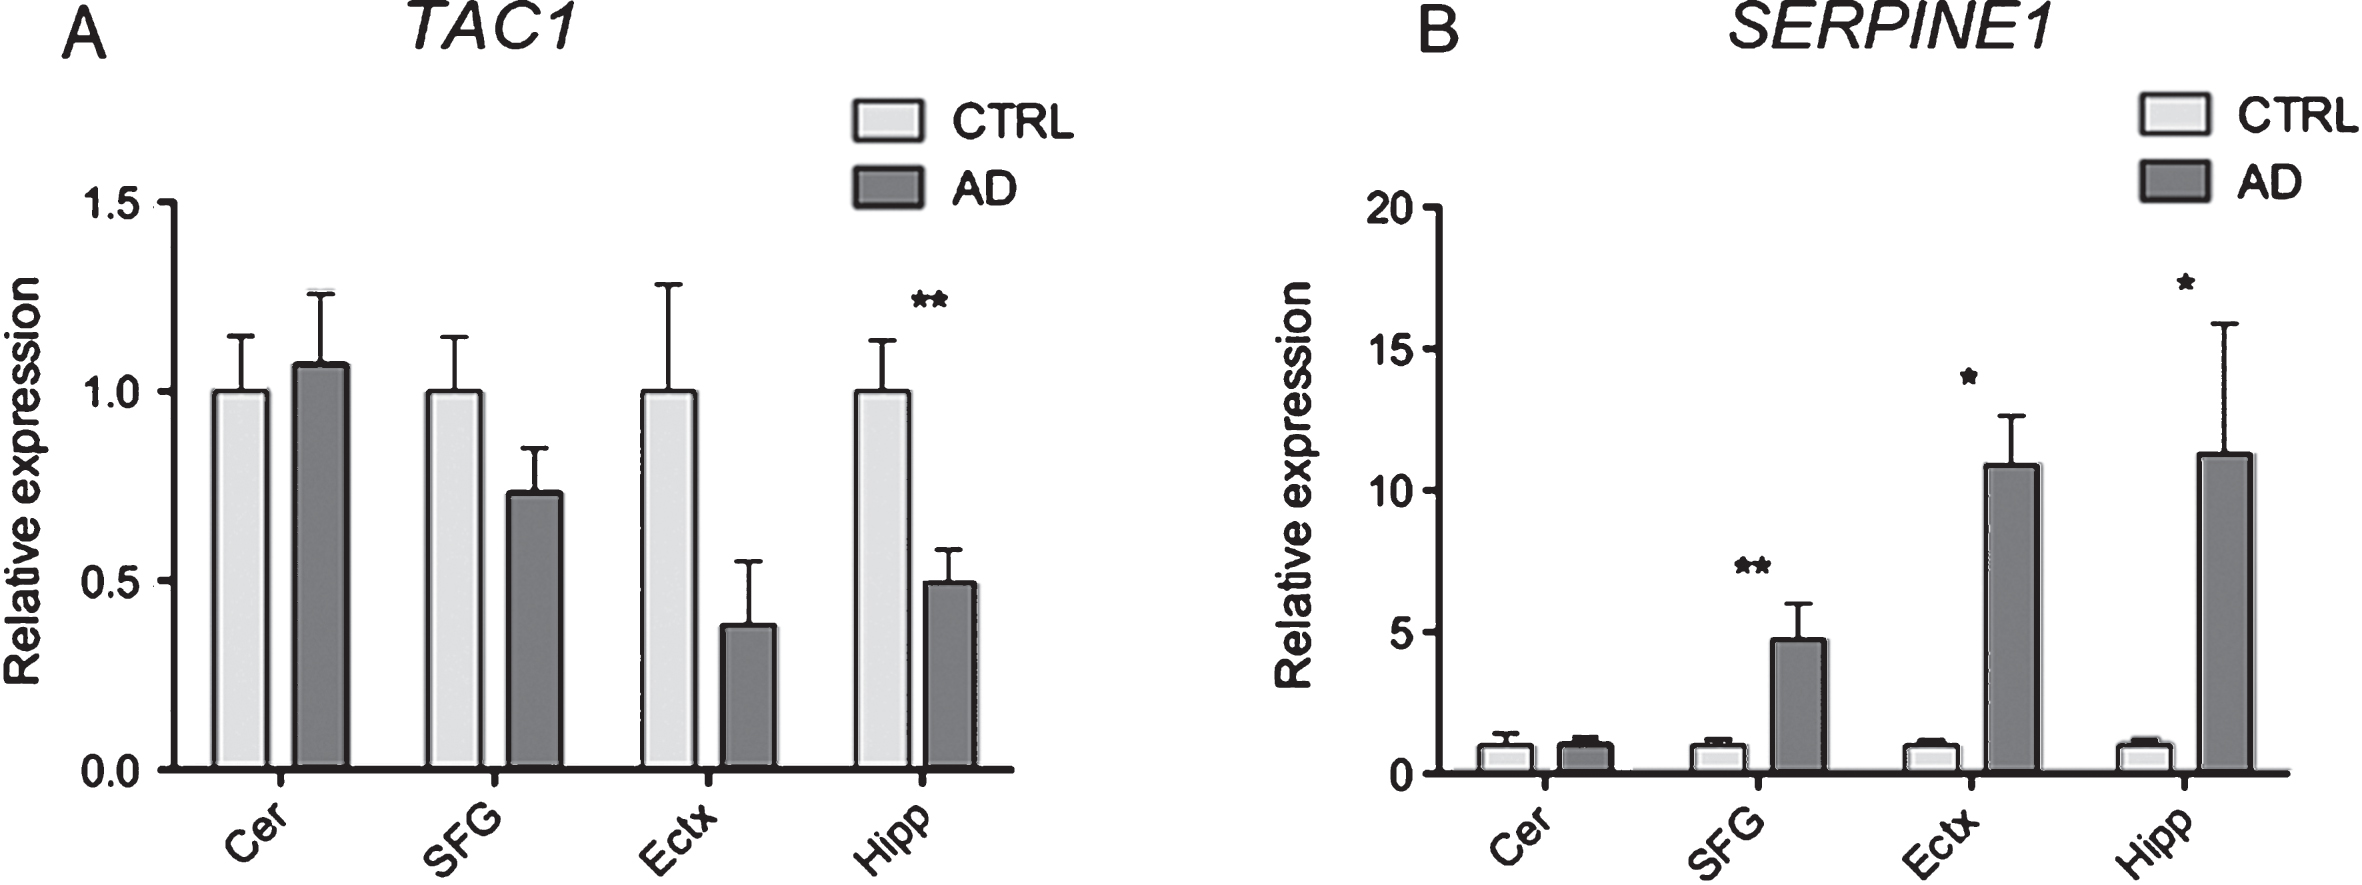
Fig.4
Dysregulation of natural antisense transcripts in LOAD. A) Schematic representation of the loci expressing the newly discovered antisense RNAs HAO2-AS and EBF3-AS (in black) and their overlapping protein coding genes (in blue). B) qRT-PCR analysis of HAO2-AS and EBF3-AS expression in commercially available RNA from different human tissues. On the Y axe is depicted the expression of the analyzed gene relative to the housekeeping gene β-ACTIN. C) qRT-PCR analysis of HAO2-AS and EBF3-AS expression in RNA extracted from hNSCs fractionated in different cellular compartments: cytosol (Cyto), nucleoplasm (Nuc) and chromatin (Chr). qRT-PCR expression analysis of HAO2-AS (D) andEBF3-AS (E) in postmortem brain tissues from four different regions of LOAD and age-matched control. Cer = Cerebellum (24 patients, 20 controls), SFG = Superior frontal Gyrus (17 patients, 18 controls), Ectx = Entorhinal cortex (8 patients, 9 controls), Hipp = Hippocampus (12 patients, 10 controls). On the Y axe is depicted the expression of the analyzed gene relative to the housekeeping gene ΠΓK1. Gene expression is normalized to CTRL. Error bars are S.E.M.; *p < 0.05; **p < 0.01.
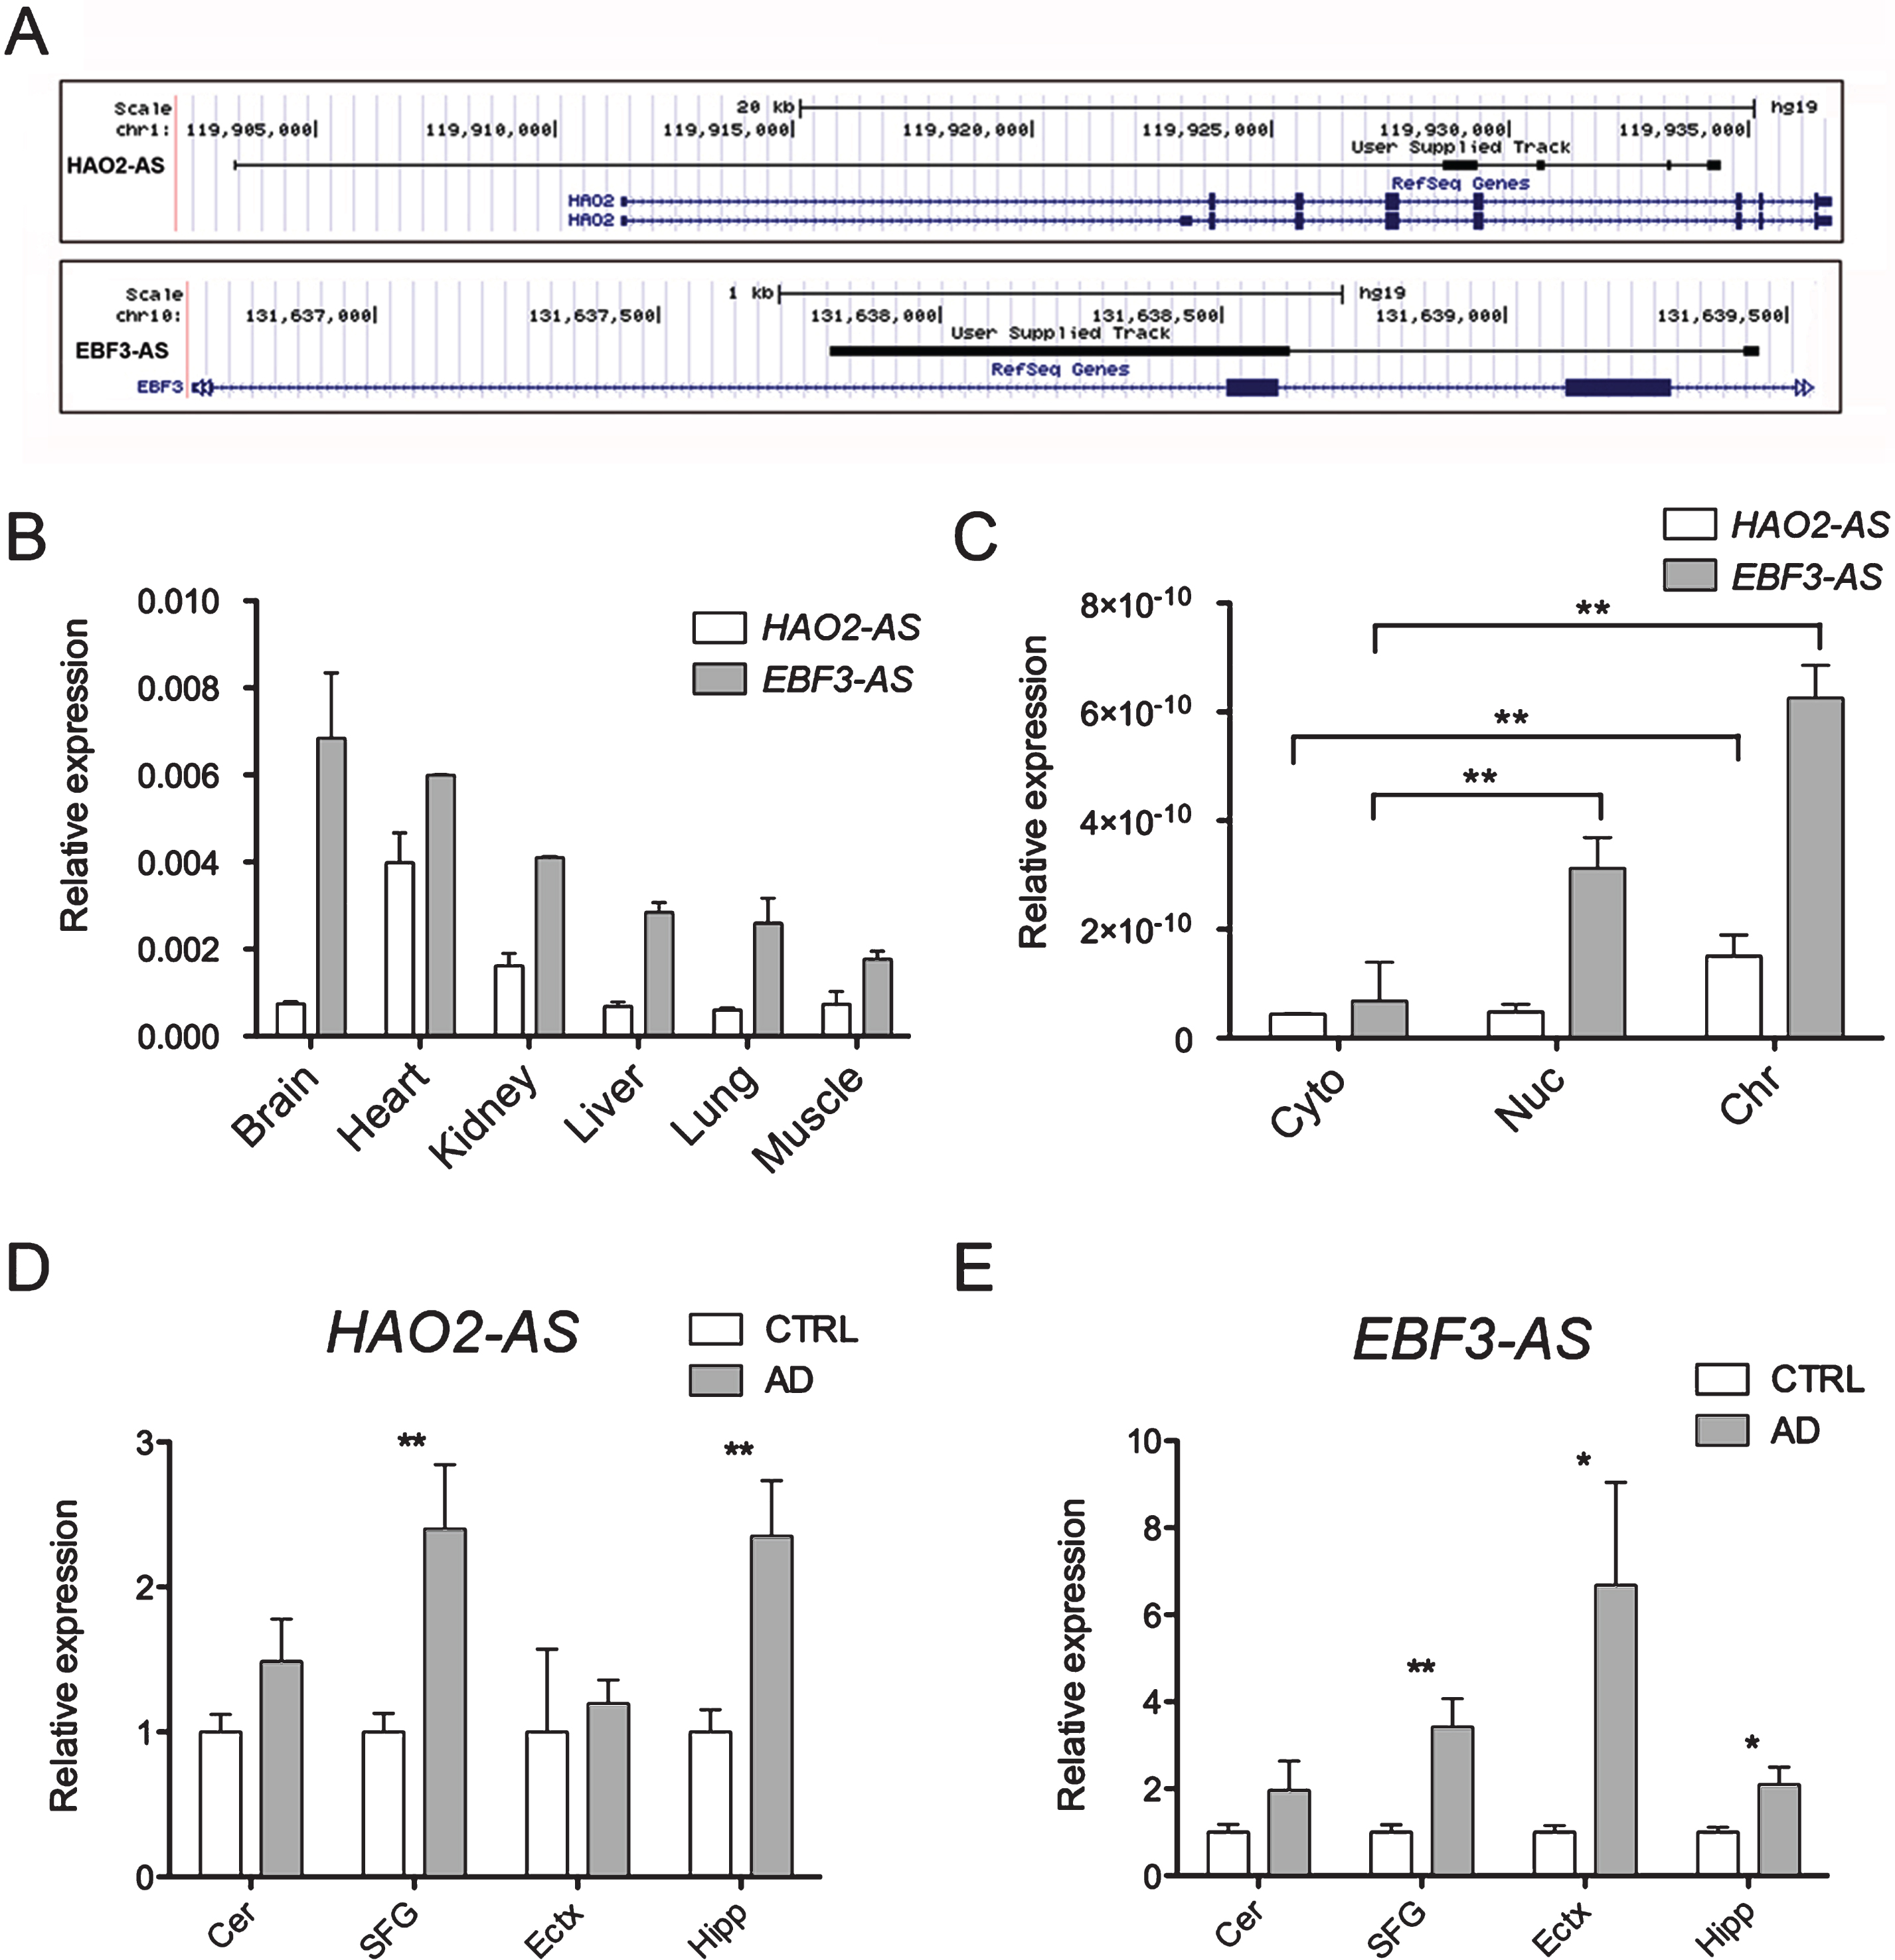
Fig.5
Dysregulation of long intergenic non-coding RNAs in LOAD. A) Schematic representation of the loci expressing the newly discovered lincRNAs AD-linc1 and AD-linc2 (in black). B) commercially available RNA from different human tissues. On the Y axe is depicted the expression of the analyzed gene relative to the housekeeping gene β-ACTIN. C) qRT-PCR analysis ofAD-linc1 and AD-linc2 expression in RNA extracted from hNSCs fractionated in different cellular compartments: cytosol (Cyto), nucleoplasm (Nuc) and chromatin (Chr). qRT-PCR expression analysis AD-linc1 (D) and AD-linc2 (E) in postmortem brain tissues from four different regions of LOAD and age-matched control. Cer = Cerebellum (24 patients, 20 controls), SFG = Superior frontal Gyrus (17 patients, 18 controls), Ectx = Entorhinal cortex (8 patients, 9 controls), Hipp = Hippocampus (12 patients, 10 controls). On the Y axe is depicted the expression of the analyzed gene relative to the housekeeping gene ΠΓK1. Gene expression is normalized to CTRL. Error bars are S.E.M.; *p < 0.05; **p < 0.01.
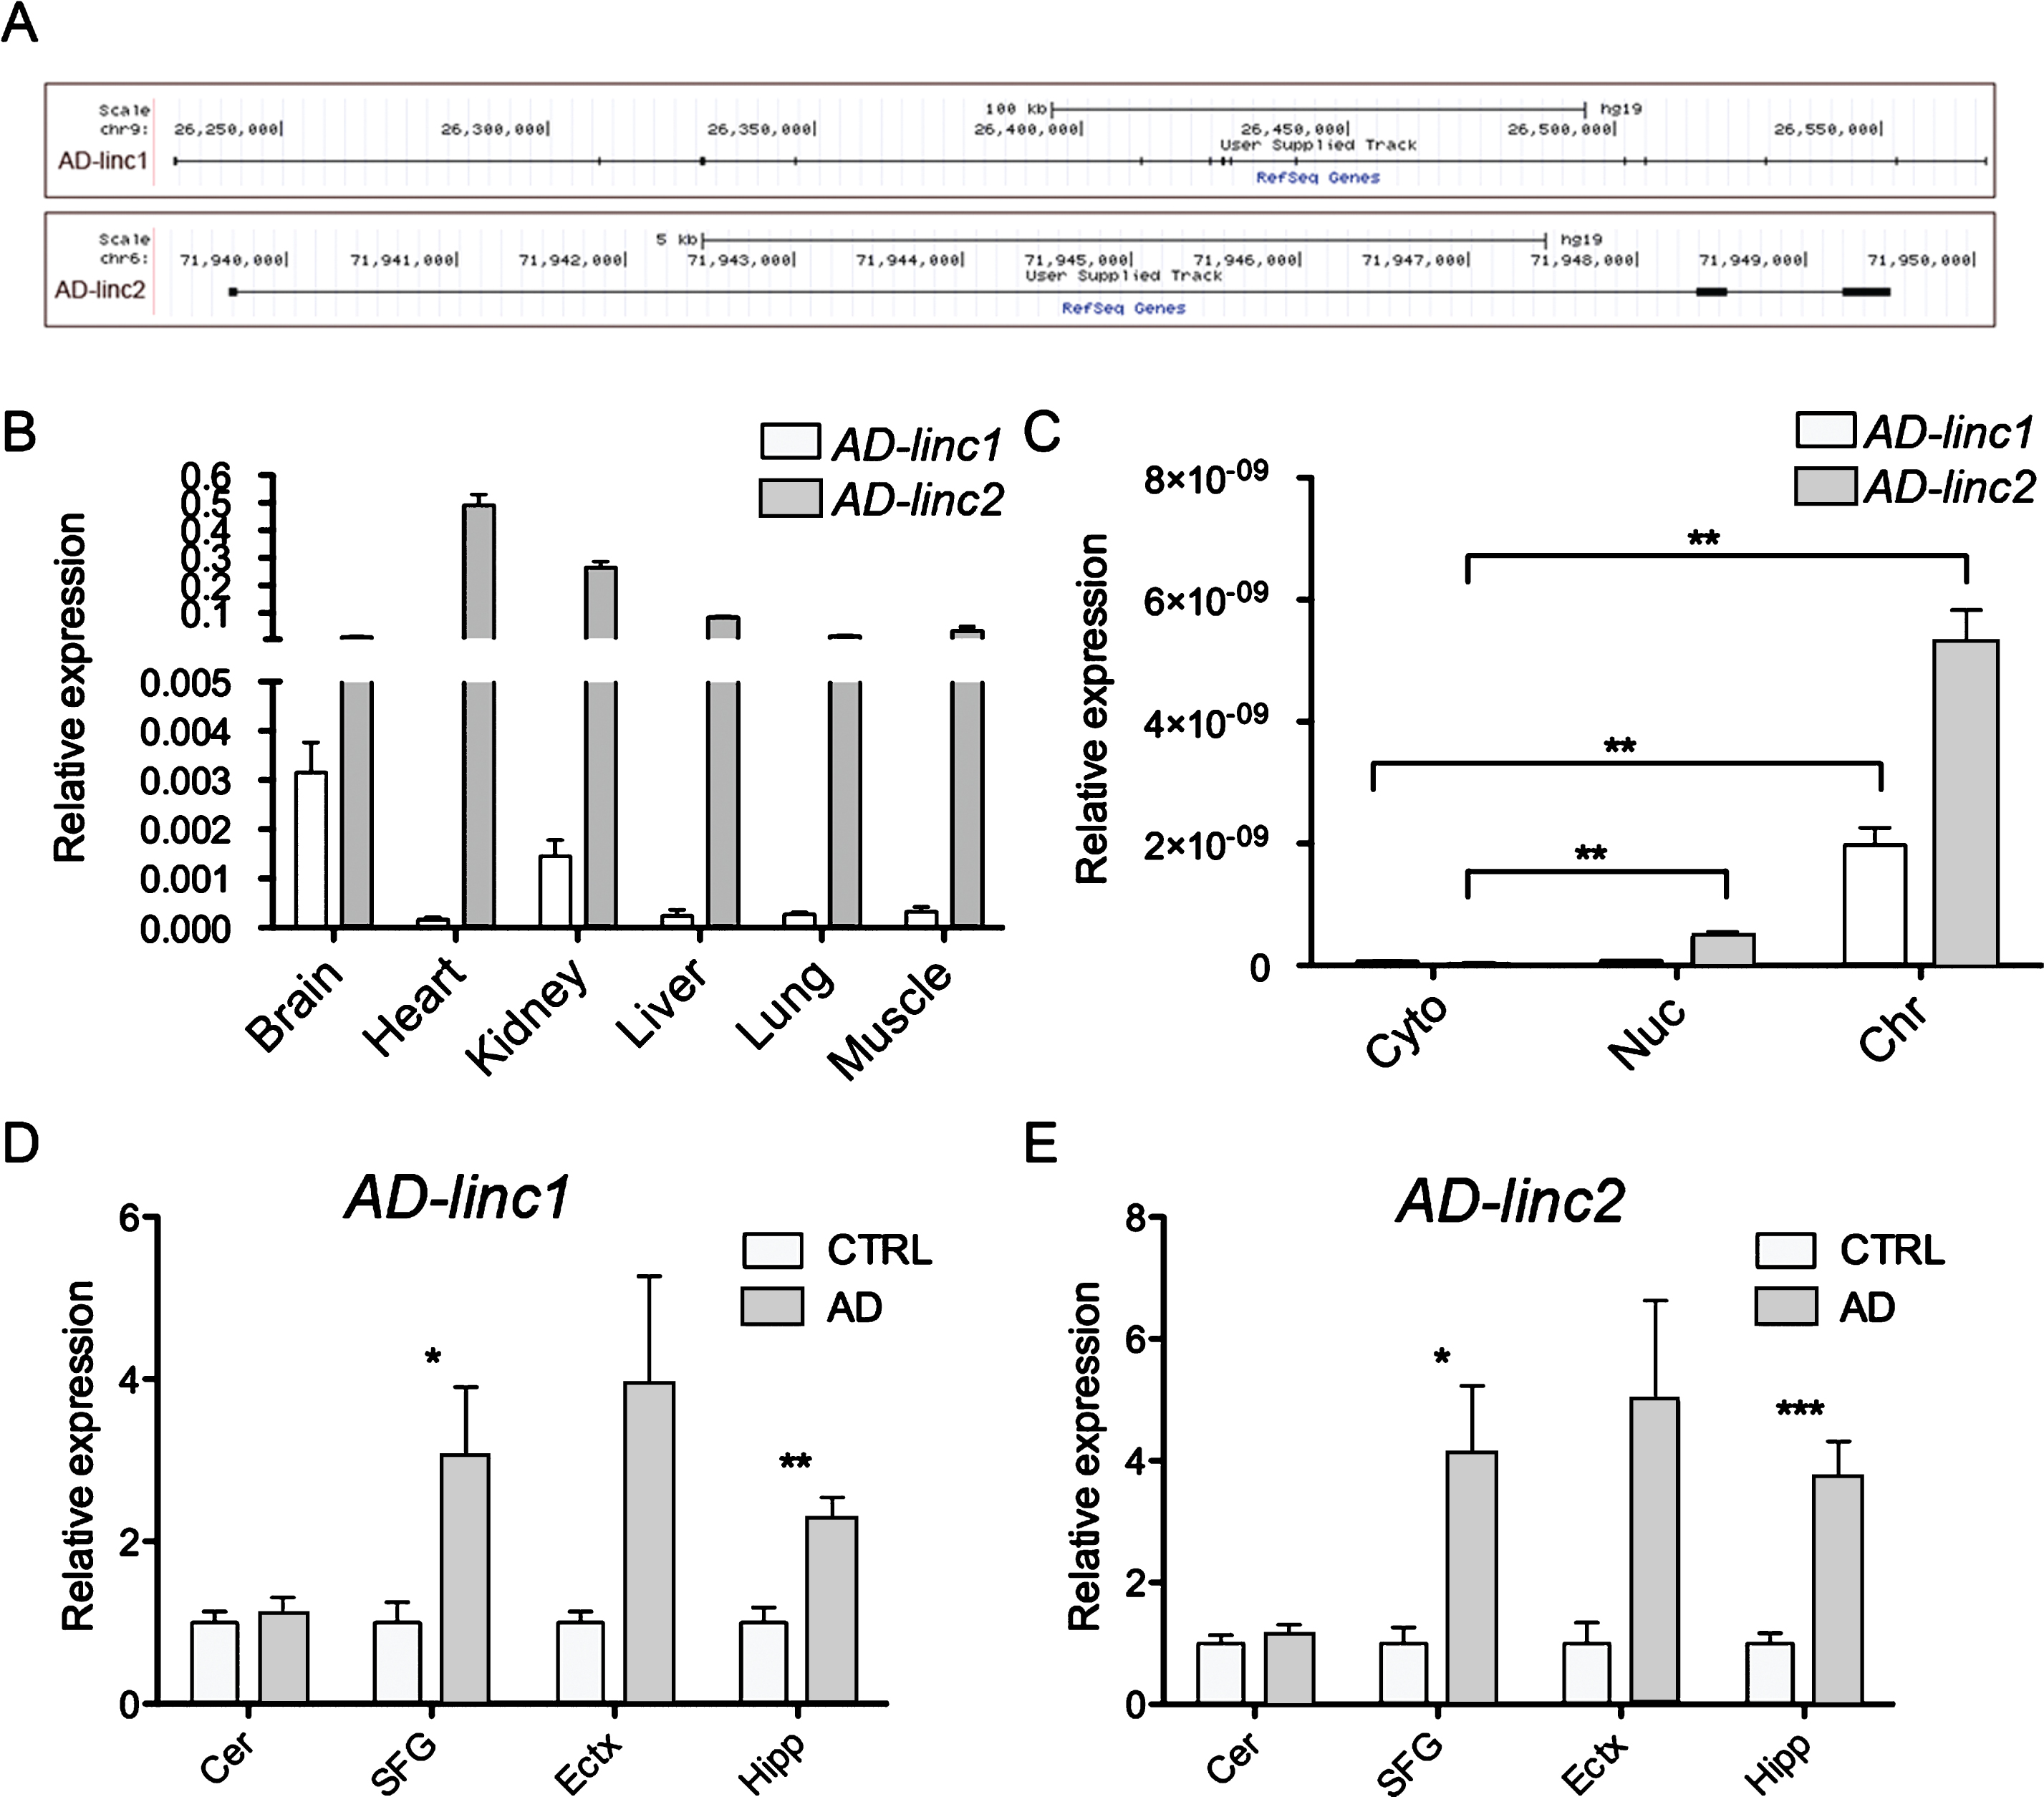
Fig.6
Altered lncRNAs are activity-dependent regulated and induced by Aβ. A) qRT-PCR showing the relative expression of glial (GFAP and S100β) and neuronal markers (DCX and NFH) and LOAD-dysregulated lncRNAs in commercially available RNA extracted from human neurons and human astrocytes. On the Y axe is depicted the expression of the analyzed gene relative to the housekeeping gene β-ACTIN. Gene expression is normalized to astrocytes. B, C) Immunostaining of human NSCs after 21 days of differentiation in vitro. hNSCs can be differentiated into a mixed population of neural cells. Neurons are stained with βIII-Tubulin (B) and MAP2 (C), while astrocytes are stained with GFAP (B). In both images cell nuclei are stained with DAPI. qRT-PCR analysis showing gene expression changes 1 h post KCl stimulation (D) and 48 h post Aβτρɛατμɛντ (E) of hNSCs differentiated for 21 days in vitro. On the Y axe is depicted the expression of the analyzed gene relative to the housekeeping gene β-ACTIN. Gene expression is normalized to non-treated and DMSO-treated cells respectively. Error bars are S.E.M.; *p < 0.05; **p < 0.01.
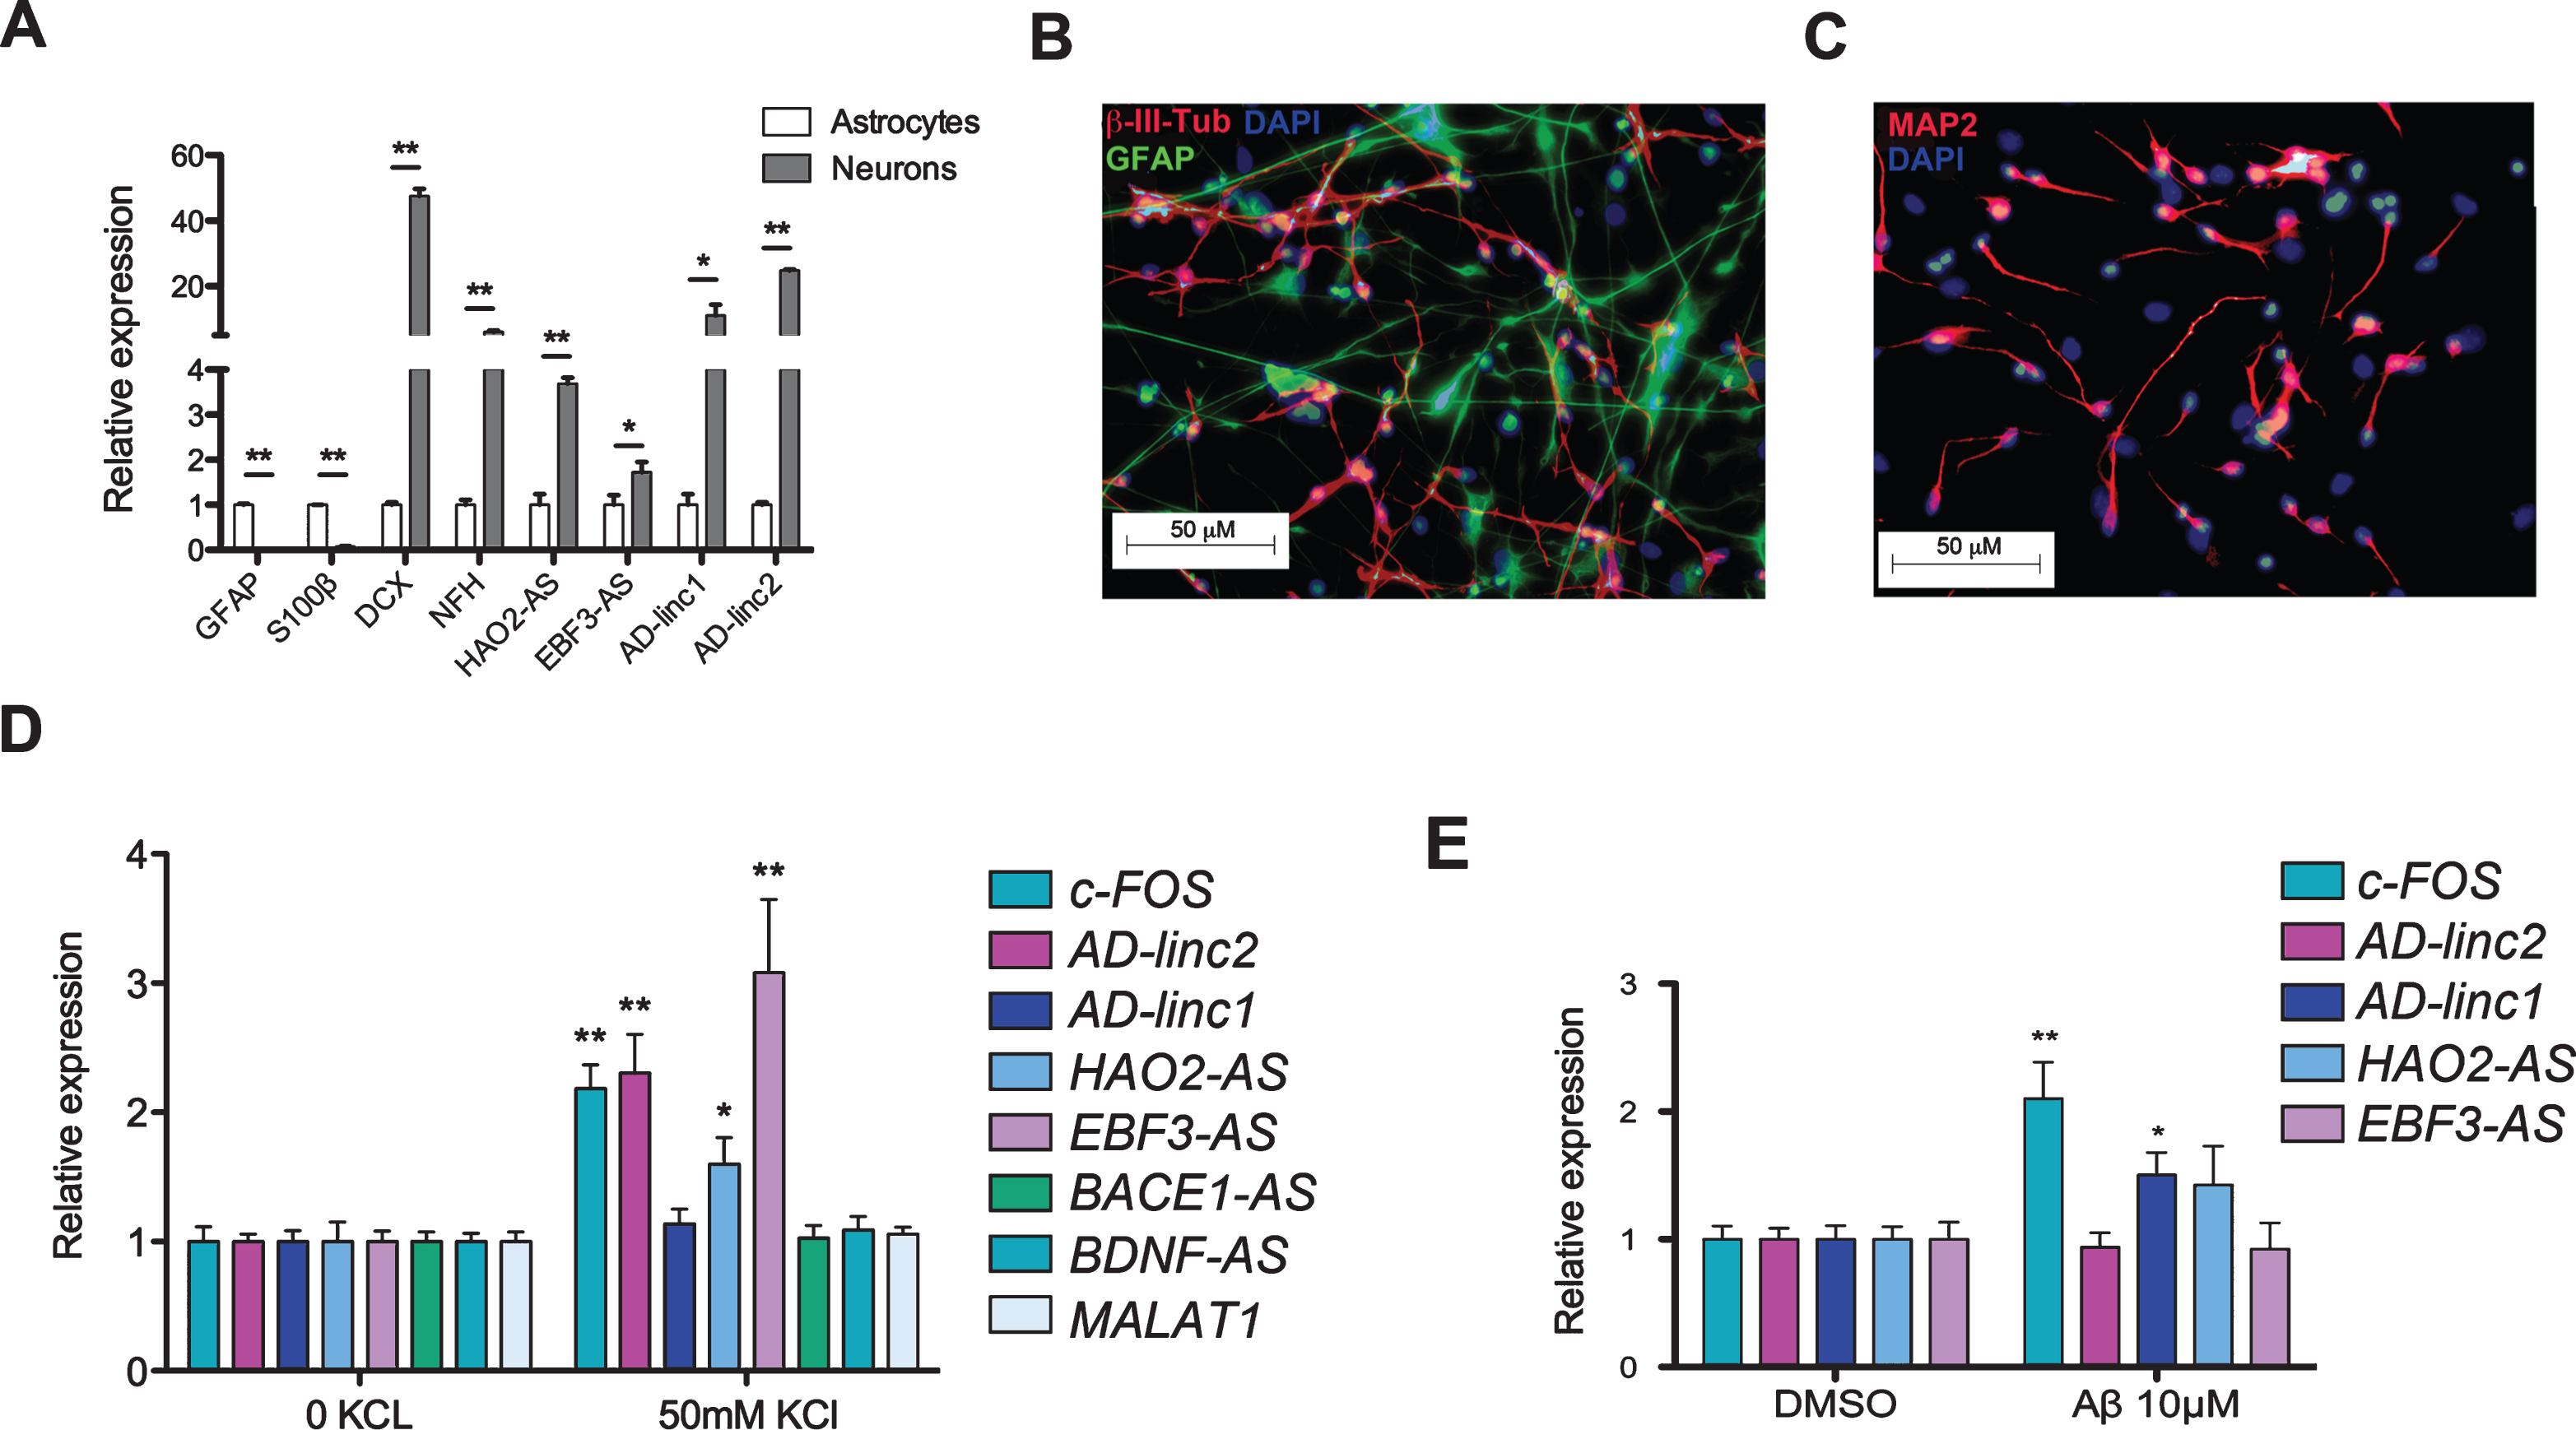
Table 1
Samples Information. Clinicopathological information of the samples subjected to RNAseq analysis
| CaseID | Gender | Expired age | ApoE genotype | PMI | Case | Braak Stage | NIA-Reagan | RIN |
| 95–03 | Female | 77 | 2/3 | 2.5 | Ctrl | I | criteria not met | NA |
| 96–16 | Male | 83 | NA | 4.5 | Ctrl | II | criteria not met | 6.5 |
| 96–22 | Male | >90 | 3/3 | 2 | Ctrl | II | criteria not met | 8.6 |
| 96–32 | Female | 85 | 2/3 | 1 | Ctrl | II | criteria not met | 8.32 |
| 95–18 | Female | 82 | 3/3 | 2.33 | AD | VI | high | 6.9 |
| 96–05 | Female | 87 | 3/3 | 2 | AD | V | high | 6.5 |
| 96–11 | Male | 83 | 3/3 | 2.83 | AD | VI | high | 7 |
| 96–20 | Female | 82 | 3/3 | 3 | AD | VI | high | 6.7 |
Table 2
Filtering statistics. Number of spurious transcripts and total number of transcripts and genes after applying filtering strategy
| Transcript type | Before filtering | After filtering |
| Intronic transcripts | 643008 | 2803 |
| Polimerase run-off | 24426 | 108 |
| Repeat transcripts | 11533 | 82 |
| Mapping errors | 14 | 11 |
| Total transcripts | 1237780 | 154416 |
| Total genes | 800605 | 21697 |
Table 3
Statistics of RNAseq data analysis. Number of sequencing reads before and after trimming, number of reads aligned to the human genome
| Sample | Original | Reads after | % Alignment | ||
| reads | after trimming | AD1 | 187514717 | 149308600 | 79.91 |
| AD2 | 180318237 | 151072769 | 81.08 | ||
| AD3 | 178521597 | 150407208 | 82.89 | ||
| AD4 | 188604801 | 155834074 | 83.26 | ||
| Ctrl1 | 177108169 | 143691181 | 75.05 | ||
| Ctrl2 | 173894719 | 125465469 | 68.5 | ||
| Ctrl3 | 164772379 | 134991306 | 79.42 | ||
| Ctrl4 | 170053030 | 139609407 | 79.97 |
Table 4
Pathway analysis. The integrated knowledge-based platform GeneGo was used to perform pathway analysis of differentially expressed protein coding genes in LOAD. The most enriched process networks are listed here
| Networks | p Value | Min FDR | Network Objects from Active Data |
| Signal transduction_Neuropeptide signaling pathways | 8.916E-04 | 5.573E-02 | EDNRA (Galpha(q)-specific peptide GPCRs), GRP (GRP precursor), MCHR2, PRKAR1B (PKA-reg (cAMP-dependent)), PKD1L2, TAC1 (Substance P) |
| Neurophysiological process_Transmission of nerve impulse | 1.230E-03 | 5.573E-02 | SLC5A7 (CHT1), ADRB3 (Galpha(i)-specific amine GPCRs, Galpha(s)-specific amine GPCRs), HTR3B, SCN11A (NAV1.9), PRKAR1B (PKA-reg (cAMP-dependent)), TH (TY3H) |
| Muscle contraction | 1.691E-03 | 5.573E-02 | EDNRA (Galpha(q)-specific peptide GPCRs), ADRA1D (Galpha(q)-specific amine GPCRs), GUCA1C (GCAP), MYBPC1 (MYPS), CHRNA3 (nAChR alpha), TNNT2 (Troponin T, cardiac) |
| Development_Blood vessel morphogenesis | 1.956E-03 | 5.573E-02 | ADRB3 (Beta-3 adrenergic receptor, Galpha(i)-specific amine GPCRs, Galpha(s)-specific amine GPCRs), BMP4, EDNRA (EDNRA, EDNRB, Galpha(q)-specific peptide GPCRs), FGF10 |
Table 5
HAO2-AS and EBF3-AS 5’ Rapid Amplification of cDNA Ends (RACE). PCR products from HAO2-AS and EBF3-AS 5’ RACE were cloned into pGEM-T Easy vector and Sanger sequenced. The sequencing product is highlighted in bold while AUAP and GSP3 primers sequences are underlined. Genomic coordinates are based on GRCh38 human genome assembly
| Transcript | 5’ RACE Sequencing product | Genomic location of 5’ end determined by RACE | Genomic location of 5’ determined by RNAseq |
| HAO2-AS | GGCCACGCGTCGACTAGTACGGGGGGGGGGGGG | Chr1 : 119391704 | Chr1 : 119391655 |
| CACTAAGTCTTTTTGGCAAGACAAGTACACTTGG | |||
| CCATGGCCTGCATGTATGGATTGCATCCTGACTTG | |||
| GGAAACTGGGTTGAACATTATTTCTCATGCACCAC | |||
| TTGACCAACTTGTCCCTGACTTCCTCATGG | |||
| EBF3-AS | GGCCACGCGTCGACTAGTACGGGGGGGGGGGGG | Chr10 : 129839551 | Chr10 : 129839543 |
| TTTTGAAAGAGATCACGTAGGAAAATCAGCTCCT | |||
| GTCCACAGACAGGACTGCAACCTGGTGTTGGTAC | |||
| ACACCTGGCCCTGGGTCTAGACGCACACCTCTTT | |||
| CCAAAAGACAGTGCAGCCCTGCTGGATGTGTGGC | |||
| CCAGCAGATAAG |


