
Patterns of Cognitive Decline Prior to Dementia in Persons with Mild Cognitive Impairment
Abstract
Only a limited number of studies have investigated the decline of discrete cognitive domains as individuals progress from mild cognitive impairment (MCI) to dementia. Thus, the goal of this longitudinal study was to evaluate the cognitive changes underway during the years preceding a diagnosis of probable Alzheimer’s disease (AD), and to compare these changes to those found in MCI participants who do not progress to dementia. Participants were compared as a function of whether they later converted to AD (n = 47) or not (n = 74). Cognitive change was assessed prior to the conversion year, using that year as a starting point. A combination of polynomial regression analyses and mixed ANOVAs assessed 1) the trajectory of cognitive decline for each domain and 2) the differences between non-progressors and those who had converted to AD. The different cognitive domains demonstrated very different patterns of decline in the group of MCI progressors. A quadratic function, i.e., many years of stable performance followed by a rapid decline just prior to diagnosis, was observed for delayed recall, working memory, and spatial memory. In contrast, a gradual linear decline was observed for immediate recall, executive function, and visuo-spatial abilities. Finally, language in progressors was impaired on all time periods relative to non-progressors, but there was no further change between the first assessments and conversion to AD. Individuals with MCI who progress to AD show abnormal cognition at least two years prior to their dementia diagnosis. The pattern of symptom change observed appears to depend upon the cognitive domain and thus, clinical studies should not assume similar rate of decline across domains. In contrast and, apart from verbal memory, the non-progressors present a performance similar to that of healthy older adults.
INTRODUCTION
Worldwide, it is estimated that more than 24 million people have Alzheimer’s disease (AD), and this prevalence will considerably increase over the next few years as life expectancy rises [1]. Though most patients receive their AD diagnosis during the dementia phase (when symptoms are severe enough to limit independence), the disease undergoes a phase of mild cognitive impairment (MCI) during which the patient experiences cognitive deficits that are deemed abnormal when considering the individual’s age and education level, but that tend to not interfere notably with activities of daily life [2–4]. AD is progressive and shows a gradual increase in the number and severity of symptoms, which certainly also reflects the course of the MCI phase. However, little is known regarding the way by which the different cognitive symptoms lead to dementia. For instance, MCI was once considered an amnestic phase of the disease [5]. However, cumulating evidence indicates that other cognitive domains are also affected. Characterizing the pattern of change during the MCI phase may be critical to improve diagnosis and help develop measures that are sensitive to early interventions or treatment. For instance, many authors have suggested using cognitive decline rather than cognitive performance as a marker of future progression and to develop techniques that are sensitive to cognitive changes [6–9]. For all these reasons, it is critical to better understand how the decline unfolds during this phase of the disease.
Natural history
The majority of the studies assessing the cognitive profile in MCI are predictive studies aiming to identify the factors/neuropsychological tests that are predictive of future progression to dementia [10–12] (for a review, see [13]). In turn, natural history studies aim to characterize the changes that occur in different cognitive domains as individuals progress during the early phase of MCI, and to provide the opportunity to study the trajectory of the symptoms, per cognitive domain. Only a few studies have investigated the natural history of cognitive symptoms in MCI patients. Those studies have indicated that different cognitive domains may manifest different rates of decline. For instance, Wilson and colleagues [14] compared the decline rate of persons with AD, MCI, and normal cognition over an 11-year period. They found that persons with AD decline more rapidly than those with MCI, and that MCI persons experience a faster decline rate than normal individuals. In another study, Bennett et al. [15] examined cognitive decline for discrete cognitive domains. They evaluated decline over a seven-year period in a group of healthy older adults (HOA) and a group of MCI persons on composite measures of episodic memory, semantic memory, working memory, perceptual speed, and visuo-spatial abilities. Their findings revealed that individuals with MCI had significantly lower scores at baseline and displayed accelerated cognitive decline compared to HOA. However, they noted that not all cognitive domains exhibited a similar decline. Individuals with MCI experienced a faster decline rate in terms of episodic memory, semantic memory, and perceptual speed compared to HOA. The decline rate regarding working memory and visuo-spatial abilities, however, did not appear to be significantly faster in MCI persons compared to HOA.
The majority of the natural history studies have assumed that cognitive decline occurs in a linear fashion, although this may not be the case. There may be periods of stable performance followed by accelerated decline, or decline followed by a period of stability, and the cognitive trajectories may differ from one cognitive domain to the other. For instance, a nonlinear pattern with an initial decline followed by a period of stability might be particularly characteristic of episodic memory, as this is a domain that is impaired very early in the disease process [16]. This pattern could also occur due to the presence of early compensatory mechanisms followed by a rapid decline as compensatory mechanisms become compromised [17]. Interestingly, there are studies that have confirmed such a plateau model for episodic and short-term/working memory [18, 19], but not for other cognitive domains [19]. Thus, the decline in the years preceding conversion to dementia may vary as a function of the cognitive domain and trajectories may be characterized by periods of stability and accelerated decline, which might be better described by non-linear rather than linear models. It should be noted, however, that the study of Backman et al. [18] compared mean performances across different assessments and did not assess the cognitive trajectories with statistical modeling.
The few studies that have investigated the pattern of cognitive change during the MCI phase also contain certain limitations. First, not all MCI persons will progress to dementia and to the best of our knowledge, no study has yet examined the natural history of cognitive symptoms in MCI by considering the presence or absence of future progression to dementia. Since the goal is to characterize the natural history of pre-dementia AD, it is important to distinguish MCI as a function of future decline. It is also informative to describe what happens in patients that do not progress to dementia. This group of MCI individuals, also referred to as non-progressors, may remain stable, show improvement in their performance on certain tasks, or may show a decline to a lesser degree than that of progressors (persons that eventually develop dementia).
Second, studies have generally relied on overall cognitive measures, few of them having examined specific cognitive domains. As a result, it is unclear how memory deficits increase over time, and how and when non-memory deficits (e.g., executive functions, language) emerge in the MCI-to-dementia continuum. It is critical to understand the progression of deficits in these different domains, as some authors have suggested that dementia occurs predominantly as a result of the occurrence of executive deficits [11, 20, 21].
Third, the definition of the time frame may have considerable impact on the pattern of results. An ideal study of the natural history of AD would select patients at the onset of the disease or would analyze their data as a function of when the disease arose. In the case of AD, the absence of biomarkers for the disease and the fact that it remains symptomatically silent for a long period of time prevents researchers from determining the true onset of the disease. In the studies reported above, the date of recruitment as an MCI served as Time 1 and subsequent time points were determined as a function of study entry. This may be problematic. The moment at which participants present themselves for consultation in the course of the disease is extremely variable and may depend on a number of factors that are not necessarily related to intrinsic factors of the disease such as service access, tolerability to the cognitive symptoms, whether patients receive support from their family, and financial capability. As a result, it is likely that not all participants are at the same time point in their disease progression at the time of recruitment. One way to partially account for this is to align the time series on the year when participants received their diagnosis of AD, rather than on their recruitment as an MCI. In our view, this is a logical approach, as the goal is to describe the trajectories of the decline prior to dementia. This has been done on cohort studies following healthy older adults. In a study by Amieva et al. [22], the cognitive performance of a cohort of elderly adults was analyzed over a 9-year period. They found that individuals who will progress to dementia already had lower performance at baseline and that some cognitive tests presented an accelerated decline 3 years prior to AD diagnosis.
Hence, the present study is a longitudinal follow-up of a clinical cohort of people meeting the criteria for amnestic MCI (aMCI) and comprises the three following goals: 1) characterize the evolution of cognitive deficits as a function of whether the MCI persons later progress to dementia or not; 2) determine whether different cognitive domains have distinctive trajectories and sensitivity to change; 3) assess whether decline is linear or follows a more complex trajectory with periods of stability and acceleration, as the plateau model of Twamley et al. [23] would suggest. These functions can be assessed by polynomial models, which are sophisticated extensions of the traditional linear regression. Polynomial regressions allow the testing of a range of complex models in addition to the linear model including second-order polynomial (quadratic function, i.e., years of stable performance followed by a rapid decline prior to conversion) and third-order polynomial (cubic function, i.e., two periods of significant decline with a period of stability between them).
MATERIALS AND METHODS
Participants
One-hundred and fifty one participants were recruited from memory clinics and met the following criteria [3, 24] for single-domain aMCI: 1) memory complaint confirmed by an informant; 2) performance of at least 1.5 SD below age- and education-normed values on a minimum of one memory test (RL/RI, text memory or recall of Rey Figure); 3) no global cognitive impairment on the basis of the Mini-Mental State Examination using a cut-off score for age and education; and 4) absence of dementia based on DSM–IV clinical criteria for dementia of the Alzheimer type [25]. Finally, their cognitive difficulties had no significant impact on their functional independence, as assessed through clinical interviews with the participants. All participants were Francophone, with normal or corrected vision and audition, and made no use of AD-related medication (donepezil, rivastigmine, galantamine, or memantine). Participants who made use of anxiolytics and antidepressants were included only if it was not a recent prescription, if the time they started taking the medication differed from the time they started having memory impairment (as assessed by clinical evaluation of referring physicians), and if they had no severe diagnosis of any severe psychiatric disorders, such as major depression. We also excluded participants who reported major current medical conditions, a presence or history of alcoholism, substance abuse, significant cerebrovascular, neurological, or neurodegenerative disorders (e.g., Parkinson’s disease, multiple sclerosis, epilepsy, or Huntington’s disease), stroke (including transient ischemic attacks) or large-vessel disease, or that had undergone general anesthesia within the last six months. In order to characterize the cognitive profile of our participants, they were administered the Mattis Dementia Rating Scale, a global scale of tests evaluating a range of cognitive domains (language, praxis, perception, memory, orientation, executive functions, reasoning) and the Geriatric Depression Scale, which assesses their anxiety and depressive symptoms. Given that patients met the criteria for amnestic MCI and showed no vascular or neurological co-morbidities, AD was expected to be the underlying etiology.
Following study entry, participants received a yearly clinical follow-up that allowed us to identify those who had progressed (i.e., progressors) and those who had not progressed (i.e., non-progressors) to dementia. Progressors met the clinical DSM–IV criteria for dementia of the Alzheimer type, whereas non-progressors were individuals who did not fulfill the criteria for dementia over the course of the follow-up. Thus, progression was determined from clinical criteria based on the entire clinical data including functional autonomy. It is possible that some of the non-progressors were in the earlier stages of the disease process and had not yet reached the point at which they would meet criteria for dementia. For instance, some of the individuals included in the non-progressors group showed a significant cognitive decline on the neuropsychological tests over the course of the follow-up in spite of not reaching criteria for dementia. Those were nevertheless retained in the group of non-progressors to avoid generating an artificial increase in group differences. Note that excluding those participants from the non-progressors group did not substantially modify the models.
Cognitive measures
Six neuropsychological tests were used to measure cognition longitudinally to cover the domains of memory, executive functions, working memory, language, and visual perception.
Memory
The RL/RI [26] (Rappel libre/Rappel indicé; a French adaptation of Buschke’s Free-Recall and Cued Recall) is a measure of verbal memory where participants are asked to encode and then retrieve a list of 16 words with and without categorical cues. As a verbal memory variable, we used the total number of words recalled correctly without cues. Memory was also measured using the 3-minute recall of the Rey complex geometrical figure test [27] in which participants are first asked to copy the figure and then to draw it from memory 3 minutes following the copy phase. This represents an incidental memory test, as the participants are not informed during the copy trial that they will have to recall the figure at a later time. The RL/RI has two alternative versions, which allowed us to alternate versions on consecutive years. Similarly, for spatial memory, the Taylor Figure was used alternatively with the Rey Figure.
Working memory and executive functions
Executive functions were measured using the Stroop-Victoria test [28] in which participants are first asked to read aloud the names of colors written with black ink. Then, participants are asked to name the color of dots. Finally, participants are asked to read aloud the color of the ink in which color names are printed. The names of the written colors are not coherent with the ink in which they are printed, leading participants to have to inhibit the automatic response which would be to read the written name of the color. As an inhibition variable, we used the additional time it took participants to name the color of the ink when the words were incoherent with the ink, compared to the other two conditions. In other words, we subtracted the average time for color names in black ink and dots in colors from the time of colored words. This represents a purer measure of inhibition, as it controls for the base reading time for each individual. We also used the Coding-subtest of the WAIS-R [29] as a measure of working memory and processing speed. In this test, participants are asked to reproduce symbols that are matched to a series of numbers.
Visuo-spatial processing and language
Visuo-spatial processing was measured with the Benton Judgment of line orientation [30] in which participants are asked to match lines that are in the same position and orientation. Finally, language was measured using the 15-item version of the Boston Naming Test [31], for which the score was established by adding the total number of correctly identified pictures, without phonetic or semantic cues.
Design
Patients were recruited and classified by clinicians (HC, MJK, SG) in memory clinics. They were then referred to participate in the present study. At study entry, participants completed the clinical tests/questionnaires and neuropsychological battery. They were then invited for a yearly assessment using the same clinical and neuropsychological battery of tests. Measures were taken in a single testing session. The referring clinicians determined the dementia diagnosis and follow-up assessments ceased the year a patient received a diagnosis of dementia. Thus, the last assessment corresponds to the year of diagnosis. Data was assessed as a function of time from diagnosis. T0 represents the time of conversion, i.e., the year of the diagnosis of dementia for those who declined to AD, and the last evaluation for the non-progressors. T-1, T-2, T-3, and T-4 represent the testing data for one, two, three, and four years prior to diagnosis respectively. The approach is similar to that used by Amieva et al. [22].
Analysis
For each of the cognitive tests, we first ran a polynomial regression analysis. This was done separately for progressors and non-progressors. Polynomial regression has many advantages over the classical linear regression analysis. An important asset, particularly in the context of clinical studies, is that it is fairly flexible and does not require that all participants have the same number of assessments. Also, polynomial regressions are more resistant to missing data than traditional repeated measures analysis [32]. Finally, the analysis is well suited for natural history studies, as it is a non-parametric regression technique that considers less abrupt changes and assumes a more continuous, gradual, and natural change over time [33]. The data we entered in these analyses included all scores obtained from the testing years prior to diagnosis, ranging from Time 0 (year of diagnosis) to Time minus 4. To ascertain which model best fits the data, we first verified whether a linear model was significant and if it was, we proceeded to test more sophisticated models: the quadratic function, a second-order polynomial characterized by one fracture in the curve and the cubic function, a third-order polynomial. We also included age, gender, and education as controlled variables in the model. The polynomial regression requires the selection of a covariance matrix structure on which to base the analysis. We opted for the heterogeneous first-order autoregressive structure, as it is advisable for longitudinal studies. Moreover, it is consistent with our clinical expectation as it assumes that two points close in time should be more correlated than two points apart. Also, because it is a more complex structure, it reduces the risk of type 1 error [34]. However, given that the distribution of the group of non-progressor MCI was stable, the Hessian matrix was not defined as positive with this covariance structure, which led us to use a diagonal or an undefined structure.
For each cognitive measure, we used separate 2 (Group: progressors versus non-progressors) x 3 (Time: T0, T-1, T-2) mixed analyses of variance (ANOVA). Here, only three years were used in order to maximize the number of participants, as ANOVA is not resistant to missing data. This provided information about the extent of the patients’ decline relative to non-progressors in the few years prior to the onset of AD. The number of participants retained for the ANOVA differs as a function of the task due to differences in missing data. Thus, the N on which the analyses are performed are presented separately in the result section below. This analysis provides complimentary information to the polynomial regression analysis. Because it includes the two groups, it provided information regarding the time at which progressors and non-progressors significantly differed. It can also be used to better identify the time at which the onset of the decline occurs in domains for which the polynomial regression analysis has identified sudden changes. The adjusted F was used to correct sphericity by removing the part of the effect that is explained by the systematic error. Greenhouse-Geiser’s estimates were used to correct for error of the first kind. Because it is a repeated design, homogeneity of variance was assumed.
RESULTS
Socio-demographic and clinical characteristics
The STAndards for the Reporting of Diagnostic (STARD) flow diagram [35] is shown in Fig. 1. Thirty participants were excluded from the analyses because they only received one evaluation, and the polynomial regression analysis requires at least two points in time to establish a model to fit the data. The data from 121 participants (74 women) were analyzed for this study. Of this number, 47 progressed to clinical dementia (progressors) and 74 did not meet the criteria for dementia over the follow-up period (non-progressors). Demographic and clinical data are shown in Table 1. The non-progressors group did not significantly differ from the progressor group on age at entry (t =−1, p = 0.32; bimodal) nor at T0 (t =−0.49, p = 0.63; bimodal). The groups showed no differences regarding their completed years of education (t = 0.48, p = 0.63; bimodal), gender distribution (x2 = 0.23, p = 0.63), or Geriatric Depression Scale score (t = –0.26, p = 0.79; bimodal). Unsurprisingly, the progressors presented significantly lower scores on the Mini-Mental State Examination (t = 4.24, p < 0.01; bimodal) and on the Mattis Dementia Rating Scale (t = 6.06, p < 0.01; bimodal).
A summary of the polynomial regression analyses for all cognitive variables concerning the non-progressors group is presented in Table 2, while that for the progressor group is presented in Table 3. Fitted models for both groups can be seen in Figs. 2 to 8. When examining cognitive change with polynomial regression analyses in the group of non-progressor MCIs, none of the models were found to be significant, except for Coding in which a positive linear model was found to be significant. This denotes that performance in all measured domains remains stable over time with no significant deterioration or improvement except for the coding test, which shows a small practice effect. On most of the domains evaluated in the progressors, we observed a significant decline that varied considerably in terms of form and rate as a function of the cognitive domain. Because of the large variation across cognitive domains, results are presented by domain in the remainder of this section.
Episodic memory
The regression analysis indicated a significant linear model for immediate recall of the verbal memory test in the progressor group, but none were found to be significant in the non-progressors group. This indicates a gradual decline of immediate recall in progressors and no change in non-progressors (See Fig. 2). The Group by Time ANOVA on the immediate recall indicated a Group effect, (F(1, 68) = 19.06, p < 0.01) as progressors (n = 22) recalled less words than non-progressors (n = 48) overall. There was no Time or Group by Time interaction. Combining the two analyses indicates that decline in progressors was very gradual and that they differed from non-progressors on all time periods.
The quadratic model best describes the data pertaining to the progressor group for the delayed recall (Fig. 3). This suggests there is a presence of one fracture in the pattern of decline. None of the models were found to be significant in the non-progressors group. The Group by Time ANOVA indicated a significant Group by Time interaction (F(2, 138) = 11.31, p < 0.01). Time was significant in the progressor group (n = 22) (F(2, 42) = 14.61, p < 0.01), but not in the non-progressors group (n = 49) (F(2, 96) = 0.4, p = 0.65). Post-hoc comparisons with Bonferroni adjustments of measurement times in progressors indicated that T0 (M = 4.5) differed from T-2 (M = 7.5) and T-1 (M = 6.3) but that T-2 and T-1 did not differ one from another. Thus, a fast decline occurs just prior to diagnosis. Progressors differed from non-progressors on all time periods. Combining the two analyses indicates that the progressors are significantly impaired at baseline but that there is an accelerated decline one year prior to diagnosis.
A quadratic polynomial model best explained non-verbal memory performance (Fig. 4) in progressors, suggesting the presence of one fracture in the pattern of decline. Examination of Fig. 4 shows that performance in progressors is stable before suffering an accelerated decline. The Group by Time ANOVA indicated a significant interaction (F(2, 124) = 3.23, p = 0.045) due to the fact that the Time effect was only significant in the progressor (n = 19) group, (F(2, 36) = 6.7, p = 0.008), but not significant in the non-progressors (n = 45) group (F(2, 88) = 1.77, p = 0.18). In progressors, the difference between T-2 (M = 12.2) and T0 (M = 8.2) was significant but T-1 (M = 11) did not differ from T0. Furthermore, the groups were different on all times. The regression in combination with the ANOVA indicates that progressors and non-progressors’ performance on spatial memory was similar at entry, and that progressors began their accelerated decline two years prior to diagnosis, at which point the groups showed significant differences.
Executive functions
The regression analyses revealed a significant linear decline in the case of the Stroop test (Fig. 5) for progressors whereas no model fitted the data in non-progressors. The Group by Time ANOVA indicated a significant Group effect, F(1, 67) = 22.58, p < 0.01, but no Time or Group by Time interaction. Thus, executive function gradually worsened in progressors (n = 21), who displayed lower performance than non-progressors (n = 48) on all time periods.
Working memory
Regarding the Coding task (Fig. 6), the quadratic trend was significant in progressors, whose performance remained stable for some years before presenting an accelerated decline just prior to diagnosis. A positive linear trend explained performance in non-progressors, suggesting an improvement over time in that group. The Group by Time ANOVA indicated the presence of a main Group effect (F(1, 65) = 13.05, p = 0.01), which was qualified by a significant interaction (F(2, 130) = 8.38, p = 0.001). The interaction was explained by the presence of a Time effect in the progressor group (n = 22) (F(2, 42) = 5.4, p = 0.014), as well as in the non-progressors group (n = 45) (F(2, 88) = 4.67, p = 0.014). Post-hoc comparisons indicated a significant difference between T-1(M = 9.2) and T0 (M = 8.2) for the progressors, and a significant difference between T-2 (M = 10.78) and T0 (M = 11.42) for the non-progressors. Also, the groups significantly differed on all time points. By combining the two analyses, it was thus revealed that on working memory, the progressors’ performance was impaired at baseline compared to non-progressors, and presented an accelerated decline in the year preceding the diagnosis of dementia. It was also revealed that the non-progressors showed a significant improvement on this task in the last 3 years of the follow-up.
Language
When analyzing the Boston Naming Test (Fig. 7) in the progressor and non-progressors groups, none of the models were significant, suggesting that both groups had a stable performance over time. However, the Group by Time ANOVA revealed a significant Group effect, F(1, 60) = 5.92, p = 0.018, as non-progressors (n = 45) performed better than progressors (n = 17) overall. There was no Time or Group by Time interaction.
Visual-spatial abilities
The progressor group’s performance on the Benton Judgement of Line Orientation (Fig. 8) was best described by a linear model, which suggested a gradual and fairly slow progression. None of the models were found to be significant for non-progressors. The Group by Time ANOVA indicated a significant interaction, F(2, 118) = 4.62, p = 0.014. Bonferroni post-hoc revealed a significant difference between the groups only on T0, which supports the presence of a very slow decline in the progressors (n = 18), but not in the non-progressors n = 43) with the groups diverging only on the year of the diagnosis.
DISCUSSION
The goal of this study was to examine the trajectories of decline during the MCI phase that precedes a diagnosis of dementia as a function of cognitive domains. The study is innovative compared to other natural history studies as it contrasts a group of patients with dementia and non-progressor MCI group, it analyzes the data as a function of time of diagnosis rather than study entry and it compares decline as a function of the cognitive domain. Also, it explores more complex statistical models, which allowed for a better representation of how the decline really unfolds during the pre-dementia phase.
The data lead to clear findings in relation to our initial objectives. First, cognitive deficits vary as a function of whether MCI participants later progress to AD or not. The non-progressors presented an improvement in working memory, which could reflect practice effects, and remain stable on all other cognitive measures, whereas the progressors show a decline on almost all cognitive domains. Second, the different cognitive domains have strikingly different patterns of trajectory changes. Linear decline is not the norm and a more complex quadratic pattern occurs frequently with a period of stability or very mild decline followed by an acceleration of decline one or two years prior to diagnosis. Our findings indicate three major types of cognitive trajectories. 1) Stable impairment was observed for language and is characterized by an impaired performance with no signs of deterioration as patients progress toward dementia. 2) Gradual appearance of impairment was found for immediate recall, inhibition, and visuo-spatial abilities and is characterized by an initially normal performance followed by a very gradual linear decline. 3) Stable followed by accelerated decline was found for delayed recall, visuo-spatial memory, and working memory (coding) and is characterized by a stable performance followed by a fast decline prior to conversion. These findings are discussed below as a function of the more precise pattern of change observed for cognitive domains.
Episodic memory and working memory are the cognitive domains that are the most impaired and that presented the fastest decline in the MCI progressor group: they are already impaired many years prior to diagnosis and present a fast decline right before the conversion year. This is consistent with the observation that MCI is mainly characterized by memory deficits [3, 5], and that both episodic memory and working memory are impaired early in the disease process and are predictors of conversion from MCI to AD [11, 36] (for a review, see [37]) and from healthy aging to MCI [38].
Importantly, our study showed that memory is not the only cognitive domain that is impaired in MCI progressing toward AD. Many other domains show impairment that increases in severity. One of them is the domain of executive functions. This differs from the study of Bennett et al. [15], which failed to observe a deterioration of executive functions. This difference might be due to the fact that Bennet et al. had used a composite measure for executive functions whereas we relied on the inhibition portion of the Stroop test. There is increasing evidence that the executive domain reflects a range of cognitively and neurologically distinct processes [39–41]. So perhaps, not all of these domains are equally sensitive to AD [42]. Among them, inhibition and working memory appeared to be particularly sensitive and were reported to be severely impaired in MCI [43–46]. One other crucial difference between the two studies is that we differentiated non-progressor from progressor MCI. Some studies have indicated that executive functions and inhibition are more impaired in progressors than in non-progressor MCIs [20, 21, 43, 47] and predictive models that are most sensitive and specific often include executive function measures [11] (for a review, see [37]). Our results support this literature as executive functions were found to differ between non-progressor and progressor MCI and only the latter showed increased impairment.
While progressor MCIs are globally impaired on the Boston naming test, we did not find any significant decline for language. These results contrast with the decline on semantic memory previously reported for individuals with MCI [15, 48, 49]. It should be noted, though, that many of the previous studies used a verbal fluency task to measure language, a task that has some executive component. The test that we used to evaluate language was a picture-naming task. It is possible that it reflects dimensions of language that do not decline as much as those measured by tests of verbal fluency.
Our results indicate that episodic memory and working memory are significantly impaired many years preceding dementia but then show no change for a period of time before presenting an accelerated decline just prior to dementia. This pattern, which we found only for these two cognitive domains, supports the plateau model proposed by Twamley and colleagues [23] for memory, and the data from Smith et al. [19] and Backman et al. [18]. This pattern of decline was suggested to result from the fact that compensatory processes are particularly active during the very early phase of MCI and support memory maintenance. As the patient progresses toward dementia, however, there is a failure in compensatory mechanisms. A similar hypothesis has been proposed to account for the presence of hyperactivation in fMRI followed by hypoactivation as patients progress toward dementia [17, 50, 51]. The fact that this finding is only present in MCI progressors and not in non-progressor MCIs indicates that this pattern arises as a result of the underlying pathology and is not a mere reflection of older adults with reduced memory capacities. Our findings also indicate that different cognitive domains have different cognitive trajectories.
Non-progressors showed virtually no change in their cognition whereas progressors manifested decline in nearly all domains confirming that the presence of a cognitive decline might be an indication of future progression. Note however, absence of decline does not constitute a perfect indicator of protection against conversion to dementia as decline varies across domains and across time. For instance, performance on naming remained stable up to dementia diagnosis, even in those who developed AD. Similarly, while episodic memory suffers important decline one to two years prior to diagnosis, it can remain stable for a while when tested many years prior. These results stress the importance of carefully considering the types of measures to be included when one intends to assess cognitive change with composite aggregates, as including measures that are not sensitive to change will reduce the power to detect change in populations. Sensitivity to change might also depend on where patients stand on the severity continuum. The quadratic pattern found in many instances indicates that domains that remain stable at some point in time during the progression can be those showing the largest changes at other time points. As a result, measures such as delayed recall and inhibition might be particularly sensitive to change in the years close to the diagnosis. Thus, more studies will be needed before we can ascertain that cognitive change is a reliable indicator at all stages of the disease.
Limitations
This study has certain limitations that should be acknowledged. First, the diagnosis was based on clinical criteria and we did not include biomarkers. For this reason, we are unable to draw conclusions regarding the etiology of the disease in these individuals, as the more recent research criteria of the National Institute on Aging for MCI and AD include the presence of biomarkers confirmed by imaging [8, 52]. Furthermore, the conventional Petersen/Winbald criteria were used for MCI diagnosis, but more recent criteria based on the neuropsychological method of actuarial diagnostic decision-making (Jak/Bondi criteria) were shown to improve diagnostic precision and to be less susceptible to false positives [53]. Second, we did not include healthy older adults to serve as a control group, as our goal was to examine the natural history of a clinical cohort as a function of future progression to dementia. As a result, it is not possible to know whether non-progressor MCIs are impaired relative to a comparative group of older adults with no complaint. It is of note, however, that mean performance levels indicate that, apart from verbal memory, the non-progressors present a performance similar to that of healthy older adults [54–56]. The fact that we used a retrospective design is a strength, as it allows us to distinguish individuals who will receive a diagnosis of AD from those who do not progress, and to compare their cognitive profiles. However, it also introduces challenges on a methodological level. One is that different time points do not benefit from the same amount of practice across individuals, as they are defined retrospectively with respect to diagnosis time. In addition, we had to arbitrarily determine that the last assessment for the non-progressors represented T0. Because time to diagnosis (or time between study entry and diagnosis) varies across subjects, the number of participants decreased as time to diagnosis increased. These are caveats that we believe are compensated by the fact that we knew precisely the year of conversion to dementia, which allowed for a more accurate description of the natural history of the cognitive symptoms in MCI in the years preceding a diagnosis of AD. Also, even though the results of the polynomial regression analyses and the ANOVAs generally agree and are coherent, we found a significant linear decline in the progressors with the polynomials analyses for immediate words recall and executive functions, but no time effect with the ANOVAs. This discrepancy may be explained by the fact that the polynomial regressions included more times and more participants, which increases the statistical power. Finally, factors that may influence cognitive decline in older adults were not considered in the analyses because they were unavailable. For example, genetic factors such as the presence of the E4 variant of the apolipoprotein gene can increase the risk of converting to AD [57]. We know that there is a relationship between high level of vascular burden, diseases and executive deficits [58]. In addition, for future studies, it would be important to consider sleep habits, as we know that poor sleep quality in the preclinical phase of AD is associated with aggregates of amyloid-β peptide, which is characteristic of this type of dementia [59].
Conclusion and implications
Cognition declines in individuals with MCI as they progress toward dementia. However, the decline trajectory varies between cognitive domains. While some domains (immediate recall, visuo-spatial abilities, and inhibition) present a slow linear decline (linear trend), delayed recall, spatial memory, and working memory (coding) remain stable for a while but exhibit a large and accelerated decline just prior to diagnosis (quadratic trend). By contrasting the profiles of change of individuals with non-progressor MCI and of those who progressed to dementia, this study identified a profile of change that characterizes individuals who will progress toward dementia. A fast decline on episodic memory and working memory accompanied by impairment on language emerges as a profile that could reflect individuals presenting an elevated risk of converting to dementia in the near future. Another important finding is that decline was more pervasive and of a larger magnitude when patients were very close to the time at which they met the classification criteria for dementia, suggesting that the point of diagnosis might represent the time at which the amount of brain damage is severe enough to yield a form of compensation failure which has a catastrophic effect on cognition and precipitates dementia [17, 50].
ACKNOWLEDGMENTS
This study was supported by a CIHR funds to SB. We thank Émilie Lepage for conducting the cognitive assessments and for data preparation and Gabrielle Ciquier for the English editing of the manuscript.
Authors’ disclosures available online (http://j-alz.com/manuscript-disclosures/14-2910r1).
REFERENCES
1 | Ballard C, Gauthier S, Corbett A, Brayne C, Aarsland D, Jones E(2011) Alzheimer’s diseaseLancet377: 10191031 |
2 | Gauthier S, Reisberg B, Zaudig M, Petersen RC, Ritchie K, Broich K, Belleville S, Brodaty H, Bennett DA, Chertkow H, Cummings JL, de Leon M, Feldman H, Ganguli M, Hampel H, Scheltens P, Tierney M, Whitehouse P, Winblad B(2006) Mild cognitive impairmentLancet367: 12621270 |
3 | Petersen RC, Stevens JC, Ganguli M, Tangalos EG, Cummings JL, DeKosky ST(2001) Practice parameter: Earlydetection of dementia: Mild cognitive impairment (an evidence-based review). Report of the Quality StandardsSubcommittee of the American Academy of NeurologyNeurology56: 11331142 |
4 | Sperling RA, Aisen PS, Beckett LA, Bennett DA, Craft S, Fagan AM, Iwatsubo T, Jack CRJr, Kaye J, Montine TJ, Park DC, Reiman EM, Rowe CC, Siemers E, Stern Y, Yaffe K, Carrillo MC, Thies B, Morrison-Bogorad M, Wagster MV, Phelps CH(2011) Toward defining the preclinical stages of Alzheimer’s disease: Recommendations from the National Institute on Aging-Alzheimer’s Association workgroups on diagnostic guidelines for Alzheimer’s diseaseAlzheimers Dement7: 280292 |
5 | Small BJ, Fratiglioni L, Viitanen M, Winblad B, Backman L(2000) The course of cognitive impairment in preclinical Alzheimer disease: Three- and 6-year follow-up of a population-based sampleArch Neurol57: 839844 |
6 | Chen P, Ratcliff G, Belle SH, Cauley JA, DeKosky ST, Ganguli M(2001) Patterns of cognitive decline inpresymptomatic Alzheimer disease: A prospective community studyArch Gen Psychiatry58: 853858 |
7 | Lindeboom J, Weinstein H(2004) Neuropsychology of cognitive ageing, minimal cognitive impairment, Alzheimer’s disease, and vascular cognitive impairmentEur J Pharmacol490: 8386 |
8 | McKhann GM, Knopman DS, Chertkow H, Hyman BT, Jack CRJr, Kawas CH, Klunk WE, Koroshetz WJ, Manly JJ, Mayeux R, Mohs RC, Morris JC, Rossor MN, Scheltens P, Carrillo MC, Thies B, Weintraub S, Phelps CH(2011) The diagnosis ofdementia due to Alzheimer’s disease: Recommendations from the National Institute on Aging-Alzheimer’s Associationworkgroups on diagnostic guidelines for Alzheimer’s diseaseAlzheimers Dement7: 263269 |
9 | Villeneuve S, Belleville S(2012) The nature of memory failure in mild cognitive impairment: Examining association with neurobiological markers and effect of progressionNeurobiol Aging33: 19671978 |
10 | Ahmed S, Mitchell J, Arnold R, Nestor PJ, Hodges JR(2008) Predicting rapid clinical progression in amnestic mild cognitive impairmentDement Geriatr Cogn Disord25: 170177 |
11 | Belleville S, Gauthier S, Lepage E, Kergoat MJ, Gilbert B(2014) Predicting decline in mild cognitive impairment: A prospective cognitive studyNeuropsychology28: 643652 |
12 | Fellows L, Bergman H, Wolfson C, Chertkow H(2008) Can clinical data predict progression to dementia in amnestic mild cognitive impairment?Can J Neurol Sci35: 314322 |
13 | Gainotti G, Quaranta D, Vita MG, Marra C(2014) Neuropsychological predictors of conversion from mild cognitive impairment to Alzheimer’s diseaseJ Alzheimers Dis38: 481495 |
14 | Wilson RS, Aggarwal NT, Barnes LL, Mendes de Leon CF, Hebert LE, Evans DA(2010) Cognitive decline in incident Alzheimer disease in a community populationNeurology74: 951955 |
15 | Bennett DA, Wilson RS, Schneider JA, Evans DA, Beckett LA, Aggarwal NT, Barnes LL, Fox JH, Bach J(2002) Natural history of mild cognitive impairment in older personsNeurology59: 198205 |
16 | Salmon DP, Bondi MW(2009) Neuropsychological assessment of dementiaAnnu Rev Psychol60: 257282 |
17 | Clement F, Belleville S(2010) Compensation and disease severity on the memory-related activations in mild cognitive impairmentBiol Psychiatry68: 894902 |
18 | Backman L, Small BJ, Fratiglioni L(2001) Stability of the preclinical episodic memory deficit in Alzheimer’s diseaseBrain124: 96102 |
19 | Smith GE, Pankratz VS, Negash S, Machulda MM, Petersen RC, Boeve BF, Knopman DS, Lucas JA, Ferman TJ, Graff-Radford N, Ivnik RJ(2007) A plateau in pre-Alzheimer memory decline: Evidence for compensatory mechanisms?Neurology69: 133139 |
20 | Saunders NL, Summers MJ(2010) Attention and working memory deficits in mild cognitive impairmentJ Clin Exp Neuropsychol32: 350357 |
21 | Saunders NLJ, Summers MJ(2011) Longitudinal deficits to attention, executive, and working memory in subtypes of mild cognitive impairmentNeuropsychology25: 237248 |
22 | Amieva H, Jacqmin-Gadda H, Orgogozo J-M, Le Carret N, Helmer C, Letenneur L, Barberger-Gateau P, Fabrigoule C, Dartigues J-F(2005) The 9 year cognitive decline before dementia of the Alzheimer type: A prospective population-based studyBrain128: 10931101 |
23 | Twamley EW, Ropacki SA, Bondi MW(2006) Neuropsychological and neuroimaging changes in preclinical Alzheimer’s diseaseJ Int Neuropsychol Soc12: 707735 |
24 | Winblad B, Palmer K, Kivipelto M, Jelic V, Fratiglioni L, Wahlund LO, Nordberg A, Backman L, Albert M, AlmkvistO , Arai H, Basun H, Blennow K, de Leon M, DeCarli C, Erkinjuntti T, Giacobini E, Graff C, Hardy J, Jack C, JormA , Ritchie K, van Duijn C, Visser P, Petersen RC(2004) Mild cognitive impairment–beyond controversies, towardsa consensus: Report of the International Working Group on Mild Cognitive ImpairmentJ Intern Med256: 240246 |
25 | American Psychiatric AssociationTask Force on DSM-IV(2000) American Psychiatric AssociationDiagnostic and statistical manual of mentaldisorders: DSM-IV-TRWashington, DC |
26 | Van der Linden M, Adam S, Agniel A, Baisset-Mouly C, Bardet F, Coyette F, Desgranges B, Deweer B, Ergis A-M, Gély-Nargeot M-C, Grimonprez L, Juillerat A-C, Kalafat M, Poitrenaud J, Sellal F, Thomas-Antérion C(2004) Solal, MarseilleL’évaluation de troubles de la mémoire: Présentationde quatre tests de mémoireépisodique (avec étalonnage) |
27 | Rey A(1959) Les Éditions du Centre de Psychologie Appliquée, ParisTest de copie d’une figure complexe: Manuel |
28 | Regard M(1981) University of Victoria, CanadaCognitive rigidity and flexibility: A neuropsychological study. PhD dissertation |
29 | Wechsler D(1997) Harcourt Assessment, San Antonio, TXWeschsler Adult Intelligence Scale |
30 | Benton AL, Hamsher K, Varney NR, Spreen O(1983) Contributions to neuropsychological assessmentNew YorkOxford University Press |
31 | Kaplan EF, Goodglass H, Weintraub S(1983) The Boston Naming Test (2nd ed.)Philadelphia, PALea & Febiger |
32 | Dupéré V, Lacourse E, Vitaro F, Tremblay RE(2007) Méthodes d’analyse du changement fondés sur les trajectoires de développement individuelBull Méthodol Sociol95: 2657 |
33 | Eubank RL(1999) Nonparametric regression and spline smoothingNew YorkMarcel Dekker |
34 | Field AP(2013) Sage, Los AngelesDiscovering statistics using IBM SPSS statistics: And sex and drugs and rock ‘n’ roll |
35 | Bossuyt PM, Reitsma JB, Bruns DE, Gatsonis CA, Glasziou PP, Irwig LM, Moher D, Rennie D, de Vet HC, Lijmer JGStandards for Reporting of Diagnostic Accuracy G(2003) The STARD statement for reporting studies of diagnostic accuracy: Explanation and elaboration. The Standards for Reporting of Diagnostic Accuracy GroupCroat Med J44: 639650 |
36 | Peters F, Villeneuve S, Belleville S(2014) Predicting progression to dementia in elderly subjects with mild cognitive impairment using both cognitive and neuroimaging predictorsJ Alzheimers Dis38: 307318 |
37 | Belleville S, Fouquet C, Duchesne S, Collins DL, Hudon C(2014) Detecting early preclinical Alzheimer’s diseasevia cognition, neuropsychiatry, and neuroimaging: Qualitative review and recommendations for testingJAlzheimers Dis42 Suppl 4: S375S382 |
38 | Rizk-Jackson A, Insel P, Petersen R, Aisen P, Jack C, Weiner M(2013) Early indications of future cognitive decline: Stable versus declining controlsPLoS One8: e74062 |
39 | de Frias CM, Dixon RA, Strauss E(2009) Characterizing executive functioning in older special populations: From cognitively elite to cognitively impairedNeuropsychology23: 778791 |
40 | Miyake A, Friedman NP, Emerson MJ, Witzki AH, Howerter A, Wager TD(2000) The unity and diversity of executive functions and their contributions to complex “Frontal Lobe” tasks: A latent variable analysisCogn Psychol41: 49100 |
41 | Sylvain-Roy S, Lungu O, Belleville S(2014) Normal aging of the attentional control functions that underlieworking memoryJ Gerontol B Psychol Sci Soc Sci10.1093/geronb/gbt166 |
42 | Belleville S, Chertkow H, Gauthier S(2007) Working memory and control of attention in persons with Alzheimer’s disease and mild cognitive impairmentNeuropsychology21: 458469 |
43 | Belanger S, Belleville S(2009) Semantic inhibition impairment in mild cognitive impairment: A distinctive feature of upcoming cognitive decline?Neuropsychology23: 592606 |
44 | Belanger S, Belleville S, Gauthier S(2010) Inhibition impairments in Alzheimer’s disease, mild cognitive impairment and healthy aging: Effect of congruency proportion in a Stroop taskNeuropsychologia48: 581590 |
45 | Johns EK, Phillips NA, Belleville S, Goupil D, Babins L, Kelner N, Ska B, Gilbert B, Massoud F, de Boysson C, Duncan HD, Chertkow H(2012) The profile of executive functioning in amnestic mild cognitive impairment:Disproportionate deficits in inhibitory controlJ Int Neuropsychol Soc18: 541555 |
46 | Zheng D, Dong X, Sun H, Xu Y, Ma Y, Wang X(2012) The overall impairment of core executive function components inpatients with amnestic mild cognitive impairment: A cross-sectional studyBMC Neurol12: 138 |
47 | Rainville C, Lepage E, Gauthier S, Kergoat MJ, Belleville S(2012) Executive function deficits in persons with mild cognitive impairment: A study with a Tower of London taskJ Clin Exp Neuropsychol34: 306324 |
48 | Price SE, Kinsella GJ, Ong B, Storey E, Mullaly E, Phillips M, Pangnadasa-Fox L, Perre D(2012) Semantic verbal fluency strategies in amnestic mild cognitive impairmentNeuropsychology26: 490497 |
49 | Gardini S, Cuetos F, Fasano F, Pellegrini FF, Marchi M, Venneri A, Caffarra P(2013) Brain structural substrates of semantic memory decline in mild cognitive impairmentCurr Alzheimer Res10: 373389 |
50 | Clement F, Belleville S(2012) Effect of disease severity on neural compensation of item and associative recognition in mild cognitive impairmentJ Alzheimers Dis29: 109123 |
51 | Clement F, Gauthier S, Belleville S(2013) Executive functions in mild cognitive impairment: Emergence and breakdown of neural plasticityCortex49: 12681279 |
52 | Albert MS, DeKosky ST, Dickson D, Dubois B, Feldman HH, Fox NC, Gamst A, Holtzman DM, Jagust WJ, Petersen RC, Snyder PJ, Carrillo MC, Thies B, Phelps CH(2011) The diagnosis of mild cognitive impairment due to Alzheimer’s disease: Recommendations from the National Institute on Aging-Alzheimer’s Association workgroups on diagnostic guidelines for Alzheimer’s diseaseAlzheimers Dement7: 270279 |
53 | Bondi MW, Edmonds EC, Jak AJ, Clark LR, Delano-Wood L, McDonald CR, Nation DA, Libon DJ, Au R, Galasko D, SalmonDP (2014) Neuropsychological criteria for mild cognitive impairment improves diagnostic precision, biomarkerassociations, and progression ratesJ Alzheimers Dis42: 275289 |
54 | Dion M, Potvin O, Belleville S, Ferland G, Renaud M, Bherer L, Joubert S, Vallet GT, Simard M, Rouleau I, LecomteS , Macoir J, Hudon C(2015) Normative data for the Rappel libre/Rappel indice a 16 items (16-item Free and CuedRecall) in the elderly Quebec-French populationClin Neuropsychol28 Suppl 1: S1S19 |
55 | Hudon C, Potvin O, Turcotte MC, D’Anjou C, Dube M, Preville M, Brassard J(2009) Normative date for the Mini-Mental State Examination (MMSE) in a sample of community dwelling French speaking residents from Quebec aged 65 and olderCan J Aging28: 347357 |
56 | Fastenau PS, Denburg NL, Hufford BJ(1999) Adult norms for the Rey-Osterrieth Complex Figure Test and forsupplemental recognition and matching trials from the Extended Complex Figure TestClin Neuropsychol13: 3047 |
57 | Liu CC, Kanekiyo T, Xu H, Bu G(2013) Apolipoprotein E and Alzheimer disease: Risk, mechanisms and therapyNat Rev Neurol9: 106118 |
58 | Villeneuve S, Belleville S, Massoud F, Bocti C, Gauthier S(2009) Impact of vascular risk factors and diseases oncognition in persons with mild cognitive impairmentDement Geriatr Cogn Disord27: 375381 |
59 | Ju YE, McLeland JS, Toedebusch CD, Xiong C, Fagan AM, Duntley SP, Morris JC, Holtzman DM(2013) Sleep quality andpreclinical Alzheimer diseaseJAMA Neurol70: 587593 |
Figures and Tables
Fig.1
STAndards for the Reporting of Diagnostic (STARD) flow diagram.
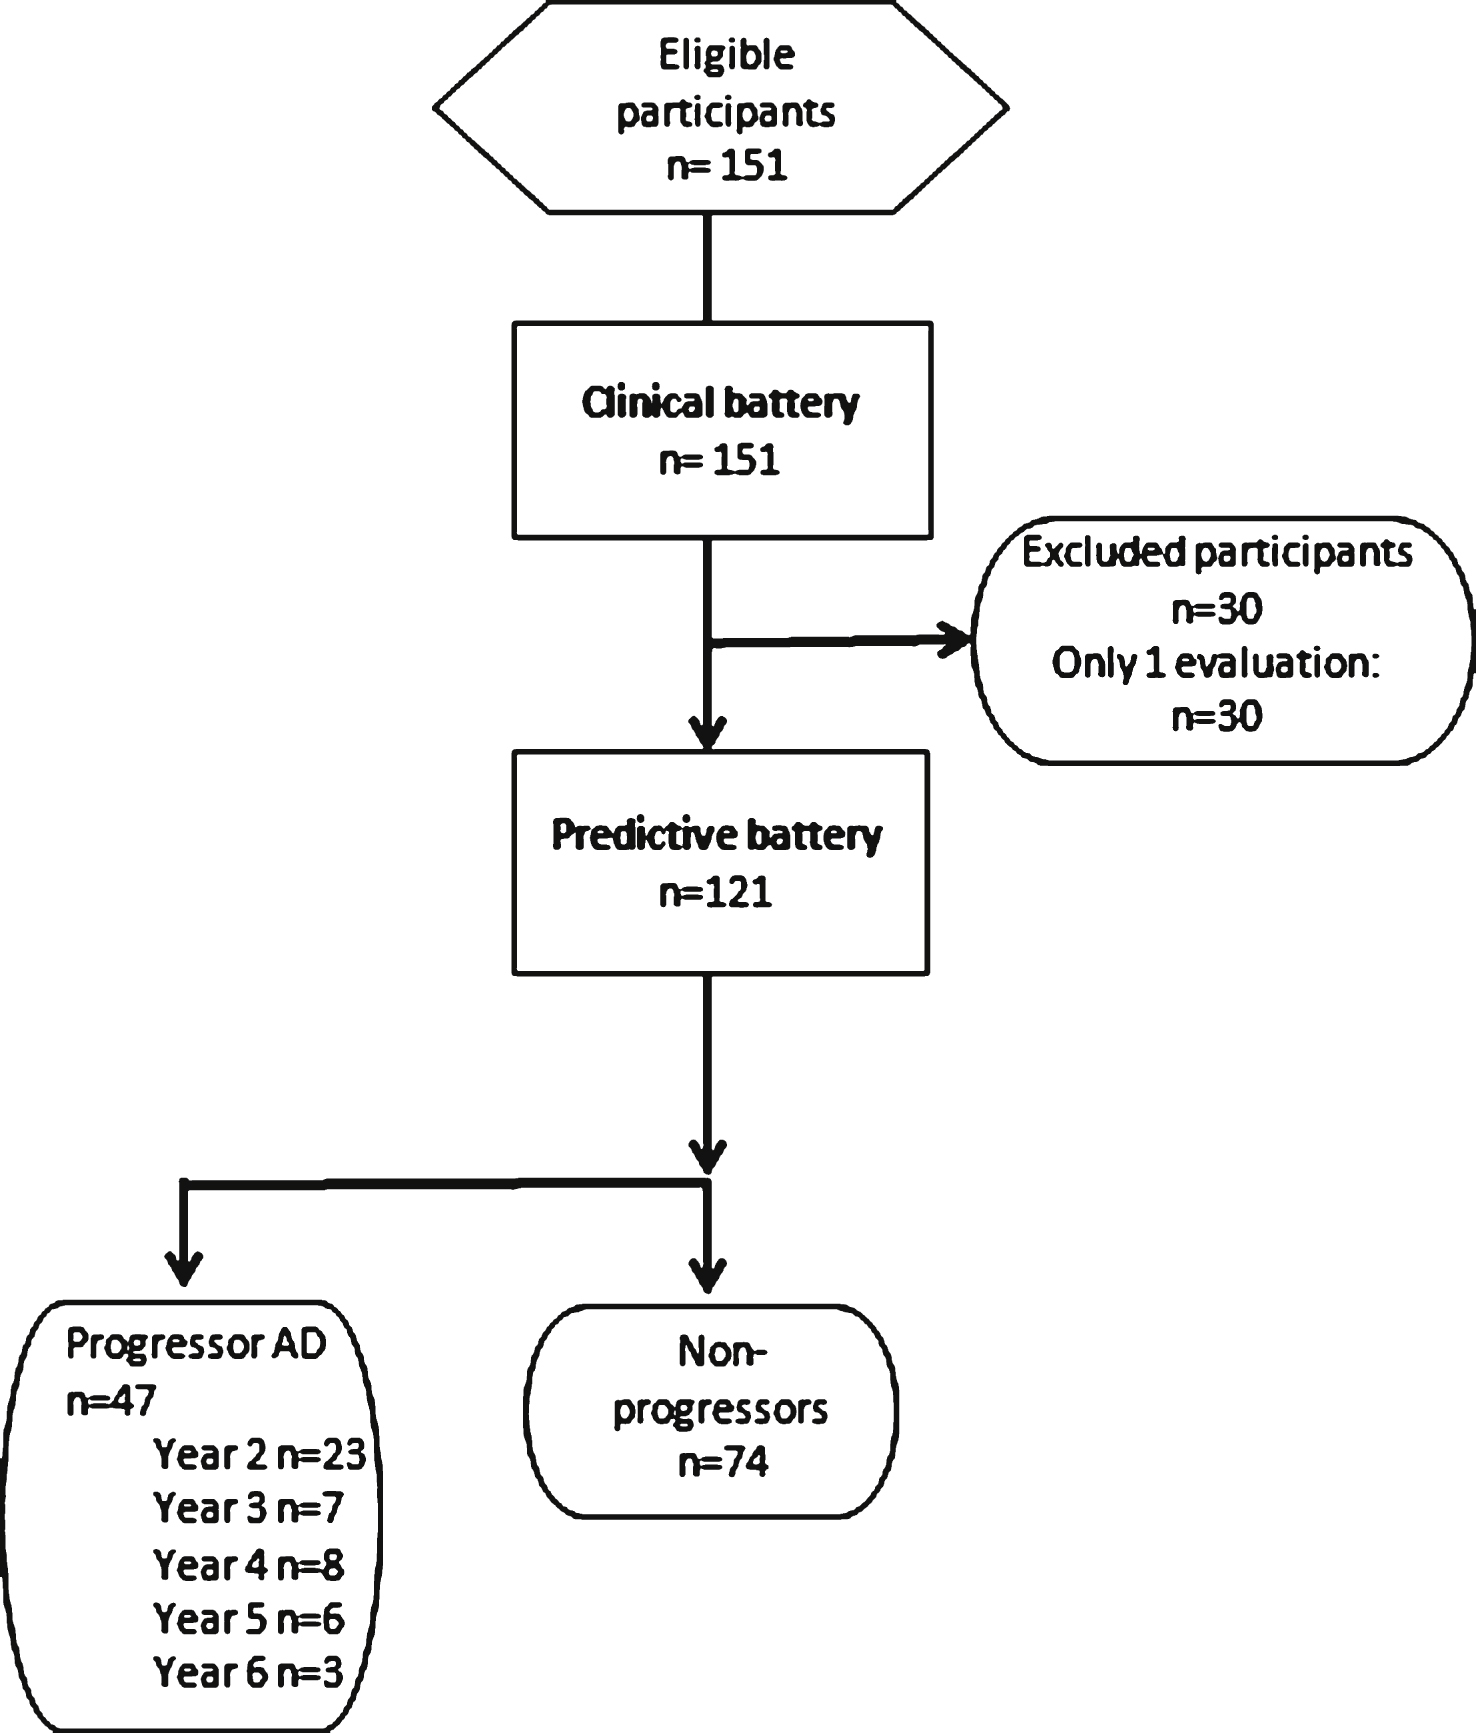
Fig.2
Performance on the RL/RI’s Immediate Words Recall as a function of time to diagnosis (for progressors) or on the last 5 cognitive assessments (for non-progressors). A linear function best describes the distribution for the progressors: black line. No significant model is found in the non-progressors: dotted grey line. The number of participants by group on each time point is presented. The shading area represents −1.5 and +1.5 SD of the mean performance of cognitively healthy older adults.
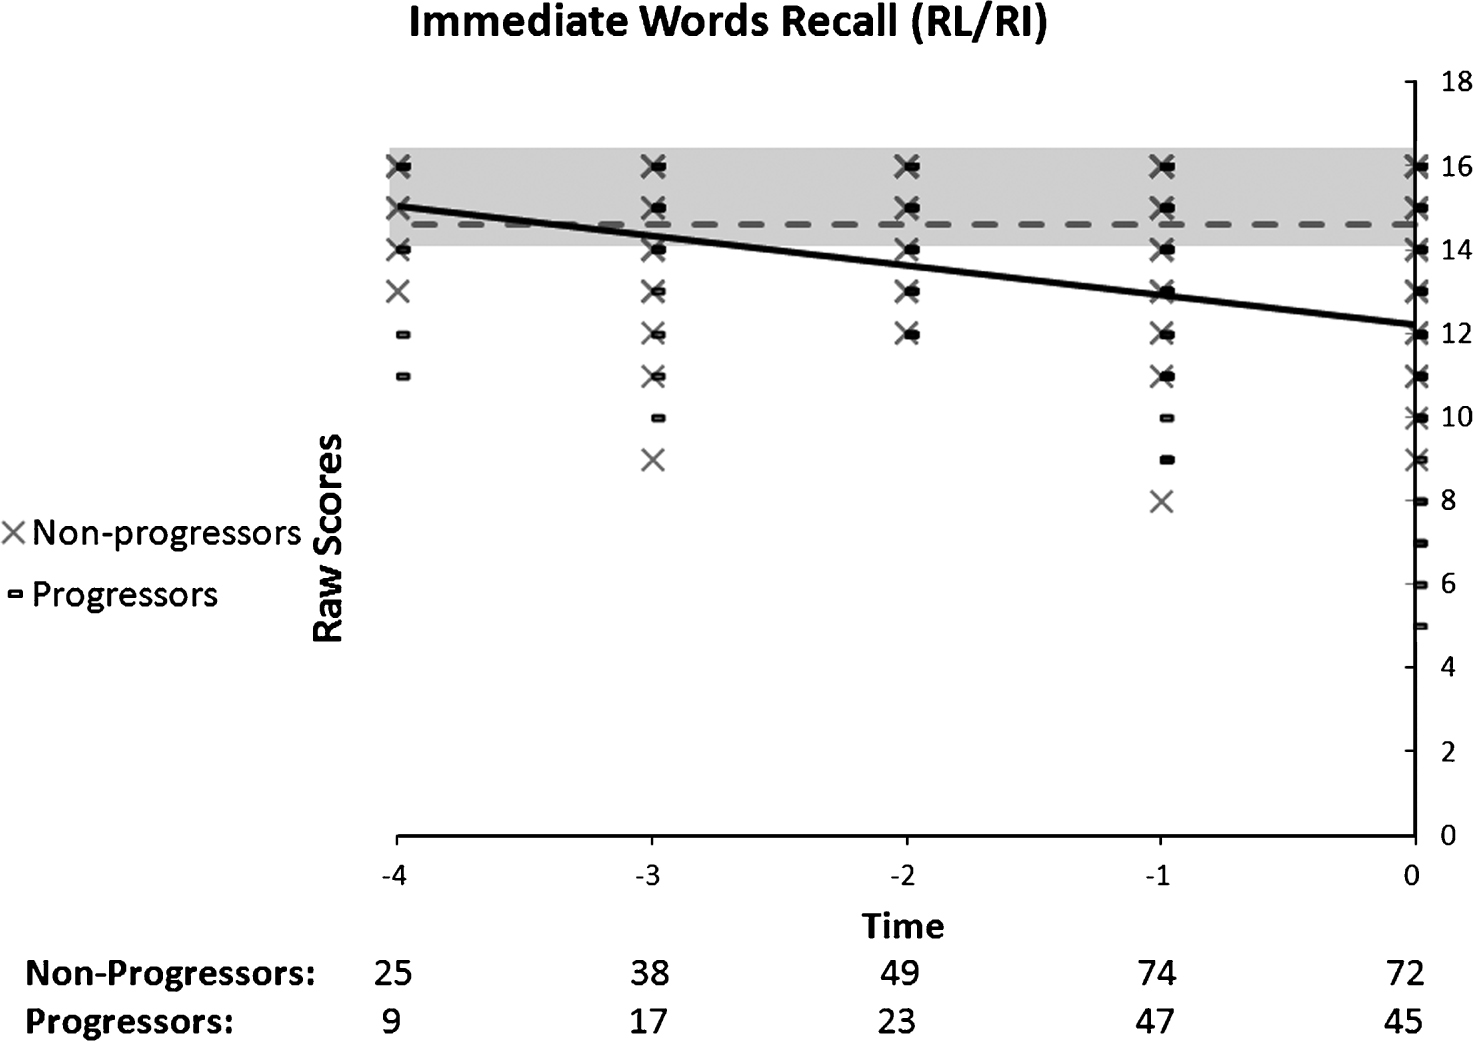
Fig.3
Performance on the RL/RI’s Delayed Words as a function of time to diagnosis (for progressors) or on the last 5 cognitive assessments (for non-progressors). A quadratic function best describes the distribution for the progressors: black line. No significant model is found in the non-progressors: dotted grey line.
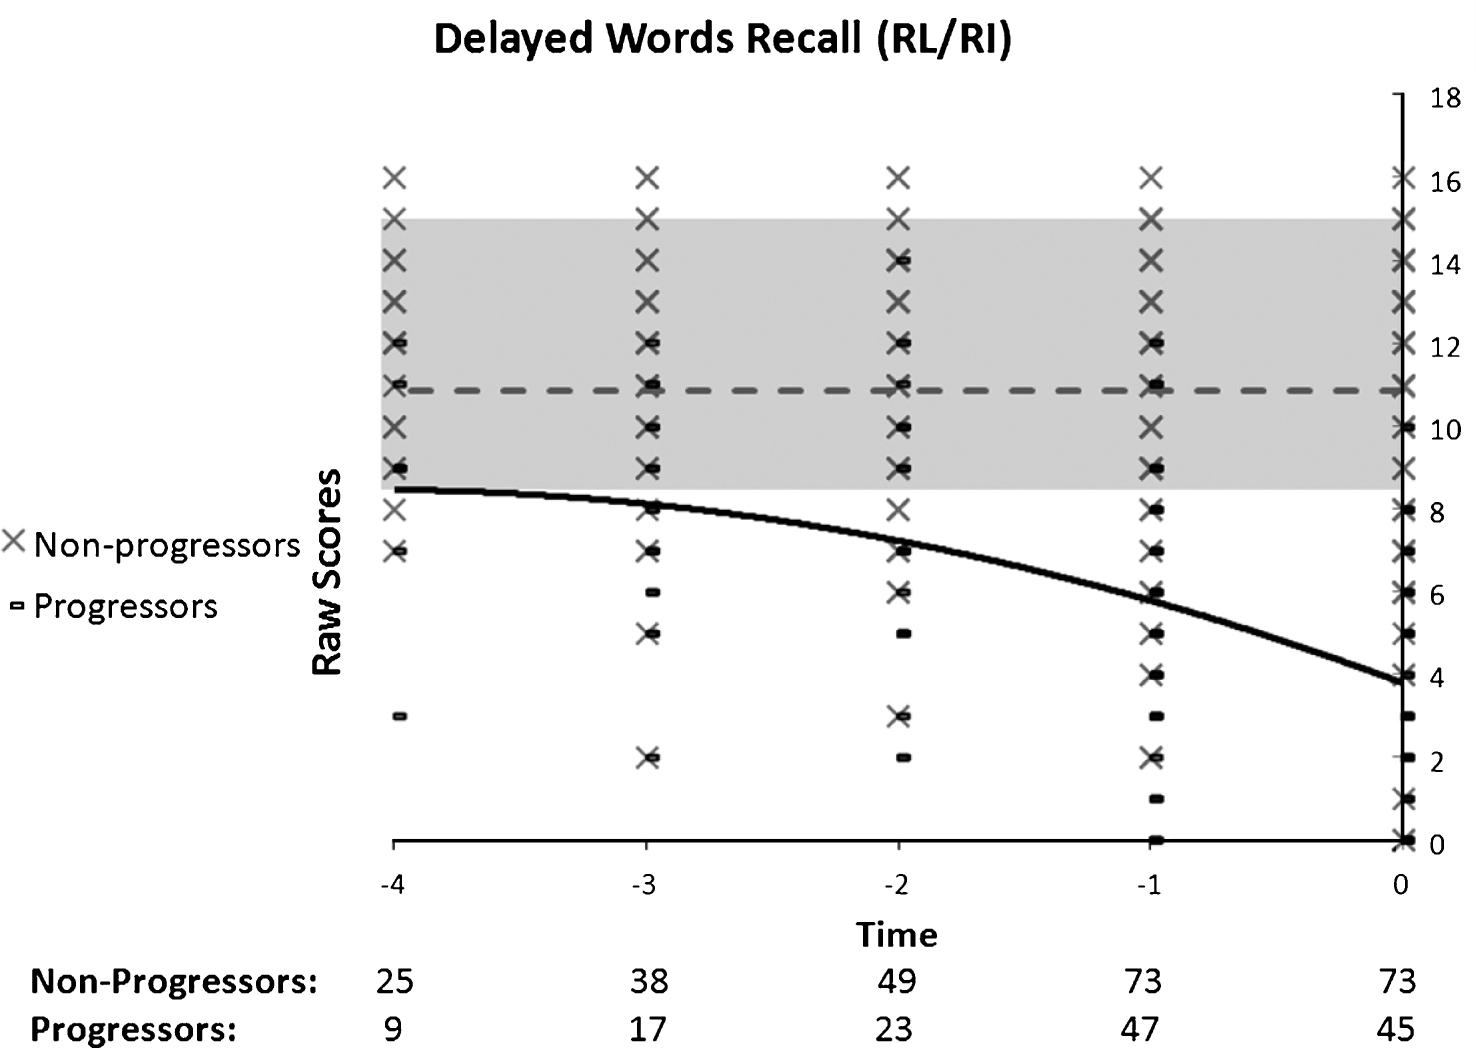
Fig.4
Performance on spatial memory as a function of time to diagnosis (for progressors) or on the last 5 cognitive assessments (for non-progressors). A quadratic function best describes the distribution for the progressors: black line. No significant model is found in the non-progressors: dotted grey line.
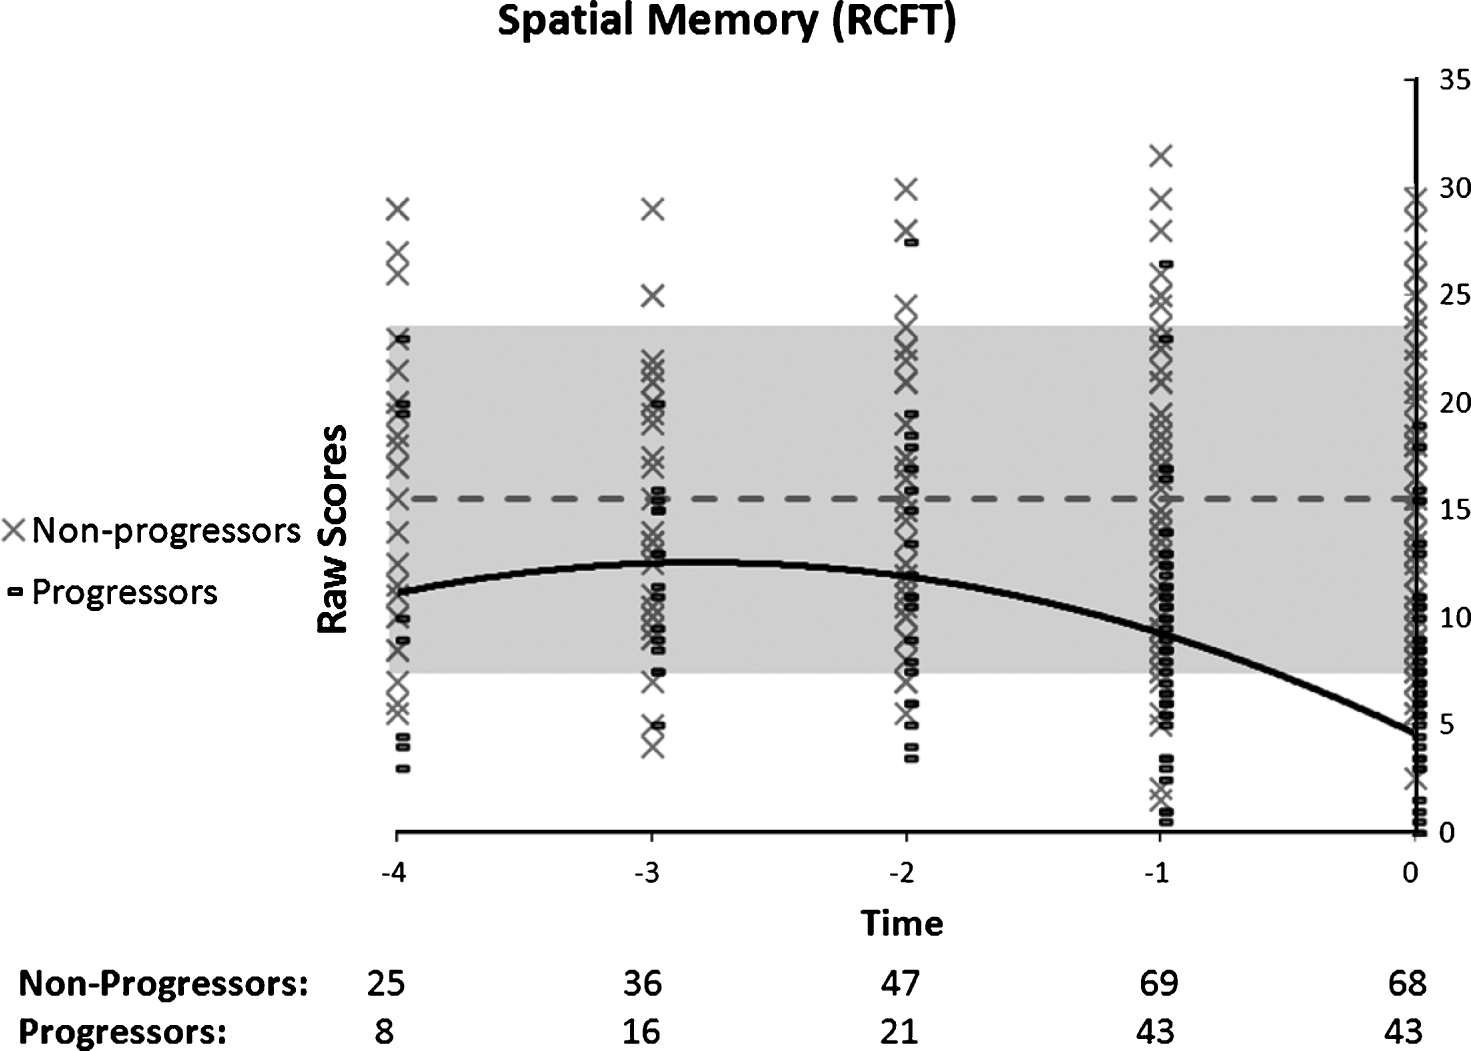
Fig.5
Performance on the inhibition component of the Stroop Test as a function of time to diagnosis (for progressors) or on the last 5 cognitive assessments (for non-progressors). A linear function best describes the distribution for the progressors: black line. No significant model is found in the non-progressors: dotted grey line.
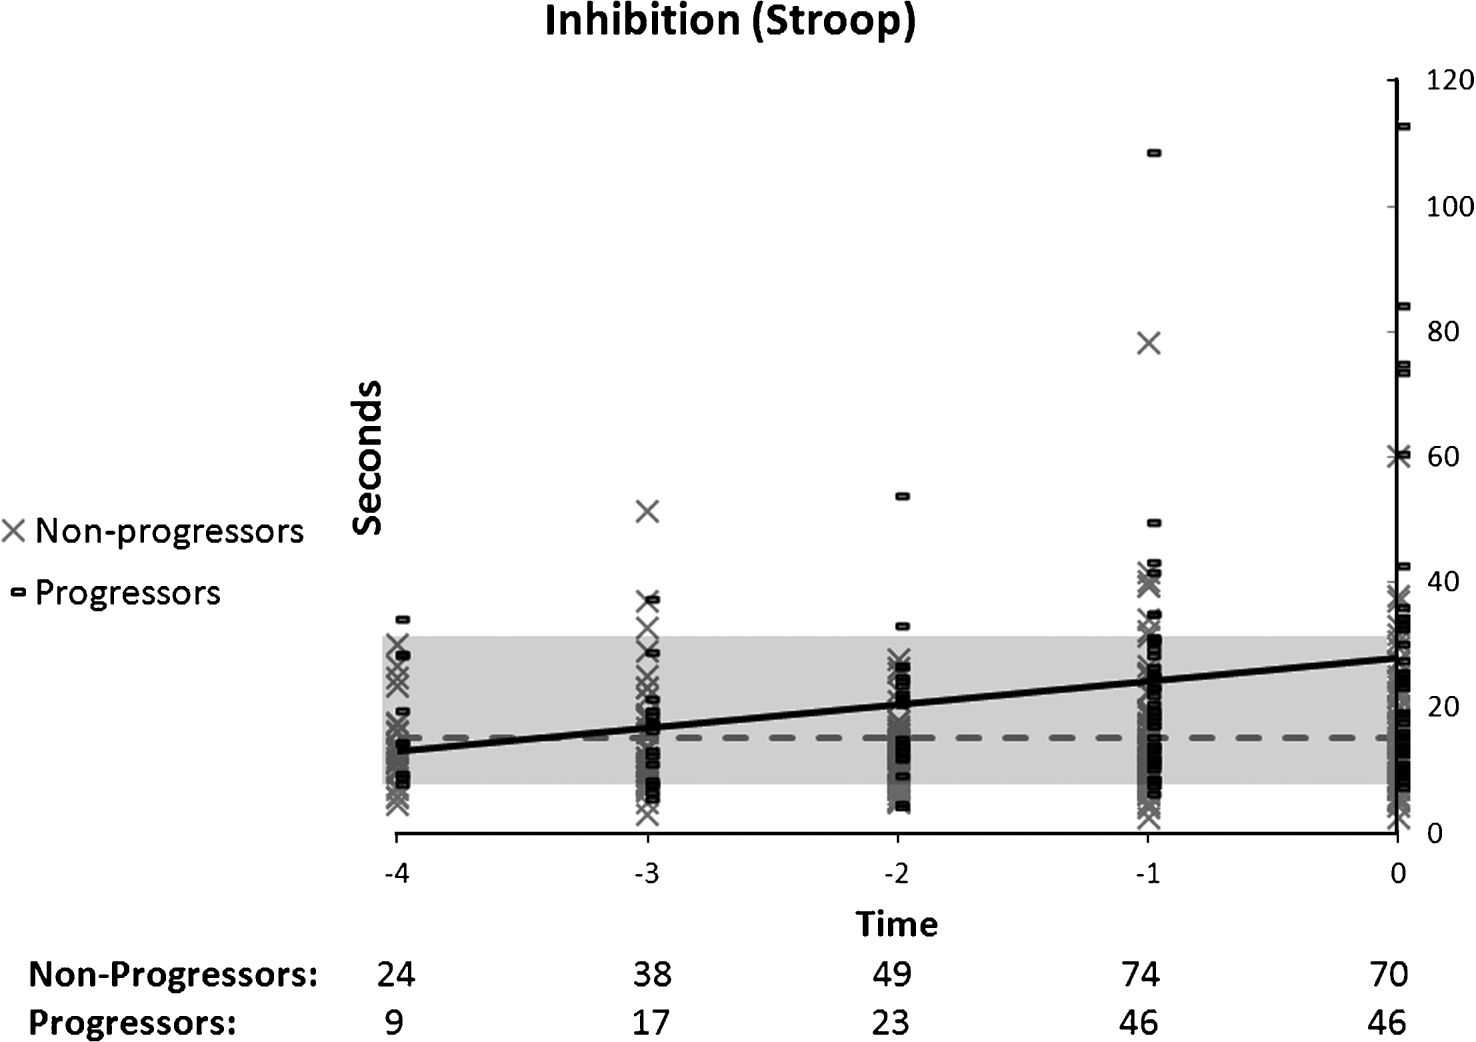
Fig.6
Performance on working memory (coding) as a function of time to diagnosis (for progressors) or on the last 5 cognitive assessments (for non-progressors). A quadratic function best describes the distribution for the progressors: black line. A linear function best describes the distribution for the non-progressors: dotted grey line.
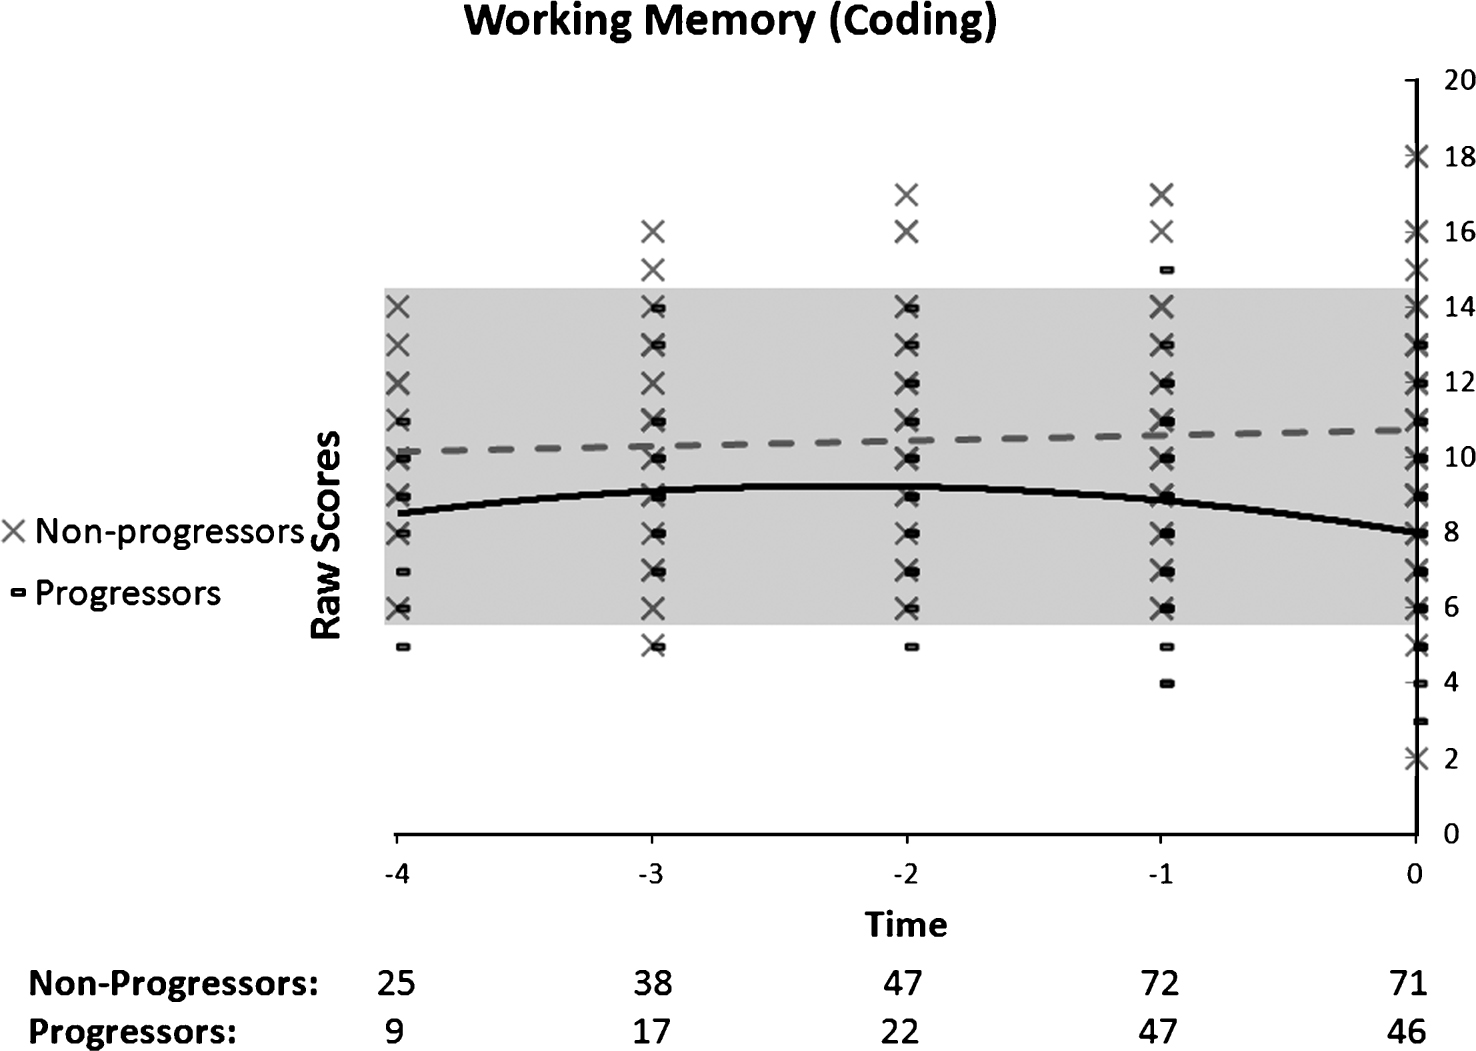
Fig.7
Performance on the Boston Naming Test as a function of time to diagnosis (for progressors) or on the last 5 cognitive assessments (for non-progressors). No significant model is found in the progressors: black line, or in the non-progressors: dotted grey line.
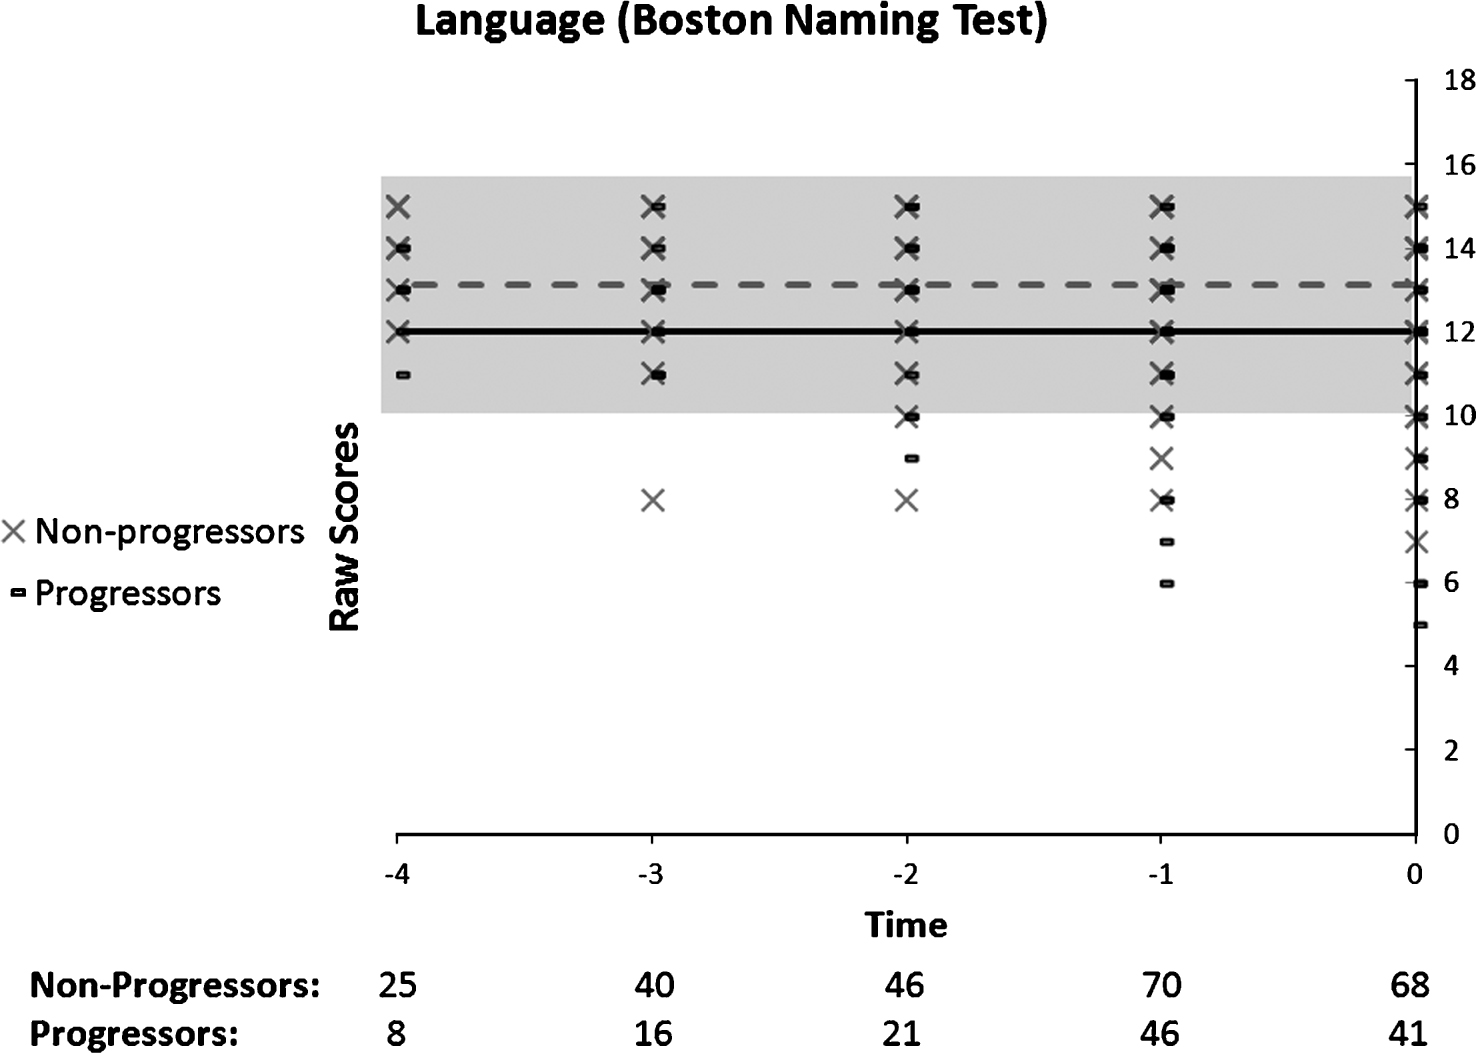
Fig.8
Performance on the Benton Judgment of Line Orientation as a function of time to diagnosis (for progressors) or on the last 5 cognitive assessments (for non-progressors). A linear function best describes the distribution for the progressors: black line. No significant model is found in the non-progressors: dotted grey line.
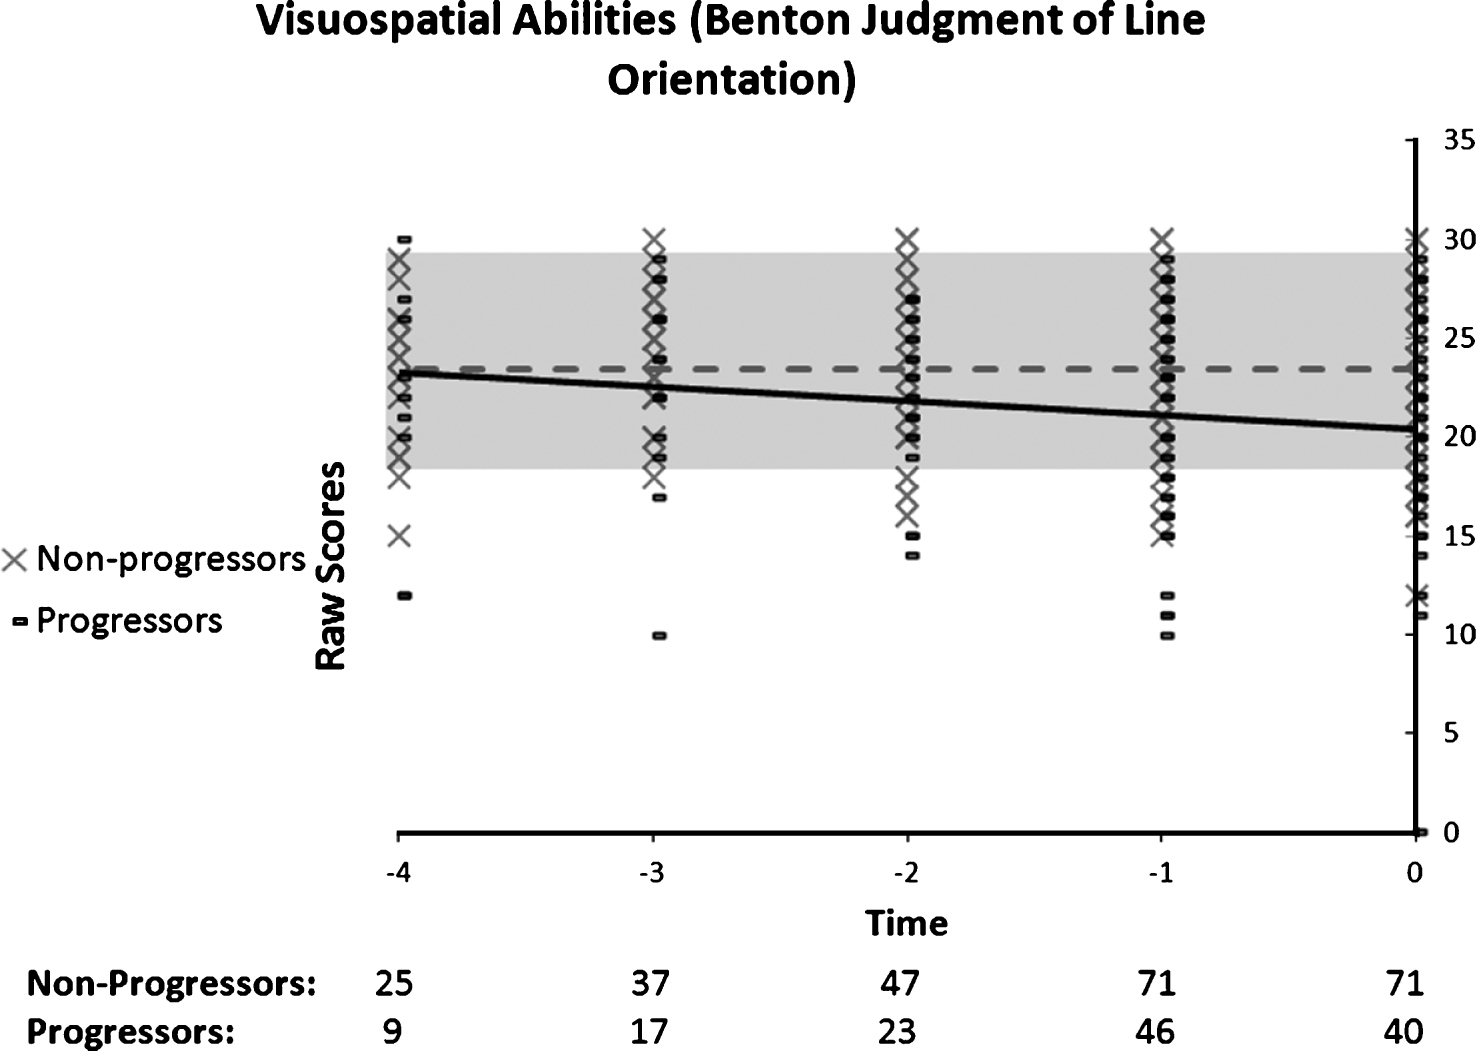
Table 1
Clinical and demographic characteristics (Mean, SD in parentheses)
| Non-progressors | Progressors | t/χ 2 | p | |
| Age | ||||
| At entry | 69.95 (8.68) | 71.47 (7.3) | −1 | 0.32 |
| On T0 | 73.38 (8.61) | 74.11 (7.27) | −0.49 | 0.63 |
| Years of education (mean and SD) | 14.61 (4.18) | 14.23 (4.09) | 0.48 | 0.63 |
| N (Men/Women) | 74 (30/44) | 47 (17/30) | 0.23 | 0.63 |
| Length of follow-up (months) | 35.85 (18.41) | 30.77 (19.57) | 1.45 | 0.15 |
| Geriatric Depression Scale | 14.93 (4.1) | 15.12 (2.78) | −0.26 | 0.79 |
| Mini-Mental State Examination | 27.96 (1.92) | 26.07 (2.6) | 4.24 | <0.01 |
| Mattis Dementia Rating Scale | 136.07 (5.79) | 126.17 (10.07) | 6.06 | <0.01 |
Table 2
Summary table for the polynomial regression analyses of performance in the non-progressors group
| Cognitive Test | Significant model | F value | p value |
| Episodic Memory | |||
| Immediate word recall | None | 2.65 | 0.11 |
| Delayed word recall | None | 0.30 | 0.59 |
| 3-minute delayed Figure recall | None | 0.82 | 0.37 |
| Executive functions | |||
| Stroop | None | 0.05 | 0.82 |
| Working Memory | |||
| Coding | Linear (positive) | 8.13 | 0.006 |
| Language/visuo-spatial | |||
| Boston Naming | None | 0.001 | 0.97 |
| Benton line orientation | None | 1.08 | 0.31 |
Table 3
Summary table for the polynomial regression analyses of performance in the progressor group
| Cognitive Test | Significant model | F value | p value | Beta |
| Episodic Memory | ||||
| Immediate word recall | Linear | 17.64 | <0.01 | −0.78 |
| Delayed word recall | Quadratic | 4.84 | 0.03 | −2.1 |
| 3-minute delayed Figure recall | Quadratic | 5.57 | 0.020 | −3.55 |
| Executive Functions | ||||
| Stroop | Linear | 4.53 | 0.035 | 2.45 |
| Working Memory | ||||
| Coding | Quadratic | 8.68 | 0.004 | −0.9 |
| Language/visuo-spatial | ||||
| Boston Naming | None | 2.67 | 0.11 | −0.44 |
| Benton line orientation | Linear | 6.7 | 0.02 | −1 |


