
The Association of Body Mass Index with Cognition and Alzheimer’s Disease Biomarkers in the Elderly with Different Cognitive Status: A Study from the Alzheimer’s Disease Neuroimaging Initiative Database
Abstract
Background:
The association of body mass index (BMI) with cognition and Alzheimer’s disease (AD) biomarkers of the elderly remains inconclusive.
Objective:
To investigate the relationship between BMI and cognition as well as AD biomarkers in the elderly with different cognitive status.
Methods:
Participants with cognitively normal (CN) were included as the CN group. Participants with mild cognitive impairment and mild dementia were included as the cognitive impairment (CI) group. The relationship between BMI and AD biomarkers (cerebrospinal fluid Aβ42 and p-tau181, hippocampal volume [HV]), global cognition (Mini-Mental State Examination [MMSE]), memory, and executive function were explored.
Results:
In the CI group, BMI was associated with MMSE (β= 0.03, p = 0.009), Aβ42 (β= 0.006, p = 0.029), p-tau181/Aβ42 ratio (β= -0.001, p = 0.011), and HV (β= 0.05, p < 0.001). However in the CN group, BMI exhibited associations with p-tau181 (β= 0.012, p = 0.014) and memory composite score (β= -0.04, p = 0.038), but not with p-tau181/Aβ42 ratio and HV. Moreover, mediation analysis showed that in the CI group, the positive effect of BMI on HV and MMSE score was partially mediated by diastolic blood pressure.
Conclusion:
The association of BMI with cognition and AD biomarkers varies across different cognitive status. In particular, a lower BMI was associated with worse cognition, higher Aβ burden, and lower HV in individuals with CI. Clinical practice should strengthen the monitoring and management of BMI in patients with AD.
INTRODUCTION
Alzheimer’s disease (AD) is the leading cause of dementia. Its pathological hallmark is the accumulation of amyloid-β (Aβ) senile plaques and hyperphosphorylated tau (p-tau) tangles [1]. The presence of Aβ and tau pathology can be detected by Aβ and tau positron emission tomography (PET), or through analysis of cerebrospinal fluid (CSF) biomarkers, including Aβ42 and p-tau181 [1]. Currently, available medications for dementia and AD have limited effectiveness and do not significantly alter the progression of the disease. However, research has shown that around a third of AD cases worldwide may be attributed to potentially modifiable risk factors [2]. This suggests that prevention strategies targeting such factors may be promising in reducing the risk of dementia and AD. Moreover, the FINGER clinical trial has demonstrated that targeting preventive interventions in individuals at risk of developing dementia from the general population could improve or maintain cognitive function [3]. Therefore, intervening on modifiable factors has emerged as an alternative strategy to reduce the risk of developing dementia and AD.
Late-life body mass index (BMI) is a well-known modifiable factor for many diseases [4]; however, its relationship with AD has always been controversial. Some studies have reported an association between higher BMI and an increased risk of AD [5, 6]. Conversely, other studies have suggested an association between higher BMI and a reduced risk of AD [7]. The underlying mechanisms by which BMI influences AD are unclear. Among these, the hippocampus may be an important factor linking BMI and AD [8]. Several studies found that late-life BMI has a different association with hippocampal volume (HV) depending on its corresponding cognition status. In individuals with cognitive impairment (CI), there was a positive association between BMI and HV [8]. Conversely, in individuals with cognitively normal (CN), BMI exhibited a negative correlation with HV [9]. CSF Aβ42 and p-tau181 are also important biomarkers of AD and are associated with HV [10]. Whether the relationship between BMI and other AD biomarkers (CSF Aβ42 and p-tau181) varies with cognitive status remains unknown.
Vascular risk factors (VRFs), an integral component of modifiable risk factors, which include diabetes mellitus, hypertension, and midlife obesity, can increase the risk of dementia, including AD [2]. However, recent investigations have shown that VRFs are not associated with AD pathology [11]. Lane et al. also found that VRFs, as indicated by the office-based Framingham Heart Study–cardiovascular risk (FHS) score, showed no association with the Aβ status detected by PET [12]. The FHS score is commonly used to assess the risk of cardiovascular disease, which includes the weighted contribution of BMI as a risk factor [13]. Due to the potential protective effect of late-life BMI on AD [14], is there a difference in the association between the FHS score (which does not include the weighted score of BMI) and AD pathology?
The APOE ɛ4 genotype is the strongest genetic risk factor for late-onset AD [15]. There is evidence to suggest that the effect of late-life BMI on AD biomarkers and cognition varies depending on APOE ɛ4 status [16, 17]. Blautzik et al. investigated the relationship between BMI and Aβ positivity in CN and mild cognitive impairment (MCI) individuals and found that in APOE ɛ4 carriers, BMI was negatively associated with Aβ burden in the cerebral cortex and recent cognitive function decline, whereas in non-carriers, BMI was not correlated with Aβ burden or cognitive performance [16]. However, they did not conduct subgroup analyses based on different cognitive groups. It was later further revealed that only in APOE ɛ4 carriers, a drop in BMI over five years strongly predicted cognitively healthy elders’ conversion to MCI or dementia [17]. To date, the effect of both APOE ɛ4 status and Aβ status on the relationship between BMI and AD biomarkers in individuals with different cognitive status remains unclear.
We investigated the relationship between late-life BMI and cognition as well as AD biomarkers across different cognitive status in the present study. We hypothesized that 1) the association of BMI with cognition and AD biomarkers varies across different cognitive status; 2) APOE ɛ4 and Aβ status might modify the relationship between BMI and AD biomarkers; 3) BMI may influence AD biomarkers and cognition through some intermediate variables; 4) FHS score without BMI (referred to as FHS1 score) in combination with both BMI and APOE ɛ4 status could improve the predictive accuracy for AD biomarkers.
MATERIALS AND METHODS
Alzheimer’s Disease Neuroimaging Initiative
The data used in this study were obtained from the Alzheimer’s Disease Neuroimaging Initiative (ADNI) database (http://adni.loni.usc.edu). The ADNI cohort was launched in 2003 as a public-private partnership, led by Principal Investigator Michael W. Weiner, MD. The primary goal of ADNI was to test whether serial magnetic resonance imaging (MRI), PET, other biological markers, and clinical and neuropsychological assessment could be integrated to measure the progression of MCI and early AD. For up-to-date information, see http://www.adni-info.org.
Standard protocol approval, registration, and patient consent
The ADNI study was approved by the institutional review boards of all participating institutions. Written informed consent was obtained from all the participants or their authorized representatives in accordance with the Declaration of Helsinki. The authors acquired consent from the ADNI Data Sharing and Publications Committee for data use and publication.
Participants’ inclusion and exclusion criteria
The detailed enrollment procedure and inclusion criteria for the various diagnostic categories in the ADNI cohort have been described previously [18]. In the present study, all participants had neuroimaging data, CSF biomarkers data, neuropsychological data, blood pressure data, and laboratory examination data at baseline and were followed up at 1-year and 2-year intervals after enrollment.
Participants with normal cognition (Clinical Dementia Rating [CDR] global score = 0) were included in the CN group. Participants with MCI (CDR global score = 0.5) and mild dementia (CDR global score = 1) were included in the CI group.
Additionally, we also required that participants with CN were in relatively good health, which means no significant white matter lesions or only mild white matter lesions, to represent the general population to some extent. Therefore, CN participants with a high white matter hyperintensities (WMH) burden were excluded. These individuals, who may have cerebral small vessel disease, do not strictly fall under the category of healthy participants. WMH volume (adjusted total Intracranial volume values) greater than 0.00321 was regarded as a high WMH burden [19]. Considering the relatively small number of participants with underweight (BMI < 18.5 kg/m2) and grade 3 obesity (BMI≥40 kg/m2), and the association of grade 3 obesity with increased mortality risk [20], we excluded participants with underweight and grade 3 obesity. According to the World Health Organization (WHO) criteria, participants were divided into three groups, normal weight (18.5≤BMI<25 kg/m2), overweight (25≤BMI<30 kg/m2), and obesity (30≤BMI<40 kg/m2).
Neuropsychological assessments
The neuropsychological assessments were performed by certified raters using standardized ADNI protocols (http://www.adni-info.org). Multiple scales were employed to assess cognitive functions, including the 13-item AD Assessment Scale-cognitive subscale (ADAS-cog 13), CDR, Mini-Mental State Examination (MMSE), ADNI memory composite score (ADNI-MEM) [21], and ADNI executive function score (ADNI-EF) [22]. The neuropsychological assessment data were obtained from the ADNI file (“MMSE.csv”, “CDR.csv”, “ADAS_ADNIGO23.csv”, “UWNPSYCHSUM.csv”). Cognitive decline was defined as the conversion of individuals with CN to MCI/dementia, and the conversion of individuals with MCI to dementia at the 2-year follow-up.
Neuroimaging data
MR examinations were performed according to the ADNI MRI scanning protocol (http://www.adni-info.org). All study participants who had a baseline brain MRI examination including T1-weighted, T2-weighted, and T2 fluid-attenuated inversion recovery sequences were included in the ADNI database. Four brain tissue (gray matter, white matter, CSF, and WMH) segmentation methods have been described previously, a thorough description can be found in the ADNI reference documentation “Four Tissue Segmentation in ADNI II”. The HV and WMH volume data was obtained from the ADNI file (“ADNI_UCD_WMH.csv”).
The detailed protocols for PET image acquisition have been outlined in previous studies [23]. This study used the following neuroimaging data extracted from the ADNI file (“ADNIMERGE.csv”): 1) average florbetapir (AV45) Standardized Uptake Value Ratio (SUVR) of the frontal cortex, parietal cortex, anterior cingulate cortex, and precuneus relative to the cerebellum; 2) average fluoro-2-deoxyglucose SUVR of bilateral angular gyrus, posterior cingular and inferior temporalgyrus. The threshold value for AV45 PET SUVR is 1.11 [24].
CSF data
The approach for CSF sample determination has been previously published, and the cutoff values for CSF biomarkers were defined as follows: Aβ42, 980 pg/mL; p-tau181, 21.8 pg/mL; total tau, 245 pg/mL; p-tau181/Aβ42, 0.021 [25]. In the present study, the Aβ and tau pathology (AT) classification was defined based on CSF Aβ42 and p-tau181 levels. The CSF data was obtained from the ADNI file (“UPENNBIOMK_MASTER.csv”, UPENNBIOMK9 batch).
Other assessments and data collection
Laboratory examination data was obtained from the ADNI file (“LABTESTS.csv”). APOE ɛ4 carrier status information was determined from the ADNI file (“APOERES.csv”). Participants with at least one copy of the APOE ɛ4 allele were considered as APOE ɛ4 carriers. The following data were collected from the clinical evaluation file (“ADNIMERGE.csv”, “RECMHIST.csv”, “VITALS.csv”): education years, current smoking, BMI (weight [kilograms]/height [meters] squared), use of antidementia and antihypertensive drugs, VRFs (hypertension and diabetes mellitus), systolic blood pressure (SBP), and diastolic blood pressure (DBP). We calculated the FHS score, which was a weighted sum of age, gender, SBP, antihypertensive medication use, diabetes mellitus status, current smoking, and BMI [13]. In addition, we calculated the FHS score without considering the weight of BMI, denoted as the FHS1 score.
Statistical analysis
The Shapiro-Wilk test was used for evaluating data distribution types. MMSE scores were z-transformed, and Aβ42 and p-tau181 levels were log-transformed before conducting regression analysis. Student’s t-test and one-way ANOVA with a Bonferroni correction for multiple comparisons were used to compare different groups in terms of normally distributed data. The chi-square test was used to compare the categorical variables, and the Kruskal-Wallis test was used to compare non-normally distributed continuous variables.
Cross-sectional analysis: 1) To assess the association of BMI and FHS1 score with AD biomarkers (including Aβ42, p-tau181, p-tau181/Aβ42 ratio, and HV), cognitive performance (including MMSE score, memory, and executive function), and outcome variables (including WMH burden, PET-defined Aβ status, p-tau181/Aβ42 ratio abnormal, CSF biomarker defined AT classification status, and whether cognitive decline), linear and logistic regression analyses were conducted, with BMI and FHS1 (or FHS) score serving as predictor variables. Multivariate linear or logistic regression analyses were adjusted for APOE ɛ4 status, and in the model with cognitive scores as the outcome variable, additional adjustments were made for educational years and the use of anti-dementia medications. Likelihood ratio tests were used to compare the performance of different models. Variance inflation factors were calculated to test the collinearity assumption, which was not violated. 2) To examine the potential interaction effects of BMI and APOE ɛ4 status (or Aβ status) on the outcome variables, linear regression analyses were performed by including the interaction term of BMI x ɛ4 status (or Aβ status). 3) To assess the mediating effects of intermediate variables on the relationship between BMI and AD biomarkers as well as cognition, mediation analyses were conducted. 4) To evaluate whether the performance of the combination model FHS1 + BMI+ɛ4 was superior to the models that used only the FHS score or FHS1 score in predicting AT classification status, Receiver Operating Characteristic (ROC) curves were employed.
Longitudinal data analyses: Linear mixed-effects models were used to investigate the longitudinal association of BMI with AD biomarkers and cognition, as these models can handle unbalanced and missing data effectively [26]. Longitudinal analyses were based on up to 2 years of follow-up. Random effects included intercept and slope nested within participants. Fixed effects included the main effects of APOE ɛ4 (or Aβ positive) status, BMI, interaction terms of APOE ɛ4 (or Aβ positive) status x BMI, and interaction terms of APOE ɛ4 (or Aβ positive) status x BMI x time. Likelihood ratio tests revealed that the model with the three-way interaction performed better than the model without the three-way interaction.
Statistical significance thresholds were set as two-tailed p-value<0.05. All statistical analyses were performed in R (version 4.2.2).
RESULTS
Demographic and clinical characteristics
Supplementary Figure 1 illustrated the screening process for the participants. Altogether 84 CN participants and 330 CI participants (316 cases of MCI, 14 cases of mild AD) were included in this study. There were no statistically significant differences in the demographic characteristics and VRFs between the CI and CN groups. Compared with the CN group, the CI group exhibited a higher rate of APOE ɛ4 carriers, lower Aβ42 levels, higher p-tau181 levels, lower HV, and poorer cognitive performance (Table 1). Additionally, compared to participants with normal weight and overweight, those with obesity were found to have higher DBP (Supplementary Table 1).
Table 1
Baseline characteristics of different cognitive groups
| Indicators | CI (n = 330) | CN (n = 84) | p |
| Population characteristics | |||
| Age | 71.8 (7.28) | 72.1 (5.67) | 0.64 |
| Gender (Female) | 143 (43.3%) | 38 (45.2%) | 0.849 |
| Education (y) | 16 [14;18] | 16 [15;19] | 0.209 |
| BMI (kg/m2) | 27.0 (3.91) | 27.5 (3.66) | 0.239 |
| SBP (mmHg) | 132 (16.5) | 133 (15.5) | 0.502 |
| DBP (mmHg) | 73.2 (9.57) | 73.3 (9.47) | 0.929 |
| Vascular risk factors | |||
| Hypertension | 137 (41.5%) | 33 (39.3%) | 0.805 |
| Diabetes mellitus | 41 (12.4%) | 9 (10.7%) | 0.809 |
| FHS score | 16 [14;19] | 17 [15;19] | 0.285 |
| FHS1 score | 16 [14;19] | 16 [14;18] | 0.469 |
| Accessory examination | |||
| Aβ42 (pg/mL) | 871 [653;1364] | 1618 [981;2011] | <0.001 |
| p-tau181 (pg/mL) | 24.4 [17.8;33.6] | 18.8 [14.8;24.4] | <0.001 |
| Hippocampus volume (ml) | 6.29 [5.70;6.94] | 6.68 [6.10;7.05] | 0.002 |
| WMH volume (ml) | 3.64 [1.58;8.42] | 1.89 [1.29;2.70] | <0.001 |
| Total brain volume (ml) | 1401 (138) | 1392 (136) | 0.569 |
| APOE ɛ4 carrier | 171 (51.8%) | 20 (23.8%) | <0.001 |
| Cognitive function | |||
| MMSE | 28 [26;29] | 30 [29;30] | <0.001 |
| CDRSB | 1.5 [1;2] | 0 [0;0] | <0.001 |
| ADAS-cog 13 | 15 [10;20] | 8 [5;12] | <0.001 |
| ADNI-Mem | 0.23 (0.72) | 1.20 (0.62) | <0.001 |
| ADNI-EF | 0.32 (0.89) | 1.18 (0.86) | <0.001 |
Data were presented as mean±SD, median (interquartile range), or count (percentage). CN, cognitively normal; CI, cognitive impairment; BMI, body mass index; SBP, systolic blood pressure; DBP, diastolic blood pressure; FHS score, Framingham Heart risk score; FHS1 score, FHS score did not include body mass index; WMH, white matter hyperintensities; MMSE, Mini-Mental State Examination; CDRSB, Clinical Dementia Rating Scale Sum of Boxes; ADAS-cog 13, Alzheimer’s Disease Assessment Scale-cognitive subscale 13 item; ADNI-Mem, memory composite score; ADNI-EF, executive function score.
The relationship between BMI and cognition, AD biomarkers, and clinical outcomes in different cognitive status
As shown in Table 2, in the analysis involving CI participants, multivariate linear regression revealed BMI was associated with MMSE score (β= 0.03, p = 0.009), HV (β= 0.05, p < 0.001), Aβ42 (β= 0.006, p = 0.029), p-tau181/Aβ42 ratio (β= -0.001, p = 0.011), and p-tau181 levels with a borderline significance (p = 0.077). Although no association was found between BMI and memory composite score, when BMI was categorized (normal weight, overweight, obesity), there was an association between obesity and higher memory composite score (Supplementary Table 2, p = 0.037). In the analysis comprising CN participants, multivariate linear regression revealed that BMI was associated with memory composite score (β= -0.04, p = 0.038), Aβ42 (β= 0.016, p = 0.011), p-tau181 (β= 0.012, p = 0.014), and MMSE score with a borderline significant (β= -0.02, p = 0.076). However, no significant association was found between BMI and p-tau181/Aβ42 ratio (p = 0.422). When BMI was categorized, there was an association between obesity and lower memory composite scores (Supplementary Table 2, p = 0.041).
Table 2
Body mass index predicts Alzheimer’s disease biomarkers and cognition
| Variables | CI (n = 330) | CN (n = 84) | ||
| Biomarkers | β (95% CI) | p | β (95% CI) | p |
| Hippocampal volume | 0.05 (0.02, 0.07) | <0.001 | 0.03 (-0.02, 0.08) | 0.216 |
| Aβ42 | 0.006 (0.001, 0.012) | 0.029 | 0.016 (0.004, 0.029) | 0.011 |
| p-tau181 | -0.005 (-0.01, 0.001) | 0.077 | 0.012 (0.003, 0.022) | 0.014 |
| p-tau181/Aβ42 | –0.001 (–0.0017, –0.0002) | 0.011 | –0.0003 (–0.001,0.001) | 0.422 |
| Cognition | ||||
| MMSE | 0.03 (0.01, 0.05) | 0.009 | -0.02 (–0.05, 0.002) | 0.076 |
| ADNI-MEM | 0.01 (–0.01, 0.03) | 0.26 | -0.04 (–0.07, –0.002) | 0.038 |
| ADNI_EF | 0.10 (–0.01, 0.03) | 0.41 | -0.01 (–0.06,0.04) | 0.754 |
CN, cognitively normal; CI, cognitive impairment; FHS score, Framingham risk score; FHS1 score, Framingham risk score did not include body mass index; BMI, body mass index; MMSE, Mini-Mental State Examination; ADNI-MEM, ADNI memory composite score; ADNI-EF, executive function score. MMSE score has been z-transformed. Multivariate linear regression was constructed with BMI and FHS1 score as predictors, adjusting for APOE ɛ4 status.
Fig. 1
Analysis of outcome variables across different groups. CN, cognitively normal; CI, cognitive impairment; FHS1 score, Framingham risk score did not include body mass index; BMI, body mass index. (1) represents univariate logistic regression, and (2) represents multivariate logistic regression. Multivariate linear regressions predict variables including FHS1 score, BMI, and APOE ɛ4 status. The coding for the AT classification was as follows: CSF Aβ42 (+) and p-tau181 (+) were coded as 1, while others were coded as 0.
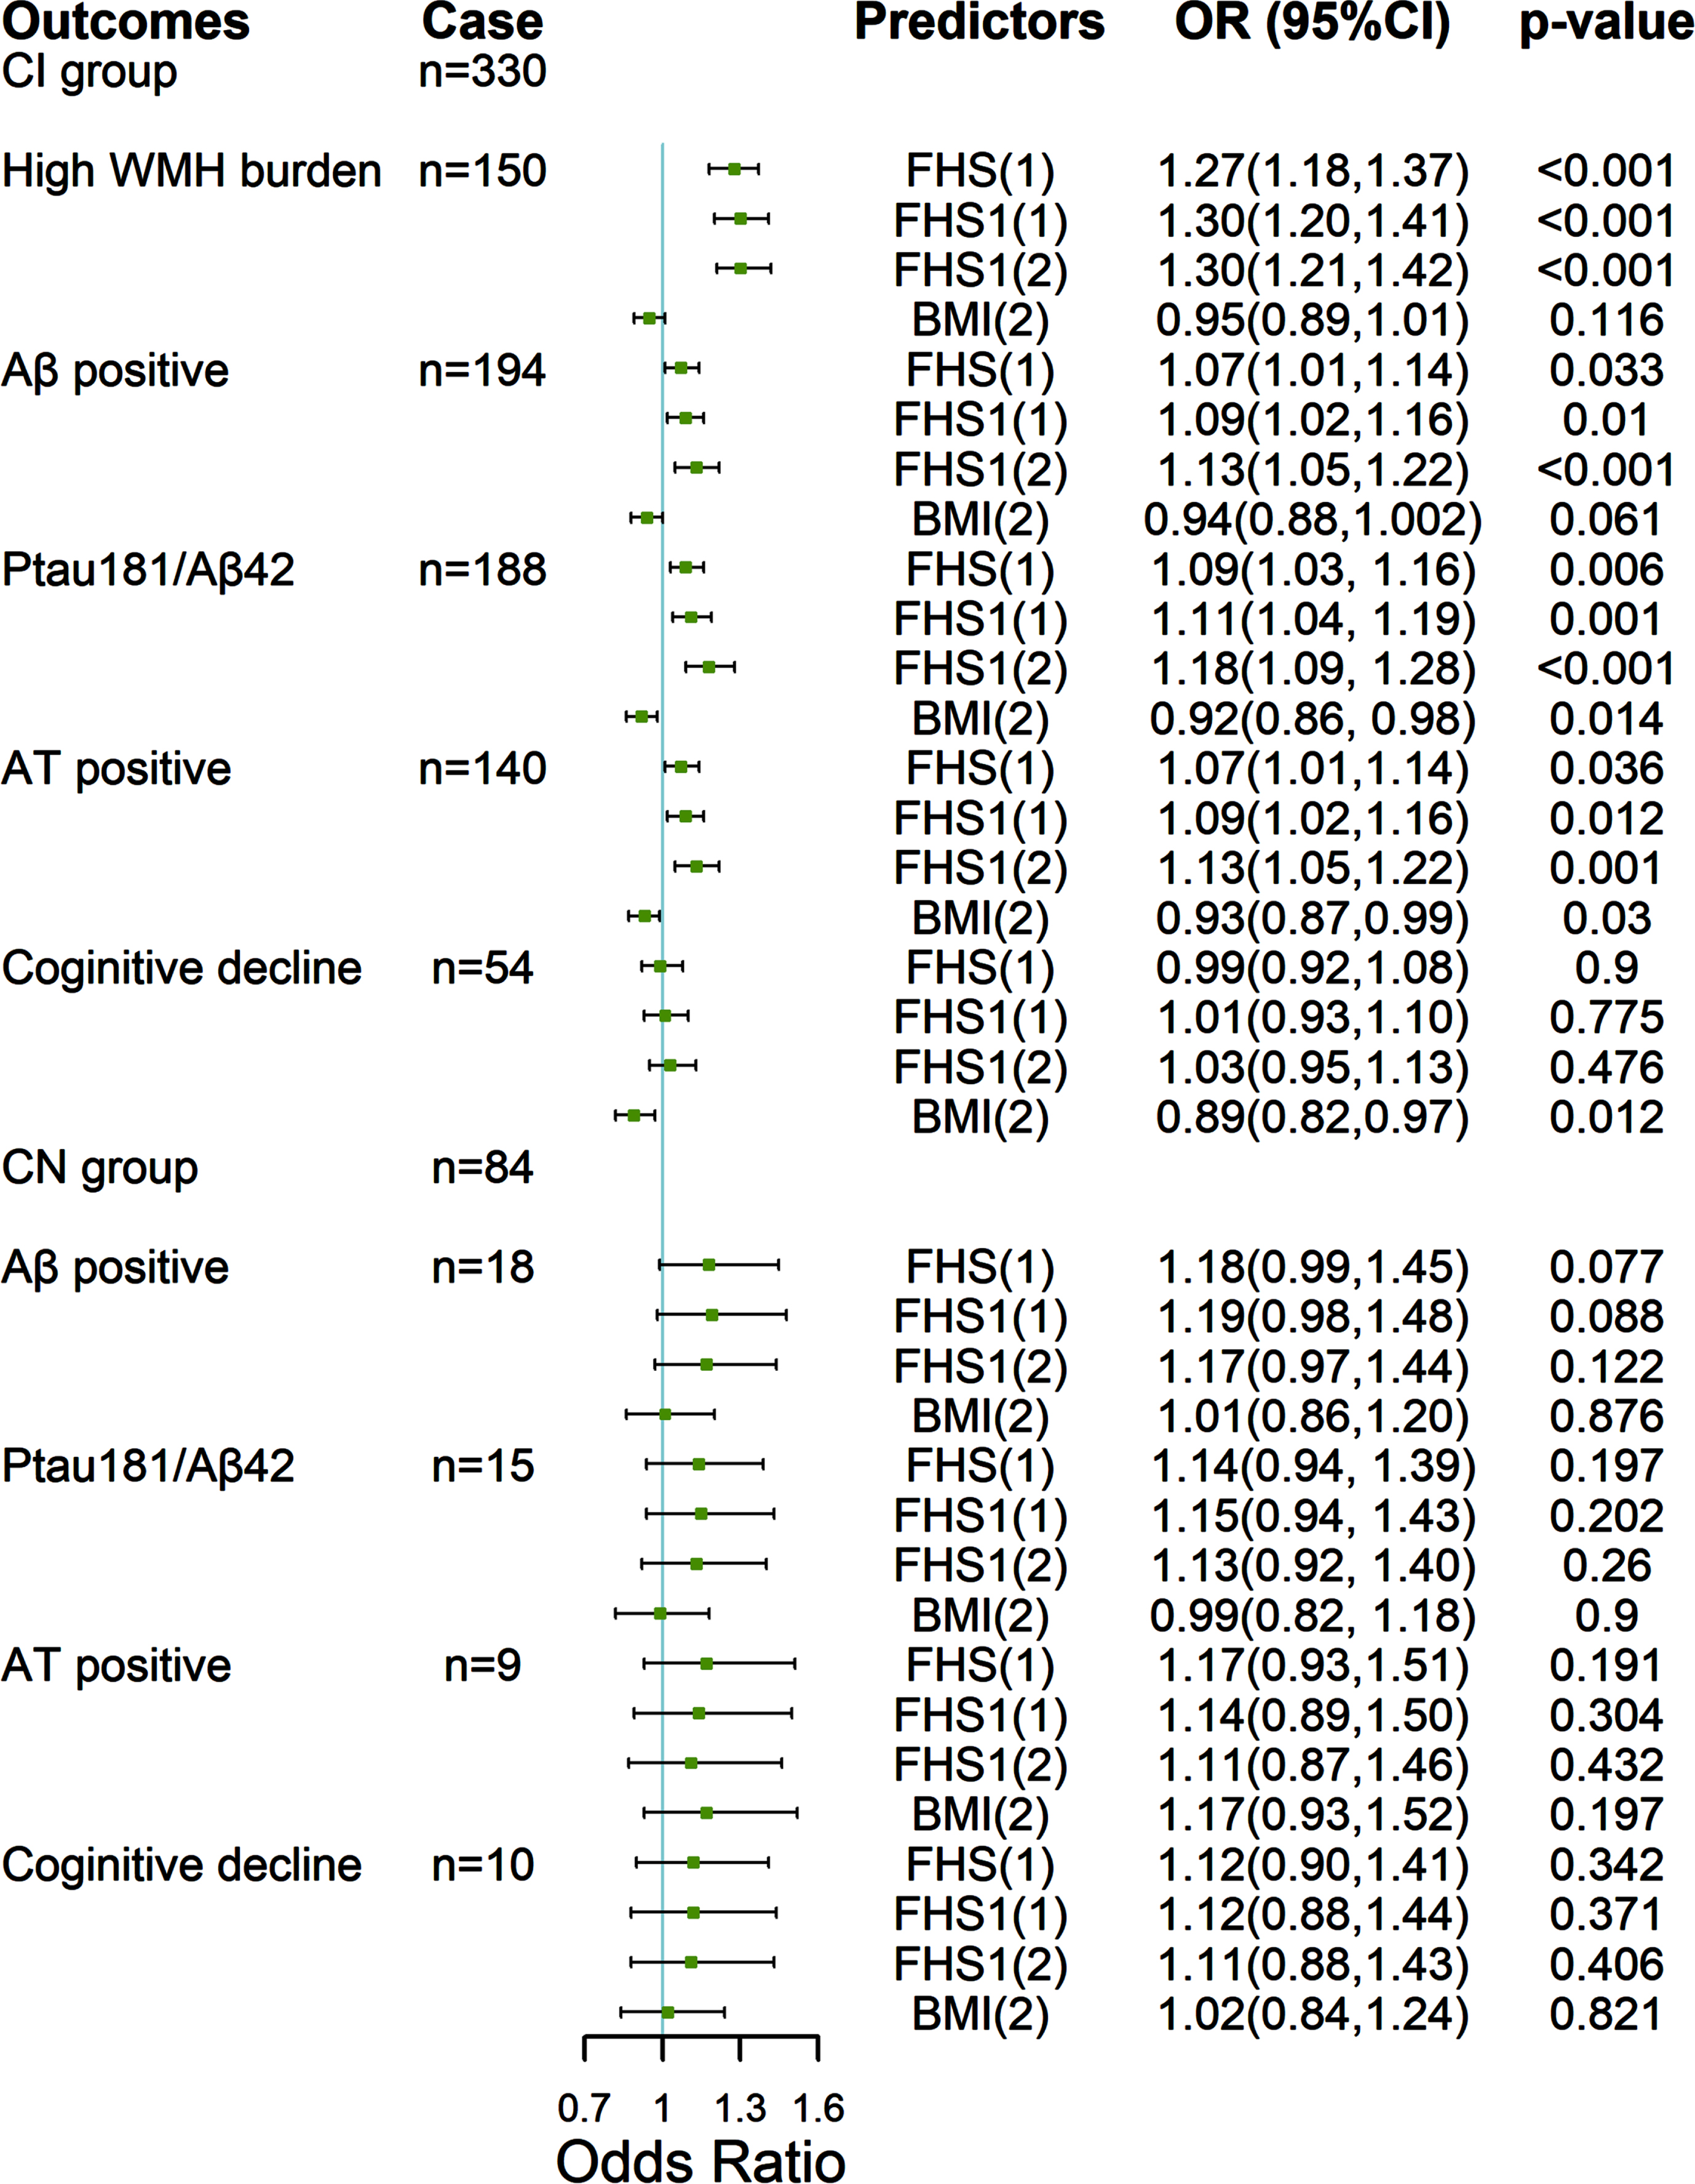
As depicted in Fig. 1, in the analysis involving CI participants, multivariate logistic regression revealed a higher BMI was associated with lower odds of AT classification positive status (CSF biomarker defined Aβ and p-tau181 positive, odds ratio [OR] 0.93, 95% confidence interval [CI] 0.87 to 0.99, p = 0.03), p-tau181/Aβ42 ratio abnormal (OR 0.92, 95% CI 0.86 to 0.98, p = 0.014), cognitive decline (OR 0.89, 95% CI 0.82 to 0.97, p = 0.012), and Aβ positive status (PET-defined) with a borderline significance (p = 0.061). In the analysis comprising CN participants, there was no significant association between BMI and outcome variables.
The effect of BMI on MMSE score and HV in different APOE ɛ4 and Aβ status
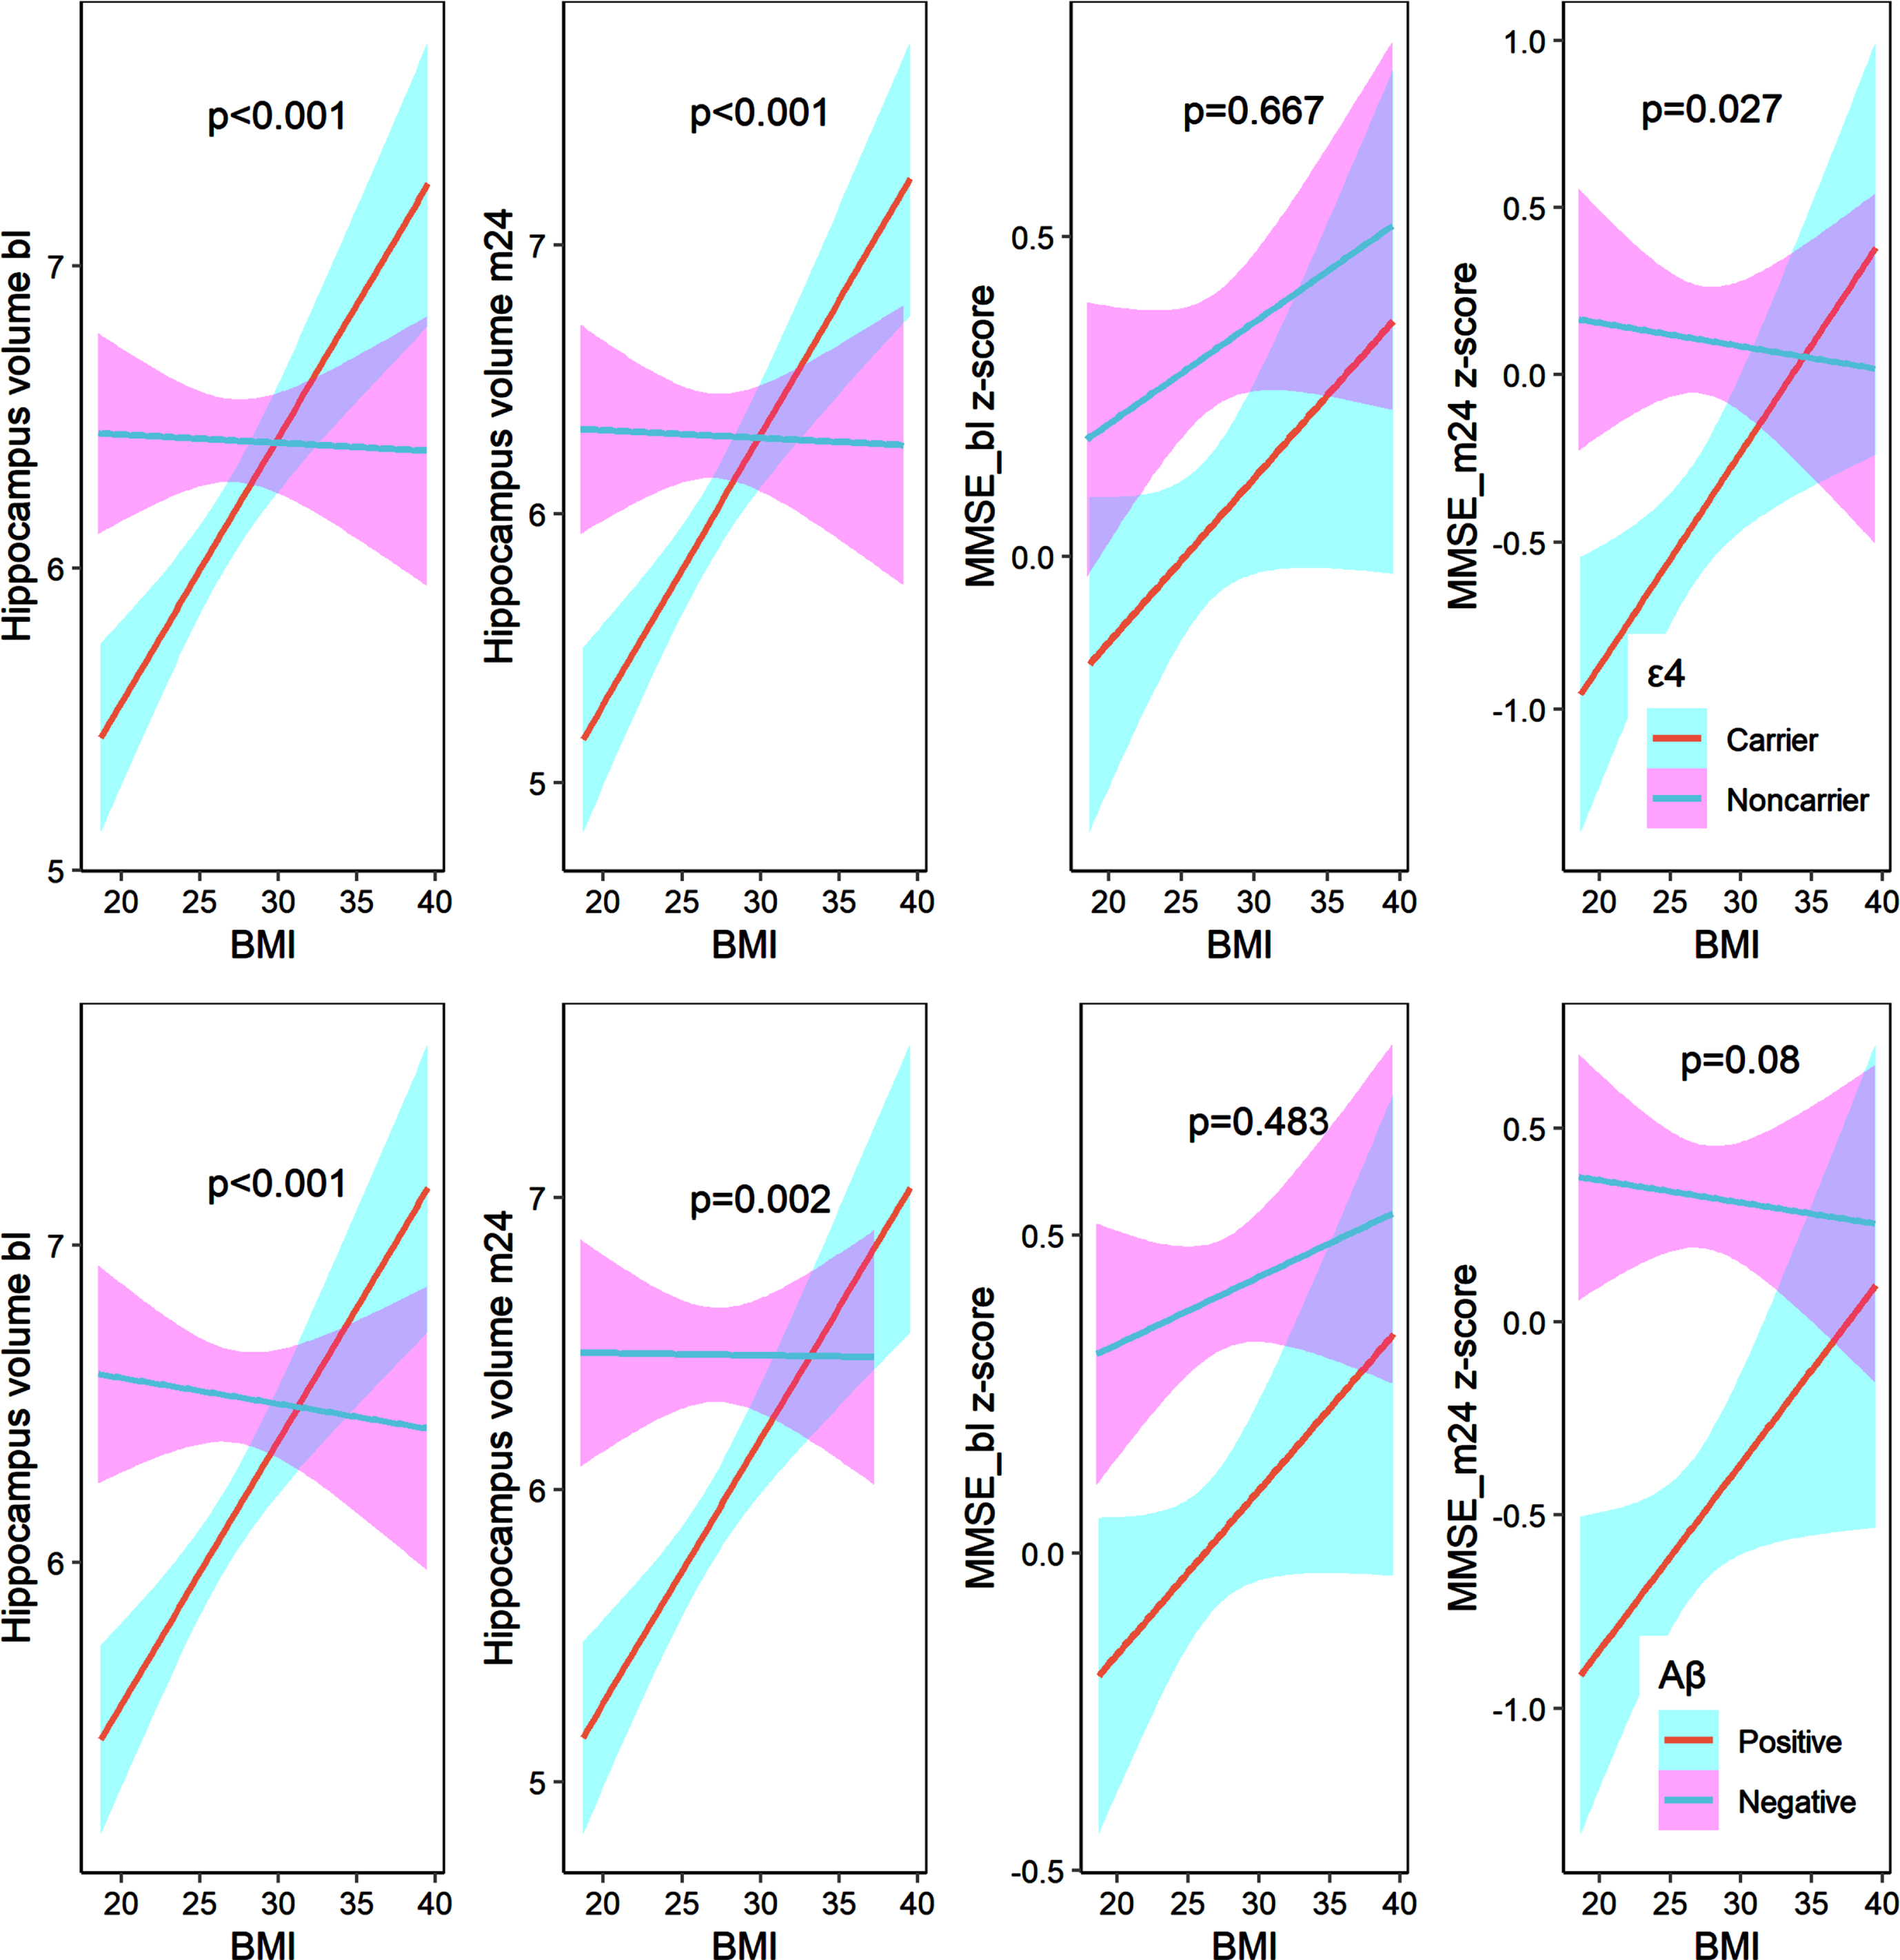
In the CI group, APOE ɛ4 carriers with a higher BMI exhibited higher baseline HV, 2-year HV, and 2-year MMSE score. Non-carriers showed no significant association between BMI and HV or MMSE score. There was a significant difference in the association of BMI with baseline HV, 2-year HV, and 2-year MMSE score between APOE ɛ4 carriers and non-carriers (Fig. 2, p < 0.05). Similarly, Aβ positive individuals with a higher BMI exhibited higher baseline HV, 2-year HV, and 2-year MMSE score. Aβ negative individuals showed no significant association between BMI and HV or MMSE score. There was a significant difference in the association of BMI with baseline HV and 2-year HV between Aβ positive and Aβ negative individuals (p < 0.05).
Fig. 2
The effect of body mass index on hippocampal volume and MMSE score in the cognitive impairment group. MMSE score has been z-transformed. The definition of Aβ positive was based on the Aβ PET. The linear models were adjusted for the FHS1 score.
We further investigated the effect of BMI on HV and MMSE score in different APOE ɛ4 status and Aβ status (ɛ4-β-, ɛ4+β-, ɛ4-β+, ɛ4+β+) in the CI group. We found that the effect of BMI on the baseline and 2-year HV, as well as the 2-year MMSE score, differed significantly between ɛ4+β+and ɛ4-β- individuals. Additionally, the effect of BMI on HV differed significantly between ɛ4+β+individuals and both ɛ4+β- and ɛ4-β+individuals (Supplementary Figure 2).
However, in the CN group, we did not observe any significant differences in the effect of BMI on HV or MMSE score between APOE ɛ4 carriers and non-carriers, or between Aβ positive and Aβ negative individuals (Supplementary Figure 3).
To validate the different effects of BMI on MMSE score and HV under different APOE ɛ4 and Aβ status, we performed a longitudinal data analysis. The data from participants in the CI group were analyzed using linear mixed-effects models at baseline, 1-year follow-up, and 2-year follow-up (Table 3). The interaction effect of BMI and APOE ɛ4 status (or Aβ status) was positively associated with the HV (p < 0.001). The interaction effect of BMI x APOE ɛ4 status x time was positively associated with the MMSE score (p = 0.009).
Table 3
Linear mixed-effects model predicts hippocampus volume and MMSE score
| Hippocampus volume | MMSE z-score | |||
| Predictors | Estimate | p | Estimate | p |
| Fixed effects: covariates | ||||
| Aβ status | –2.63 | <0.001 | –0.55 | 0.319 |
| BMI | 0.001 | 0.966 | 0.015 | 0.315 |
| APOE ɛ4 | –0.08 | 0.476 | –0.126 | 0.144 |
| FHS1 score | –0.04 | 0.009 | –0.023 | 0.038 |
| Aβ status:BMI | 0.09 | <0.001 | 0.011 | 0.581 |
| Aβ status:BMI:time | –0.001 | 0.626 | 0.022 | 0.096 |
| Fixed effects: covariates | ||||
| APOE ɛ4 | –2.408 | <0.001 | –0.035 | 0.949 |
| BMI | 0.006 | 0.728 | 0.022 | 0.113 |
| Aβ status | –0.162 | 0.141 | –0.256 | 0.006 |
| FHS1 score | –0.04 | 0.004 | –0.024 | 0.032 |
| APOE ɛ4:BMI | 0.082 | <0.001 | –0.003 | 0.859 |
| APOE ɛ4:BMI:time | 0.005 | 0.055 | 0.035 | 0.009 |
MMSE, Mini-Mental State Examination; FHS1 score, Framingham risk score did not include body mass index; BMI, body mass index. The linear mixed-effects model with hippocampus volume as the outcome variable was constructed using BMI x Aβ status (or APOE status) x time as the variable of interest and adjusting for FHS1 score and APOE status (or Aβ status). The linear mixed-effects model with MMSE score as the outcome variable was constructed using BMI x Aβ status (or APOE status) x time as the variable of interest and adjusting for FHS1 score, APOE ɛ4 status (or Aβ status), and the use of anti-dementia medications.
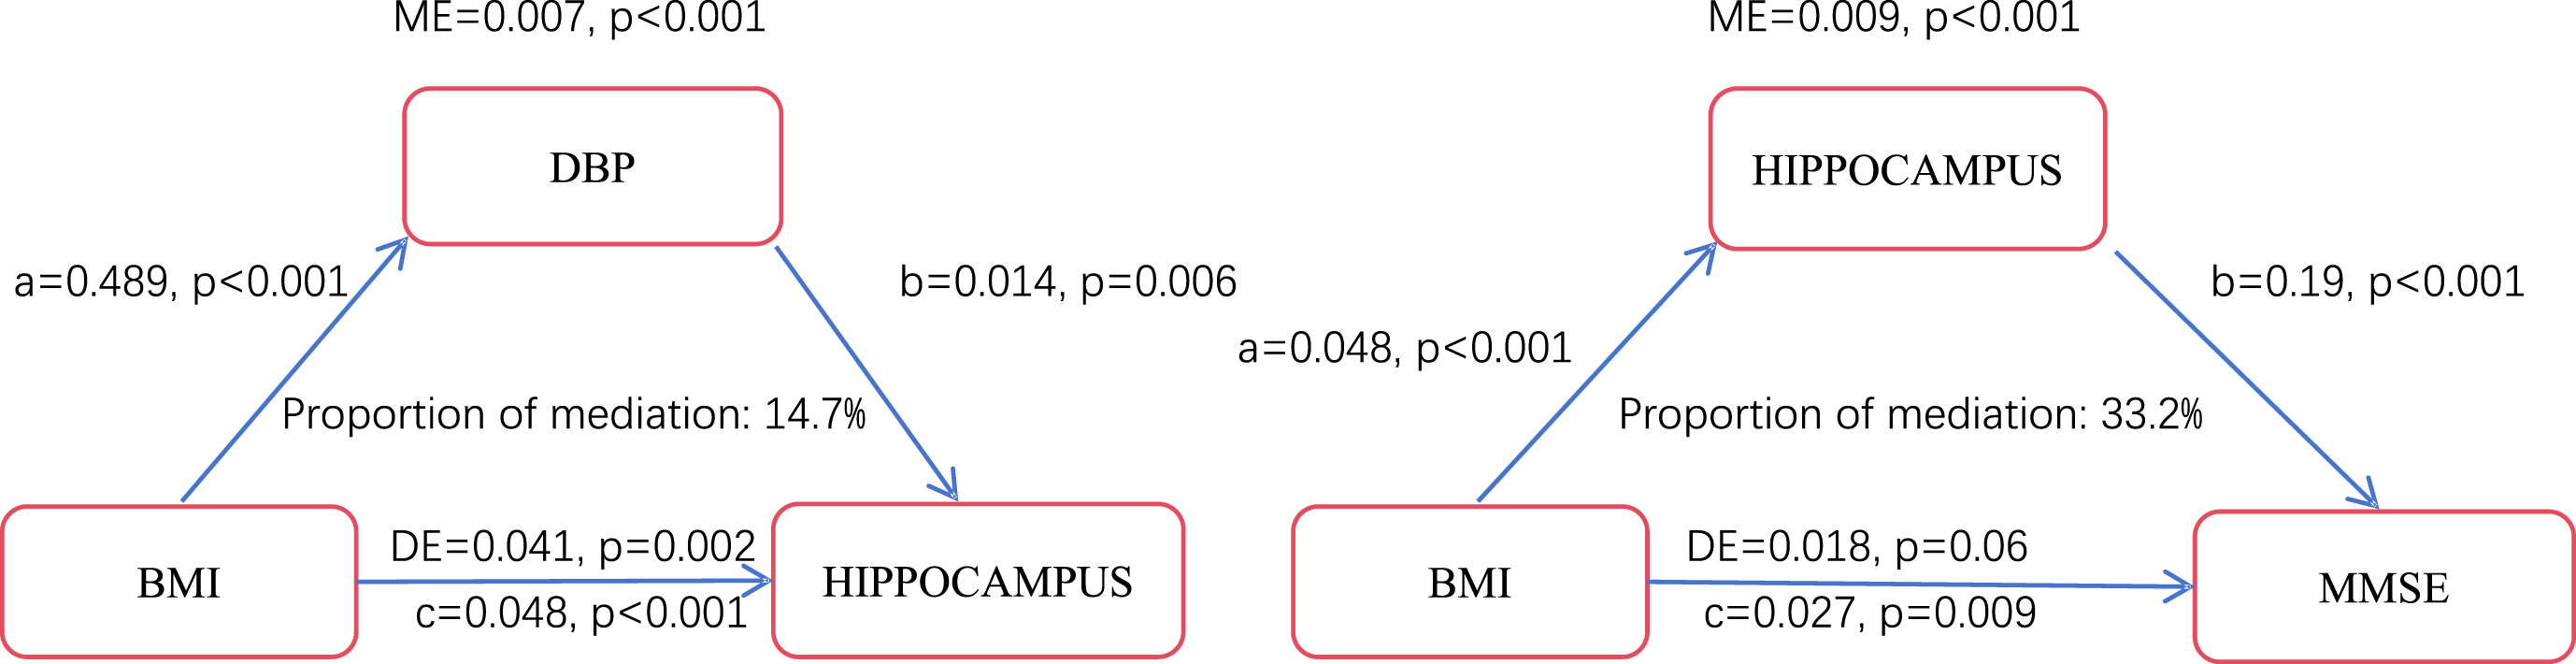
DBP and HV mediated the effect of BMI on the MMSE score
Considering that individuals with obesity had higher DBP at baseline, mediation analysis was conducted to explore the relationship between DBP and baseline HV (Fig. 3). In the CI group, it was shown that the impact of BMI on HV was partially mediated by DBP (mediated proportion = 14.7%). In the CN group, the mediated effect of DBP on the relationship between BMI and HV was insignificant. Mediation analysis was further employed to investigate the mediating effect of the baseline HV on the relationship between BMI and the baseline MMSE score among different cognition groups. It was revealed that the effect of BMI on the MMSE score was mediated through HV (mediated proportion = 33.2%) in the CI group. While in the CN group, it was found that the mediating effect of HV was insignificant.
Fig. 3
Mediation models of the cognitive impairment group. ME, mediation effect; DE, direct effect. A, effect of BMI on the mediator variable; b, Effect of the mediator variable on the outcome variable; c, total effect. The mediation analysis models were adjusted for FHS1 score and APOE ɛ4 status.
FHS1 score combined with BMI and APOE ɛ4 status to predict cognition, AD biomarkers, and outcome variables
Univariate/multivariate linear and logistic regression analyses were conducted to evaluate the relationship between the FHS1 score and cognition, AD biomarkers, and outcome variables (Fig. 1, Table 4). The likelihood ratio test indicated that the inclusion of BMI and APOE ɛ4 in the multivariate linear or logistic regression model enhanced its goodness of fit compared to the univariate linear or logistic regression model that used only the FHS score or FHS1 score as a predictor.
Table 4
Using FHS score to predict Alzheimer’s disease biomarkers and cognition
| Variables | CI (n = 330) | CN (n = 84) | ||
| Hippocampal volume | β (95% CI) | p | β (95% CI) | p |
| FHS (1) | -0.03 (-0.06, -0.002) | 0.039 | -0.02 (-0.08, 0.04) | 0.48 |
| FHS1 (1) | -0.04 (-0.07, -0.01) | 0.005 | -0.03 (-0.09, 0.03) | 0.345 |
| FHS1 (2) | -0.05 (-0.08, -0.02) | <0.001 | -0.03 (-0.09, 0.03) | 0.292 |
| Aβ42 | ||||
| FHS (1) | -0.005 (-0.011,0.002) | 0.187 | -0.001 (-0.017, 0.015) | 0.886 |
| FHS1 (1) | -0.006 (-0.013, 0.001) | 0.079 | -0.005 (-0.022, 0.011) | 0.523 |
| FHS1 (2) | -0.007 (-0.014, -0.002) | 0.014 | -0.007 (-0.022, 0.009) | 0.415 |
| p-tau181 | ||||
| FHS (1) | 0.006 (-0.003,0.012) | 0.062 | 0.011 (-0.0001,0.023) | 0.051 |
| FHS1 (1) | 0.007 (0.001, 0.014) | 0.029 | 0.009 (-0.004, 0.021) | 0.159 |
| FHS1 (2) | 0.009 (0.003, 0.015) | 0.006 | 0.007 (-0.005, 0.019) | 0.261 |
| p-tau181/Aβ42 | ||||
| FHS (1) | 0.0005 (-0.0004,0.0013) | 0.286 | 0.0007 (-0.0003,0.002) | 0.155 |
| FHS1 (1) | 0.0007 (-0.0002,0.0016) | 0.125 | 0.0008 (-0.0002, 0.002) | 0.125 |
| FHS1 (2) | 0.0009 (0.0001, 0.002) | 0.024 | 0.0008 (-0.0002, 0.002) | 0.127 |
| MMSE | ||||
| FHS (1) | -0.01 (-0.04, 0.01) | 0.236 | -0.04 (-0.07, -0.01) | 0.003 |
| FHS1 (1) | -0.02 (-0.05, 0.002) | 0.068 | -0.04 (-0.07, -0.01) | 0.009 |
| FHS1 (2) | -0.02 (-0.05, -0.001) | 0.041 | -0.04 (-0.07, -0.01) | 0.022 |
| ADNI-MEM | ||||
| FHS (1) | -0.03 (-0.05, -0.01) | 0.004 | -0.06 (-0.10, -0.02) | 0.005 |
| FHS1 (1) | -0.04 (-0.06, -0.02) | <0.001 | -0.06 (-0.10, -0.01) | 0.015 |
| FHS1 (2) | -0.04 (-0.06, -0.02) | <0.001 | -0.06 (-0.10, -0.01) | 0.014 |
| ADNI-EF | ||||
| FHS (1) | -0.07 (-0.09, -0.04) | <0.001 | -0.09 (-0.15, -0.03) | 0.003 |
| FHS1 (1) | -0.07 (-0.10, -0.04) | <0.001 | -0.10 (-0.16, -0.04) | 0.002 |
| FHS1 (2) | -0.07 (-0.10, -0.05) | <0.001 | -0.10 (-0.17, -0.04) | 0.002 |
CN, cognitively normal; CI, cognitive impairment; FHS score, Framingham risk score; FHS1 score, Framingham risk score did not include body mass index; BMI, body mass index; ADNI-MEM, ADNI memory composite score; ADNI-EF, executive function score. Aβ42 and p-tau181 have been log10 converted. (1) represents univariate linear regression, and (2) represents multivariate linear regression. Multivariate linear regression predicts variables including FHS1 score, BMI, and APOE ɛ4 status.
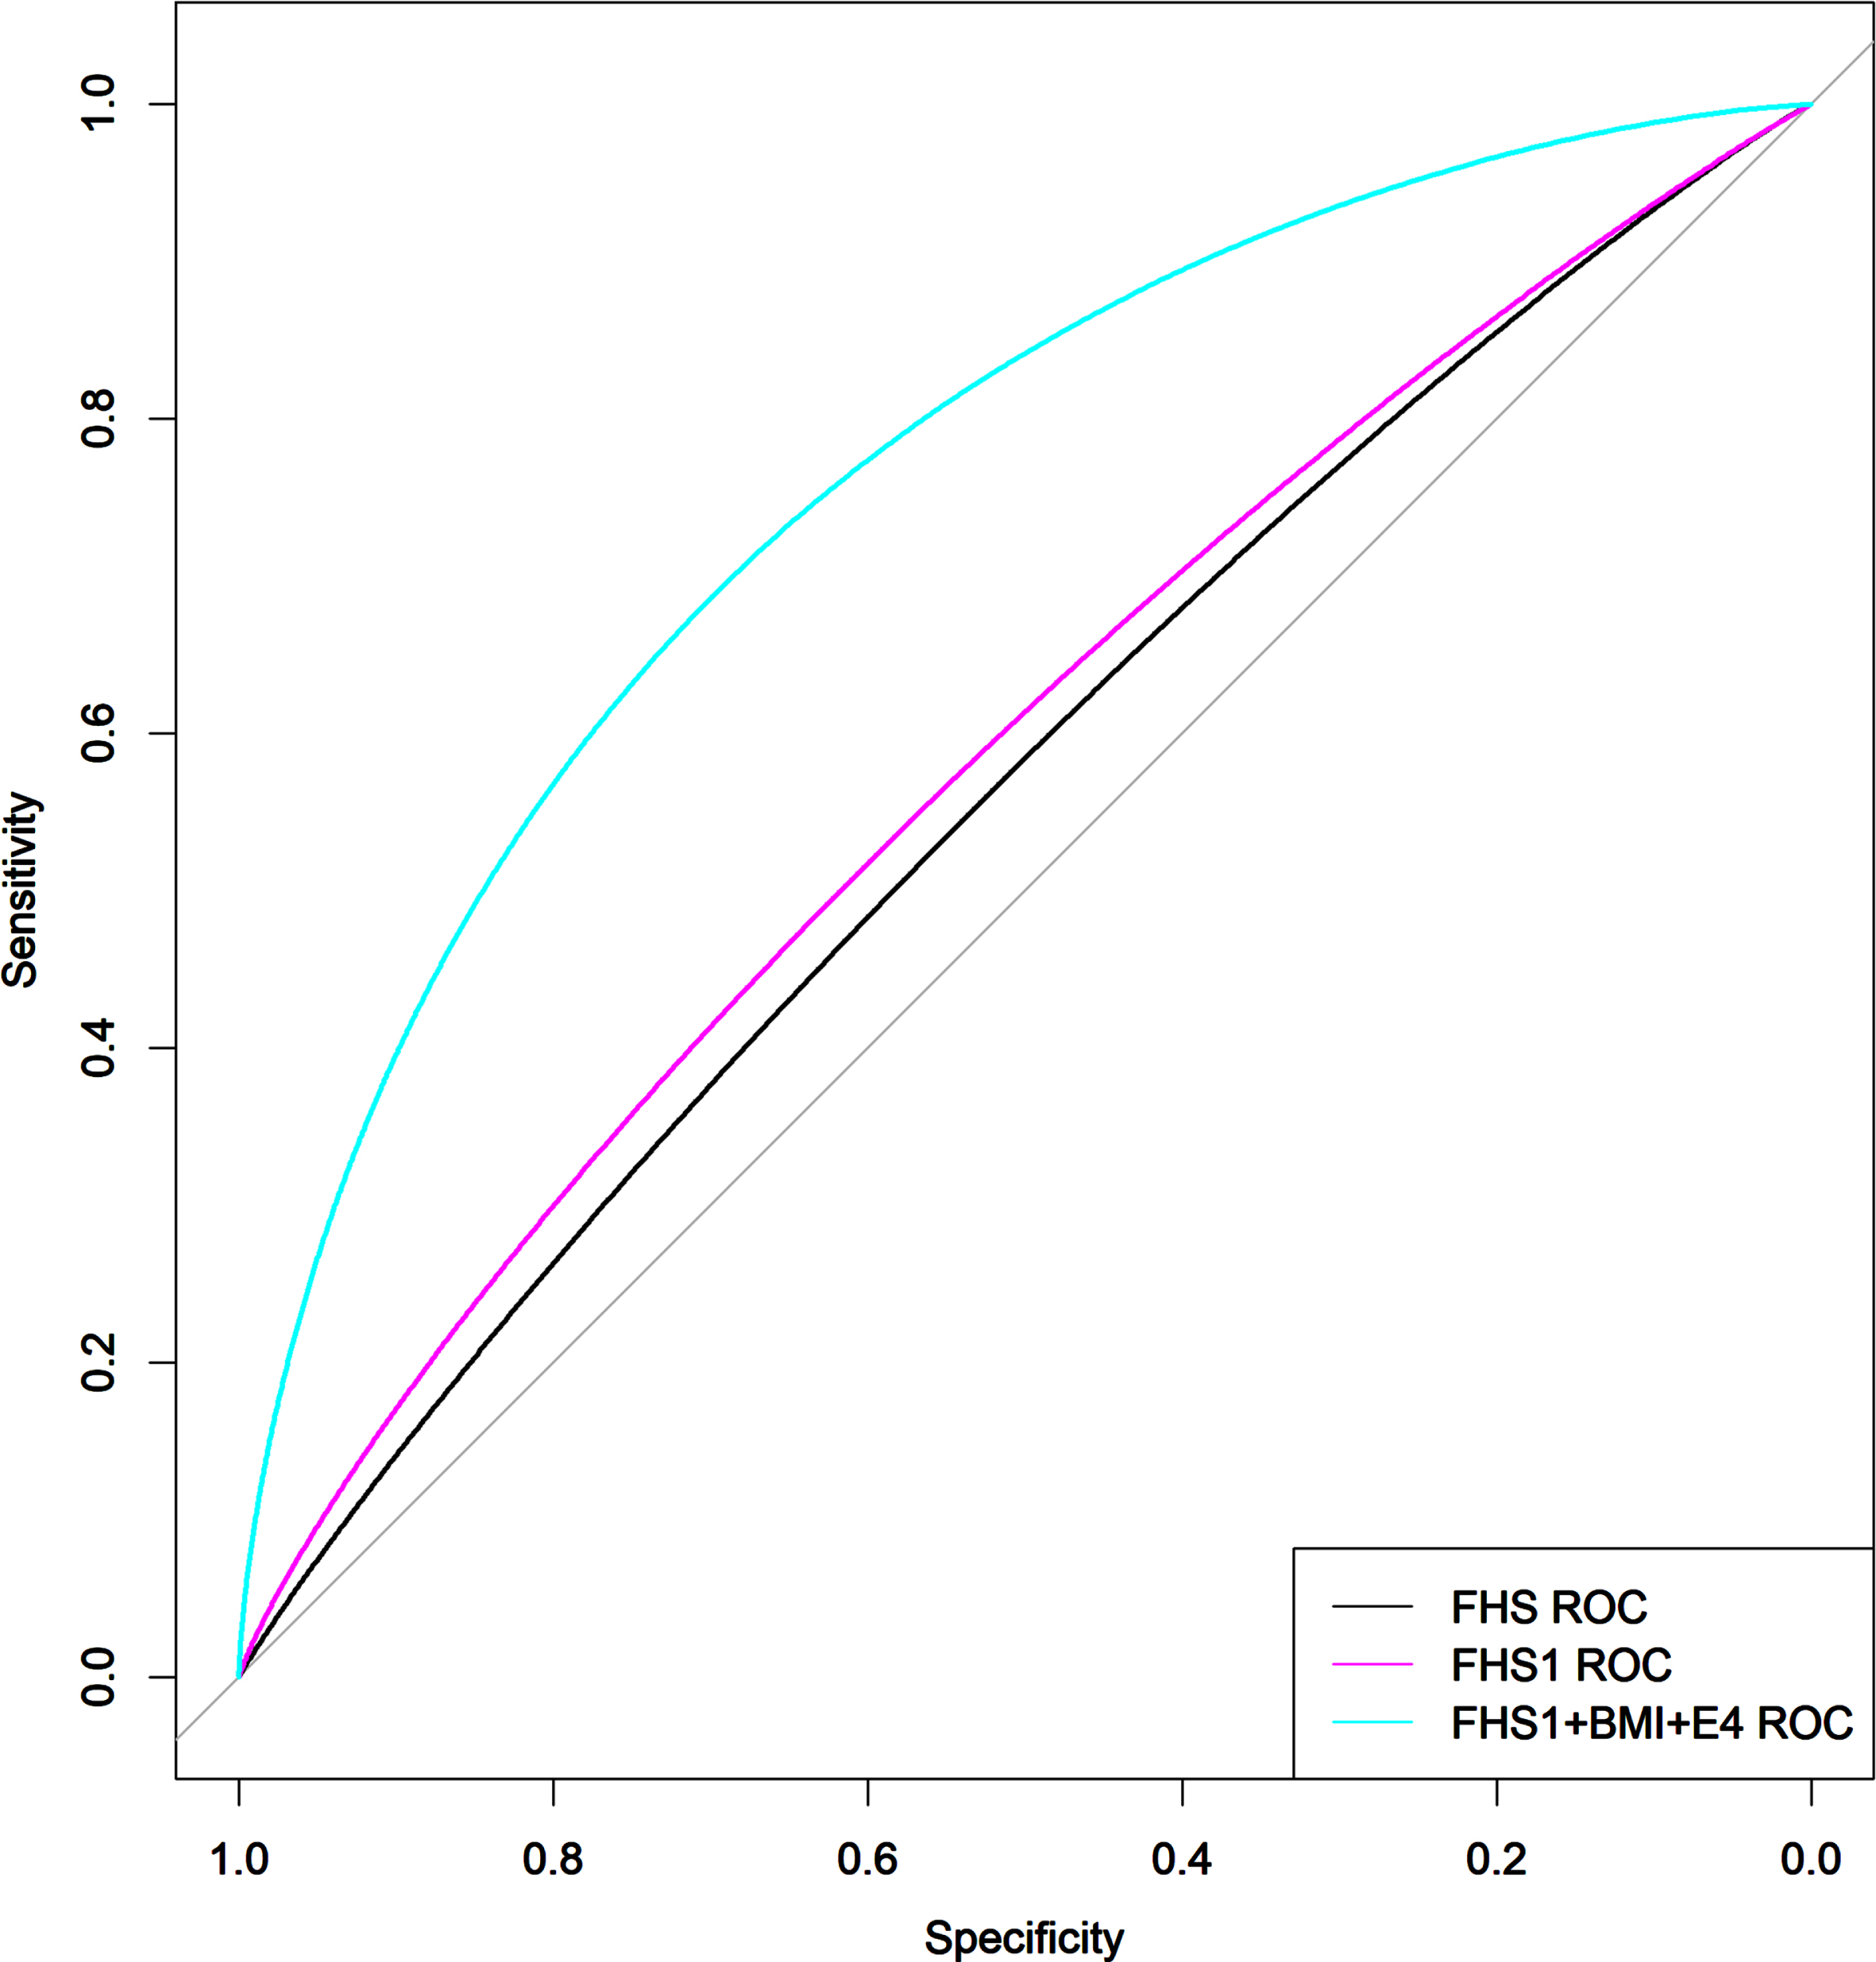
Regardless of whether in the CI or CN group, the results of the multiple linear regression analysis consistently showed a negative association between the FHS1 score and cognition (all p < 0.05). In the analysis involving CI participants, FHS1 score was associated with HV (β= -0.05, p < 0.001), Aβ42 (β= -0.007, p = 0.014), p-tau181 (β= 0.009, p = 0.006), and p-tau181/Aβ42 ratio (β= 0.0009, p = 0.024); multivariate logistic regression revealed FHS1 score was associated with higher odds of WMH burden (OR 1.30, 95% CI 1.21 to 1.42, p < 0.001), Aβ positive (OR 1.13, 95% CI 1.05 to 1.22, p < 0.001), and AT positive (OR 1.13, 95% CI 1.05 to 1.12, p = 0.001). ROC curves also revealed that the combination of FHS1 score, BMI, and APOE ɛ4 status (Fig. 4, Area Under Curve of ROC 0.776, 95% CI 0.725-0.828, compared to FHS and FHS1, p < 0.001) significantly improved the accuracy of predicting AT positive compared to using only the FHS score (Area Under Curve of ROC 0.575, 95% CI 0.513-0.638) and FHS1 score (Area Under Curve of ROC 0.585, 95% CI 0.523-0.647). In the analysis comprising CN participants, linear or logistic regression showed that the association between FHS1 score, AD biomarkers, and outcome variables was insignificant.
Fig. 4
Receiver Operating Characteristic curves for predicting AT classification positive. FHS score, Framingham risk score; FHS1 score, Framingham risk score did not include body mass index; BMI, body mass index. The performance of the combination model FHS1 + BMI+ɛ4 in predicting AT classification positive was better than (p < 0.001) the models that used only FHS score or FHS1 score.
DISCUSSION
In the present study, we investigated the relationship between late-life BMI and cognition as well as AD biomarkers across different cognitive status. We found that 1) in CI participants, a higher BMI was associated with better cognition, higher HV, and lower odds of AT positive, whereas, in CN participants, a higher BMI was found to be associated with higher p-tau181 levels and poorer memory performance; 2) in CI participants, the association between BMI and AD biomarkers was particularly prominent in those who were APOE ɛ4 carriers and Aβ positive; 3) DBP mediated the relationship between BMI and HV in CI participants; 4) FHS1 score (FHS score without consideration of BMI weight) combined with BMI and APOE ɛ4 status improved the predictive ability for AD biomarkers and clinical outcomes.
The association of BMI with cognition and AD biomarkers varied across different cognitive status
We found that the relationship between BMI and cognition as well as AD biomarkers varied depending on cognitive status. In the CI group, higher BMI was associated with better global cognition (MMSE score) and lower risk of cognitive decline. Some previous studies also indicated a link between higher BMI and a lower risk of cognitive deterioration in MCI individuals [27]. We also found that higher BMI was associated with higher HV, which aligned with a study conducted by Grundman et al. They found that BMI was positively associated with medial temporal lobe volume in AD patients [6]. Moreover, we found that higher BMI was associated with higher Aβ42 levels, lower p-tau181/Aβ42 ratio, and lower odds of AT positive status, which was consistent with some previous studies. Mathys et al. reported that BMI was positively associated with Aβ42 levels and negatively associated with p-tau181 levels in participants with CI [28]. Thus, it appears that in individuals with CI, a higher BMI was associated with better cognition and milder AD pathological changes.
In the CN group, we observed that higher BMI was associated with poorer memory, especially in individuals with obesity. Our result was consistent with the findings of Masouleh et al., who also found that higher BMI might affect the memory of cognitively healthy older individuals [29]. In our study, we found no association between BMI and HV in individuals with CN. Whereas Hayes et al. found a negative correlation between BMI and HV in CN individuals at genetic risk for AD (n = 126) [9]. The lack of association may be due to the strict definition of normal individuals and the relatively small sample size of the CN group in our study. A noteworthy observation is the positive association between BMI and p-tau181 levels among CN participants, which was consistent with some previous studies. An autopsy study investigated the neuropathological alteration in obese patients and non-obese controls (none of the cognitive impairments) and reported increased AD pathology in obese patients, including tau pathology [30]. Some studies have indicated higher BMI is associated with an increased risk of obstructive sleep apnea [31] and arterial stiffness [32]. Meanwhile, obstructive sleep apnea and elevated arterial stiffness are also associated with increased tau burden in cognitively intact individuals [33, 34]. Therefore, a higher BMI may be associated with elevated tau levels in CN individuals. Given that tau pathology is closely related to neuronal injury and cognition [35], the hippocampus is one of the primary regions where tau neurofibrillary tangles accumulate [36] and are closely related to memory function [37], our results may help to explain the association between higher BMI and poorer memory performance in CN individuals. Although there was an association between higher BMI and higher Aβ42 levels, we did not find a significant association between BMI and p-tau181/Aβ42 ratio, and an increased risk of Aβ positive status as defined by PET. To further clarify the relationship between BMI and both Aβ and tau pathology in CN individuals, additional research is necessary.
In summary, our results indicated that the relationship between BMI and AD biomarkers as well as cognition varies across different cognitive status.
APOE ɛ4 carriers and Aβ status may modify the relationship between BMI and HV as well as cognition
Both cross-sectional and longitudinal data analyses indicated that the relationship between BMI and HV as well as cognition exhibited variations depending on APOE ɛ4 status. Especially in CI participants with APOE ɛ4 + Aβ+status, BMI demonstrated a more prominent association with HV compared to another status (ɛ4 + Aβ-, ɛ4-Aβ+, ɛ4-Aβ-). Only a limited number of studies have examined the impact of BMI on AD patients with different APOE ɛ4 status, with Blautzik et al. being one of them. Blautzik et al. observed that in individuals with APOE ɛ4 carriers and Aβ positive status, BMI was inversely associated with cortical Aβ burden and recent cognitive decline [16]. However, they did not conduct further analysis of the results in different cognitive groups. Our study provided a comprehensive analysis across different cognitive status. Uncertainty surrounds the mechanisms by which BMI impacts AD in APOE ɛ4 carriers. The TOMM40-APOE variants may potentially be associated with this relationship [38]. The TOMM40-APOE variants are known to be associated with both AD risk and body weight. In the elderly, rs429358 APOE variant (coding ɛ4) and rs2075650 (a genetic risk factor for AD) TOMM40 variant are associated with a decrease in BMI. The rs429358 APOE variant and rs2075650 TOMM40 variant are often in linkage disequilibrium and have the potential to increase both the risk of BMI decline and AD pathology, which could result in a parallel decline of BMI and the progression of AD, including hippocampal atrophy and cognitive decline. In individuals with CI, the presence of APOE ɛ4 carriers may further exacerbate disease progression compared to non-carriers [39]. As a result, in the CI groups, we observed a more pronounced positive association between BMI and both HV and cognitive performance in individuals who were APOE ɛ4 carriers compared to non-carriers.
Likewise, the association between BMI and HV displayed variations depending on the Aβ status, but the mechanism is still unclear. Blautzik et al. thought that in individuals with APOE ɛ4 carriers when the Aβ levels exceed a certain threshold, it might cause a decrease in BMI through leptin [16]. Buchman et al. thought that the decline in BMI may reflect the pathologic processes of AD [40]. We hypothesize that a higher BMI may mitigate some of the negative effects of Aβ-induced BMI decrease, like weakness. Meanwhile, AD patients with a higher BMI may indicate that they are in the early stage of the AD [41]. Therefore, their cognitive impairments and biomarker abnormalities are relatively mild. The inverse association mentioned above may result in a beneficial effect of higher BMI on AD.
Possible protective mechanisms of BMI against AD
Obesity can increase the risk of hypertension [42], leading to an increase in DBP [43]. In this study, we observed that participants with obesity had higher DBP compared to those with normal weight and overweight. Previous research has reported an association between decreased DBP and increased risk of AD in the elderly. One possible mechanism is that an increase in DBP provides sufficient cerebral perfusion to prevent cerebral hypoperfusion [44]. Moreover, Ngwa et al. discovered a correlation between higher DBP and a larger HV in early MCI participants [45]. Based on the above evidence, we conducted the mediation analyses and found that DBP mediated the association between BMI and hippocampal volume as well as cognition. In other words, higher BMI was associated with higher DBP, while higher DBP had a protective effect on HV and cognitive function. Therefore, BMI showed a positive association with HV and cognition. However, we have only confirmed the association between higher BMI and larger HV in individuals with CI. We have not yet demonstrated an association between higher BMI and lower HV in the cognitively intact population. Therefore, we did not conduct a mediation analysis in the CN group. Our findings suggest that higher BMI is linked to higher DBP, which in turn impacts hippocampal volume and cognitive function.
Other studies suggest that BMI may protect cognition through various mechanisms [46, 47]. BMI was positively associated with glucose metabolism in AD-vulnerable regions, like the anterior cingulate cortex [46]. The functional connectivity of the default mode network may also serve as an underlying mechanism through which higher BMI confers protective effects on cognition in late life [47]. Nevertheless, the mechanisms of late-life BMI in AD may be complex and await further research.
FHS1 score combined with BMI and APOE ɛ4 status improved the predicting ability for AD markers
Lane et al. found that the FHS score was not associated with Aβ pathology [12]. Considering the complex association between BMI and AD in the elderly population, we did not include BMI weighted score in the calculation of the FHS score. Then, we found that the predictive value of the FHS1 score combining BMI and APOE ɛ4 status was more predictive than the FHS score. Our study uncovered significant associations between a higher FHS1 score and several factors, including poorer cognition, lower Aβ42 levels, higher p-tau181 levels, higher WMH burden, lower HV, and poorer cognition. In the future, when applying VRFs scoring for dementia screening in the elderly population, it should be considered to combine BMI (as an independent factor) and APOE ɛ4 status to improve the accuracy of dementia screening.
Strengths and limitations
Our study provided a comprehensive explanation of the association between BMI and both cognition and AD biomarkers in different cognitive status and explored potential underlying mechanisms. We excluded CN participants with a high WMH burden, which may be cerebral small vessel disease. Therefore, the definition of CN in our study was relatively strict, which has not been considered in some previous studies. Furthermore, we did not exclude Aβ negative individuals. This could contribute to the clinical applicability of our findings, as obtaining Aβ data in a clinical setting is not easy.
However, some limitations need to be pointed out. Firstly, the data utilized for analysis were retrospectively collected from the ADNI database, which may introduce some biases. Secondly, due to rigorous inclusion criteria, the number of CN participants was relatively small, which may have obscured associations between BMI and AD markers in the CN population. Thirdly, we faced challenges in further clarifying the relationship between BMI changes and AD markers as well as cognition due to a higher number of missing values for weight and height during follow-up in the ADNI database. However, previous studies have shown a clear association between a decrease in BMI and an increase in AD risk [41].
Conclusion
In conclusion, our findings suggest that the association of BMI with cognition and AD biomarkers varies across different cognitive groups. In particular, a lower BMI was associated with worse cognition, higher Aβ burden, and lower HV in individuals with CI. Clinical practice should strengthen the monitoring and management of BMI in AD patients. For the general population, it is necessary to maintain a BMI not too high (<30 kg/m2). Additionally, the value of BMI and APOE ɛ4 status should be considered in the cognitive screening process for the elderly population in the future.
ACKNOWLEDGMENTS
The authors have no acknowledgments to report.
FUNDING
Data collection and sharing for this project was funded by the Alzheimer’s Disease Neuroimaging Initiative (ADNI) (National Institutes of Health Grant U01 AG024904) and DOD ADNI (Department of Defense award number W81XWH-12-2-0012). ADNI is funded by the National Institute on Aging, the National Institute of Biomedical Imaging and Bioengineering, and through generous contributions from the following: AbbVie, Alzheimer’s Association; Alzheimer’s Drug Discovery Foundation; Araclon Biotech; BioClinica, Inc.; Biogen; Bristol-Myers Squibb Company; CereSpir, Inc.; Cogstate; Eisai Inc.; Elan Pharmaceuticals, Inc.; Eli Lilly and Company; EuroImmun; F. Hoffmann-La Roche Ltd and its affiliated company Genentech, Inc.; Fujirebio; GE Healthcare; IXICO Ltd.; Janssen Alzheimer Immunotherapy Research & Development, LLC.; Johnson & Johnson Pharmaceutical Research & Development LLC.; Lumosity; Lundbeck; Merck & Co., Inc.; Meso Scale Diagnostics, LLC.; NeuroRx Research; Neurotrack Technologies; Novartis Pharmaceuticals Corporation; Pfizer Inc.; Piramal Imaging; Servier; Takeda Pharmaceutical Company; and Transition Therapeutics. The Canadian Institutes of Health Research is providing funds to support ADNI clinical sites in Canada. Private sector contributions are facilitated by the Foundation for the National Institutes of Health (http://www.fnih.org). The grantee organization is the Northern California Institute for Research and Education, and the study is coordinated by the Alzheimer’s Therapeutic Research Institute at the University of Southern California. ADNI data are disseminated by the Laboratory for Neuro Imaging at the University of Southern California.
This present research was funded by the Chongqing Natural Science Fund Key Project No: cstc2019jcyj-zdxmX0029 and the Kuanren Talents Program of the Second Affiliated Hospital of Chongqing Medical University.
CONFLICT OF INTEREST
The authors have no conflict of interest to report.
DATA AVAILABILITY
The datasets generated and analyzed during the current study are available in the ADNI data repository, http://adni.loni.usc.edu/data-samples/access-data/. The data used in the study are available from the corresponding authors on reasonable request.
SUPPLEMENTARY MATERIAL
[1] The supplementary material is available in the electronic version of this article: https://dx.doi.org/10.3233/ADR-230163.
REFERENCES
[1] | Scheltens P , De Strooper B , Kivipelto M , Holstege H , Chetelat G , Teunissen CE , Cummings J , van der Flier WM ((2021) ) Alzheimer’s disease. Lancet 397: , 1577–1590. |
[2] | Norton S , Matthews FE , Barnes DE , Yaffe K , Brayne C ((2014) ) Potential for primary prevention of Alzheimer’s disease: An analysis of population-based data. Lancet Neurol 13: , 788–794. |
[3] | Ngandu T , Lehtisalo J , Solomon A , Levalahti E , Ahtiluoto S , Antikainen R , Backman L , Hanninen T , Jula A , Laatikainen T , Lindstrom J , Mangialasche F , Paajanen T , Pajala S , Peltonen M , Rauramaa R , Stigsdotter-Neely A , Strandberg T , Tuomilehto J , Soininen H , Kivipelto M ((2015) ) A 2 year multidomain intervention of diet, exercise, cognitive training, and vascular risk monitoring versus control to prevent cognitive decline in at-risk elderly people (FINGER): A randomised controlled trial. Lancet 385: , 2255–2263. |
[4] | Fan J , Li X , Yu X , Liu Z , Jiang Y , Fang Y , Zong M , Suo C , Man Q , Xiong L ((2023) ) Global burden, risk factor analysis, and prediction study of ischemic stroke, 1990-2030. Neurology 101: , e137–e150. |
[5] | Gustafson D , Rothenberg E , Blennow K , Steen B , Skoog I ((2003) ) An 18-year follow-up of overweight and risk of Alzheimer disease. Arch Intern Med 163: , 1524–1528. |
[6] | Boyle CP , Raji CA , Erickson KI , Lopez OL , Becker JT , Gach HM , Longstreth WT Jr. , Teverovskiy L , Kuller LH , Carmichael OT , Thompson PM ((2015) ) Physical activity, body mass index, and brain atrophy in Alzheimer’s disease. Neurobiol Aging 36 Suppl 1: , S194–S202. |
[7] | Yuan S , Wu W , Ma W , Huang X , Huang T , Peng M , Xu A , Lyu J ((2022) ) Body mass index, genetic susceptibility, and Alzheimer’s disease: A longitudinal study based on 475,813 participants from the UK Biobank. J Transl Med 20: , 417. |
[8] | Grundman M , Corey-Bloom J , Jernigan T , Archibald S , Thal LJ ((1996) ) Low body weight in Alzheimer’s disease is associated with mesial temporal cortex atrophy. Neurology 46: , 1585–1591. |
[9] | Hayes JP , Moody JN , Roca JG , Hayes SM , Alzheimer’s Disease Neuroimaging Initiative ((2020) ) Body mass index is associated with smaller medial temporal lobe volume in those at risk for Alzheimer’s disease. Neuroimage Clin 25: , 102156. |
[10] | Herukka SK , Pennanen C , Soininen H , Pirttila T ((2008) ) CSF Abeta42, tau and phosphorylated tau correlate with medial temporal lobe atrophy. J Alzheimers Dis 14: , 51–57. |
[11] | Gottesman RF , Mosley TH , Knopman DS , Hao Q , Wong D , Wagenknecht LE , Hughes TM , Qiao Y , Dearborn J , Wasserman BA ((2020) ) Association of intracranial atherosclerotic disease with brain beta-amyloid deposition: Secondary analysis of the ARIC Study. JAMA Neurol 77: , 350–357. |
[12] | Lane CA , Barnes J , Nicholas JM , Sudre CH , Cash DM , Malone IB , Parker TD , Keshavan A , Buchanan SM , Keuss SE , James SN , Lu K , Murray-Smith H , Wong A , Gordon E , Coath W , Modat M , Thomas D , Richards M , Fox NC , Schott JM ((2020) ) Associations between vascular risk across adulthood and brain pathology in late life: Evidence from a British Birth Cohort. JAMA Neurol 77: , 175–183. |
[13] | D’Agostino RB , Sr. Vasan RS , Pencina MJ , Wolf PA , Cobain M , Massaro JM , Kannel WB ((2008) ) General cardiovascular risk profile for use in primary care: The Framingham Heart Study. Circulation 117: , 743–753. |
[14] | Sun Z , Wang ZT , Sun FR , Shen XN , Xu W , Ma YH , Dong Q , Tan L , Yu JT , Alzheimer’s Disease Neuroimaging Initiative ((2020) ) Late-life obesity is a protective factor for prodromal Alzheimer’s disease: A longitudinal study. Aging (Albany NY) 12: , 2005–2017. |
[15] | Liu CC , Liu CC , Kanekiyo T , Xu H , Bu G ((2013) ) Apolipoprotein E and Alzheimer disease: Risk, mechanisms and therapy. Nat Rev Neurol 9: , 106–118. |
[16] | Blautzik J , Kotz S , Brendel M , Sauerbeck J , Vettermann F , Winter Y , Bartenstein P , Ishii K , Rominger A , Alzheimer’s Disease Neuroimaging Initiative ((2018) ) Relationship between body mass index, ApoE4 status, and PET-based amyloid and neurodegeneration markers in amyloid-positive subjects with normal cognition or mild cognitive impairment. J Alzheimers Dis 65: , 781–791. |
[17] | Kadey KR , Woodard JL , Moll AC , Nielson KA , Smith JC , Durgerian S , Rao SM ((2021) ) Five-year change in body mass index predicts conversion to mild cognitive impairment or dementia only in APOE ɛ4 allele carriers. J Alzheimers Dis 81: , 189–199. |
[18] | Petersen RC , Aisen PS , Beckett LA , Donohue MC , Gamst AC , Harvey DJ , Jack CR Jr. , Jagust WJ , Shaw LM , Toga AW , Trojanowski JQ , Weiner MW ((2010) ) Alzheimer’s Disease Neuroimaging Initiative (ADNI): Clinical characterization. Neurology 74: , 201–209. |
[19] | Cedres N , Ferreira D , Machado A , Shams S , Sacuiu S , Waern M , Wahlund LO , Zettergren A , Kern S , Skoog I , Westman E ((2020) ) Predicting Fazekas scores from automatic segmentations of white matter signal abnormalities. Aging (Albany NY) 12: , 894–901. |
[20] | Global BMI Mortality Collaboration Di Angelantonio E , Bhupathiraju Sh N , Wormser D , Gao P , Kaptoge S , Berrington de Gonzalez A , Cairns BJ , Huxley R , Jackson ChL , Joshy G , Lewington S , Manson JE , Murphy N , Patel AV , Samet JM , Woodward M , Zheng W , Zhou M , Bansal N , Barricarte A , Carter B , Cerhan JR , Smith GD , Fang X , Franco OH , Green J , Halsey J , Hildebrand JS , Jung KJ , Korda RJ , McLerran DF , Moore SC , O’Keeffe LM , Paige E , Ramond A , Reeves GK , Rolland B , Sacerdote C , Sattar N , Sofianopoulou E , Stevens J , Thun M , Ueshima H , Yang L , Yun YD , Willeit P , Banks E , Beral V , Chen Zh , Gapstur SM , Gunter MJ , Hartge P , Jee SH , Lam TH , Peto R , Potter JD , Willett WC , Thompson SG , Danesh J , Hu FB ((2016) ) Body-mass index and all-cause mortality: Individual-participant-data meta-analysis of 239 prospective studies in four continents. Lancet 388: , 776–786. |
[21] | Crane PK , Carle A , Gibbons LE , Insel P , Mackin RS , Gross A , Jones RN , Mukherjee S , Curtis SM , Harvey D , Weiner M , Mungas D , Alzheimer’s Disease Neuroimaging Initiative ((2012) ) Development and assessment of a composite score for memory in the Alzheimer’s Disease Neuroimaging Initiative (ADNI). Brain Imaging Behav 6: , 502–516. |
[22] | Gibbons LE , Carle AC , Mackin RS , Harvey D , Mukherjee S , Insel P , Curtis SM , Mungas D , Crane PK , Alzheimer’s Disease Neuroimaging Initiative ((2012) ) A composite score for executive functioning, validated in Alzheimer’s Disease Neuroimaging Initiative (ADNI) participants with baseline mild cognitive impairment. Brain Imaging Behav 6: , 517–527. |
[23] | Jagust WJ , Bandy D , Chen K , Foster NL , Landau SM , Mathis CA , Price JC , Reiman EM , Skovronsky D , Koeppe RA , Alzheimer’s Disease Neuroimaging Initiative ((2010) ) The Alzheimer’s Disease Neuroimaging Initiative positron emission tomography core. Alzheimers Dement 6: , 221–229. |
[24] | Joshi AD , Pontecorvo MJ , Clark CM , Carpenter AP , Jennings DL , Sadowsky CH , Adler LP , Kovnat KD , Seibyl JP , Arora A , Saha K , Burns JD , Lowrey MJ , Mintun MA , Skovronsky DM , Florbetapir FSI ((2012) ) Performance characteristics of amyloid PET with florbetapir F 18 in patients with Alzheimer’s disease and cognitively normal subjects. J Nucl Med 53: , 378–384. |
[25] | Shaw LM , Vanderstichele H , Knapik-Czajka M , Figurski M , Coart E , Blennow K , Soares H , Simon AJ , Lewczuk P , Dean RA , Siemers E , Potter W , Lee VM , Trojanowski JQ , Alzheimer’s Disease Neuroimaging Initiative ((2011) ) Qualification of the analytical and clinical performance of CSF biomarker analyses in ADNI. Acta Neuropathol 121: , 597–609. |
[26] | Gibbons RD , Hedeker D , DuToit S ((2010) ) Advances in analysis of longitudinal data. Annu Rev Clin Psychol 6: , 79–107. |
[27] | Cova I , Clerici F , Maggiore L , Pomati S , Cucumo V , Ghiretti R , Galimberti D , Scarpini E , Mariani C , Caracciolo B ((2016) ) Body mass index predicts progression of mild cognitive impairment to dementia. Dement Geriatr Cogn Disord 41: , 172–180. |
[28] | Mathys J , Gholamrezaee M , Henry H , von Gunten A , Popp J ((2017) ) Decreasing body mass index is associated with cerebrospinal fluid markers of Alzheimer’s pathology in MCI and mild dementia. Exp Gerontol 100: , 45–53. |
[29] | Kharabian Masouleh S , Arelin K , Horstmann A , Lampe L , Kipping JA , Luck T , Riedel-Heller SG , Schroeter ML , Stumvoll M , Villringer A , Witte AV ((2016) ) Higher body mass index in older adults is associated with lower gray matter volume: Implications for memory performance. Neurobiol Aging 40: , 1–10. |
[30] | Mrak RE ((2009) ) Alzheimer-type neuropathological changes in morbidly obese elderly individuals. Clin Neuropathol 28: , 40–45. |
[31] | Patel SR ((2019) ) Obstructive sleep apnea. , ITC81-ITC. Ann Intern Med 171: , 96. |
[32] | Li P , Wang L , Liu C ((2017) ) Overweightness, obesity and arterial stiffness in healthy subjects: A systematic review and meta-analysis of literature studies. Postgrad Med 129: , 224–230. |
[33] | Carvalho DZ , St Louis EK , Schwarz CG , Lowe VJ , Boeve BF , Przybelski SA , Reddy A , Mielke MM , Knopman DS , Petersen RC , Jack CR Jr. , Vemuri P ((2020) ) Witnessed apneas are associated with elevated tau-PET levels in cognitively unimpaired elderly. Neurology 94: , e1793–e1802. |
[34] | Moore EE , Liu D , Li J , Schimmel SJ , Cambronero FE , Terry JG , Nair S , Pechman KR , Moore ME , Bell SP , Beckman JA , Gifford KA , Hohman TJ , Blennow K , Zetterberg H , Carr JJ , Jefferson AL ((2021) ) Association of aortic stiffness with biomarkers of neuroinflammation, synaptic dysfunction, and neurodegeneration. Neurology 97: , e329–e340. |
[35] | Ossenkoppele R , Schonhaut DR , Scholl M , Lockhart SN , Ayakta N , Baker SL , O’Neil JP , Janabi M , Lazaris A , Cantwell A , Vogel J , Santos M , Miller ZA , Bettcher BM , Vossel KA , Kramer JH , Gorno-Tempini ML , Miller BL , Jagust WJ , Rabinovici GD ((2016) ) Tau PET patterns mirror clinical and neuroanatomical variability in Alzheimer’s disease. Brain 139: , 1551–1567. |
[36] | Braak H , Braak E ((1991) ) Neuropathological stageing of Alzheimer-related changes. Acta Neuropathol 82: , 239–259. |
[37] | Jeffery KJ ((2018) ) The hippocampus: From memory, to map, to memory map. Trends Neurosci 41: , 64–66. |
[38] | Kulminski AM , Loika Y , Culminskaya I , Huang J , Arbeev KG , Bagley O , Feitosa MF , Zmuda JM , Christensen K , Yashin AI , Long Life Family Study Research Group ((2019) ) Independent associations of TOMM40 and APOE variants with body mass index. Aging Cell 18: , e12869. |
[39] | Pyun JM , Park YH , Lee KJ , Kim S , Saykin AJ , Nho K , Alzheimer’s Disease Neuroimaging Initiative ((2021) ) Predictability of polygenic risk score for progression to dementia and its interaction with APOE epsilon4 in mild cognitive impairment. Transl Neurodegener 10: , 32. |
[40] | Buchman AS , Wilson RS , Bienias JL , Shah RC , Evans DA , Bennett DA ((2005) ) Change in body mass index and risk of incident Alzheimer disease. Neurology 65: , 892–897. |
[41] | Guo J , Wang J , Dove A , Chen H , Yuan C , Bennett DA , Xu W ((2022) ) Body mass index trajectories preceding incident mild cognitive impairment and dementia. JAMA Psychiatry 79: , 1180–1187. |
[42] | Tanaka M ((2020) ) Improving obesity and blood pressure. Hypertens Res 43: , 79–89. |
[43] | Droyvold WB , Midthjell K , Nilsen TI , Holmen J ((2005) ) Change in body mass index and its impact on blood pressure: A prospective population study. Int J Obes (Lond) 29: , 650–655. |
[44] | Arvanitakis Z , Capuano AW , Lamar M , Shah RC , Barnes LL , Bennett DA , Schneider JA ((2018) ) Late-life blood pressure association with cerebrovascular and Alzheimer disease pathology. Neurology 91: , e517–e525. |
[45] | Ngwa JS , Fungwe TV , Ntekim O , Allard JS , Johnson SM , Castor C , Graham L , Nadarajah S , Gillum RF , Obisesan TO , Alzheimer’s Disease Neuroimaging Initiative ((2018) ) Associations of pulse and blood pressure with hippocampal volume by APOE and cognitive phenotype: The Alzheimer’s Disease Neuroimaging Initiative (ADNI). Dement Geriatr Cogn Disord 45: , 66–78. |
[46] | Hu X , Okamura N , Arai H , Higuchi M , Maruyama M , Itoh M , Yamaguchi K , Sasaki H ((2002) ) Neuroanatomical correlates of low body weight in Alzheimer’s disease: A PET study. Prog Neuropsychopharmacol Biol Psychiatry 26: , 1285–1289. |
[47] | Hsu CL , Voss MW , Best JR , Handy TC , Madden K , Bolandzadeh N , Liu-Ambrose T ((2015) ) Elevated body mass index and maintenance of cognitive function in late life: Exploring underlying neural mechanisms. Front Aging Neurosci 7: , 155. |


