
Potential Utility of Plasma Biomarker Panels in Differential Diagnosis of Alzheimer’s Disease
Abstract
Blood tests are in need, in the clinical diagnosis of Alzheimer’s disease (AD) as minimally invasive and less expensive alternatives to cerebrospinal fluid and neuroimaging methods. On these lines, single molecule array (Simoa) analysis of amyloid-β (Aβ42), total tau (t-tau), phospho-tau (p-tau 181), and neurofilament L (NfL) in the plasma samples of AD subjects, healthy controls (HC), and non-AD subjects was conducted. Findings from this study suggest that a panel of multiple plasma biomarkers (NfL, Aβ42, t-tau, and p-tau 181) combined with the clinical assessments could support differential diagnosis of AD and other dementias from healthy controls.
INTRODUCTION
Alzheimer’s disease (AD) is the most common type of dementia [1], with neuropathological hallmarks of amyloid-β (Aβ) plaques and neurofibrillary tangles in the brain [2]. Currently, the diagnosis of AD requires a combination of clinical evaluation, neuropsychological assessments, CSF measurements of Aβ42, total tau (t-tau), phospho-tau 181 (p-tau 181), and MRI or PET imaging [3]. Despite the high accuracy presented by these markers, the cost and invasiveness of these techniques make them less suitable as screening tools for routine diagnostics. Therefore, alternatives such as blood are gaining momentum with the advent of ultrasensitive techniques for biomarker analysis. Research also suggests that panel of biomarkers present improved performance in terms of sensitivity and specificity over a single biomarker in characterizing AD [4].
Here, we quantified plasma levels of four proteins that are relevant to AD such as Aβ42, t-tau, p-tau 181, and NfL in AD, Non-AD (NAD), and healthy controls (HC). The accuracy of these biomarkers and their combination in the classification of dementia groups (both AD and NAD) from HC and between AD and NAD were analyzed. The correlation of biomarkers with the scores of clinical assessment scales such as Clinical Dementia Rating (CDR), Hindi Mental State Examination (HMSE), Neuropsychiatry Inventory (NPI), and Everyday abilities Scale for India (EASI) were studied.
MATERIALS AND METHODS
Participants
Study participants were selected from the clinical services of the Geriatric Psychiatry Unit of a tertiary care center in Bengaluru, India. The study was approved by Institutional Human Ethics committee, NIMHANS (IEC Number NIMHANS/IEC (BS & NS DIV.)/14th MEETING/2018 dated September 17, 2019). Written informed consent was obtained from all participants. The criteria followed for selection of participants and clinical assessment scales administered are previously described [5]. In brief, NIA-AA criteria for selection of AD subjects, ICD-10 and NIA-AA criteria for selection of NAD subjects were followed. Study participants were assessed through CDR, HMSE, NPI, and EASI for clinical/cognitive status.
Quantification of plasma biomarkers by single molecule array (Simoa)
Non-fasting blood samples were collected into EDTA vials, plasma fractions separated by centrifugation at 5000 rpm for 20 min and stored as aliquots at –80°C, until analysis.
The quantification of NfL, Aβ42, and p-tau 181 using Simoa HD-X analyzer has been described earlier [5]. Additionally, t-tau in plasma was measured using Simoa assay kit for t-tau (#101552) following the manufacturer’s instructions.
Statistical analysis
The data was analyzed using statistical software, Graphpad Prism, version 8.4 (San Diego, California, USA) and IBM SPSS, version 28.0 (New York, USA). Based on the distribution, data was analyzed by Welch’s ANOVA or Kruskal Wallis test for multiple comparisons. Age of participants and plasma levels of Aβ42 followed a normal distribution and were analyzed by Welch’s ANOVA. The clinical assessment scores such as HMSE, NPI, and EASI, and the concentration of plasma NfL, p-tau 181, and t-tau across the groups were not normally distributed and were therefore analyzed by Kruskal Wallis test. The gender and CDR scores of the participants across the groups were compared using Chi square test. Correlation between biomarker levels and clinical assessment scores were analyzed using Spearman’s correlation method. For all statistical comparisons, p < 0.05 was considered statistically significant. Multivariate analysis was performed using binary logistic regression method to find the best-fitting multivariate model for each comparison group with age as a covariate. For the individual biomarkers and panels, receiver operating characteristic (ROC) curve were produced in terms of sensitivity and specificity of markers, based on which the area under curve (AUC) was computed by the software.
RESULTS
Characteristics of participants
The study comprised of 103 participants including 35 healthy controls, 35 AD subjects, and 33 NAD subjects. The NAD group comprised of 12 frontotemporal dementia (FTD), 5 vascular dementia (VaD), 4 Lewy body dementia (LBD), and 12 mixed dementia (MD) cases. The demographic data of participants and their clinical assessment scores (CDR, HMSE, NPI and EASI) are described in Table 1.
Table 1
Characteristics of the participants
| Description | HC (n = 35) | AD (n = 35) | NAD (n = 33) | p | Multiple comparisons |
| Age (y) (mean±SD) | 67.43±9.61 | 70.26±6.88 | 64.24±7.00 | <0.01 | AD-NAD (p < 0.01) |
| Age range (y) | 52–88 | 57–87 | 50–80 | – | – |
| Gender (%) | |||||
| Male | 71.43 | 45.71 | 63.64 | ns | – |
| Female | 28.57 | 54.29 | 36.36 | ||
| CDR score (0/0.5/1/2/3) | 35/0/0/0/0 | 0/0/12/12/11 | 0/0/15/9/9 | <0.001 | – |
| HMSE score (mean±SD) | 29.46±1.62 | 14.24±7.08 | 16.82±7.06 | <0.0001 | HC-AD (p < 0.001) |
| HC-NAD (p < 0.001) | |||||
| NPI score (mean±SD) | 0 | 15.86±16.37 | 11.45±13.01 | <0.0001 | HC-AD (p < 0.001) |
| HC-NAD (p < 0.001) | |||||
| EASI score (mean±SD) | 0 | 8.97±2.29 | 7.48±3.48 | <0.0001 | HC-AD (p < 0.0001) |
| HC-NAD (p < 0.0001) | |||||
| AD-NAD(p < 0.05) |
Data represented as mean±SD. p < 0.05 was considered significant.
Plasma biomarker levels
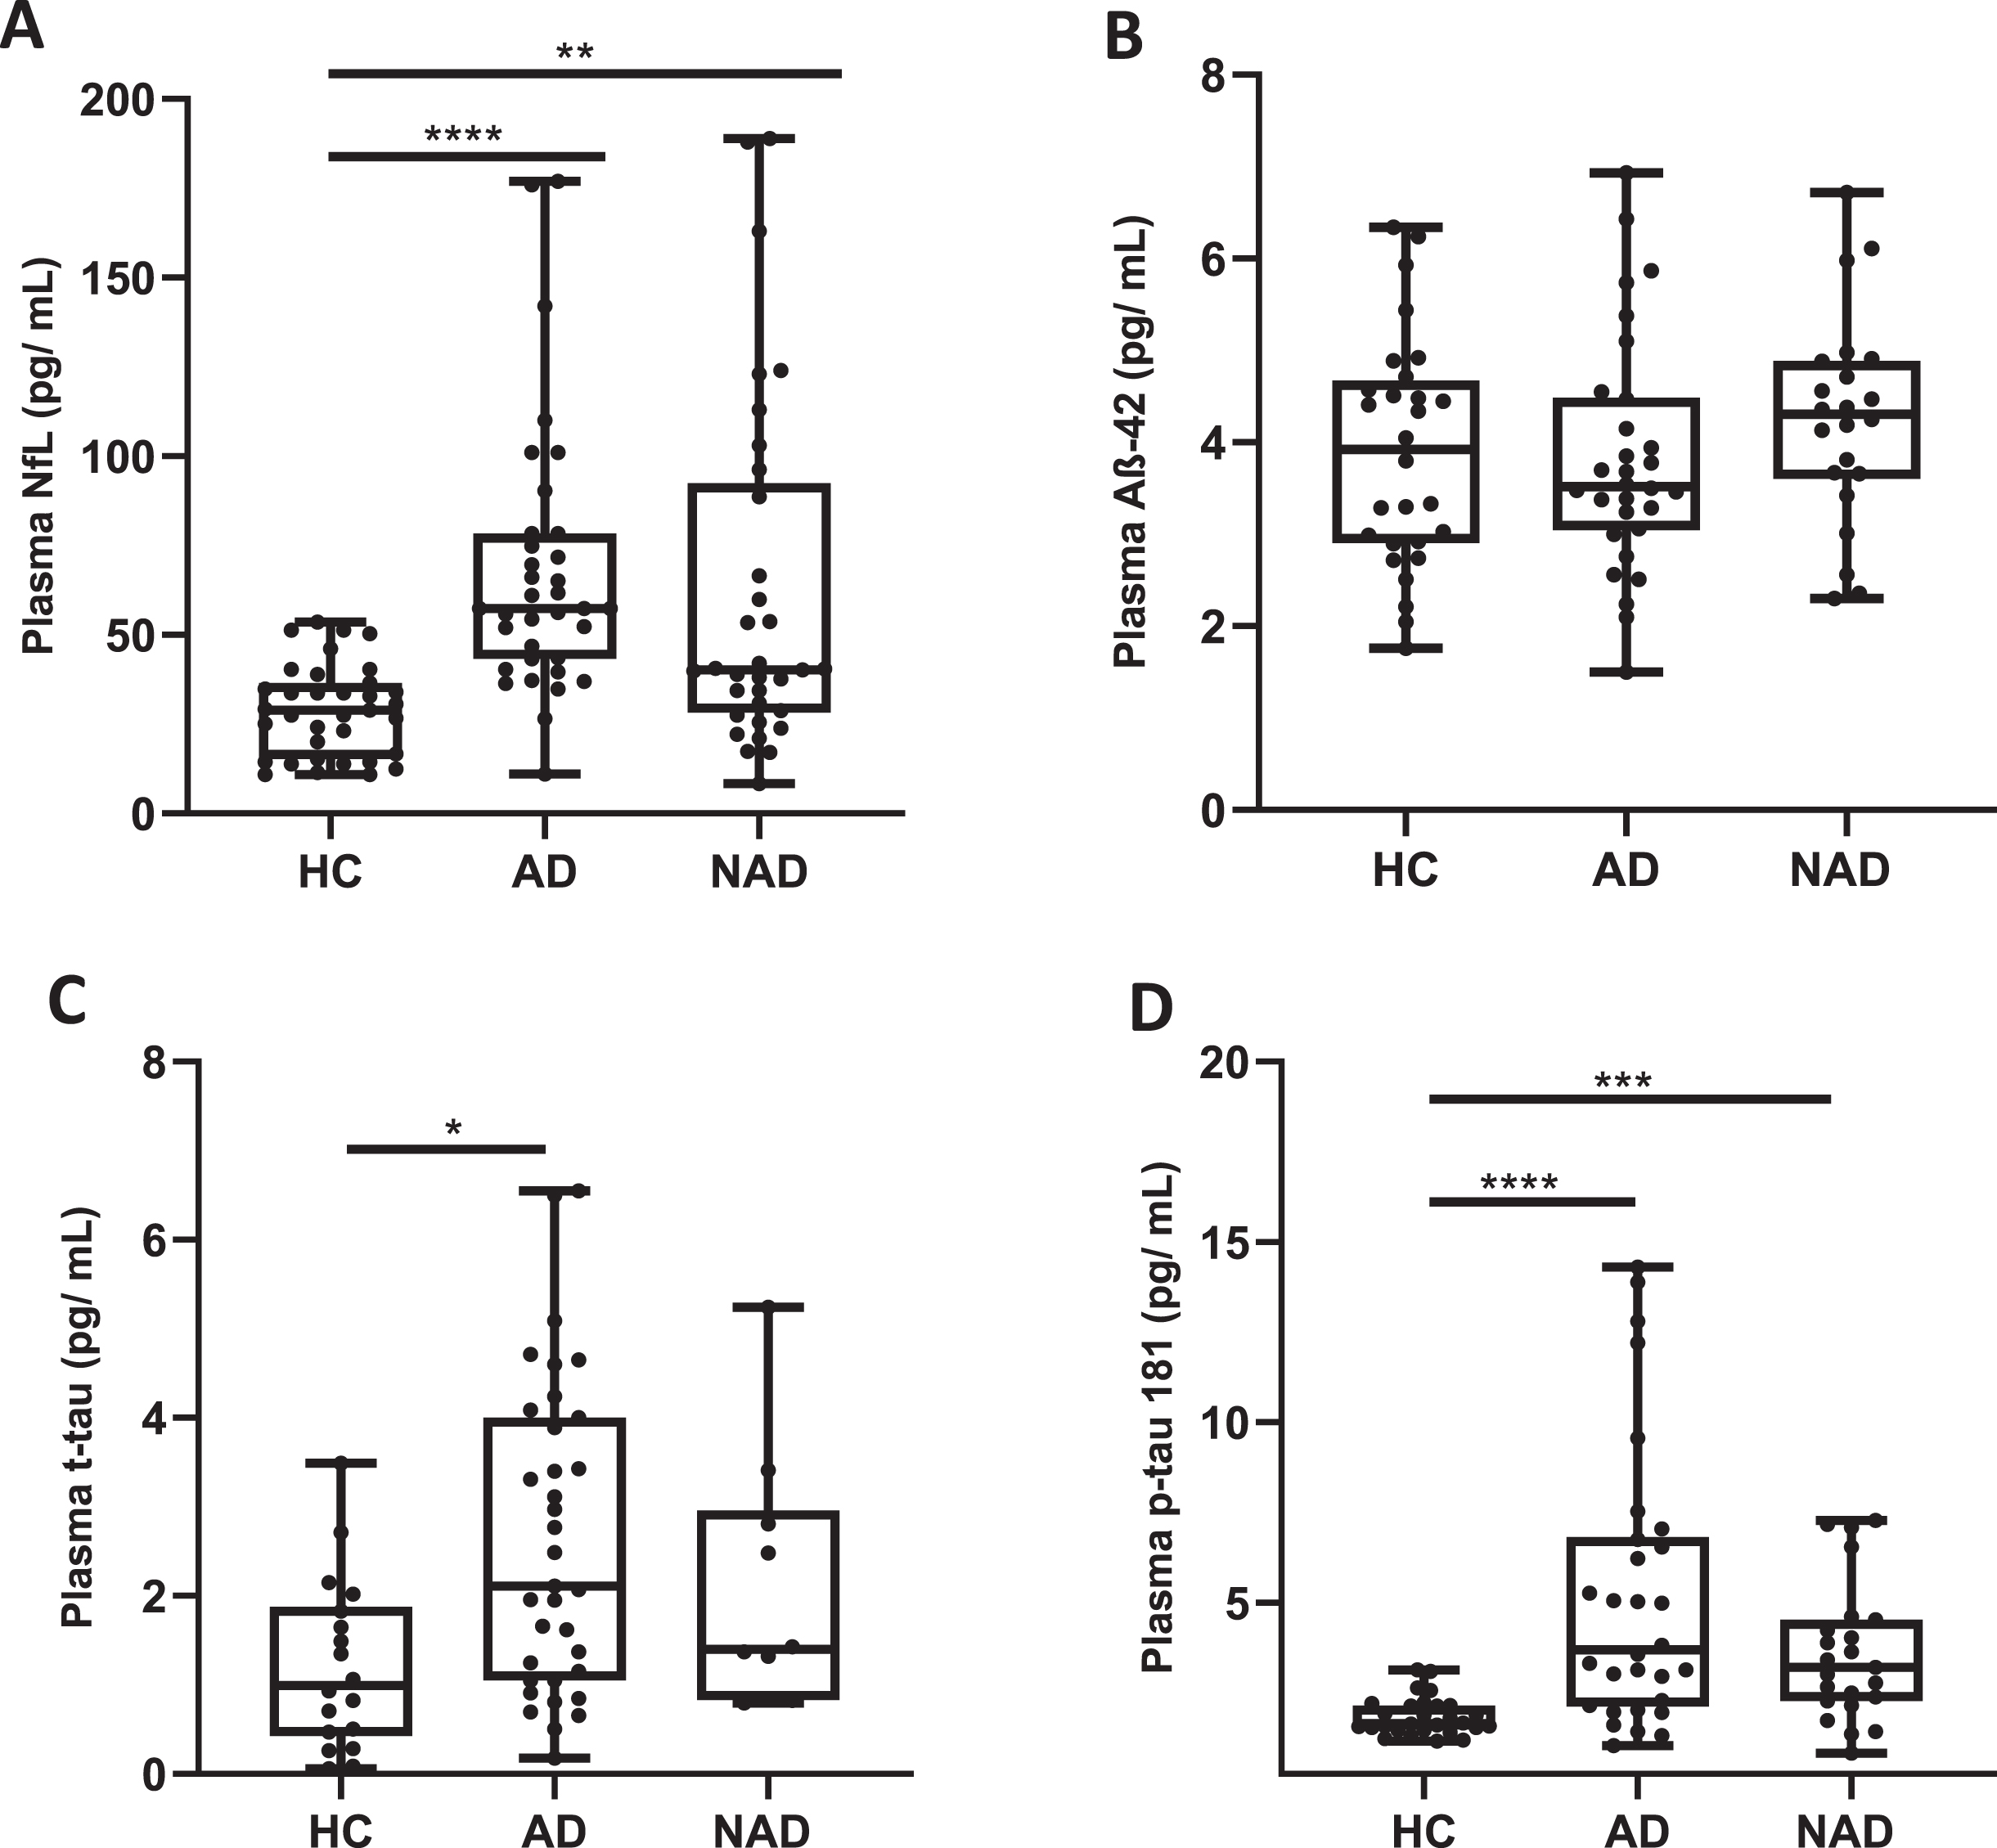
Cross-sectional comparison of the plasma levels of biomarkers revealed that the median concentration of NfL in AD [57.40 (42.55, 78.40) pg/mL; p < 0.0001; n = 35] and NAD [40.20 (27.90, 94.38) pg/mL; p < 0.01; n = 33] groups were significantly higher than that of HC group [29 (15.30, 36.50) pg/mL; n = 35]. The median concentration of Aβ42 in AD [3.5 (3, 4.5) pg/mL; n = 30], NAD (4.3 (3.6, 4.9) pg/mL; n = 22], and HC [3.9 (2.9, 4.7) pg/mL; n = 28] groups were statistically similar. The median concentration of p-tau 181 in AD [3.57 (2.09, 6.65) pg/mL; p < 0.0001; n = 30] and NAD [3.41 (2.27, 4.61) pg/mL; p < 0.001; n = 23] groups were significantly higher than that of the HC group [1.65 (1.49, 2.15) pg/mL; n = 28]. Significant increase in plasma NfL and p-tau 181 in AD, with insignificant changes in plasma Aβ42 levels across AD, NAD, and HC groups reported earlier [5] were replicable in this study, with newly added participants. Further, the median concentration of t-tau in AD [2.11 (1.05, 4.00) pg/mL; p < 0.05; n = 35) group was significantly higher than that of HC group 0.99 (0.42, 1.88) pg/mL; n = 17] whereas NAD [1.40 (0.83, 2.96) pg/mL; n = 10] group showed no significant difference with the HC group (Fig. 1A-D).
Fig. 1
Box plots showing the levels of plasma biomarkers NfL (A), Aβ-42 (B), t-tau (C), and p-tau 181 (D) in healthy controls, AD, and NAD subjects. The central horizontal bars are the median, the lower and the upper boundaries show 25th and 75th percentiles respectively and the whiskers extend till the minimum and the maximum value of data points. p < 0.05 was considered significant; *p < 0.05, **p < 0.01, ***p < 0.001, and ****p < 0.0001.
Diagnostic accuracy of individual biomarkers and panels in differentiating dementia groups
The performance of biomarkers in discriminating the groups were studied by ROC analysis (Table 2). Among them, NfL had the highest AUC (0.88) for AD versus HC, closely followed by p-tau 181 (AUC = 0.83) and t-tau (AUC = 0.74). Aβ42 showed the least discriminatory power when compared to other biomarkers. Next, the ROC analysis for combination of biomarkers were conducted by binary logistic regression. The model comprised of age as a covariate and NfL since it had the highest AUC, to which other markers were added in the order of decreasing AUC values, to assess the changes in discriminatory power on their addition at each step. A remarkable increase in AUC was observed when the biomarkers were combined. It was observed that the addition of p-tau 181 significantly improved the discriminatory power between AD and HC with AUC = 0.89 (Panel 1) and subsequent addition of t-tau (Panel 4) and NfL/Aβ42 (Panel 5) to the model showed a further increase in the AUC, i.e., 0.98 and 0.99 respectively (Fig. 2).
Table 2
Discriminatory value of plasma NfL, Aβ42, t-tau, and p-tau 181 as single biomarkers and as a part of plasma biomarker panel with age as a covariate in differentiating the study groups as assessed using ROC analysis
| Variables | n | AUC (95% CI) | Sensitivity | Specificity |
| AD versus HC | ||||
| NfL | 35 versus 35 | 0.88 (0.79–0.96) | 0.85 | 0.71 |
| Aβ42 | 30 versus 28 | 0.48 (0.45–0.78) | 0.50 | 0.70 |
| t-tau | 35 versus 17 | 0.74 (0.61–0.88) | 0.47 | 0.80 |
| p-tau 181 | 30 versus 28 | 0.83 (0.72–0.94) | 0.85 | 0.70 |
| Panel 1 (NfL, p-tau 181) | 30 versus 28 | 0.89 (0.80–0.97) | 0.92 | 0.76 |
| Panel 2 (p-tau 181, Aβ42) | 30 versus 28 | 0.84 (0.72–0.95) | 0.89 | 0.70 |
| Panel 3 (NfL, p-tau 181, Aβ42) | 30 versus 28 | 0.91 (0.83–0.99) | 0.93 | 0.76 |
| Panel 4 (NfL, p-tau 181, t-tau) | 30 versus 17 | 0.98 (0.95–1.00) | 0.94 | 0.93 |
| Panel 5 (p-tau 181, t-tau, NfL/Aβ42) | 30 versus 17 | 0.99 (0.97–1.00) | 0.94 | 0.96 |
| NAD versus HC | ||||
| NfL | 33 versus 35 | 0.77 (0.65–0.88) | 0.80 | 0.45 |
| Aβ42 | 22 versus 28 | 0.58 (0.43–0.75) | 0.75 | 0.18 |
| t-tau | 10 versus 17 | 0.79 (0.62–0.96) | 0.88 | 0.70 |
| p-tau 181 | 23 versus 28 | 0.87 (0.77–0.97) | 0.85 | 0.65 |
| Panel 1 (NfL, p-tau 181) | 23 versus 28 | 0.86 (0.75–0.97) | 0.89 | 0.68 |
| Panel 2 (p-tau 181, Aβ42) | 22 versus 28 | 0.87 (0.77–0.97) | 0.85 | 0.68 |
| Panel 3 (NfL, p-tau 181, Aβ42) | 22 versus 28 | 0.86 (0.75–0.97) | 0.89 | 0.71 |
| Panel 4 (NfL, p-tau 181, t-tau) | 10 versus 17 | 0.91 (0.79–1.00) | 0.94 | 0.80 |
| Panel 5 (p-tau 181, t-tau, NfL/Aβ42) | 10 versus 17 | 0.91 (0.79–1.00) | 1.0 | 0.80 |
| AD versus NAD | ||||
| NfL | 35 versus 33 | 0.65 (0.51–0.78) | 0.64 | 0.68 |
| Aβ42 | 30 versus 22 | 0.73 (0.61–0.85) | 0.54 | 0.80 |
| t-tau | 35 versus 10 | 0.83 (0.71–0.90) | 0.50 | 0.91 |
| p-tau 181 | 30 versus 23 | 0.72 (0.58–0.86) | 0.56 | 0.76 |
| Panel 1 (NfL, p-tau 181) | 30 versus 23 | 0.74 (0.59–0.87) | 0.54 | 0.80 |
| Panel 2 (p-tau 181, Aβ42) | 30 versus 22 | 0.74 (0.61–0.88) | 0.59 | 0.83 |
| Panel 3 (NfL, p-tau 181, Aβ42) | 30 versus 22 | 0.74 (0.74–0.98) | 0.57 | 0.76 |
| Panel 4 (NfL, p-tau 181, t-tau) | 30 versus 10 | 0.85 (0.73–0.98) | 0.40 | 0.93 |
| Panel 5 (p-tau 181, t-tau, NfL/Aβ42) | 30 versus 10 | 0.87 (0.75–0.98) | 0.40 | 0.93 |
Fig. 2
ROC analysis of the best performing biomarker panel (NfL/Aβ-42, t-tau and p-tau 181) in discriminating AD from HC (AUC = 0.99), NAD from HC (AUC = 0.91), and AD from NAD (AUC = 0.87).
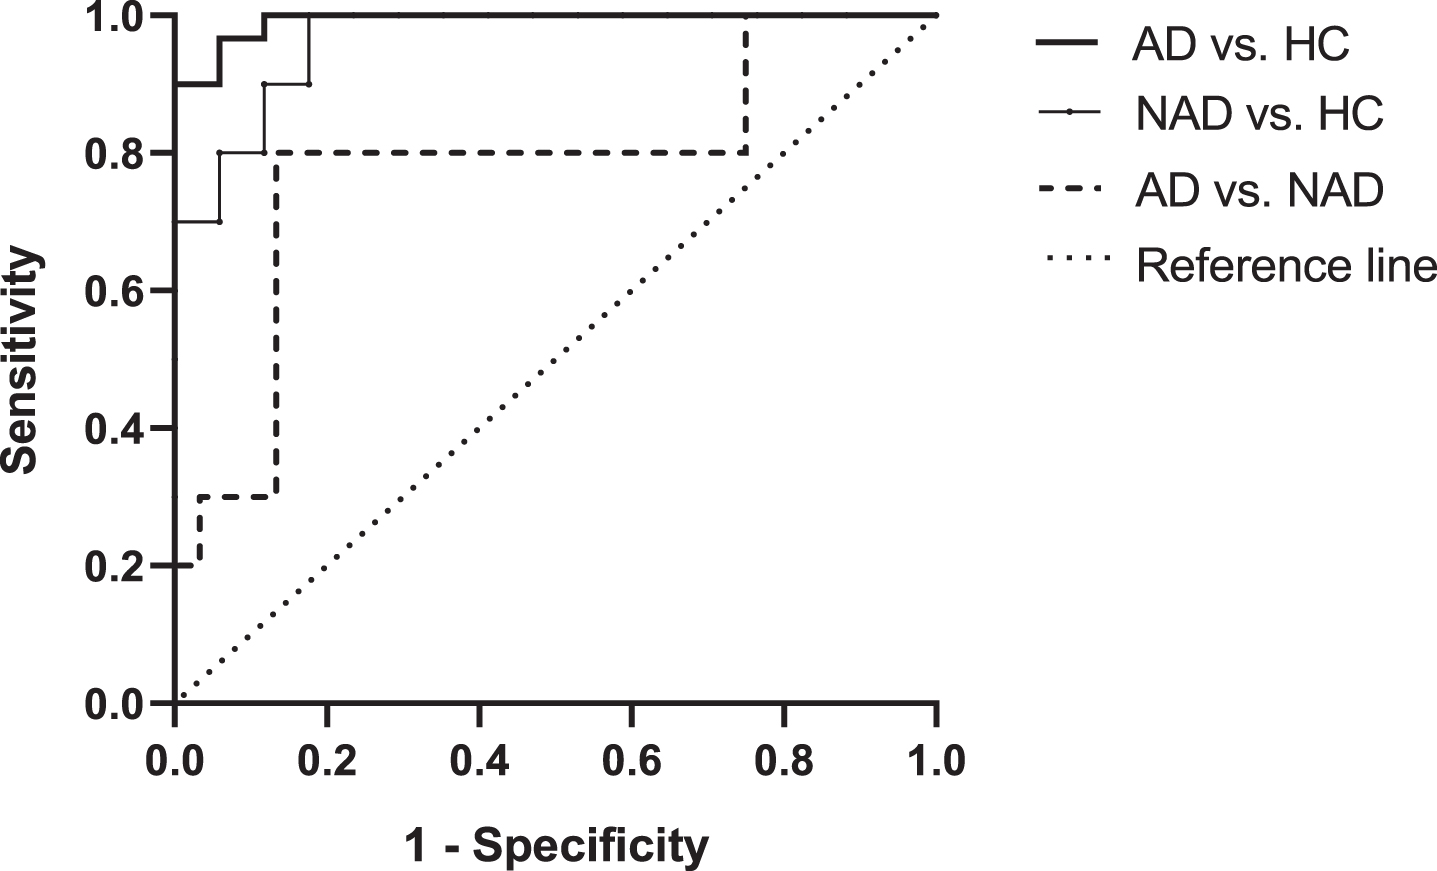
Next, the performance of these biomarkers and panels in discriminating NAD from HC was studied. The panel comprising of NfL/Aβ42, t-tau, and p-tau 181 (Panel 5) has shown an AUC of 0.91 in separating NAD from HC (Fig. 2) with an improved sensitivity of 100% and specificity of 80%.
A similar analysis was performed for the differentiation between AD and NAD groups. It was observed that the performance of analytes was generally less robust when discriminating AD from NAD (Table 2). Among the biomarker panels, highest AUC (0.85) was achieved with panels 4 (NfL, p-tau 181 and t-tau) and 5 (NfL/Aβ42, p-tau 18, and t-tau) (Fig. 2) which showed a sensitivity of 40% and specificity of 93%.
Correlation of biomarker and panels with clinical assessment scores of the subjects
In AD subjects, the plasma NfL levels showed a significant correlation with CDR (r = 0.3463, p = 0.0416) and HMSE (r=–0.5073, p = 0.0019) scores and p-tau 181 levels significantly correlated with all the clinical scores (CDR: r = 0.5148, p = 0.0036; HMSE: r = –0.4522, p = 0.0121, NPI: r = 0.5223, p = 0.0031 and EASI: r = 0.4121, p = 0.0236). In NAD subjects, only plasma NfL significantly correlated with the clinical scores; CDR (r = 0.4639, p = 0.0110) and HMSE (r=–0.4075, p = 0.0349).
The correlation between biomarker panel (NfL, Aβ42, t-tau, and p-tau 181) and clinical scores was also analyzed. It was observed that this combination significantly correlated with all the clinical scores (HMSE: r = 0.6123, p < 0.001; CDR: r = 0.6217, p < 0.001; NPI: r = 0.5356; p < 0.001 and EASI: r = 0.4415, p < 0.05), in AD subjects.
DISCUSSION
The overlap of pathology among the clinically diagnosed subtypes of dementia necessitates the need for biomarker-based diagnosis in the recruitment for clinical trials to evaluate therapeutic interventions for AD and other dementias.
In this study, we evaluated the diagnostic accuracy of biomarkers such as Aβ42, t-tau, p-tau 181, and NfL either as single or in combination in distinguishing AD from healthy control group as well as other non-Alzheimer dementias.
Among the biomarkers analyzed, NfL was significantly higher in both the dementia groups (AD and NAD) over healthy controls; in which AD exhibited a higher degree of neurodegeneration than NAD as indicated by increased NfL levels. NfL is elevated in several neurodegenerative diseases and is considered as a general marker of neurodegeneration. It reflects the degree of axonal damage in neurodegenerative disorders [6]. Studies have reported a strong correlation between CSF and plasma NfL in dementia subjects [7, 8] thus justifying plasma measurements. The t-tau level in plasma was significantly higher in AD group when compared to that of HC group whereas NAD group showed only a marginal increase in tau levels. Tau is a microtubule-associated protein that regulates the assembly and maintenance of microtubules under physiological conditions [9]. Elevation of tau levels in CSF suggests active axonal and neuronal destruction. Plasma t-tau has shown association with cognitive decline and may predict the development of dementia [10]. p-tau 181 is considered as a promising biomarker of AD and is reported to be AD specific though not exclusive. In this study, a significant elevation of p-tau 181 in plasma was observed in both the dementia groups; with the highest concentration observed in AD. The association of plasma p-tau 181 with grey matter loss and atrophy in regions associated with AD pathology has been reported [11]. Giacomucci et al, have reported a strong correlation between plasma and CSF p-tau levels in AD subjects [12]. The elevated p-tau 181 levels observed in NAD group could be largely due to the overlapping AD pathology in other dementia types. There is a large body of literature supporting the coincidence/overlap of VaD and AD [13]. The post-mortem brain tissues of clinically diagnosed LBD cases have revealed the presence of AD-like tau pathology [14].
In ROC analysis, NfL has shown a good accuracy in discriminating AD and NAD from HC with AUC values of 0.88 and 0.77 respectively. t-tau showed an AUC of > 0.70 in both comparisons. p-tau 181 also showed a similar accuracy (>0.80) in discriminating AD and NAD from HC. In either of the comparisons, Aβ42 showed the least discriminatory power among all the biomarkers.
The ROC analysis of HC group versus AD or NAD had a strong resemblance in the discriminatory efficiency of these biomarkers. This similarity between the results implicates an overlap of pathology between AD and other dementia groups [15]. This was further confirmed by ROC analysis between AD and NAD groups, in which none of the standalone biomarkers could reliably distinguish the two groups.
Studies indicate that multivariate biomarker panels linked to different biological pathways may be able to detect AD more accurately than individual indicators given the heterogeneous nature of AD. A recent study has shown that a combination of Aβ42/Aβ40, p-tau 181, NfL, and glial fibrillary acidic protein (GFAP) could differentiate AD from FTD and LBD [16].
On similar lines, in this study, approach of multiple biomarker panel considerably increased the sensitivity and specificity in separating AD and NAD from HC group. A remarkable improvement in the accuracy was observed with a panel comprising the biomarkers (NfL/Aβ42, t-tau, and p-tau 181) in differentiating AD from HC (0.99); NAD from HC (0.92) and importantly, in differentiating AD from NAD (0.85) with a specificity of 0.93. The low sensitivity of 0.40 is possibly due to certain pathogenic mechanisms shared by various dementias.
The overlapping pathology can occur due to several reasons. AD is comorbid with various neurodegenerative dementias or vascular risk factors which may affect the separation of AD from other dementias. Our cohort of NAD comprised mostly of FTD syndromes, dementias with vascular pathology, LBD, and mixed type cases. Tau pathology is another important factor that is common to tauopathies. Various isoforms of tau appear as aggregates in brain and are characteristic pathologic features of tauopathies including AD and various FTD syndromes such as Pick’s disease, progressive supranuclear palsy, corticobasal degeneration, etc. [17].
Although amyloid pathology is a central event in AD, a recent study has reported Aβ accumulation in cognitively normal individuals [18]. Adding to the complexity, several FTD syndromes and LBD cases have also reported the presence amyloid pathology at autopsy [19, 20]. These observations dampen the choice of plasma amyloid measurements in AD diagnosis and the current findings are in same agreement.
In this study, correlation analysis of biomarker panel with clinical scores showed a significant association in AD subjects whereas such a correlation was lacking with NAD subjects. The data suggests that the multivariate analysis of biomarkers coupled with neuropsychological assessments would be able to improve diagnosis of AD.
This study has several limitations. The sample size was relatively small. Discriminatory analysis between AD and subgroups of NAD such as FTD, VaD, LBD and MD could not be assessed due to smaller sample size in each sub-group. Supporting data from CSF measurements and neuroimaging of biomarkers regarding the diagnosis of AD or other dementias was lacking. Another limitation is that Aβ40 in plasma was not measured in our study. Thus Aβ42/Aβ40 ratios could not be included for biomarker evaluation. However, this is one of the first few studies from India that has analyzed a panel of blood-based biomarker proteins in discriminating AD, NAD, and HC. Validation of the proposed biomarkers in larger cohorts and longitudinal studies are warranted.
ACKNOWLEDGMENTS
The authors have no acknowledgments to report.
FUNDING
Financial assistance from Science and Engineering Research Board, New Delhi, India [Grant no. EMR/2017/000849] is gratefully acknowledged. GK is a recipient of Senior Research Fellowship from Council of Scientific and Industrial Research, New Delhi, India.
CONFLICT OF INTEREST
The authors have no conflict of interest to report.
DATA AVAILABILITY
The data is available from the corresponding author (SS), upon reasonable request.
REFERENCES
[1] | Gauthier S , Webster C , Servaes S , Morais JA , Rosa-Neto P (2022) World Alzheimer Report 2022. Life after diagnosis: Navigating treatment, care and support. Alzheimer’s Disease International, London. |
[2] | Laccarino L , Burnham SC , Dell’Agnello G , Dowsett SA , Epelbaum S ((2023) ) Diagnostic biomarkers of amyloid and tau pathology in Alzheimer’s disease: An overview of tests for clinical practice in the United States and Europe. J Prev Alzheimers Dis 10: , 426–442. |
[3] | Georgakas JE , Howe MD , Thompson LI , Riera NM , Riddle MC ((2023) ) Biomarkers of Alzheimer’s disease: Past, present and future clinical use. Biomark Neuropsychiatry 8: , 100063. |
[4] | Hardy-Sosa A , León-Arcia K , Llibre-Guerra JJ , Berlanga-Acosta J , Baez SC , Guillen-Nieto G , Valdes-Sosa PA ((2022) ) Diagnostic accuracy of blood-based biomarker panels: A systematic review. Front Aging Neurosci 14: , 683689. |
[5] | Subramanian S , Krishna G , Sivakumar PT , Dahale AB , Kumar JS , Sinha P , Varghese M ((2021) ) Plasma neurofilament L to amyloid β42 ratio in differentiating Alzheimer’s type from non-Alzheimer’s dementia: A cross-sectional pilot study from India. Asian J Psychiatr 66: , 102914. |
[6] | Gordon BA ((2020) ) Neurofilaments in disease: What do we know? Curr Opin Neurobiol 61: , 105–115. |
[7] | Benedet AL , Ashton NJ , Pascoal TA , Leuzy A , Mathotaarachchi S , Kang MS , Therriault J , Savard M , Chamoun M , Schöll M , Zimmer ER , Gauthier S , Labbe A , Zetterberg H , Blennow K , Neto PR ((2019) ) Plasma neurofilament light associates with Alzheimer’s disease metabolic decline in amyloid-positive individuals. Alzheimers Dement (Amst) 11: , 679–689. |
[8] | Álvarez-Sánchez L , Peña-Bautista C , Ferré-González L , Balaguer A , Baquero M , Casanova-Estruch B , Cháfer-Pericás C ((2023) ) Assessment of plasma andcerebrospinal fluid biomarkers in different stages of Alzheimer’sdisease and frontotemporal dementia. Int J Mol Sci 24: , 1226. |
[9] | Robbins M , Clayton E , Kaminski Schierle GS ((2021) ) Synaptic tau: A pathological or physiological phenomenon? Acta Neuropathol Commun 9: , 149. |
[10] | Pase MP , Beiser AS , Himali JJ , Satizabal CL , Aparicio HJ , DeCarli C , Chêne G , Dufouil C , Seshadri S ((2019) ) Assessment of plasma totaltau level as a predictive biomarker for dementia and related endophenotypes. JAMA Neurol 76: , 598–606. |
[11] | Tissot CL , Benedet A , Therriault J , Pascoal TA , Lussier FZ , Saha-Chaudhuri P , Chamoun M , Savard M , Mathotaarachchi SS , Bezgin G , Wang YT , Fernandez Arias J , Rodriguez JL , Snellman A , Ashton NJ , Karikari TK , Blennow K , Zetterberg H , De Villers-Sidani E , Huot P , Gauthier S , Rosa-Neto P , Alzheimer’s Disease Neuroimaging Initiative ((2021) ) Plasma pTau181 predicts cortical brain atrophy in aging and Alzheimer’s disease. Alzheimers Res Ther 13: , 69. |
[12] | Giacomucci G , Mazzeo S , Crucitti C , Ingannato A , Bagnoli S , Padiglioni S , Galdo G , Emiliani F , Frigerio D , Moschini V , Morinelli C , Sorbi S , Bessi V , Nacmias B ((2023) ) Plasma p-tau181 as a promising non-invasive biomarker of Alzheimer’s disease pathology in subjective cognitive decline and mild cognitive impairment. J Neurol Sci 453: , 120805. |
[13] | Nordestgaard LT , Christoffersen M , Frikke-Schmidt R ((2022) ) Shared risk factors between dementia and atherosclerotic cardiovascular disease. Int J Mol Sci 23: , 9777. |
[14] | Thomas AJ , Hamilton CA , Heslegrave A , Barker S , Durcan R , Lawley S , Barnett N , Lett D , Firbank M , Roberts G , Taylor JP , Donaghy PC , Zetterberg H , O’Brien J ((2022) ) A longitudinal study of plasma ptau181 in mild cognitive impairment with Lewy bodies and Alzheimer’s disease. Mov Disord 37: , 1495–1504. |
[15] | Wilson DM , 3rd Cookson MR , Van Den Bosch L , Zetterberg H , Holtzman DM , Dewachter I ((2023) ) Hallmarks of neurodegenerative diseases. Cell 186: , 693–714. |
[16] | Thijssen EH , Verberk IMW , Kindermans J , Abramian A , Vanbrabant J , Ball AJ , Pijnenburg Y , Lemstra AW , van der Flier WM , Stoops E , Hirtz C , Teunissen CE ((2022) ) Differential diagnostic performance of a panel of plasma biomarkers for different types of dementia. Alzheimers Dement (Amst) 14: , e12285. |
[17] | Holper S , Watson R , Yassi N ((2022) ) Tau as a biomarker of neurodegeneration. Int J Mol Sci 23: , 7307. |
[18] | Sun Y , Zhao Y , Hu K , Wang M , Liu Y , Liu B , Alzheimer’s Disease Neuroimaging Initiative ((2023) ) Distinct spatiotemporal subtypes of amyloid deposition are associated with diverging disease profiles in cognitively normal and mild cognitive impairment individuals. Transl Psychiatry 13: , 35. |
[19] | Tan RH , Kril JJ , Yang Y , Tom N , Hodges JR , Villemagne VL , Rowe CC , Leyton CE , Kwok JBJ , Ittner LM , Halliday GM ((2017) ) Assessment of amyloid β in pathologically confirmed frontotemporal dementia syndromes. Alzheimers Dement (Amst) 9: , 10–20. |
[20] | Paterson RW , Slattery CF , Poole T , Nicholas JM , Magdalinou NK , Toombs J , Chapman MD , Lunn MP , Heslegrave AJ , Foiani MS , Weston PSJ , Keshavan A , Rohrer JD , Rossor MN , Warren JD , Mummery CJ , Blennow K , Fox NC , Zetterberg H , Schott JM ((2018) ) Cerebrospinal fluid in the differential diagnosis of Alzheimer’s disease: Clinical utility of an extended panel of biomarkers in a specialist cognitive clinic. Alzheimers Res Ther 10: , 32. |


