
Diagnosis of Alzheimer’s Disease and Mild Cognitive Impairment Using Convolutional Neural Networks
Abstract
Background:
Alzheimer’s disease and mild cognitive impairment are common diseases in the elderly, affecting more than 50 million people worldwide in 2020. Early diagnosis is crucial for managing these diseases, but their complexity poses a challenge. Convolutional neural networks have shown promise in accurate diagnosis.
Objective:
The main objective of this research is to diagnose Alzheimer’s disease and mild cognitive impairment in healthy individuals using convolutional neural networks.
Methods:
This study utilized three different convolutional neural network models, two of which were pre-trained models, namely AlexNet and DenseNet, while the third model was a CNN1D-LSTM neural network.
Results:
Among the neural network models used, the AlexNet demonstrated the highest accuracy, exceeding 98%, in diagnosing mild cognitive impairment and Alzheimer’s disease in healthy individuals. Furthermore, the accuracy of the DenseNet and CNN1D-LSTM models is 88% and 91.89%, respectively.
Conclusions:
The research highlights the potential of convolutional neural networks in diagnosing mild cognitive impairment and Alzheimer’s disease. The use of pre-trained neural networks and the integration of various patient data contribute to achieving accurate results. The high accuracy achieved by the AlexNet neural network underscores its effectiveness in disease classification. These findings pave the way for future research and improvements in the field of diagnosing these diseases using convolutional neural networks, ultimately aiding in early detection and effective management of mild cognitive impairment and Alzheimer’s disease.
INTRODUCTION
Alzheimer’s disease is a progressive brain disorder that causes memory loss and cognitive decline due to the death of brain cells. It is the most common type of dementia and has a significant negative impact on both the individual and social life of affected individuals. According to recent statistics, more than 46.8 million people worldwide are currently suffering from dementia, with 44 million people suffering from Alzheimer’s disease. This number is expected to increase to 131.5 million by 2050 [1, 2]. With the advancements in various imaging technologies such as magnetic resonance imaging, positron emission tomography, and computed tomography in medical examinations, many attempts have been made to process, simulate, and interpret the results for computer purposes. This accurate diagnosis is crucial for medical professionals [3]. Deep learning is a subset of machine learning in artificial intelligence that allows a machine to learn classification tasks from raw data due to its multi-layered or ordered network structure. A convolutional neural network is used to extract high-level features from image classification and prediction. Because of its high success in image analysis and classification, it is the most used deep learning algorithm [4]. Convolutional neural networks can hierarchically extract the most distinct feature representations. 2D convolutional neural networks have achieved excellent performance in the diagnosis of Alzheimer’s disease [5]. There are two general approaches to classifying Alzheimer’s disease. The first approach is binary classification, which classifies healthy people against Alzheimer’s disease or mild cognitive impairment and the second is multi-classification which classifies the disease in different levels from healthy, Alzheimer’s, mild cognitive impairment, etc. [6]. In, a five-step method is proposed to classify MRI images which includes acquisition and annotation, pre-processing and data augmentation, cross-validation, convolutional neural network model, and classification of Alzheimer’s disease. This method uses machine learning and digital image processing to predict whether they have Alzheimer’s or not. In [7], considering previous studies, behaviors of convolutional neural networks are identified by moving from 2D to 3D architecture. The purpose of this study is to examine the output of various convolutional neural network models that have been implemented to classify brain MRI or positron emission tomography images in order to predict Alzheimer’s disease. Also, this study has tried to summarize the characteristics of this model with various parameters that are adjusted and changed. In [4], a basic architecture has been tested by changing the reception area based on the size of the convolution layer kernel and its steps. This research studies a simple encoder-based convolutional neural network with a sequential flow of features from low-level to high-level feature extraction. The idea is to provide a divergent reception by increasing the size of the filter and the stride from lower to higher levels. So, feature redundancy is reduced and the unimportant features fade away. The proposed architecture is called “DivNet” [7].
In [8], the dataset consists of four classes: very mild dementia, mild dementia, moderate dementia, and non-dementia. First, the dataset was prepared and pre-processed and the network was trained with this dataset. The purpose of the hybrid model is to benefit from the current knowledge of ResNet-50 architecture. In the improved hybrid model, the last five layers of ResNet-50 have been removed. Ten new layers have been added instead of these deleted layers and the number of layers has been increased from 177 to 182.
In [4], a convolutional neural network has been implemented for the diagnosis and classification of Alzheimer’s disease using MRI images. Researchers used positron emission tomography and MRI imaging, cognitive tests, genetics, and blood characteristics as predictors of Alzheimer’s disease. The dataset was collected from two sources and has three classes which are mild images, normal control, and Alzheimer’s disease. The training dataset along with the test dataset contains 7635 images. One of the main reasons for combining data from two sources is to increase the number of images and improve the performance of the model.
In response to the challenge of classifying Alzheimer’s disease using deep learning, a convolutional neural network method with 18-layer architecture is proposed in [9] so that ResNet architecture has been used with changes for the training process. The activation function used in the last residual block has been modified before the pooling process. The Mish activation function is used to replace the modified linear unit activation function, which is the default activation function of ResNet architecture. Mish is a non-uniform activation function that is smooth, continuous, and self-adjusting. The Mish function uses the self-gating feature where the non-modulated input is multiplied by the output of the input nonlinear function [10, 11].
Another architecture called multi-plane convolutional neural network has been introduced which is used in its design from multiple inputs. It has been evaluated using T1-weighted structural MRI data, which includes 500 cases of Alzheimer’s disease, 500 cases of mild cognitive impairment, and 500 cases of normal control, and collected from the Alzheimer’s disease neuroimaging database. The designed network consists of 14 layers including input and output layers [9].
Research [12] proposes a method for developing an automatic classification system for Alzheimer’s disease using the AlexNet architecture. It has been done using MRI images to classify without dementia, very mild dementia, mild dementia, and moderate dementia. DenseNet -121 trained by MRI images and the accuracy of Alzheimer’s disease diagnosis has been measured using it in [13].
Three-dimensional neural networks are computationally much more complex and require more computational resources. This can lead to longer training and execution times for the required models. Additionally, the use of three-dimensional networks necessitates stronger hardware resources, as running three-dimensional models requires more memory and processing power. Iranian hospitals, in general, face limitations in terms of powerful computer systems. Therefore, the development and use of three-dimensional neural networks in Iranian hospitals are generally hindered by technical difficulties and hardware limitations. As a result, the aim of this research is to utilize two-dimensional neural networks and one-dimensional neural networks for diagnosing Alzheimer’s disease and mild cognitive impairment from healthy individuals.
In this research, unique settings have been used for the AlexNet and DenseNet neural networks, which have not been used in other related research. For example, the Adam optimizer has been used for the AlexNet neural network, while in the study [3], the SGD optimizer was used for AlexNet. Additionally, the DenseNet-BC neural network has been used for the three-dimensional dataset, but in this study, it has been applied to a two-dimensional dataset. In addition to AlexNet and DenseNet neural networks, a one-dimensional neural network has been utilized.
The remainder of this paper is organized as follows: In the materials and methods section, the dataset and proposed neural network models will be introduced. Then, the results obtained from the experiments will be presented. Finally, the discussion and analysis of the results will be conducted, along with a comparison to related research studies.
MATERIALS AND METHODS
Dataset
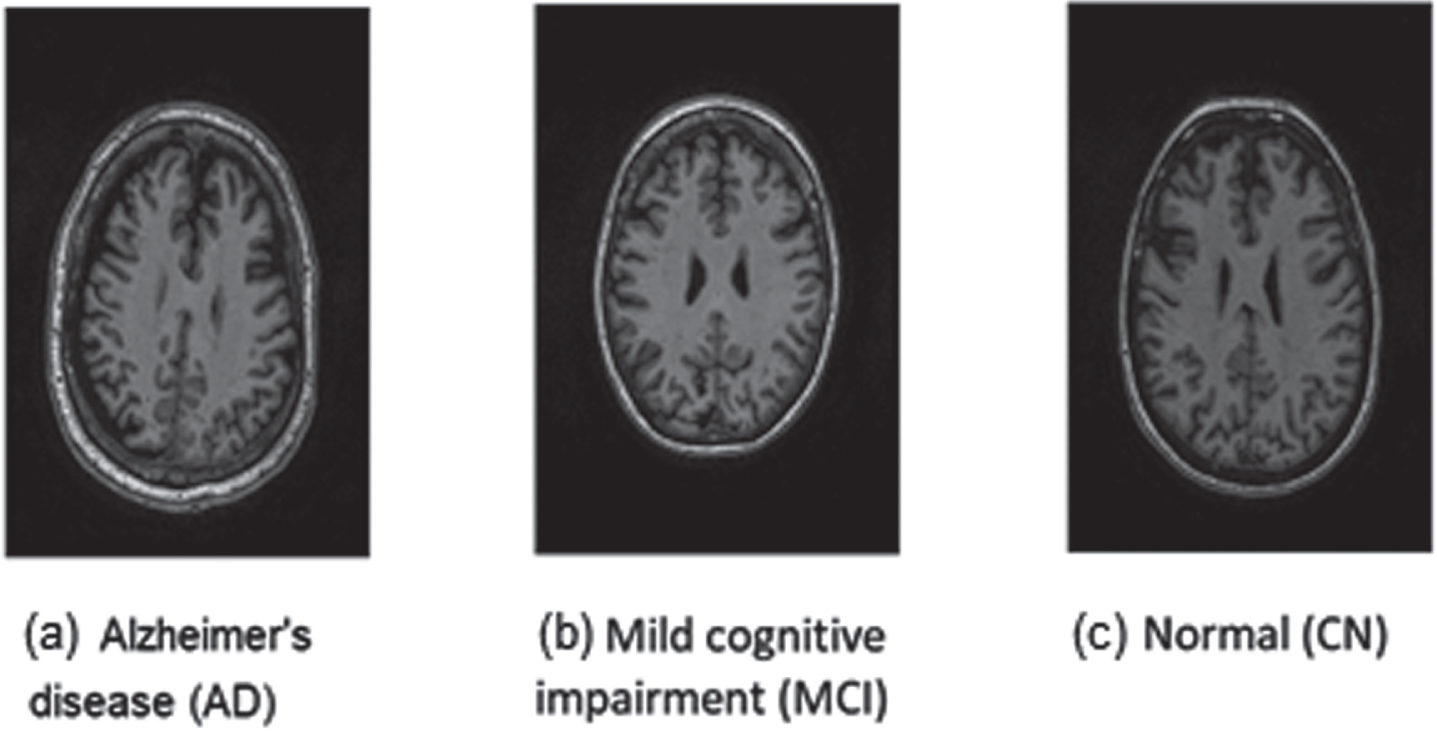
The dataset used in this paper is the Alzheimer’s Disease Neuroimaging Initiative [14]. The original images of this dataset are in 3D formats. For convenience in using convolutional neural network algorithms, another dataset has been used which has two-dimensional images and is taken from Alzheimer’s disease neuroimaging data. In other words, the dataset used in the paper was downloaded from the Kaggle website. However, the images used on this website are actually the same ADNI website images that have been converted into two dimensions. Considering that the 3D images have been converted to 2D, as a result, each person in this dataset has several different images. The utilized 2D images in the dataset are of the T1-weighted type. Additionally, for calculating the NDI (Neurite Density Index) and ODI (Orientation Dispersion Index) parameters in the neurite orientation dispersion and density imaging (NODDI) method, diffusion-weighted images have been used for each patient. The dataset used in terms of the type of disease includes 3 separate classes; the number of samples of each class is listed in Table 1. Also, a sample image of each data set class is shown in Fig. 1.
Table 1
Classes of Alzheimer’s Disease Neuroimaging Initiative dataset based on the type of disease
| Class name | Description | Number of samples |
| AD | Alzheimer’s disease | 1124 |
| MCI | Mild cognitive impairment | 2590 |
| CN | healthy people | 1440 |
Fig. 1
Three different examples of brain images from people with (a) Alzheimer’s disease, (b) mild cognitive impairment, and (c) healthy people.
In the ADNI dataset, there exists an additional tabular dataset for each patient, representing some of the features obtained from the patients. In Table 2, numerical features used in this dataset have been subjected to statistical analysis. In addition to these numerical features, non-numerical attributes such as Gender, Race, Nationality, and Marital status have been utilized in this research.
Table 2
Characteristics of individuals in Alzheimer’s Disease Neuroimaging Initiative dataset
| Characteristics | AD | MCI | CN |
| Age, mean(std)[Range],y | 73.47 (7.99) | 74.24 (8.11) | 74.58 (3.76) |
| [56.4 - 89.1] | [55.2 - 87.9] | [70.0 - 85.8] | |
| Female Sex, No(%) | 100 (9.77) | 166 (16.21) | 264 (25.78) |
| Male Sex, No(%) | 51 (4.98) | 324 (31.64) | 119 (11.62) |
| Married, No(%) | 120 (11.72) | 447 (43.65) | 269 (26.27) |
| Single, No(%) | 31 (3.03) | 43 (4.2) | 114 (11.13) |
| MMSE, mean(std)[Range] | 21.19 (4.96) | 25.01 (3.82) | 29.05 (1.32) |
| [0.0 - 29.0] | [9.0 - 30.0] | [19.0 - 30.0] | |
| ASCS, mean(std)[Range] | 22.0 (10.02) | 15.39 (8.24) | 5.72 (3.27) |
| [6.33 - 63.0] | [2.0 - 57.0] | [0.67 - 18.0] | |
| RAVLT, mean(std)[Range] | 19.68 (8.28) | 25.75 (9.01) | 43.72 (10.22) |
| [0.0 - 40.0] | [0.0 - 58.0] | [14.0 - 67.0] |
For age, mini-mental state examination (MMSE), Assessment Scale-Cognitive Subscale (ASCS), and Rey Auditory Verbal Learning Test (RAVLT) features, the first value represents the mean, the value inside the parentheses indicates the standard deviation, and the value inside the brackets denotes the minimum and maximum values associated with the respective feature. For the male and female gender features, as well as the married and single status, the first number indicates the count of that feature relative to the total members of the dataset, and the second number in prantesis represents the percentage of that feature from the total.
In Table 2, the last three rows represent various tests related to Alzheimer’s disease and mild cognitive impairment, which have been conducted on each patient. The concept of the numerical score for each of these tests is as follows [14]:
• MMSE: A score of 25 or higher is considered a normal classification. If the score is below 24, an abnormal result is typically considered indicating a potential cognitive impairment. The maximum score for the Mini-Mental State Examination is 30.
• ASCS: higher scores (≥18) indicate greater cognitive impairment.
• RAVLT: RAVLT consists of five consecutive trials presenting a list of 15 words. The list is read aloud to the participant and immediately afterwards, the participant is asked to recall as many words as possible. This procedure is repeated for five consecutive trials (Trials 1 to 5). The range of scores for the RAVLT in this dataset is 0 to 75. The normal range for this test may vary depending on various factors such as age, gender, and education level of the individual. However, the normal threshold for this test is considered to be 85% of the total test score. In other words, individuals who score higher than 85% of the total test score have a normal performance on this test.
Models
In this paper, three different types of convolutional neural networks are used, namely AlexNet, DenseNet, and one-dimensional convolutional neural networks with LSTM layers in order to diagnose Alzheimer’s disease and mild cognitive impairment and normal people. The input of AlexNet and DenseNet is the original image. Based on the previously trained features, they easily learn the new features in the brain images and finally give a model as an output that can be used to accurately predict Alzheimer’s disease or mild cognitive impairment or a healthy person. In addition to the numerical characteristics resulting from the orientation dispersion and density of the microstructures in the cerebral cortex of the patients.
The input of the one-dimensional convolutional neural network includes individual characteristics, such as gender, race, ethnicity, and marital status, and the score of the Mini–mental state examination, the score of Assessment Scale-Cognitive Subscale, and the score of the Rey Auditory Verbal Learning Test.
In this study, the dataset is divided into two categories: 80% for training and 20% for testing. Also, 30% of the training data is randomly considered as validation data at each stage of the training process. Finally, images were classified and each model was evaluated using different metrics.
Most of the research conducted in the field of Alzheimer’s disease diagnosis has been done using neural networks to distinguish Alzheimer’s disease or mild cognitive impairment from healthy individuals. These neural networks have mostly been two-dimensional convolutional neural networks, dividing the subjects into two categories: Alzheimer’s disease patients and healthy individuals, or mild cognitive impairment patients and healthy individuals. In these studies, researchers train either arbitrary or pre-trained convolutional neural networks on MRI images of patients and use the resulting model to diagnose the disease. Furthermore, these studies have not made any use of personal information such as age, gender, marital status, psychological test scores obtained from the patients, etc., in the neural network. This research aims to implement these overlooked factors as innovations and examine the obtained results with the accuracy of different models. The following are the proposed implementations:
• The use of AlexNet convolutional neural network for distinguishing patients with Alzheimer’s disease, mild cognitive impairment, and healthy individuals from each other.
• The use of DenseNet convolutional neural network for distinguishing patients with Alzheimer’s disease, mild cognitive impairment, and healthy individuals from each other.
• The use of one-dimensional convolutional neural network to simultaneously utilize numerical data extracted from MRI images and personal information of patients, including age, gender, marital status, etc.
AlexNet neural network model
AlexNet is a deep neural network architecture used for pattern recognition in images. AlexNet consists of eight layers, including five convolutional layers followed by max-pooling layers, and three fully connected layers. Figure 2 depicts the proposed model for diagnosing Alzheimer’s disease and mild cognitive impairment from healthy individuals using the AlexNet convolutional neural network.
Fig. 2
Proposed model for diagnosing Alzheimer’s disease and mild cognitive impairment from healthy individuals using the AlexNet model.
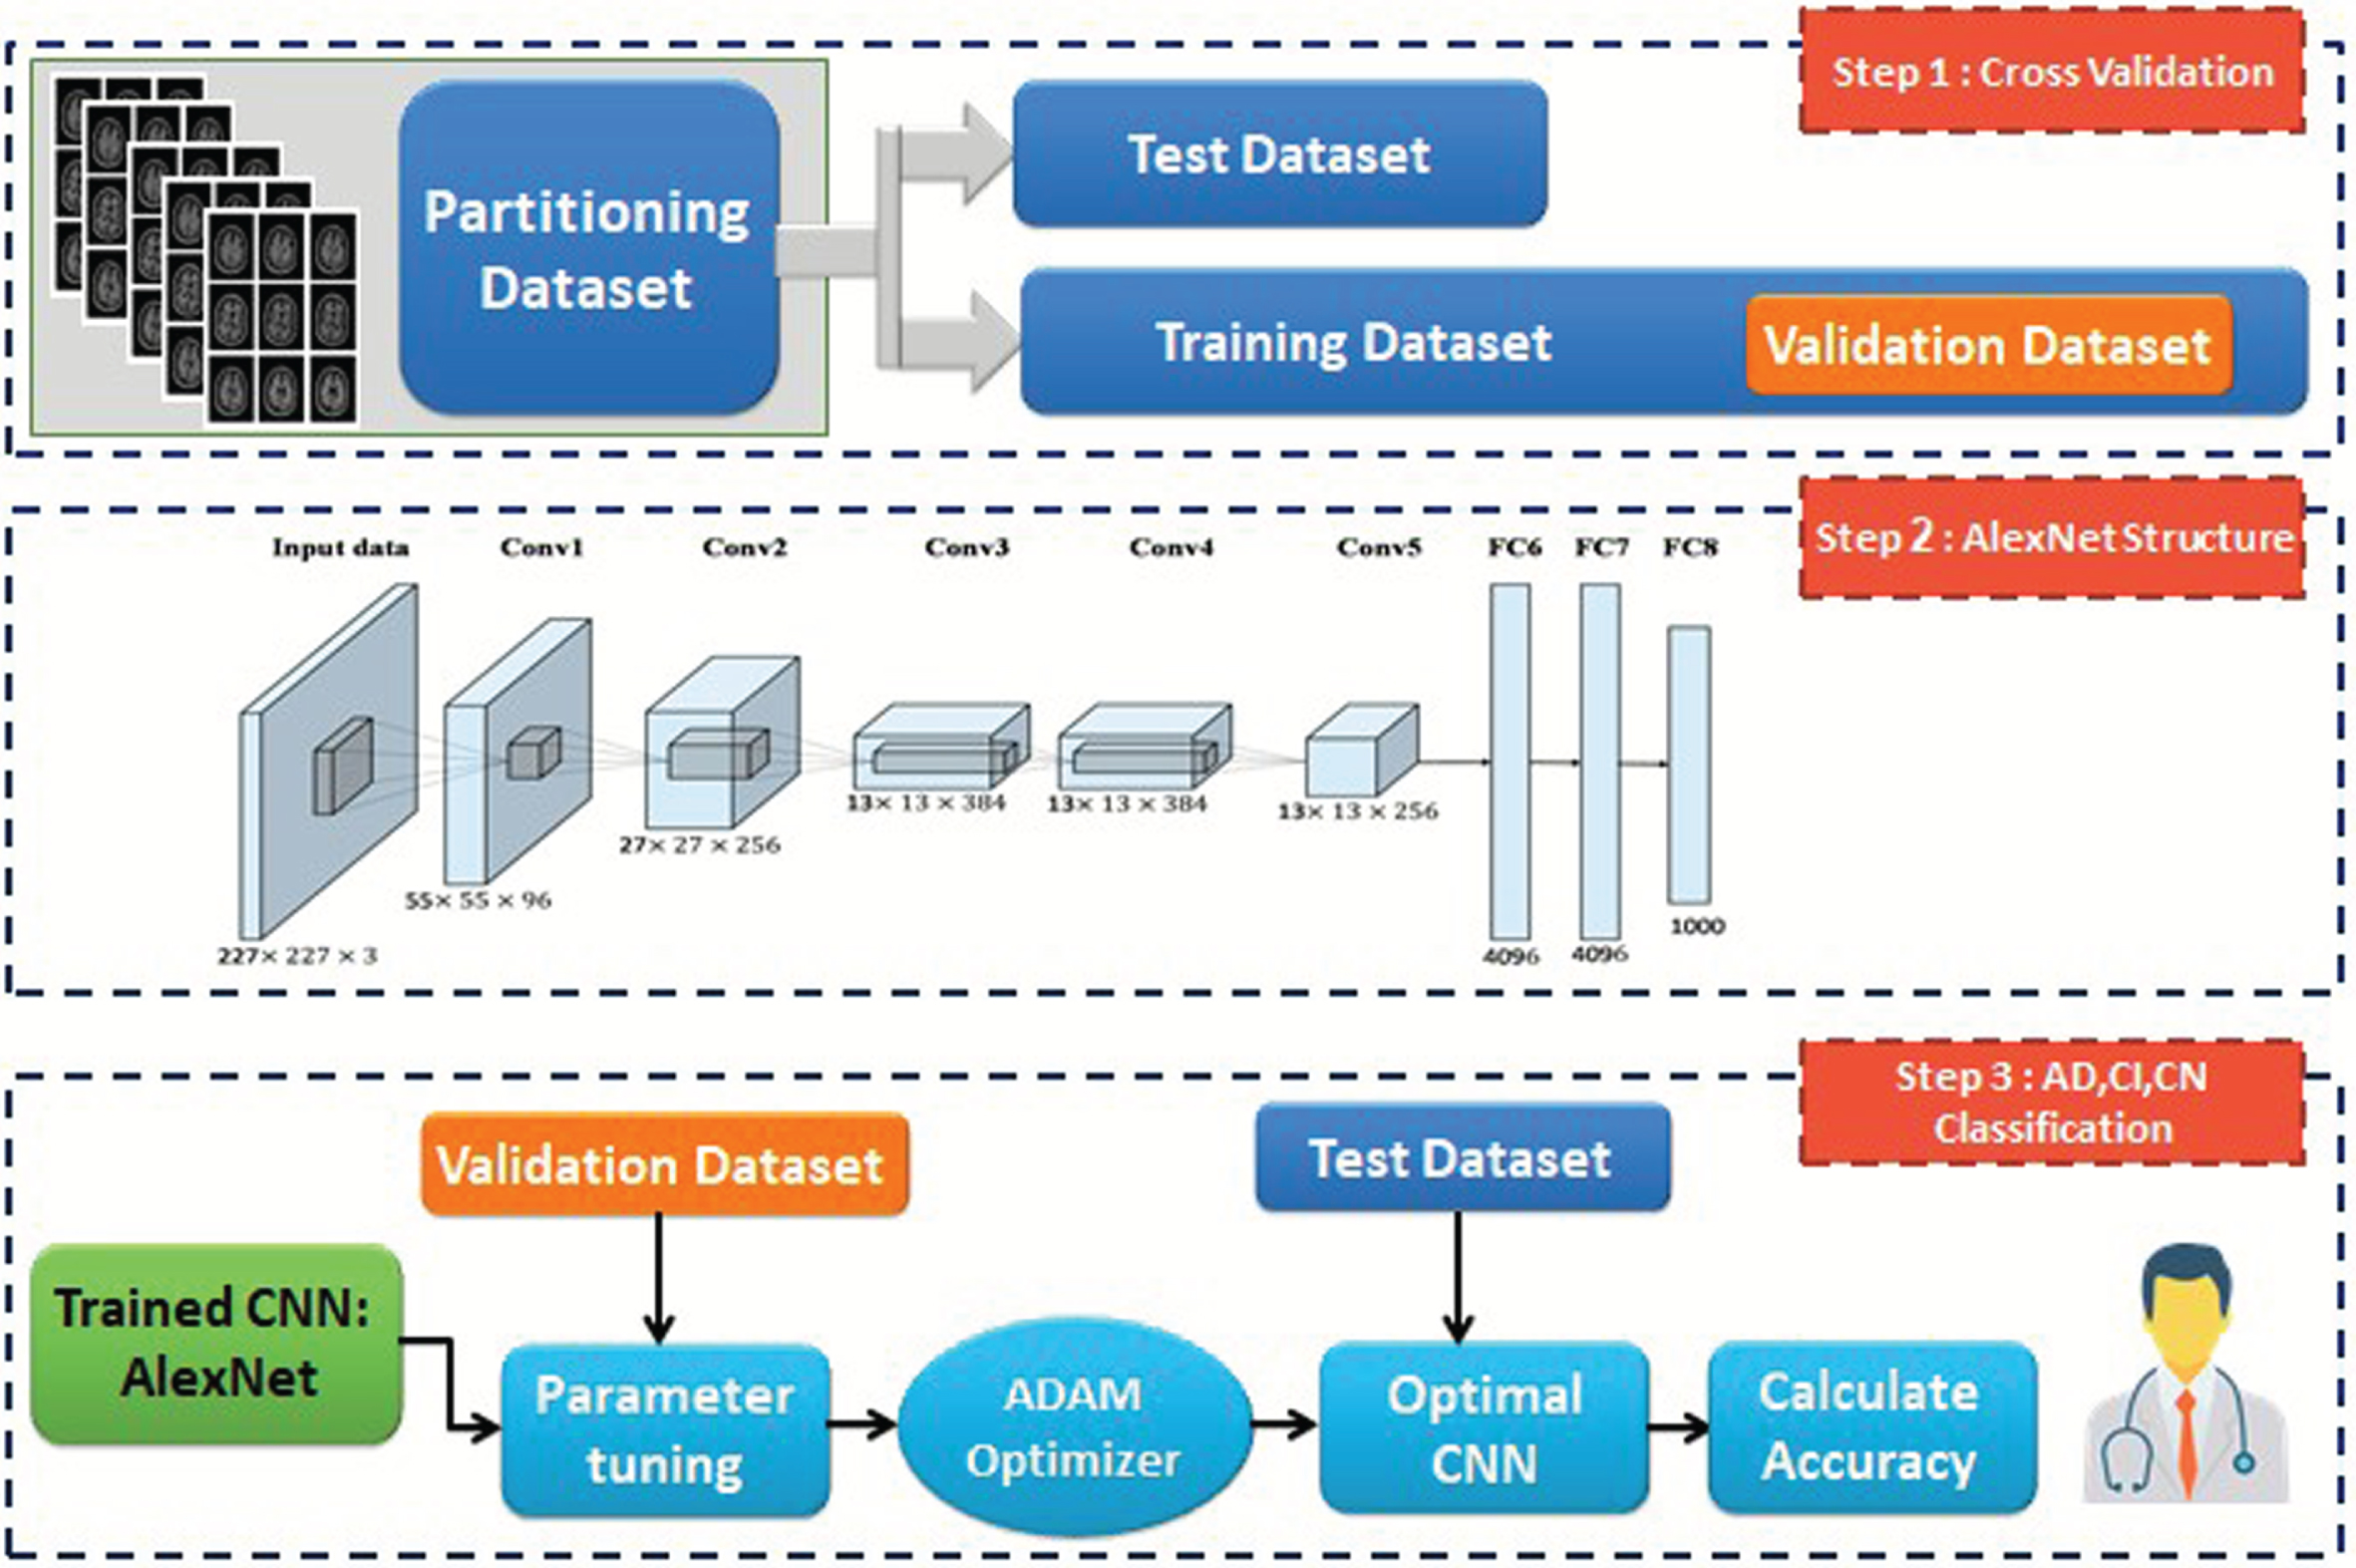
In this model, Adam’s optimizer algorithm is used. This algorithm is generally a good optimizer in many fields, including image classification.
DenseNet-BC neural network model
DenseNet convolutional neural network has different types. In this research, its improved model, namely DenseNet-BC, is used. This kind of architecture has excellent performance with fewer parameters to train. The proposed architecture for diagnosing Alzheimer’s disease and mild cognitive impairment from healthy individuals using the DenseNet-BC neural network model is shown in Fig. 3.
Fig. 3
Proposed model for diagnosing Alzheimer’s disease and mild cognitive impairment from healthy individuals using the DenseNet-BC model.
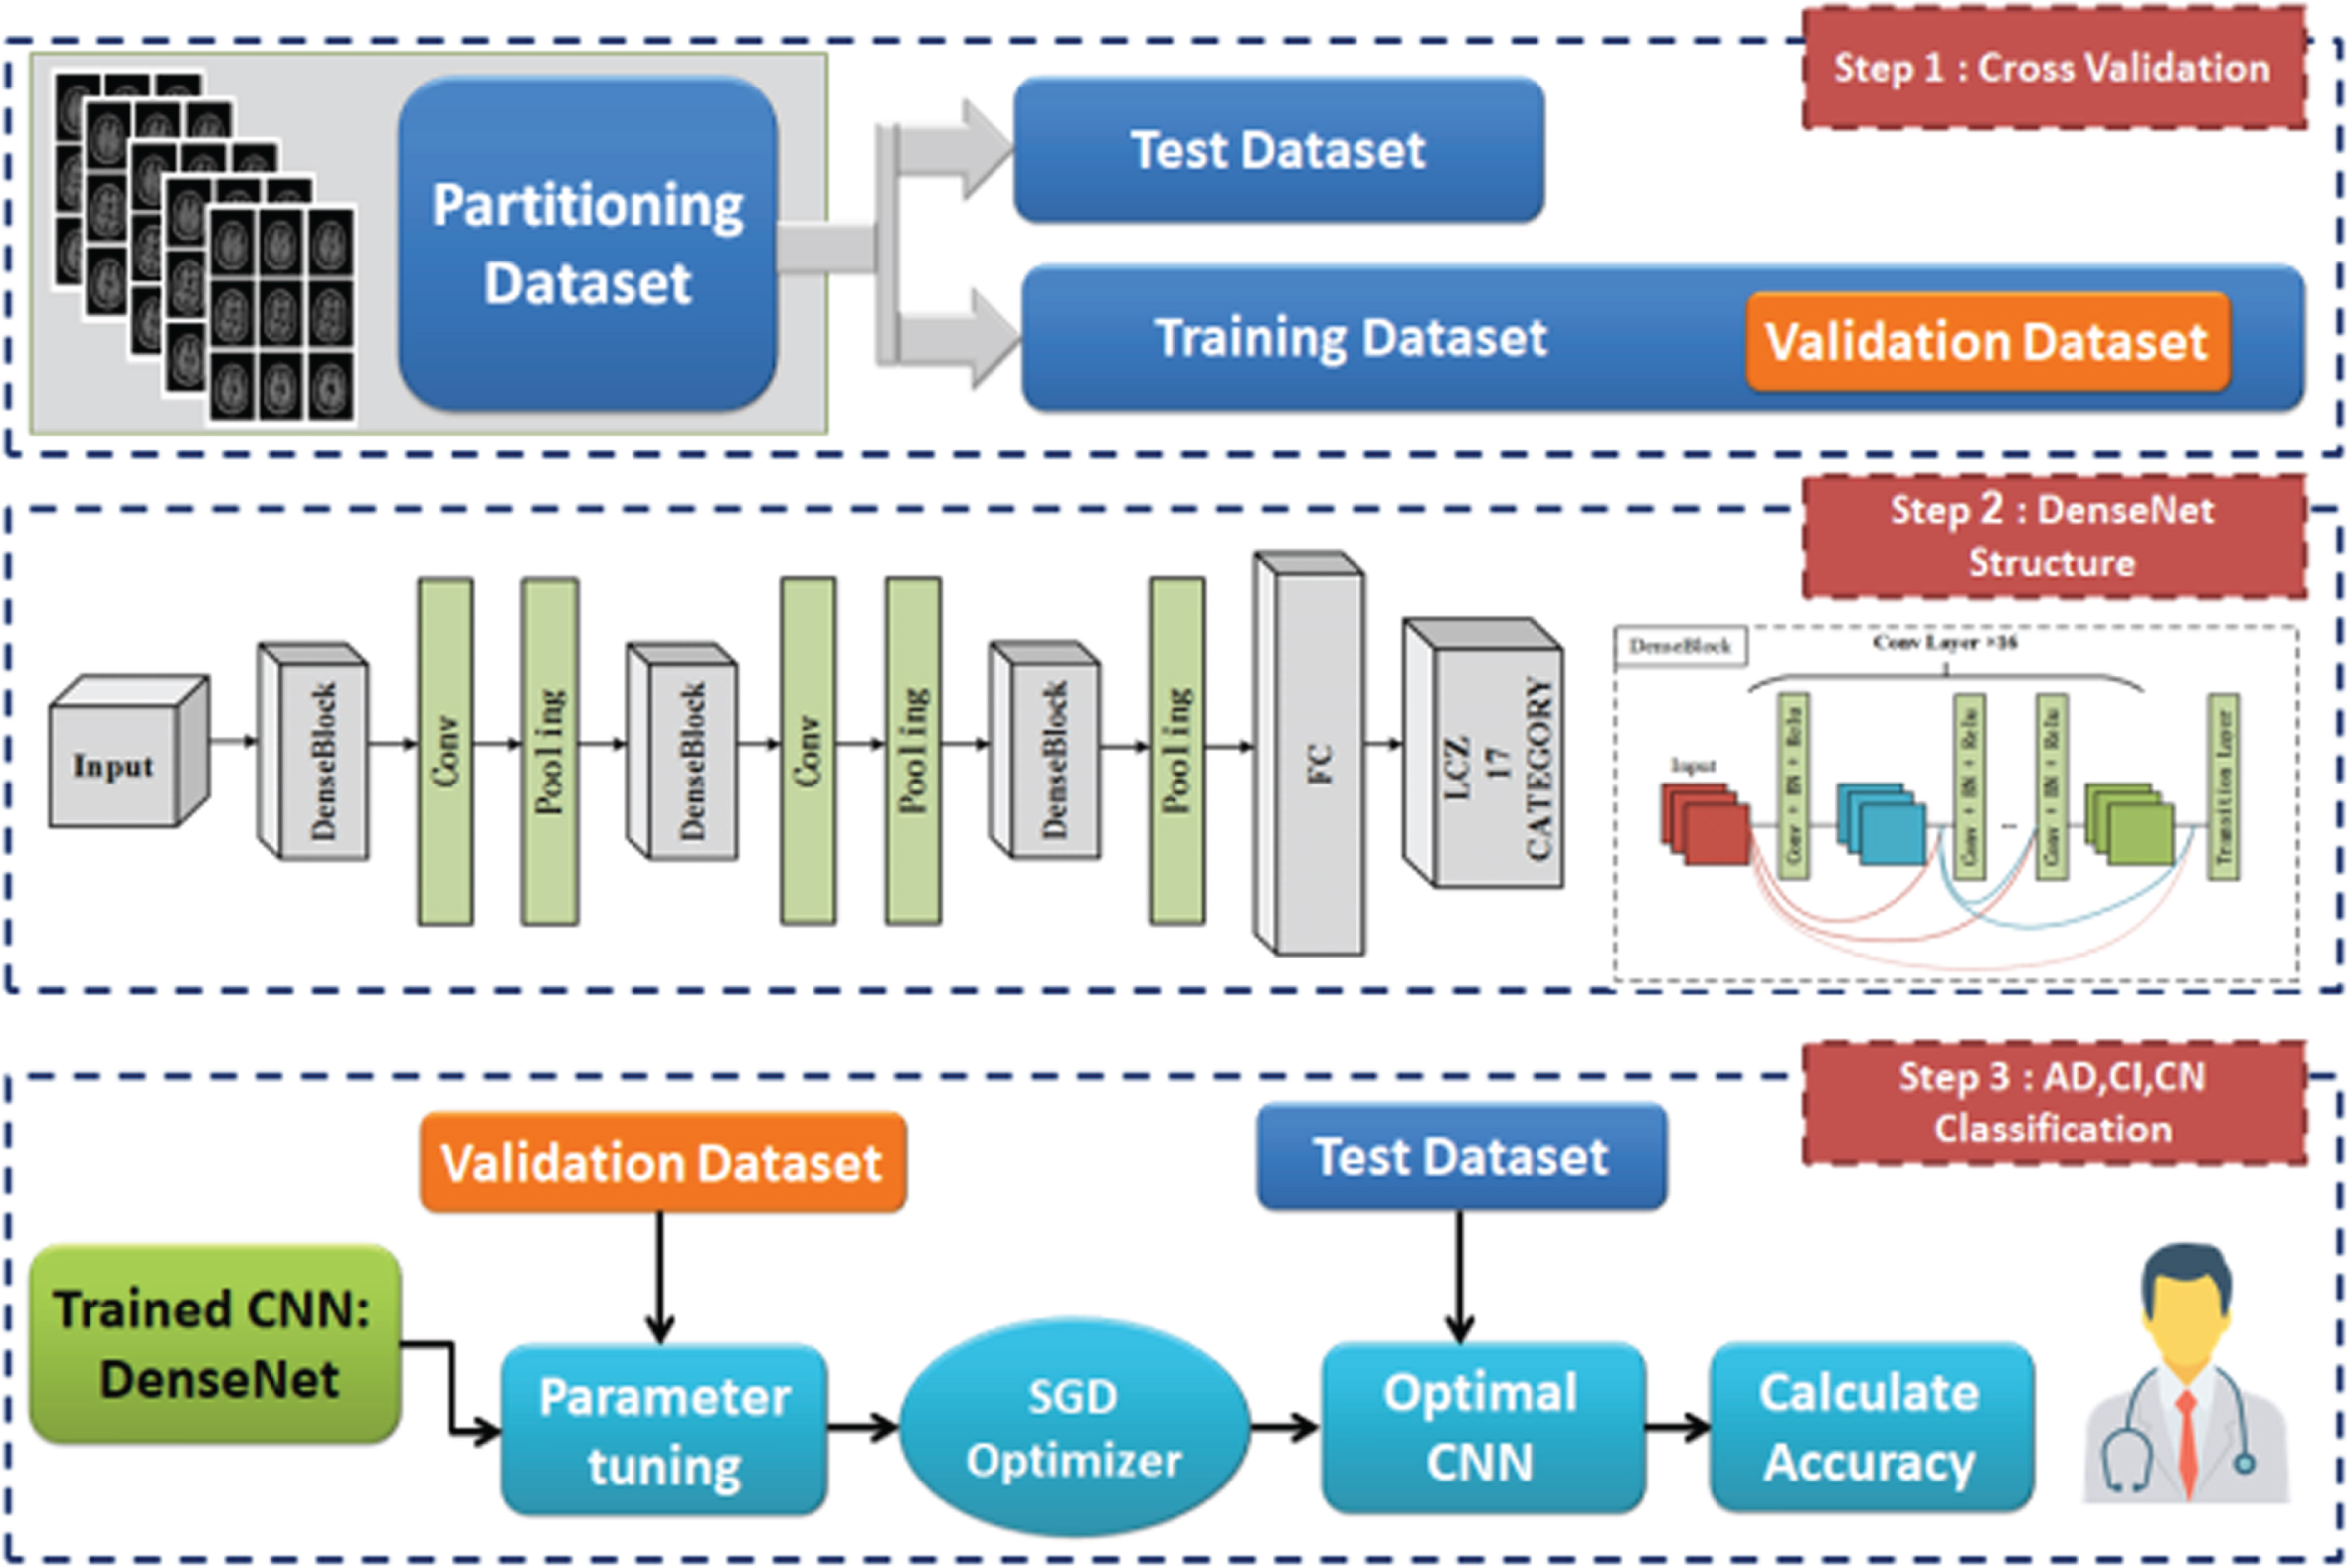
In this research, the stochastic gradient descent optimizer is used. Usually, this optimizer is proposed for DenseNet-BC convolutional neural networks.
DenseNet-BC neural network model
In previous studies for diagnosing Alzheimer’s disease or mild cognitive impairment using convolutional neural networks [12, 15–17], personal information such as age, gender, marital status, etc., has not been used and the main focus has been given to feature extraction from brain images. However, in this research, in addition to numerical features extracted from the dispersion direction and density of the microstructures in the cerebral cortex of the patients and the percentage of the relative area of the gray matter in the brain images, individual features such as gender, race, ethnicity, marital status, scores on the MMSE, scores on the ASCS, and scores on the RAVLT are also used.
Some of these data are not available directly and calculations and processing should be done, but some of them are directly available without any pre-processing. In the following sections, the method of obtaining each of these features or their pre-processing is described separately.
Acquisition and pre-processing of inputs of CNN1D-LSTM model
In the following, the method of acquisition and pre-processing of the inputs of the CNN1D-LSTM model is described.
Segmentation of brain tissues into white and gray matter is a common method for examining brain disorders [18]. Gray matter has a large number of neurons that allow information processing and propagation of new information through axonal signaling in white matter. Neurons also die naturally with increasing age. There are various methods to implement this segmentation in the field of medical images. In the field of Alzheimer’s disease and mild cognitive impairment, the gray area is very important [19]. One of the new machine learning methods for image segmentation into white matter and gray matter is the k-means clustering algorithm [20, 21]. The k-means machine learning algorithm is used for image segmentation to extract gray matter regions of the brain from white matter regions, instead of using classical image segmentation methods such as masking, etc. An example of the main images of the data set and the gray matter area extracted from it using the k-means clustering method is shown in Fig. 4.
Fig. 4
Extraction of gray and white matter areas using image segmentation.
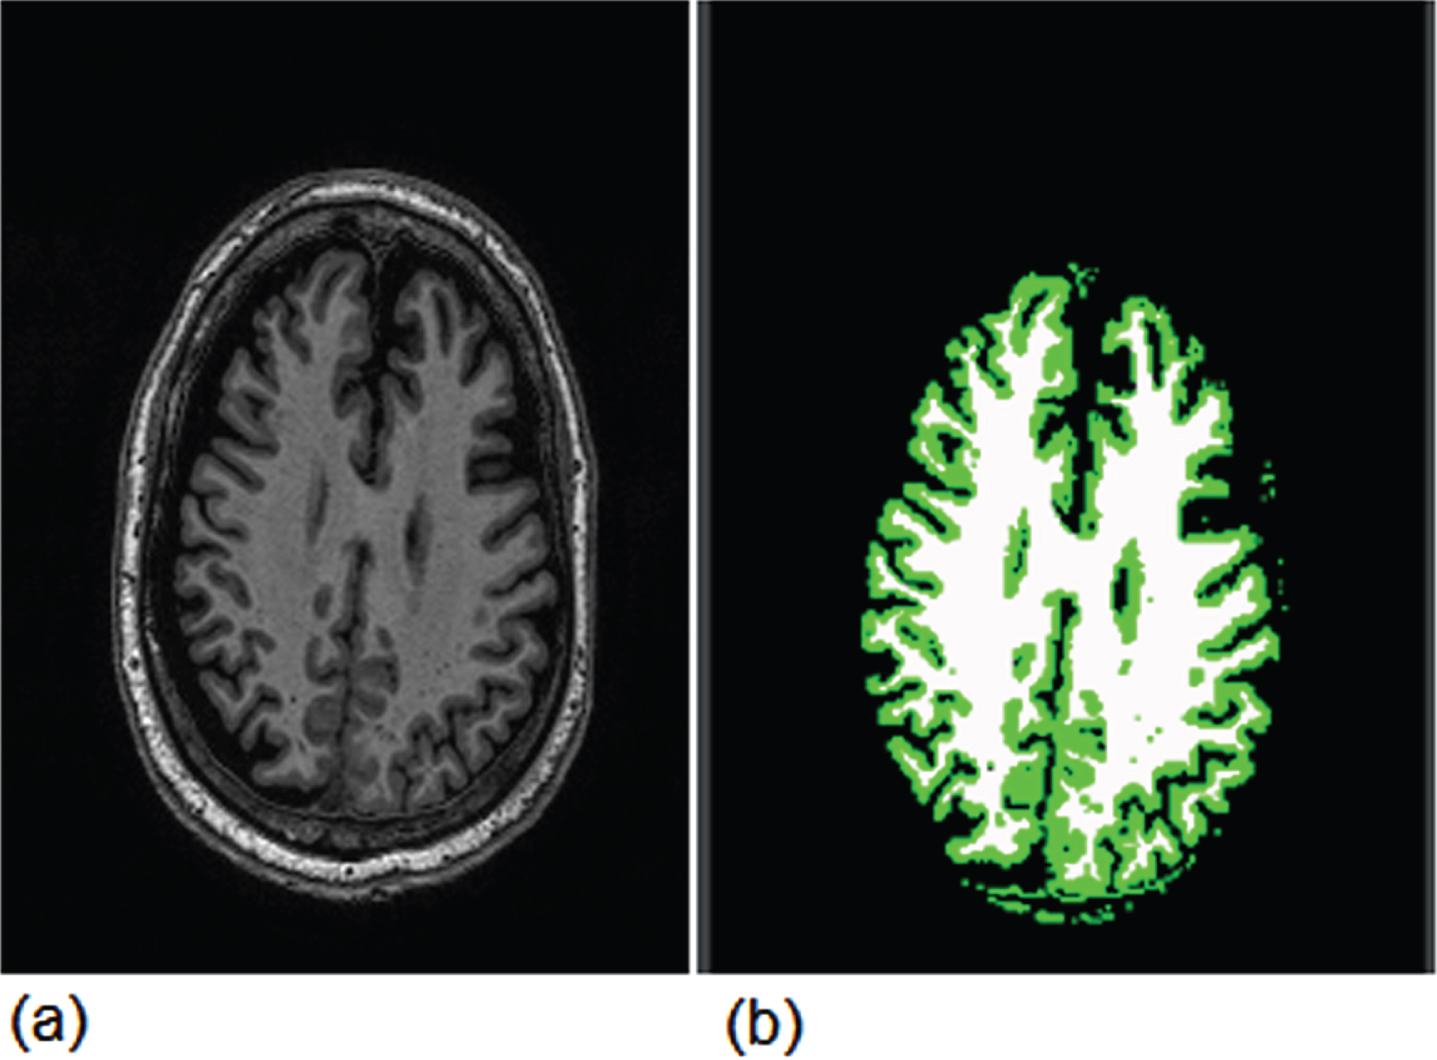
Gray and white matter are indicated by green and white colors in Fig. 4, respectively. Then, the total number of pixels with green color is considered as the area of the gray matter area in the brain images. We consider the ratio of green area to the total area of the brain as the ninth input of the CNN1D-LSTM model.
The Neuron Density Index (NDI) refers to the number of neurons present in each unit volume relative to the total volume described by covering spaces in the microstructure of the brain. In simpler terms, it is the number of neurons per unit volume relative to the total volume. This parameter is usually represented as a percentage or in the range of 0 to 1.
As the density of neurons increases, the value of neuron density approaches 1. A decrease in this parameter indicates a decrease in memory and disruption in the decision-making process in Alzheimer’s disease patients; in other words, a decrease in the neuron density parameter is a sign of Alzheimer’s disease progression.
The Orientation Dispersion Index (ODI) is used in the NODDI model to estimate the degree of directional dispersion in the extracellular space relative to the intracellular space at each point in the brain. More precisely, the DDI reflects the degree of directional dispersion in the extracellular space of the brain at each point. In [22], changes in the Orientation Dispersion Index in the brains of Alzheimer’s disease patients were investigated. The results of this study showed that the ODI in certain brain regions of Alzheimer’s disease patients had decreased. Therefore, the decrease in ODI in Alzheimer’s disease patients may indicate structural changes in white matter fibers, which are usually accompanied by a decrease in neural network activity and cognitive function [23]. Therefore, the ODI can be used as a diagnostic sign of Alzheimer’s disease, and studies in this area can help improve the diagnosis and treatment of this disease. Thus, the ODI index reflects the diffusion of water molecules in brain tissue and its value should be between 0 and 1. The values of NDI and ODI are considered the tenth and eleventh inputs of the one-dimensional convolutional neural network model, respectively.
The input of neural network models must be in numerical format. However, the characteristics of gender, race, ethnicity, and marital status are stored as strings in the dataset. In order to make these strings understandable for the neural network model, they must be converted to numbers. In Table 3, a separate number is assigned to each of the values of these characteristics and is replaced by string values in the dataset.
Table 3
Conversion of string values of the data set into numerical values
| Characteristics | Numerical values |
| Gender | Male: 0, Female: 1 |
| Race | Black: 0, White: 1, Asian: 2, Other: 3 |
| Ethnicity | American-Hispanic: 0, non- American - |
| Hispanic: 1 | |
| Marital Status | Single: 0, Married: 1 |
Since the scores on the Mini-Mental State Examination, Mini-Cog test, and Rey Auditory Verbal Learning Test are already in numerical format, there is no need for data pre-processing, and these numbers can be directly used in the neural network model [24].
After pre-processing the data, all of them should be standardized, and finally, standardized features are given as input to the convolutional neural network model. Figure 5 shows the structure of the proposed model for distinguishing Alzheimer’s disease, mild cognitive impairment, and healthy individuals from each other using a one-dimensional convolutional neural network.
Fig. 5
Proposed model for diagnosing Alzheimer’s disease and mild cognitive impairment from healthy individuals using one-dimensional convolutional neural network.
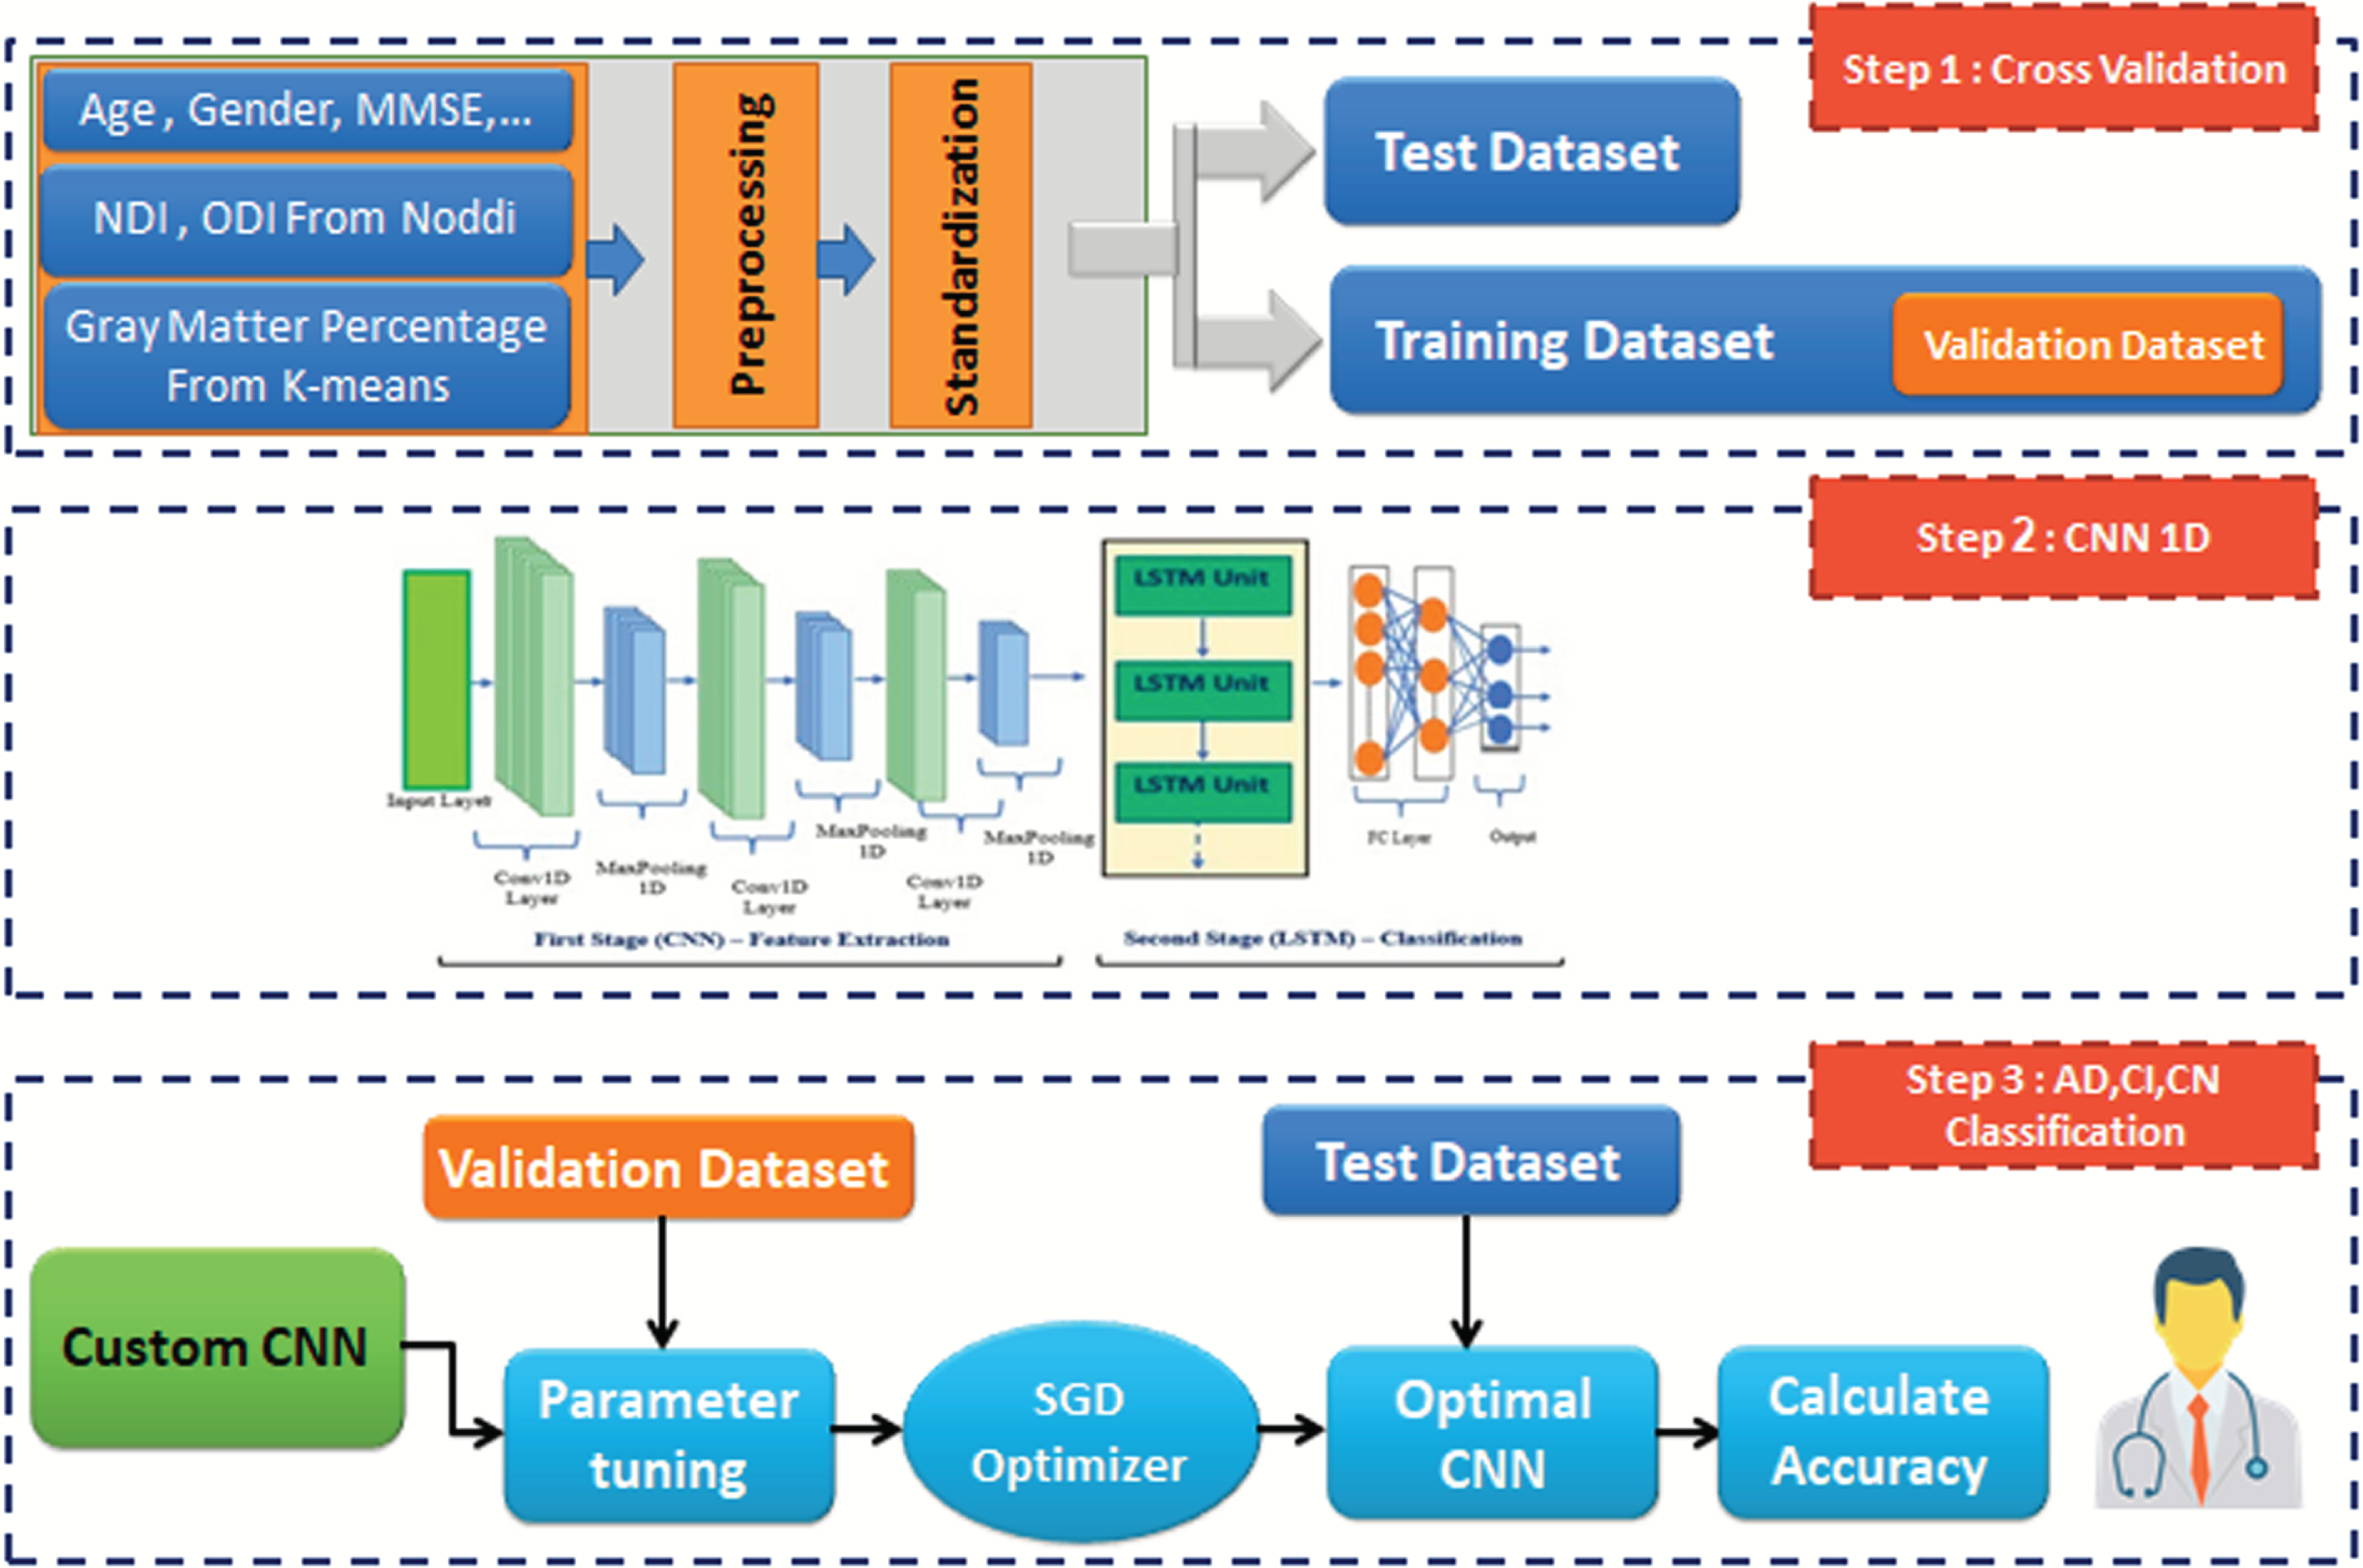
The input of the model is a one-dimensional layer with a size of 11. This model consists of a convolutional layer with 16 filters and a kernel size of 1, followed by a max-pooling layer of size 3. Two fully connected layers with 125 and 3 neurons are also employed. The generated feature vector is then passed through three consecutive LSTM layers. Finally, the feature vector is fed into multiple fully connected layers, with the output layer being the last layer.
Performance metrics
After training the models using the training dataset, each model was run on the test data and the performance of the networks was evaluated using a confusion matrix. To construct the confusion matrix, the actual and predicted labels for each data point in the desired classification must first be determined. Then, using these labels, the confusion matrix is constructed, where columns represent the predictions and rows represent the actual labels. Each cell in this matrix shows the number of data points that have been classified correctly or incorrectly. Using this matrix, performance metrics such as accuracy, precision, recall, and F1-score can be calculated:
• Accuracy metric:
(1)
• Precision metric:
(2)
• Recall metric:
(3)
• Specificity metric:
(4)
• F1-score metric:
(5)
RESULTS
Training results
The performance of the AlexNet model was evaluated in 10 different training epochs. The accuracy of the AlexNet model on the training and validation datasets is shown in Fig. 6.
Fig. 6
Accuracy plot of the AlexNet model on the training and validation datasets.
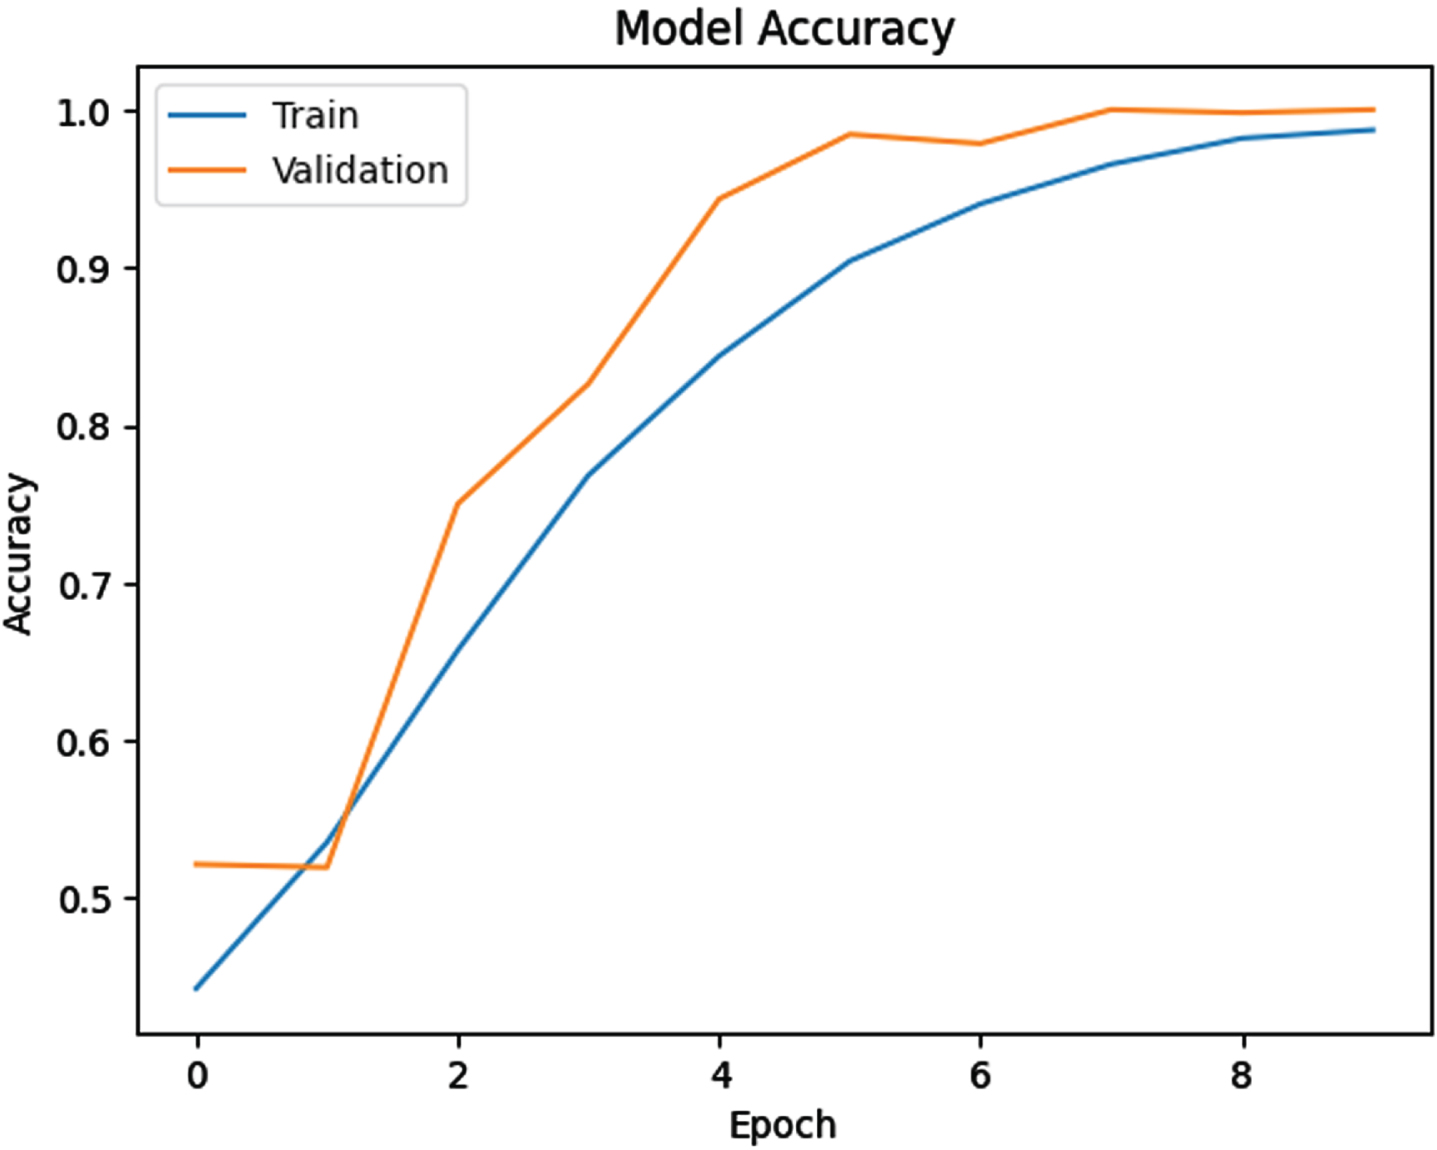
The blue and orange lines in Fig. 6 show the accuracy of the AlexNet model on the training and validation datasets, respectively. As shown in Fig. 6, at the beginning of the training, the model’s accuracy on the training dataset was at its lowest, but as the training progressed, the model’s accuracy improved.
The large gap between the blue and orange lines at the beginning of the training indicates the overfitting of the model to the training dataset. As the training progresses, the gap between the two lines decreases and the two lines come close together due to achieving a balanced state during the training process. As shown by the orange line, the accuracy of the AlexNet model on the validation data was at its lowest at the beginning of the training, but as the training progressed, the accuracy of the model on the validation dataset improved.
In the DenseNet-BC model, the total number of parameters is 24,492, out of which 23,940 are trainable parameters and 552 are non-trainable parameters. The total number of parameters in the DenseNet-BC model is much lower than that of the AlexNet neural network model. Therefore, it can be concluded that the AlexNet model has been able to find many more patterns in the images compared to the DenseNet model. The accuracy of the DenseNet-BC model on the training and validation datasets is shown in Fig. 7.
Fig. 7
Accuracy plot of the DenseNet model on the training and validation datasets.
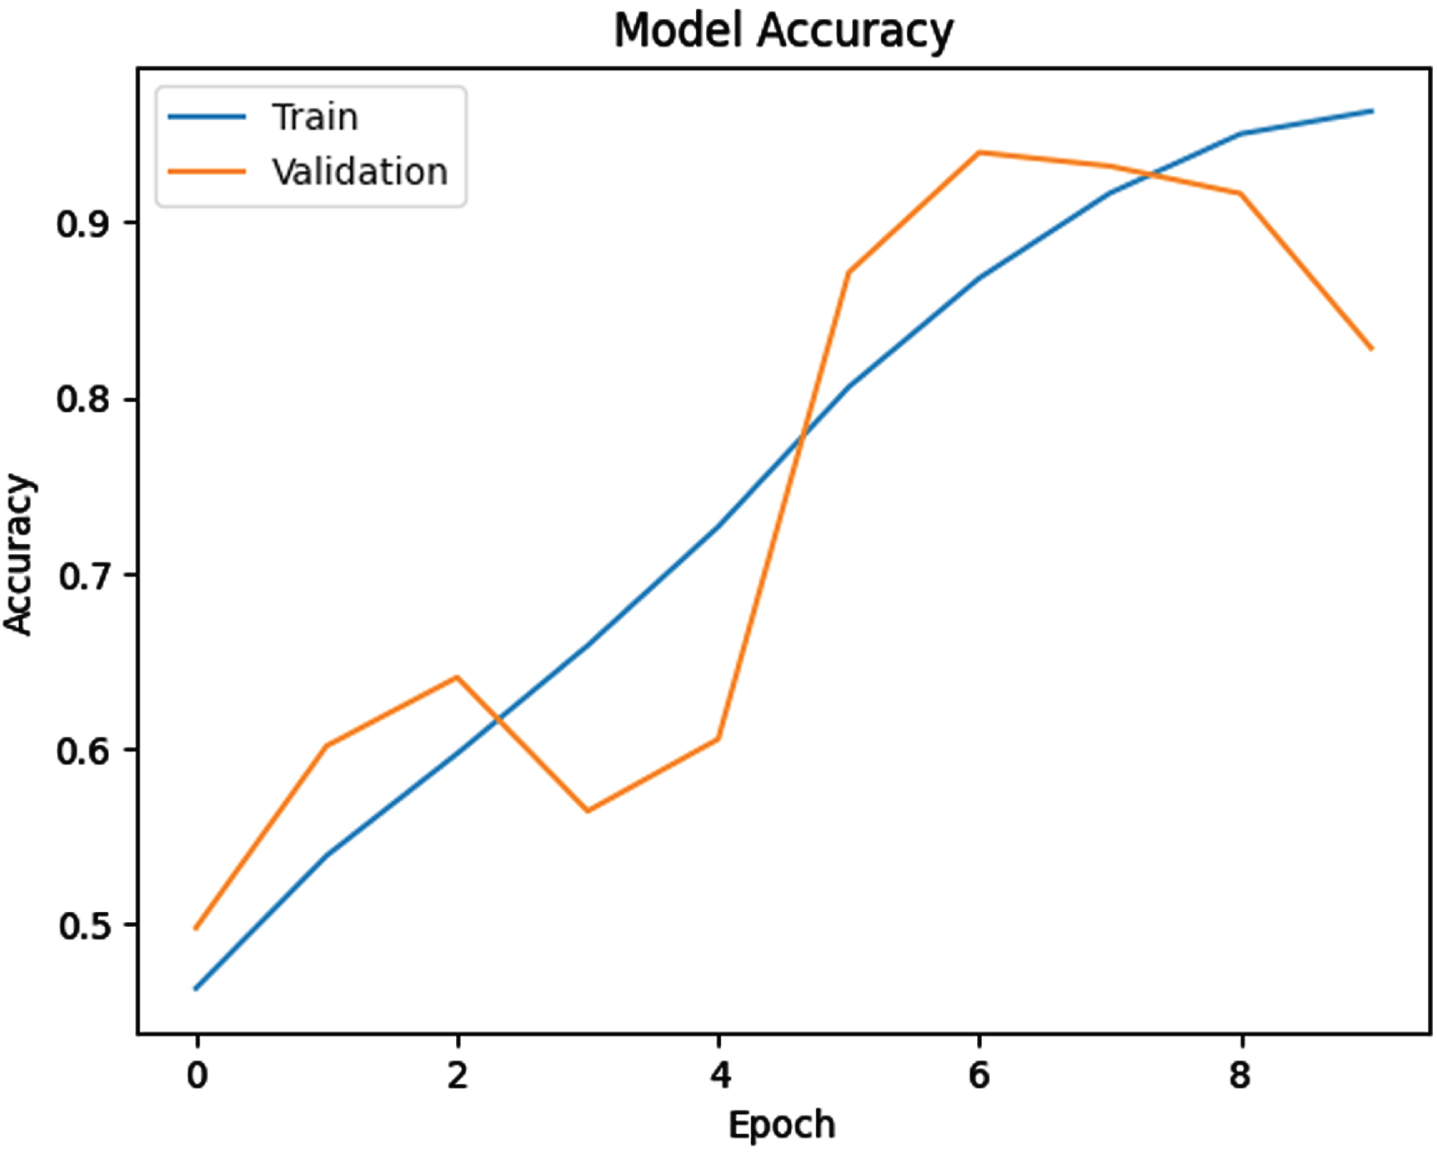
It is evident from the blue curve that with an increase in the number of training epochs, the accuracy of the DenseNet model has improved on the training dataset. This indicates that the model has adapted well to the training data and is capable of accurately recognizing the training dataset. The highest accuracy of the model on the training dataset was achieved in epoch 10.
As evident from the orange curve, the accuracy of the DenseNet-BC model on the validation dataset has improved with an increase in the number of training epochs. However, the accuracy of the model on the validation dataset reached its maximum in epoch 7 and then gradually decreased with an increase in the number of training epochs.
The accuracy of the CNN1D-LSTM model on the training and validation datasets after 30 epochs is plotted in Fig. 8.
Fig. 8
Accuracy plot of the CNN1D-LSTM model on the training and validation datasets.
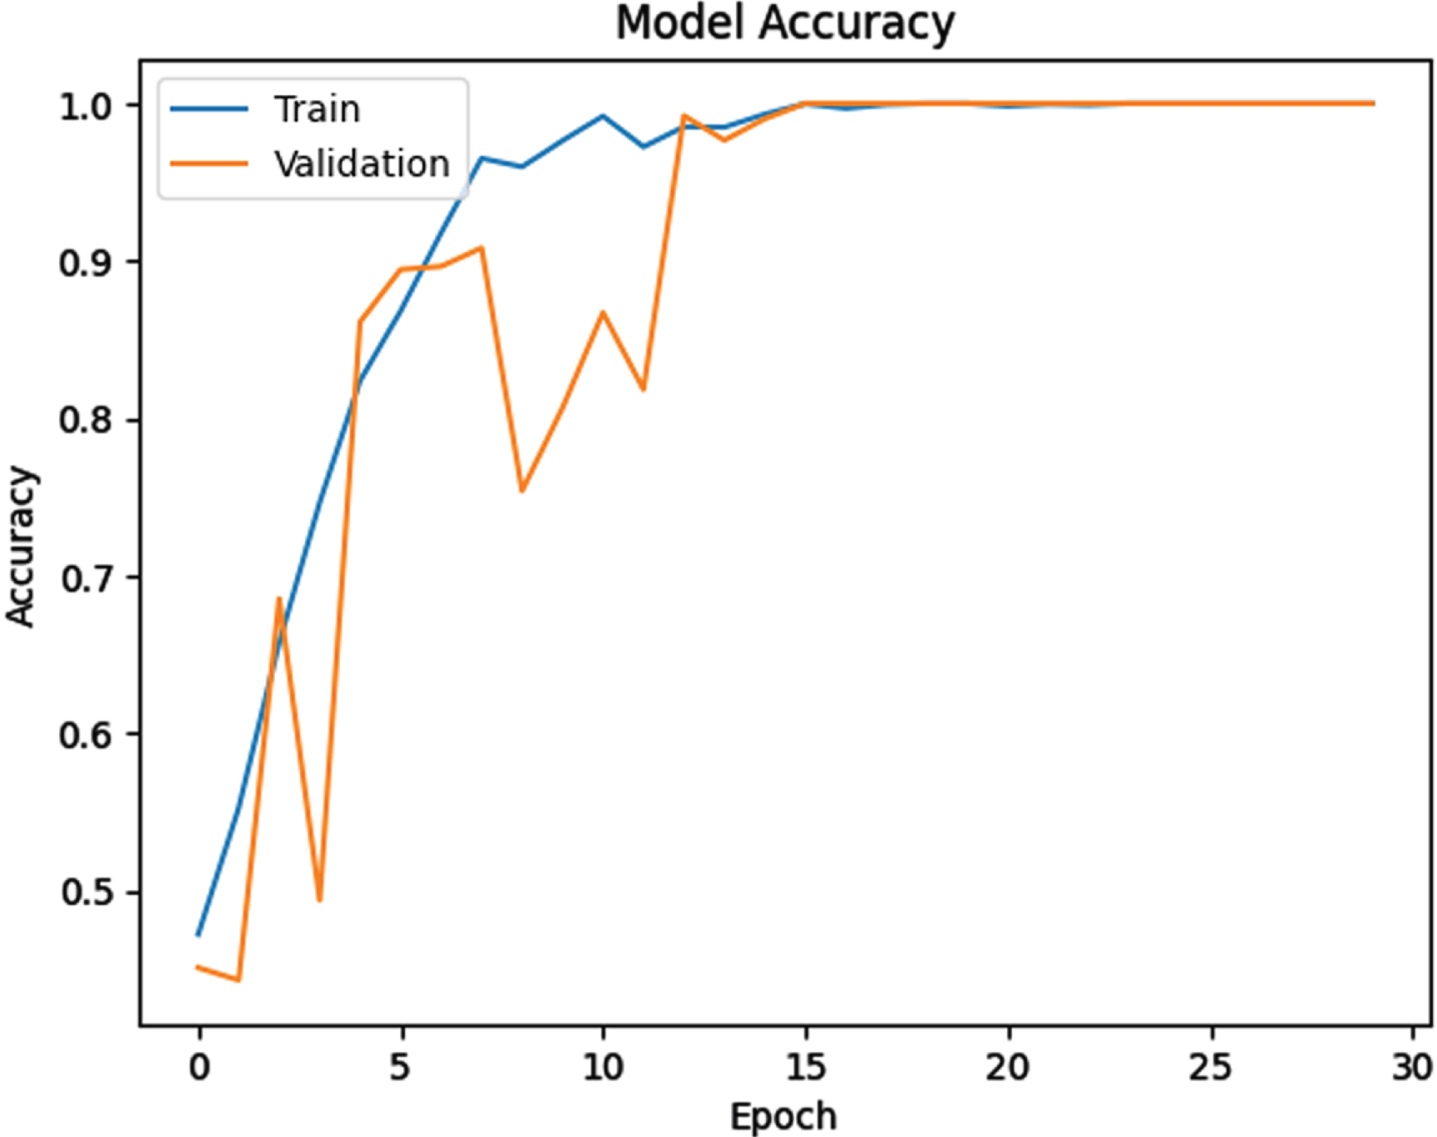
As shown in Fig. 8, the CNN1D-LSTM model has exhibited a positive trend on the training data, but experienced a sharp decline on the validation data initially. However, after the 15th epoch, it continued to ascend with high accuracy, indicating that the model was able to fit the validation data effectively. The CNN1D-LSTM model has a higher number of epochs compared to the pre-trained models, AlexNet and DenseNet. This is because AlexNet and DenseNet are pre-trained models that have learned a wide range of features beforehand, whereas the CNN1D-LSTM model is not pre-trained.
Test results
The confusion matrix of the AlexNet neural network model on the test dataset is shown in Fig. 9. The total number of test data points is 1024, out of which 286 belong to healthy individuals and 738 belong to individuals with mild cognitive impairment and Alzheimer’s disease. The AlexNet model has a high accuracy in predicting healthy individuals, as it has only misclassified one person as sick. In other words, the AlexNet model has higher sensitivity in detecting healthy individuals. However, in the case of detecting sick individuals, the model has slightly lower accuracy, as it has misclassified 12 out of 738 sick individuals as healthy. Overall, the AlexNet model has successfully distinguished healthy individuals from those with mild cognitive impairment and Alzheimer’s disease with an accuracy of 73.98%.
Fig. 9
Confusion matrix of the AlexNet model.
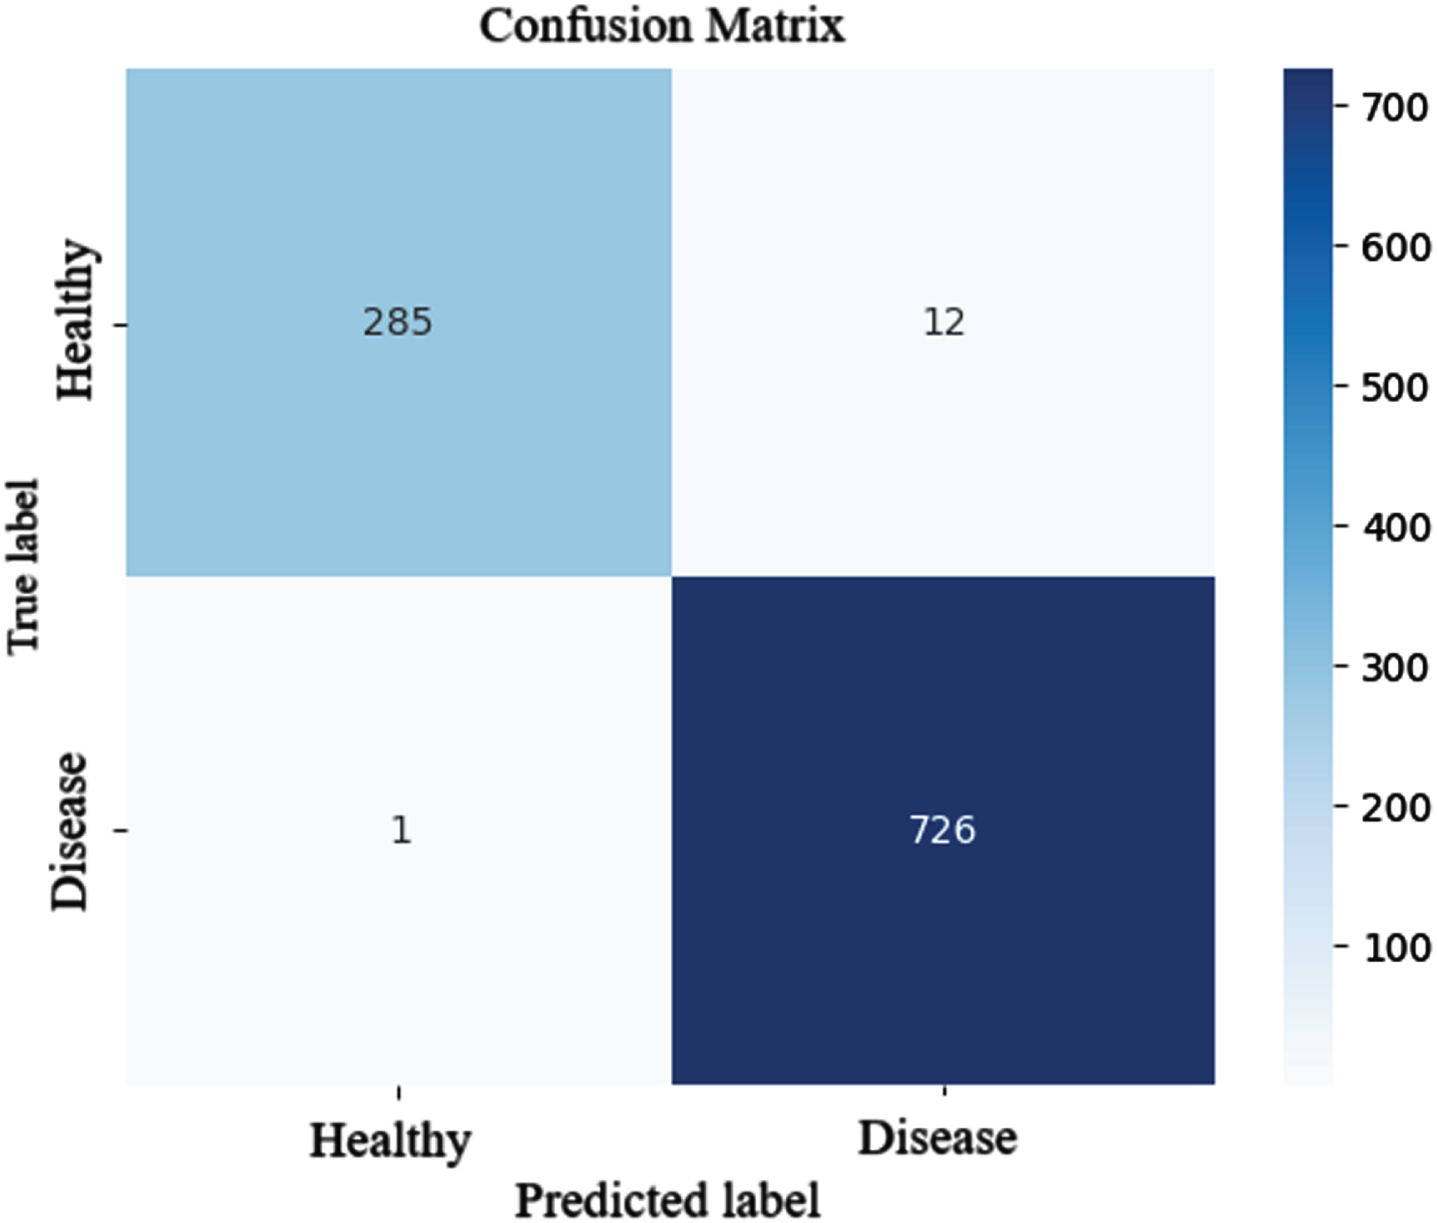
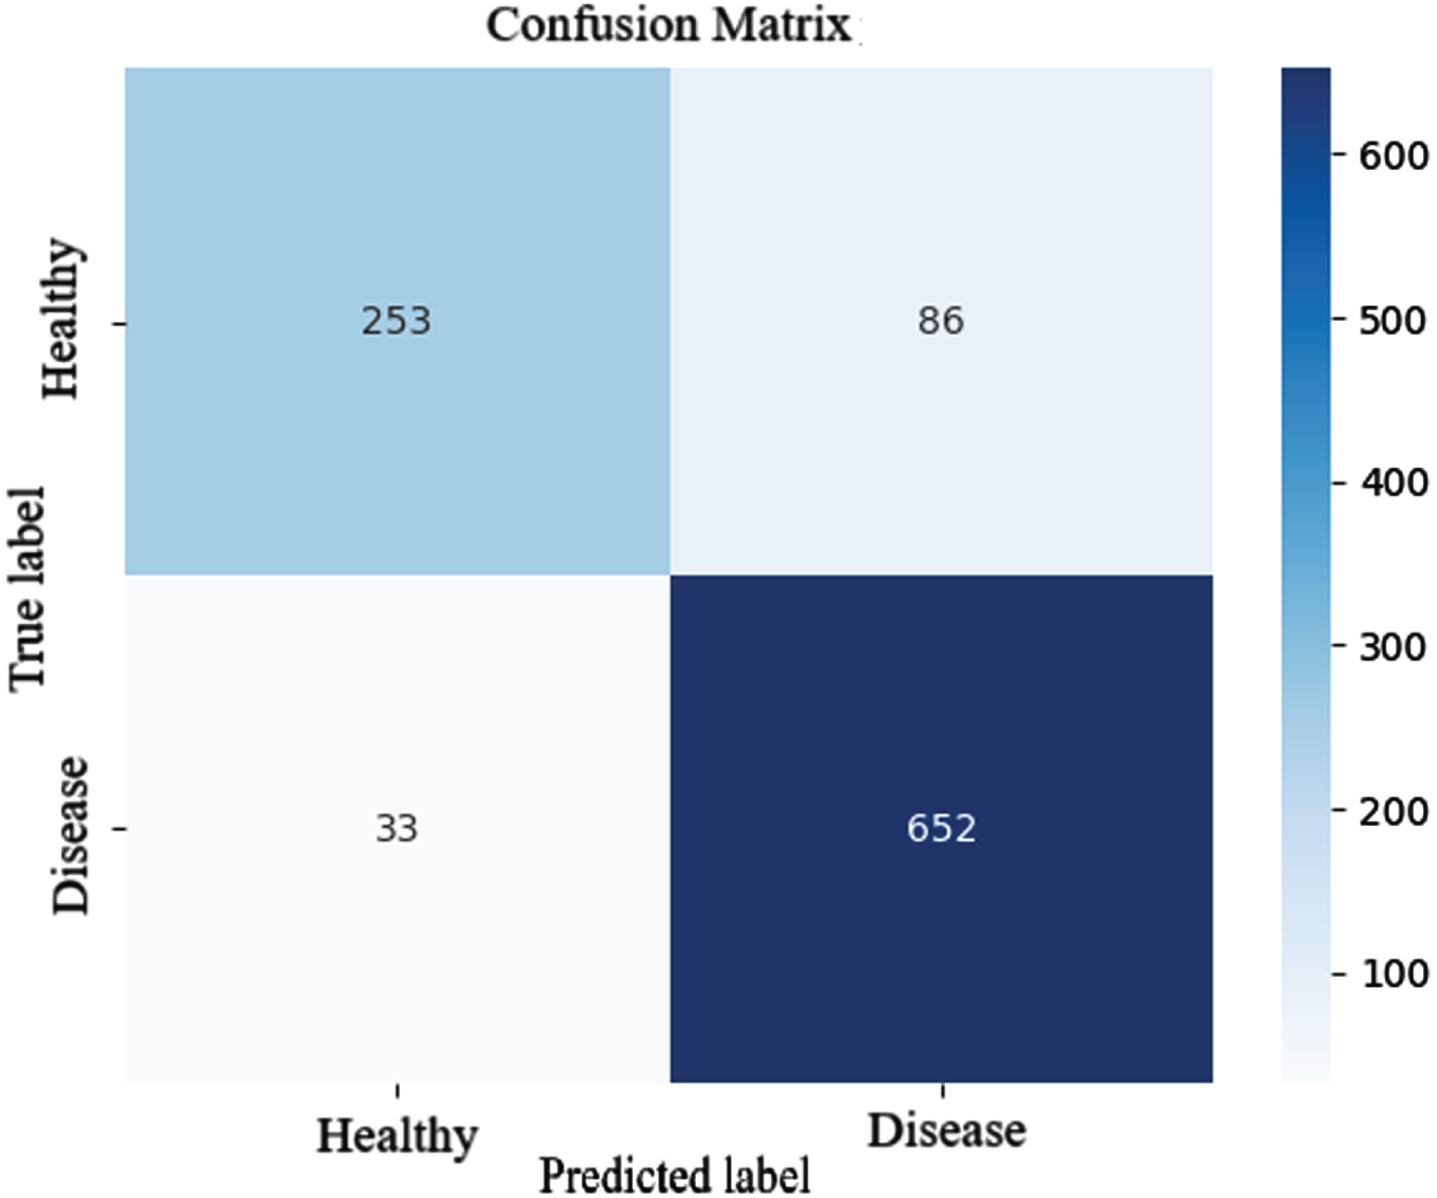
Figure 10 shows the confusion matrix of the DenseNet-BC model. As shown in Fig. 10, the DenseNet-BC neural network model had relatively good accuracy in predicting healthy individuals. Out of 286 cases of healthy individuals, the model misclassified 33 cases as patients. The DenseNet model also had lower accuracy in detecting patients compared to healthy individuals, misclassifying 86 out of 738 patient cases as healthy individuals. Overall, the DenseNet model was able to distinguish healthy individuals, individuals with mild cognitive impairment, and individuals with Alzheimer’s disease with an accuracy of 88.37%.
Fig. 10
Confusion matrix of the DenseNet-BC model.
The confusion matrix of the CNN1D-LSTM model on the test dataset is shown in Fig. 11.
Fig. 11
Confusion matrix of the CNN1D-LSTM model.
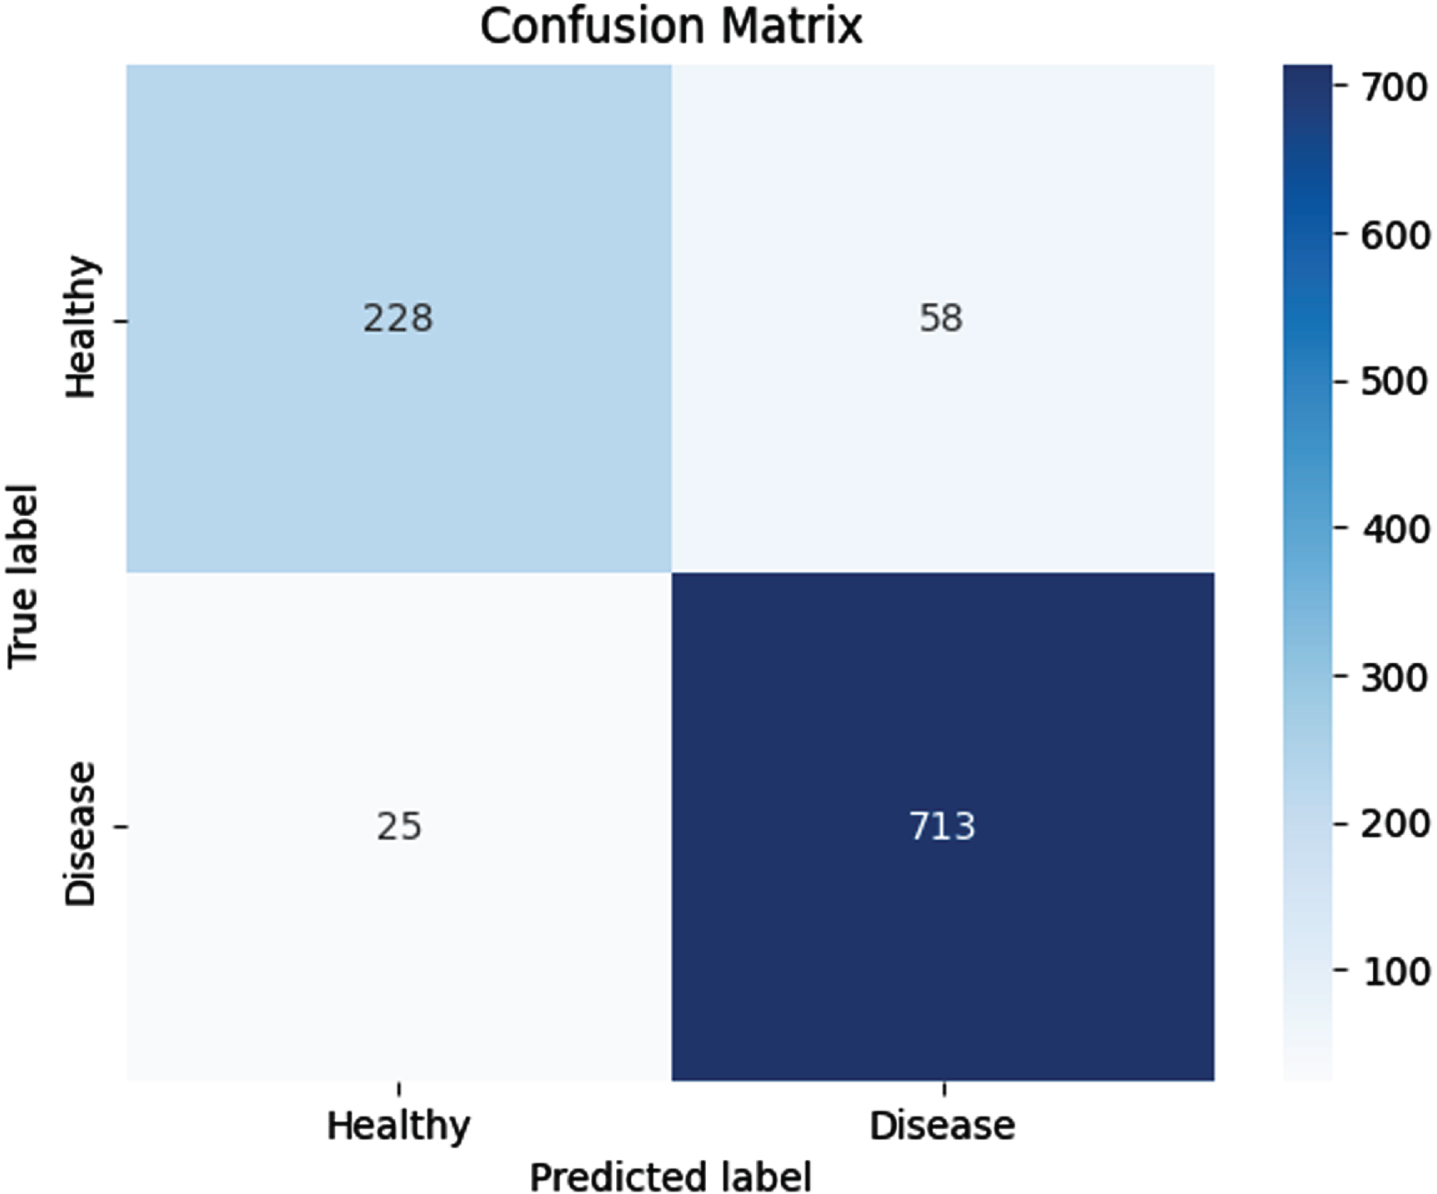
Based on the confusion matrix, although the CNN1D-LSTM model misdiagnosed 58 out of 286 healthy individuals as patient cases, the overall accuracy of the model is 91.89%. This accuracy rate is lower compared to the AlexNet neural network model but approximately 3% better than the DenseNet-BC neural network model.
DISCUSSION
In this study, several different convolutional neural network models were experimented with for the early detection of Alzheimer’s disease and mild cognitive impairment in healthy individuals. Important evaluation metrics were considered for the conducted experiments. Table 4 is a comparative analysis of various performance metrics of three different deep learning models: AlexNet, DenseNet-BC, and CNN1D-LSTM. These metrics include Accuracy, Precision, Sensitivity, Specificity, and F1-Score.
Table 4
Comparison of accuracy of AlexNet, DenseNet, and 1D Convolutional Neural Network models
| Metric | AlexNet | DenseNet-BC | CNN1D-LSTM |
| Accuracy (%) | 98.73 | 88.37 | 91.89 |
| Precision (%) | 99.65 | 88.46 | 79.72 |
| Sensitivity (%) | 95.95 | 74.63 | 90.11 |
| Specificity (%) | 99.86 | 95.18 | 92.47 |
| F1-Score (%) | 97.76 | 74.63 | 84.60 |
AlexNet achieves the highest accuracy of 98.73%, indicating its strong performance in correctly classifying the test data. AlexNet also has the highest precision of 99.65%, indicating its ability to accurately predict positive instances. The F1-Score, which balances precision and sensitivity, is highest for AlexNet at 97.76%, indicating its overall strong performance across both metrics.
Based on Table 5, it is recommended to use AlexNet for tasks requiring high accuracy and reasonable sensitivity in data classification. CNN1D-LSTM also has an acceptable accuracy but lower precision, so its performance may decrease in cases where detecting positive instances is crucial. Finally, DenseNet-BC has lower accuracy and sensitivity and should be avoided for cases where higher accuracy is required.
Table 5
Comparison of machine learning models with the proposed models
| Model | Classification | Accuracy (%) |
| CNN [25] | AD, CN | 93.26 |
| CNN [26] | MCI, CN | 85.53 |
| CNN [26] | MCI, CN | 74.34 |
| VGG-16 [3] | AD, MCI, CN | 85.07 |
| ResNet-50 [3] | AD, MCI, CN | 75.25 |
| AlexNet with SGD optimizer [3] | AD, MCI, CN | 95.70 |
| AlexNet with Adam optimizer | AD, MCI, CN | 98.8 |
| DenseNet-BC | AD, MCI, CN | 88 |
| CNN1D-LSTM | AD, MCI, CN | 91.89 |
The accuracy of the proposed models was compared with other machine learning models in studies that were performed on the Alzheimer’s Disease Neuroimaging Initiative dataset. The results are presented in Table 5. The table compares different models based on classification labels and the accuracy metric. In the following table, the first three rows represent conventional convolutional neural networks. In other words, these networks, such as AlexNet or DenseNet, are not pre-trained models.
Considering that the DenseNet-BC model has more layers than other models but performs with lower accuracy, it can be inferred that increasing the number of layers in a convolutional neural network does not necessarily lead to an increase in accuracy for the network.
Limitations and conclusions
Given the structure of the proposed models, this study has several limitations. The first limitation pertains to the lack of utilization of three-dimensional datasets. By converting the three-dimensional dataset into two-dimensional, some information is lost. The second limitation of the research is the limited scope of disease diagnosis, which includes only three categories: individuals with Alzheimer’s disease, mild cognitive impairment, and healthy individuals. However, there are different levels of similar diseases such as early mild cognitive impairment and late mild cognitive impairment that exist. The third limitation relates to the CNN1D-LSTM neural network model. This model requires additional contextual information such as gender, age, etc., related to the patient. However, in some cases, this data may not be available.
The accuracy of the AlexNet neural network model, with a precision of 98%, was significantly better than the DenseNet-BC neural network model, which had an accuracy of 88%. Additionally, the CNN1D-LSTM neural network model outperformed the DenseNet-BC neural network model with an accuracy of 91.89%.
ACKNOWLEDGMENTS
We sincerely appreciate and would like to express our deepest gratitude to the Kaggle team for providing the ADNI dataset. This dataset is incredibly valuable for Alzheimer’s research and aids us in gaining a better understanding of this disease. I am thankful to Kaggle for offering this exceptional resource to the scientific community. The method of obtaining the dataset is described in the provided link: http://adni.loni.usc.edu/wp-content/uploads/how_to_apply/ADNI_Data_Use_Agreement.pdf
FUNDING
The authors have no funding to report.
CONFLICT OF INTEREST
The authors have no conflict of interest to report.
DATA AVAILABILITY
Upon reasonable request, the data described in this study are available from the corresponding author.
REFERENCES
[1] | AbdulAzeem Y , Bahgat WM , Badawy M ((2021) ) A CNN-based framework for classification of Alzheimer’s disease. Neural Comput Appl 33: , 10415–10428. |
[2] | Bruscoli M , Lovestone S ((2004) ) Is MCI really just early dementia? A systematic review of conversion studies. Int Psychogeriatr 16: , 129–140. |
[3] | Khagi B , Kwon GR , Lama R ((2019) ) Comparative analysis of Alzheimer’s disease classification by CDR level using CNN, feature selection, and machine-learning techniques. Int J Imaging Syst Technol 29: , 297–310. |
[4] | Salehi AW , Baglat P , Sharma BB , Gupta G , Upadhya A (2020) A CNN model: Earlier diagnosis and classification of Alzheimer disease using MRI. In 2020 International Conference on Smart Electronics and Communication (ICOSEC), IEEE, pp. 156-161. |
[5] | Xia Z , Yue G , Xu Y , Feng C , Yang M , Wang T , Lei B (2020) A novel end-to-end hybrid network for Alzheimer’s disease detection using 3D CNN and 3D CLSTM. In 2020 IEEE 17th International Symposium on Biomedical Imaging (ISBI), IEEE, pp. 1-4. |
[6] | Yildirim M , Cinar A ((2020) ) Classification of Alzheimer’s disease MRI images with CNN based hybrid method.. Ingénierie Systèmes Inf 25: , 413–418. |
[7] | Çinar A , Yildirim M ((2020) ) Detection of tumors on brain MRIimages using the hybrid convolutional neural network architecture. Med Hypotheses 139: , 109684. |
[8] | Oktavian MW , Yudistira N , Ridok A Classification of Alzheimer’s disease using the convolutional neural network (CNN) with transfer learning and weighted loss. arXiv preprint arXiv:2207.01584. |
[9] | (2019) Mish: A self regularized non-monotonic activation function. arXiv preprint rXiv:1908.08681. |
[10] | Angkoso CV , Agustin Tjahyaningtijas HP , Purnama I , Purnomo MH ((2022) ) Multiplane convolutional neural network (Mp-CNN) for Alzheimer’s disease classification. Int J Intelligent Eng Systems 15: , 329–340. |
[11] | Takahashi EA (2019) How to identify a T1-weighted image from a T2-weighted image? Essential Radiology Review: A Question and Answer Guide, pp. 545-546. |
[12] | Fu’adah YN , Wijayanto I , Pratiwi NKC , Taliningsih FF , Rizal S , Pramudito MA ((2021) ) Automated classification of Alzheimer’s disease based on MRI image processing using convolutional neural network (CNN) with AlexNet architecture. J Phys 1844: 012020. |
[13] | Solano-Rojas B , Villalón-Fonseca R , Marín-Raventós G (2020) Alzheimer’s disease early detection using a low cost three-dimensional densenet-121 architecture. In The Impact of Digital Technologies on Public Health in Developed and Developing Countries: 18th International Conference, ICOST 2020, Hammamet, Tunisia, June 24–26, 2020, Proceedings 18 Springer, pp. 3-15. |
[14] | Naz S , Ashraf A , Zaib A ((2022) ) Transfer learning using freeze features for Alzheimer neurological disorder detection using ADNI dataset. Multimed Syst 28: , 85–94. |
[15] | Bäckström K , Nazari M , Gu IY-H , Jakola AS (2018) An efficient 3D deep convolutional network for Alzheimer’s disease diagnosis using MR images. In 2018 IEEE 15th International Symposium on Biomedical Imaging (ISBI 2018) IEEE, pp. 149-153. |
[16] | Islam J , Zhang Y ((2018) ) Brain MRI analysis for Alzheimer’s disease diagnosis using an ensemble system of deep convolutional neural networks. Brain Inform 5: , 1–14. |
[17] | Navipour E , Neamatshahi M , Barabadi Z , Neamatshahi M , Keykhosravi A ((2019) ) Epidemiology and risk factors of Alzheimer’s disease in Iran: A systematic review. Iran J Public Health 48: , 2133. |
[18] | Qiao J , Cai X , Xiao Q , Chen Z , Kulkarni P , Ferris C , Kamarthi S , Sridhar S ((2019) ) Data on MRI brain lesion segmentation using K-means and Gaussian Mixture Model-Expectation Maximization. Data Brief 27: , 104628. |
[19] | Safavian N , Batouli SAH , Oghabian MA ((2020) ) An automatic level set method for hippocampus segmentation in MR images. Comput Methods Biomech Biomed Eng Imaging Vis 8: , 400–410. |
[20] | Fawzi A , Achuthan A , Belaton B ((2021) ) Brain image segmentation in recent years: A narrative review. Brain Sci 11: , 1055. |
[21] | Greeshma K ((2019) ) Methods and Techniques for Brain Image Segmentation. Int J Eng Res Technol 8: , 437–440. |
[22] | Beheshti I , Maikusa N , Matsuda H , Demirel H , Anbarjafari G ((2017) ) Histogram-based feature extraction from individual gray matter similarity-matrix for Alzheimer’s disease classification. J Alzheimers Dis 55: , 1571–1582. |
[23] | Zhang H , Schneider T , Wheeler-Kingshott CA , Alexander DC ((2012) ) NODDI: Practical neurite orientation dispersion and density imaging of the human brain. Neuroimage 61: , 1000–1016. |
[24] | Kraguljac NV , Guerreri M , Strickland MJ , Zhang H ((2023) ) Neurite orientation dispersion and density imaging in psychiatric disorders: A systematic literature review and a technical note. Biol Psychiatry Glob Open Sci 3: , 10–21. |
[25] | Xu J , Box BA , Bagnato FR , Smith SA ((2017) ) Application and evaluation of NODDI in the cervical spinal cord of multiple sclerosis patients. Neuroimage Clin 15: , 333–342. |
[26] | Altaf T , Anwar SM , Gul N , Majeed MN , Majid M ((2018) ) Multi-class Alzheimer’s disease classification using image and clinical features. Biomed Signal Process Control 43: , 64–74. |


