
More Similar than Different: Memory, Executive Functions, Cortical Thickness, and Glucose Metabolism in Biomarker-Positive Alzheimer’s Disease and Behavioral Variant Frontotemporal Dementia
Abstract
Background:
Alzheimer’s disease (AD) and behavioral variant frontotemporal dementia (bvFTD) are typically associated with very different clinical and neuroanatomical presentations; however, there is increasing recognition of similarities.
Objective:
To examine memory and executive functions, as well as cortical thickness, and glucose metabolism in AD and bvFTD signature brain regions.
Methods:
We compared differences in a group of biomarker-defined participants with Alzheimer’s disease and a group of clinically diagnosed participants with bvFTD. These groups were also contrasted with healthy controls (HC).
Results:
As expected, memory functions were generally more impaired in AD, followed by bvFTD, and both clinical groups performed more poorly than the HC group. Executive function measures were similar in AD compared to bvFTD for motor sequencing and go/no-go, but bvFTD had more difficulty with a set shifting task. Participants with AD showed thinner cortex and lower glucose metabolism in the angular gyrus compared to bvFTD. Participants with bvFTD had thinner cortex in the insula and temporal pole relative to AD and healthy controls, but otherwise the two clinical groups were similar for other frontal and temporal signature regions.
Conclusions:
Overall, the results of this study highlight more similarities than differences between AD and bvFTD in terms of cognitive functions, cortical thickness, and glucose metabolism. Further research is needed to better understand the mechanisms mediating this overlap and how these relationships evolve longitudinally.
INTRODUCTION
At first glance it would appear simple to differentiate classic cases of Alzheimer’s disease (AD) from behavioral variant frontotemporal dementia (bvFTD). AD as it classically presents is most often characterized by impairments in consolidation of new memories, while bvFTD is a disease most often characterized by changes in personality and behavior along with cognitive deficits in executive functioning. Although there are often differences in presentation, there is also surprisingly extensive overlap between the two diseases both neuroanatomically and cognitively. This overlap is further complicated by the differing phenotypes of AD that have been identified beyond the prototypical presentation [1]. In some patients, this includes primary dysexecutive and/or behavioral symptoms in patients with AD (bvAD) that can resemble the clinical syndrome of bvFTD [2–4]. The role of the frontal lobe and executive dysfunction in the typical AD phenotype has also been an increasing area of interest as conceptualization of the disease has evolved [5, 6].
From a cognitive standpoint, there have been numerous prior studies supporting greater memory impairment in AD relative to bvFTD [7–10]. This was also supported by results of a large meta-analysis [11], although it was noted that many of the cognitive tasks examined did not adequately discriminate between the two groups given significant observed overlap. Some studies have not found evidence of differing performances on memory tasks in patients with bvFTD relative to early AD [12]. Historically, memory was expected to be relatively preserved in FTD until advanced stages of disease progression; however, severe amnesia in early presentations of FTD may be more common than initially thought [13] and may contribute to mixed findings in the existing literature. Although bvFTD is known to be a condition primarily impacting executive functions, studies comparing participants with bvFTD versus AD on executive tasks have also shown mixed results. Some studies have found evidence of the expected greater impairments in bvFTD on tasks of executive functioning [9, 14]. In contrast, other studies suggest comparable performances in AD and bvFTD on tasks of inhibitory control [15] as well as motor sequencing, phonemic fluency, and working memory [16, 17]. Furthermore, some evidence suggests that individuals with bvFTD do not demonstrate a more dysexecutive pattern of performances on memory tasks relative to AD, as assessed by similar number of intrusion errors and comparable rates of improvement with recognition cues [18].
Beyond the presenting cognitive symptoms, neuroanatomical structure and function are important markers to aid in discrimination of such disease processes. Atrophy of the mesial temporal cortex, particularly of the hippocampus and entorhinal cortices, is considered a hallmark of AD and has been correlated with memory function [19]. bvFTD has historically been associated with early atrophy in frontal and insular regions [20] as opposed to the diffuse changes in temporal and parietal cortex in AD. Existing studies investigating neuroanatomical differences between bvFTD and AD have shown variability in methodology and results. Several recent studies have found no significant difference in hippocampal atrophy when comparing individuals with AD and bvFTD [18, 21]. Cortical thickness has been suggested to be more sensitive than grey matter density or volume to subtle indicators of disease pathology [22]. For example, participants with AD showed cortical thinning in all lobes while FTD showed thinning in more specific regions of the frontal and temporal lobes [23]. Similarly, Möller and colleagues [24] found more generalized decrease in thickness throughout the entire brain in AD (although this was more pronounced posteriorly), whereas patients with bvFTD showed more selective thinning in the frontal and anterior temporal cortices. Another study compared behavioral/dysexecutive variant AD to amnestic AD as well as to bvFTD using both neuropsychological testing and cortical thickness. They found more visuospatial impairments and cortical thinning posteriorly in the left temporal-occipital regions in bvAD relative to bvFTD. In addition, patients with bvAD showed more frontotemporal atrophy than patients with amnestic AD [25].
While many existing studies have investigated neuroanatomical differences between these disease processes, others have sought to define unique cortical signature regions specific to each disease. For instance, Dickerson et al. [26] published a seminal study on the “cortical signature” of AD. Using cortical thickness, they identified the following areas that were typically affected in AD and predictive of time to diagnosis: middle temporal gyrus, inferior temporal gyrus, temporal pole, middle frontal gyrus, superior frontal gyrus, precuneus, angular and supramarginal gyri of the inferior parietal lobe, and the superior parietal lobule. These brain regions have been widely used investigating AD and are associated with the normal aging effects on memory [27] as well as predicting the progression to AD from asymptomatic or normal condition [28, 29]. A similar investigation was recently published examining the cortical signature of bvFTD which was found to span several large scale neural networks [30]. While the terminology in characterizing neuroanatomical regions differs slightly between these studies, there are areas of overlap between signature areas for AD and bvFTD as well as key, unique differences. Overlapping areas include the middle and superior frontal gyrus, temporal pole, and middle temporal gyrus. Areas unique to AD are located in the parietal lobe and include the precuneus, and inferior and superior parietal lobules, as well as the inferior temporal gyrus. Areas unique to bvFTD include the insula and anterior cingulate. It is interesting to note the high number of overlapping areas despite these two diseases being conceptualized as pathologically and phenotypically distinct. Given the recency of these published signature areas for bvFTD, there are not yet any studies comparing signature areas in a clinical sample of bvFTD versus prototypical AD.
Metabolic neuroimaging, such as 18Fluoro-deoxyglucose positron emission tomography (FDG-PET), is also beneficial in distinguishing AD from bvFTD [31]. Patients with AD often show early hypometabolism in the posterior cingulate and parietotemporal cortices while patients with bvFTD often show early hypometabolism in the frontal and anterior temporal cortices [32]. However, there is some variability in findings across studies that may be due in part to differing clinical phenotypes within AD and bvFTD, differing methodologies, and the potential for mixed pathology. For instance, one study compared patients with FTD who presented as amnestic versus non-amnestic and found evidence of differing patterns of hypometabolism on FDG PET within the parahippocampal and inferior temporal gyri [33].
Given increasingly recognized overlap between AD and bvFTD, mixed results and sample size limitations in prior studies, and newly published cortical signature areas for these diseases, additional research is needed to better understand cognitive and neuroimaging correlates and how they relate. The mixed results in prior literature and hypothesized overlap in signature regions suggest that these two distinct pathological processes may be more similar than historically conceptualized. Furthermore, prior studies have primarily included only participants with diagnosed dementia without those with very early disease at the mild cognitive impairment stage. It is important to examine these disease processes at early stages given increasing clinical similarities between neurodegenerative processes at more advanced stages. The current study is the first we are aware of to examine cognition (memory and executive functioning), and structural and functional neuroimaging (cortical thickness and FDG PET) in signature brain regions for both diseases in patients with biomarker-defined AD versus bvFTD. The following signature areas were included [26, 30]: inferior temporal, middle temporal, temporal pole, middle frontal, superior frontal, anterior cingulate, insula, precuneus, angular and supramarginal gyrus (inferior parietal lobule), and superior parietal.
Hypotheses
For memory function, it was hypothesized that performances would differ by group, with AD < bvFTD < HC on all measures. For executive measures, it was hypothesized that performances would differ by group, with bvFTD < AD < HC. For cortical thickness, group differences in thickness were also hypothesized, with AD < bvFTD < HC for temporal lobe regions, bvFTD < AD < HC for frontal lobe regions, and AD < bvFTD=HC for parietal lobe regions. Group differences in glucose hypometabolism using FDG PET mimic the cortical thickness hypotheses for temporal and parietal lobe regions (AD < bvFTD) and for the frontal lobe regions (bvFTD < AD).
MATERIALS AND METHODS
Participants
We retrospectively identified 81 individuals who were evaluated in our academic medical center-based memory health clinic (from June 2020 through August 2023) who were biomarker-positive for AD (see Fig. 1). Each participant was diagnosed by consensus as MCI due to AD (n = 49) or AD dementia (n = 32) using history, neurological examination, brain MRI, and neuropsychological evaluation [1, 34]. All participants with MCI were classified as having amnestic profiles, although some were single domain (aMCI-SD = 24) and others multidomain (aMCI-MD = 25). All participants with AD had biomarker status determined by CSF analysis (n = 58) of Aβ42 and p-tau or Amyloid PET using 18F-florabetaben (n = 28). Five participants were amyloid positive by both tests. All participants with AD demonstrated evidence of temporal and/or parietal atrophy on MRI. All participants were also cognitively symptomatic with evidence of cognitive impairment(s) on neuropsychological evaluation. None of the participants with AD presented with the behavioral/executive variant of AD.
Fig. 1
Group classification.
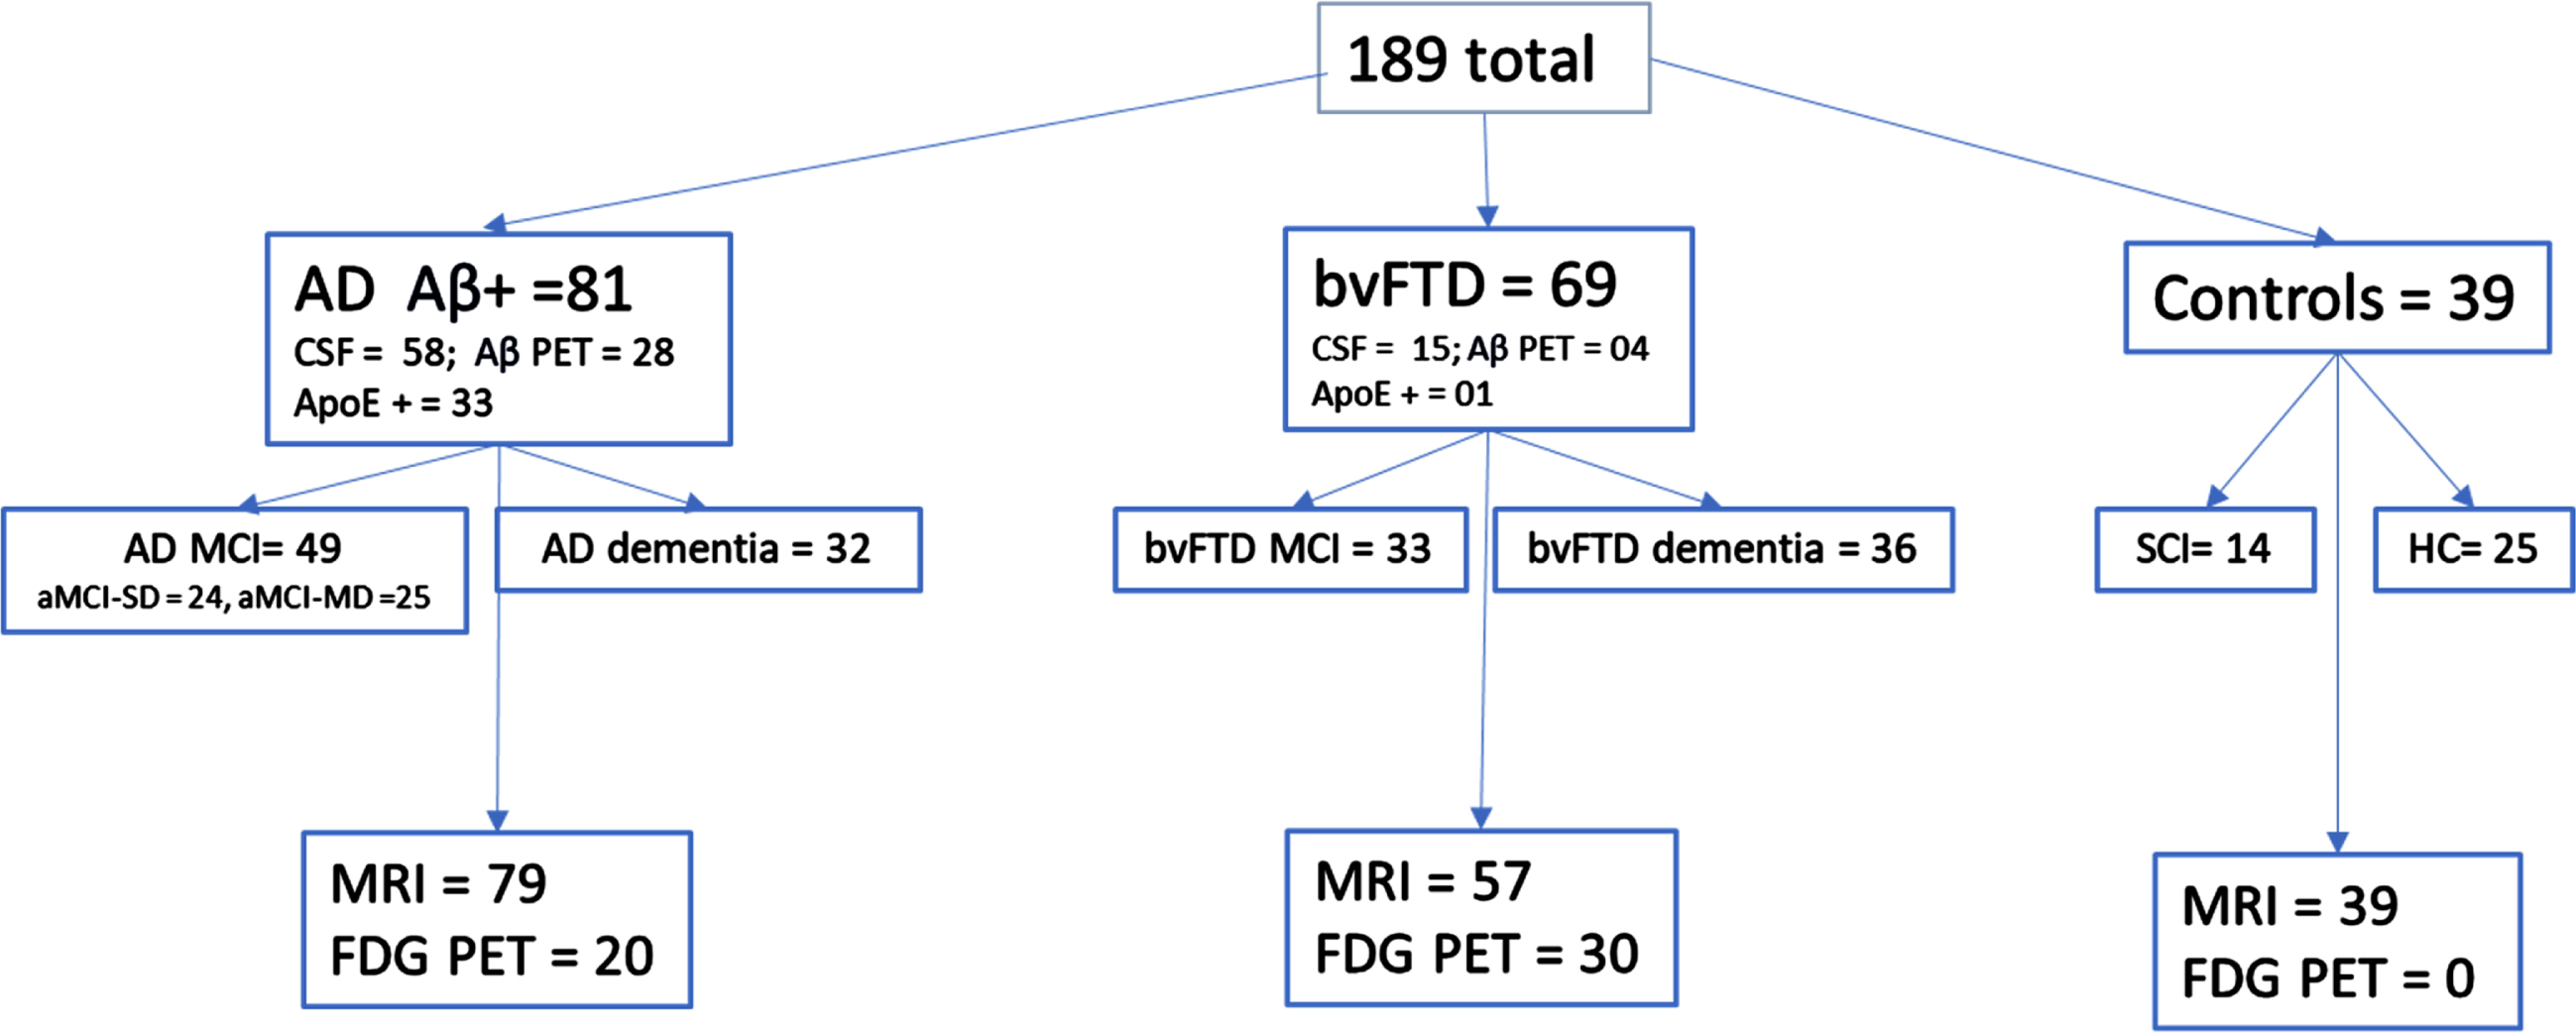
Sixty-nine individuals were diagnosed with bvFTD by consensus using standard criteria [35] (MCI due to bvFTD n = 33; bvFTD dementia = 36). All patients (and/or their caregivers) had concerns of changes in behavior as a primary symptom, although some also had concerns of impaired memory, attention, and/or language. Diagnosis of bvFTD included MRI that demonstrated frontal and/or temporal atrophy and/or FDG PET that demonstrated frontal and/or temporal hypometabolism. Thirty bvFTD completed an MRI and FDG PET. All but three participants showed frontal and/or temporal atrophy on MRI. The three participants who did not have frontal/temporal atrophy on MRI showed a pattern of frontal and/or temporal hypometabolism on FDG PET interpreted by a neuroradiologist as most consistent with FTD. Three participants were unable to participate in MRI due to claustrophobia or pacemaker; all three showed frontal/temporal atrophy on head CT and two of them also showed hypometabolism consistent with FTD on FDG PET. Four bvFTD participants had negative amyloid PET imaging and fifteen also had negative CSF for amyloid. See Table 1 for participant biomarker data.
Table 1
Participant biomarker data
| Measure | Group | Group | Statistics | Effect size |
| AD mean (SD) | FTD mean (SD) | F/p | ηp2 | |
| Aβ42* | 776.6 (235.0) | 1612.2 (342.3) | 123.3/<0.001 | 0.6 |
| Total Tau* | 335.1 (197.5) | 220.9 (82.4) | 4.8/0.04 | 0.1 |
| p-tau* | 33.9 (22.0) | 21.8(10.5) | 4.2/0.05 | 0.1 |
| p-tau/Aβ42** | 0.05 (0.04) | 0.01 (0) | 12.5/<0.001 | 0.2 |
| SUVr*** | 1.8 (0.3) | 1.0 (0.1) | 18.4/<0.001 | 0.4 |
*AD n = 58, bvFTD n = 15. **AD n = 57, bvFTD n = 12. ***AD n = 28, bvFTD n = 4.
Control/comparison participants were comprised of 14 healthy older participants with no cognitive concerns who completed the Mini-Mental State Examination, Wide Range Achievement Test-4 Word Reading subtest, and California Verbal Learning Test and seven of those also had Trail Making Test (TMT), Motor Sequencing (MS), and Go/No-go (G/NG). All healthy controls completed a high-resolution MRI scan of the brain. An additional 25 participants were seen in our multidisciplinary memory clinic for concerns of cognitive changes but were found on examination to have normal cognition (within 1 SD of the mean; [34]) on all neuropsychological measures as well as a normal MRI brain scan as read by a board certified neuroradiologist with no greater than a Fazekas rating of 1 for small vessel ischemic disease [36].
Measures
The following standard neuropsychological measures were used: California Verbal Learning Test –short form (CVLT-sf) [37] was used as a measure of verbal learning and retention that includes 9 words, 4 learning trials with delayed recall, and yes/no recognition testing. The following scores were used: recall on trial 1, total words recalled over the 4 learning trials, short delay free recall, long delay free recall, long delay cued recall, percentage of information retained from the 4th trial to the delayed recall trial, recognition discriminability index, number of hits and false positives on recognition, and total number of intrusion and repetition errors. Trail Making Test Part B (TMT-B) was used as a measure of executive functioning (speeded set shifting) with total time to complete the task used as the dependent measure. We used a maximum score of 300 s. Motor Sequencing (MS), also known as the Luria 3-Step Test, was used as a test of executive functioning requiring individuals to learn a 3-step motor sequence (fist-chop-slap). We used the total score for learning with both hands (range 0-8 with higher scores = worse performance) with increasing structure provided to assist with learning (i.e., modeling, verbal cues). Administration and scoring were standardized according to the procedures outline by Keifer and Haut [38]. Go/No-go (G/NG) was utilized as a measure of executive functioning, specifically response inhibition. This task involved the examiner hitting the table either forcefully or gently, while requiring individuals to perform the opposite action of what the examiner executed. Ten trials were conducted with each hand and number of stimulus bound errors (i.e., errors in which the participant performed the same action instead of the opposite action) was collected. Total score was used (0 = no stimulus bound errors, 1 = < 3 stimulus bound errors, 2 = > 3 stimulus bound errors, and 3 = consistent stimulus bound errors. Total scores ranged from 0–6 with higher scores indicating greater stimulus bound responding. Mini-Mental State Examination (MMSE) total score (0–30) was used as a measure of general cognitive status [39]. Wide Range Achievement Test (WRAT-4) [40] Word Reading subtest was used as a measure of premorbid functioning. Functional Activities Questionnaire (FAQ) [41] was completed by informants and used to assess functional deficits in daily life with scores ranging from 0–30 (higher score = greater functional impairment). Neuropsychiatric Inventory Questionnaire (NPI-Q) [42, 43] was also completed by informants and used to assess behavioral symptoms based on number and severity of symptoms. Specific symptoms assessed included delusions, hallucinations, agitation/aggression, dysphoria/depression, anxiety, euphoria/elation, apathy/indifference, disinhibition, irritability/lability, motor disturbance, nighttime behaviors, and appetite/eating behaviors. The Short Form Zarit Burden Inventory (ZBI-12) [44] was used to assess the level of burden for caregivers with a range of scores from 0-48 with higher scores indicating more burden.
MRI
High resolution isovoxel T1-weighted MPRAGE images were acquired on a Siemens 3T Magnetom Prisma scanner with 20 channel head coil with either sagittal or axial acquisition and a minimum resolution of 1×1×1 mm (TR/TE = 2300 ms/2.26 ms Flip angle: 8 degrees). Eighteen participants (8 in AD group, 7 in bvFTD group, 3 in HC group) received their imaging on a GE Architect 3T scanner with a 48-channel head coil using a comparable T1 Bravo SPGR sequence with 1×1×1 mm resolution (TR/TE = 8.5 ms/3.3 ms). We compared the quality of the scanners using the IQR score from Cat12, which was different between the two scanners (F = 8.2, p = 0.005). Thus, scanner type was used as a covariate in the analyses of cortical thickness. Participants also received a T2 FLAIR 3D sequence with 1 mm resolution (TR = 6000 ms; TE = 399 ms). In some cases (N = 26; 11 in AD group, 12 in bvFTD group, 3 in HC group), a lower resolution standard clinical T2 FLAIR sequence was used with 5 mm slice thickness. The resolution of the T2 FLAIR did not make a difference in the volume of WMH (F < 1).
T1-weighted images were processed using the CAT12 (http://www.neuro.uni-jena.de/cat/) [45] segmentation routine implemented within SPM12 (http://www. fil. ion.ucl.ac.uk/spm/software/spm12/) and operated within the Matlab environment (R2021b; https://www.mathworks.com) using the default parameters. Each individual T1 sequence was reviewed for quality and only participants with an IQR score of > 70 were included. There was a total of 12 MRIs that were read clinically for diagnosis that were not included in the cortical thickness analysis due to poor IQR (IQR < 70). These scans were from outside facilities.
We chose to examine the published signature brain areas in AD [26] and bvFTD [30]. There is overlap between the two signatures (inferior temporal, middle temporal, temporal pole, superior frontal, middle frontal) as well as several areas unique to each disease. Unique signature areas for AD included the precuneus, angular gyrus, supramarginal gyrus, and superior parietal lobule. Unique signature areas for bvFTD included the insula and anterior cingulate gyrus. We used cortical thickness as calculated by CAT12 using the DKT atlas [46] averaged across hemispheres for each of the above areas. T2 FLAIR images were processed using the lesion segmentation toolbox (LST) [47] operated within SPM12. We utilized the lesion prediction algorithm [48] to measure the total volume of WMH in ml.
18Fluoro-deoxyglucose (FDG) PET image acquisition
After at least 4-h fasting, blood glucose level was measured and was lower than 160 mg/dl. Each participant received 8–10 mCi of 18F-FDG injection via a venous cannula after a 10-min rest in a silent and dimly lit room, with unplugged ears and closed eyes. PET scan was obtained using a Siemens Biograph mCT system with 3 LSO rings and 20 slices and image acquisition beginning approximately 45–60 min after the 18F-FDG injection. The acquired images were reconstructed with an ordered subset-expectation maximization algorithm following the standard protocols used for clinical purposes and embedded in the Siemens workstations. Attenuation correction was based on computed tomography scan. In brief, the following parameters were used: 10 min of acquisition time, in a single bed position; 120 kV, 400 mAs, 1-s rotation time; pitch 1; slice thickness 2 mm; reconstruction interval 1 mm. The True X + TOF (Ultra HD-PET) method with 4 iterations and 21 subsets was used for the three-dimensional image reconstruction with a FWHM 1.0. We used the mean standard uptake value (SUV) of a mask of the cerebellar gray matter as a reference value to convert each PET voxel into an SUVr value.
PET image processing
First, T1-weighted MRI images were processed with Spatially Localized Atlas Network Tiles (SLANT) [49]. This program rapidly segments and classifies the tissue and segments the brain into 132 regions for volumetric analysis. The PET scan was co-registered with the CT scan which in turn was co-registered with the T1 MRI using an automatic mutual information-based registration [50], and then the segmentation from SLANT based on the T1 MRI was applied to the PET scan.
Analysis plan
Analysis of variance (ANOVA) or Chi-square tests when applicable, were used to compare the groups for demographic and clinical variables. We also conducted Pearson correlations to explore the relationships between memory and executive functioning measures with thickness and glucose metabolism in signature areas and corrected for the number of correlations across all measures (14 cognitive measures × [11 MRI + 11 PET + WMH]; 0.05/322 = 0.000155). A series of ANOVAs or ANCOVAs were used to examine differences between the groups for 1) Learning/memory, 2) Executive functions, 3) Cortical thickness, and 4) Glucose metabolism. We corrected for multiple comparisons across all measures by dividing the standard p value by the number of analyses conducted (0.05/36 = 0.0014). Follow up LSD post hoc tests were used to examine significant differences between the groups for each measure.
RESULTS
As seen in Table 1, the expected differences were observed between AD and FTD groups on measures of amyloid. However, there was not a reliable difference between the groups for total tau or ptau when correcting for multiple comparisons. As seen in Table 2, there was no significant difference between the groups for gender. The control group was younger than AD and FTD, without difference between the two clinical groups. The bvFTD group had fewer years of education than the AD and control groups. The HC group had higher estimated premorbid functioning than the AD group, and the AD group had higher estimated premorbid functioning than the bvFTD group. All groups were well-educated with an average of some post high school education. The sample was overwhelmingly white (97%). The groups did not differ for volume of WMH when covarying age. We ran a series of correlations examining the relationships of age, education, and WRAT-4 Word Reading Standard Score (SS) with memory, executive function, MRI, and FDG-PET measures. We also examined correlations between WMH and the measures of memory and executive functions. Correcting for the number of correlations, age was significantly correlated with TMT-B. Premorbid intelligence was significantly correlated with Trial 1 recall and Total recall on the CVLT and G/NG. Age was also inversely correlated with the thickness of the middle temporal gyrus, middle frontal gyrus, and superior frontal gyrus. Age was not related to any of the PET measures. Education was not related to any of the measures. Premorbid functioning was not related to any of the MRI or PET measures. Thus, we used age and WRAT-4 Word Reading SS (premorbid function) as covariates during the ANCOVAs for select memory and the executive functions, age as a covariate for ANCOVAs evaluating select regions of cortical thickness, and scanner type for all regions of cortical thickness. We did not include any covariates for FDG PET, as age and premorbid functioning/education were not related to glucose metabolism in any signature regions. We chose not to covary WMH from cortical thickness analyses as there is no way to covary out one without impacting the essence of the other. See supplemental tables for all correlations and covariates.
Table 2
Participant demographics and clinical characteristics
| AD (n = 81) | bvFTD (n = 69) | HC (n = 39) | F | Eta2 | |
| Mean (SD) | Mean (SD) | Mean (SD) | |||
| Age*a | 68.2 (7.3) | 68.5 (8.5) | 62.3 (7.8) | 9.2 | 0.09 |
| Gender+ | 39F/38M | 27F/38M | 25F/14M | 4.2 | 0.15 |
| Education*b (y) | 15.6 (2.8) | 13.2 (2.3) | 15.7 (3.2) | 16.6 | 0.15 |
| WRAT-4*c | 102.2 (12.2) n = 81 | 95.3 (12.6) n = 67 | 107.3 (14.7) n = 39 | 11.2 | 0.11 |
| MMSE*d | 26.1 (2.5) n = 79 | 25.4 (3.5) n = 69 | 29.0 (1.2) n = 39 | 23.4 | 0.20 |
| FAQ*e | 8.6 (6.6) n = 71 | 11.7 (7.4) n = 62 | 1.3 (2.6) n = 35 | 29.0 | 0.26 |
| NPITot*d | 3.4 (2.9) n = 63 | 5.4 (2.7) n = 54 | 1.1 (1.5) n = 28 | 22.5 | 0.24 |
| NPISev*e | 4.8 (4.8) n = 60 | 11.0 (7.6) n = 53 | 2.6 (2.9) n = 12 | 15.9 | 0.21 |
| ZBI*d | 7.9 (7.4) n = 53 | 13.2 (9.5) n = 52 | 5.4 (4.2) n = 9 | 5.5 | 0.09 |
| WMH Vol¥ | 3.5 (4.5) n = 78 | 6.0 (7.1) = 58 | 1.2 (1.6) n = 39 | 5.8 | 0.06 |
*p < 0.00014; abvFTD = AD > HC; bbvFTD < AD = HC; cbvFTD < AD < HC; dbvFTD = AD < HC; ebvFTD > AD > HC; +Chi-square test of independence reporting chi-squared statistic and Cramer’s V; ¥covarying age; WRAT-4, Wide Range Achievement Test Fourth Edition; MMSE, Mini-Mental State Examination; FAQ, Functional Activities Questionnaire; NPITot, Neuropsychiatric Inventory Total Symptoms; NPISev, Neuropsychiatric Inventory Symptom Severity; ZBI, Zarit Burden Inventory Short Form.
As expected, the clinical groups had lower MMSE scores than the controls but did not differ from each other (see Table 2). The level of impairment was mild. Functional status was more impaired in bvFTD than AD, and AD was more impaired than controls. Both clinical groups had a greater number of neuropsychiatric symptoms relative to HC, and the bvFTD group had more severe neuropsychiatric symptoms than the AD group. The caregivers of patients with bvFTD reported higher burden than the caregivers of participants with AD, but it did not survive correction.
Pearson correlations between the memory and executive scores with cortical thickness and glucose metabolism in signature areas are displayed in Table 3 as a heat map. Learning and recall variables showed significant relationships with cortical thickness diffusely across many signature areas. Percent retained, intrusions, and false positive relationships did not survive correction. Executive measures were related to thickness in numerous regions. Because of the low number of participants with available FDG PET, correlations with glucose metabolism and cognitive measures did not survive corrections.
Table 3
Heat map of correlations of cognitive with cortical thickness and metabolism
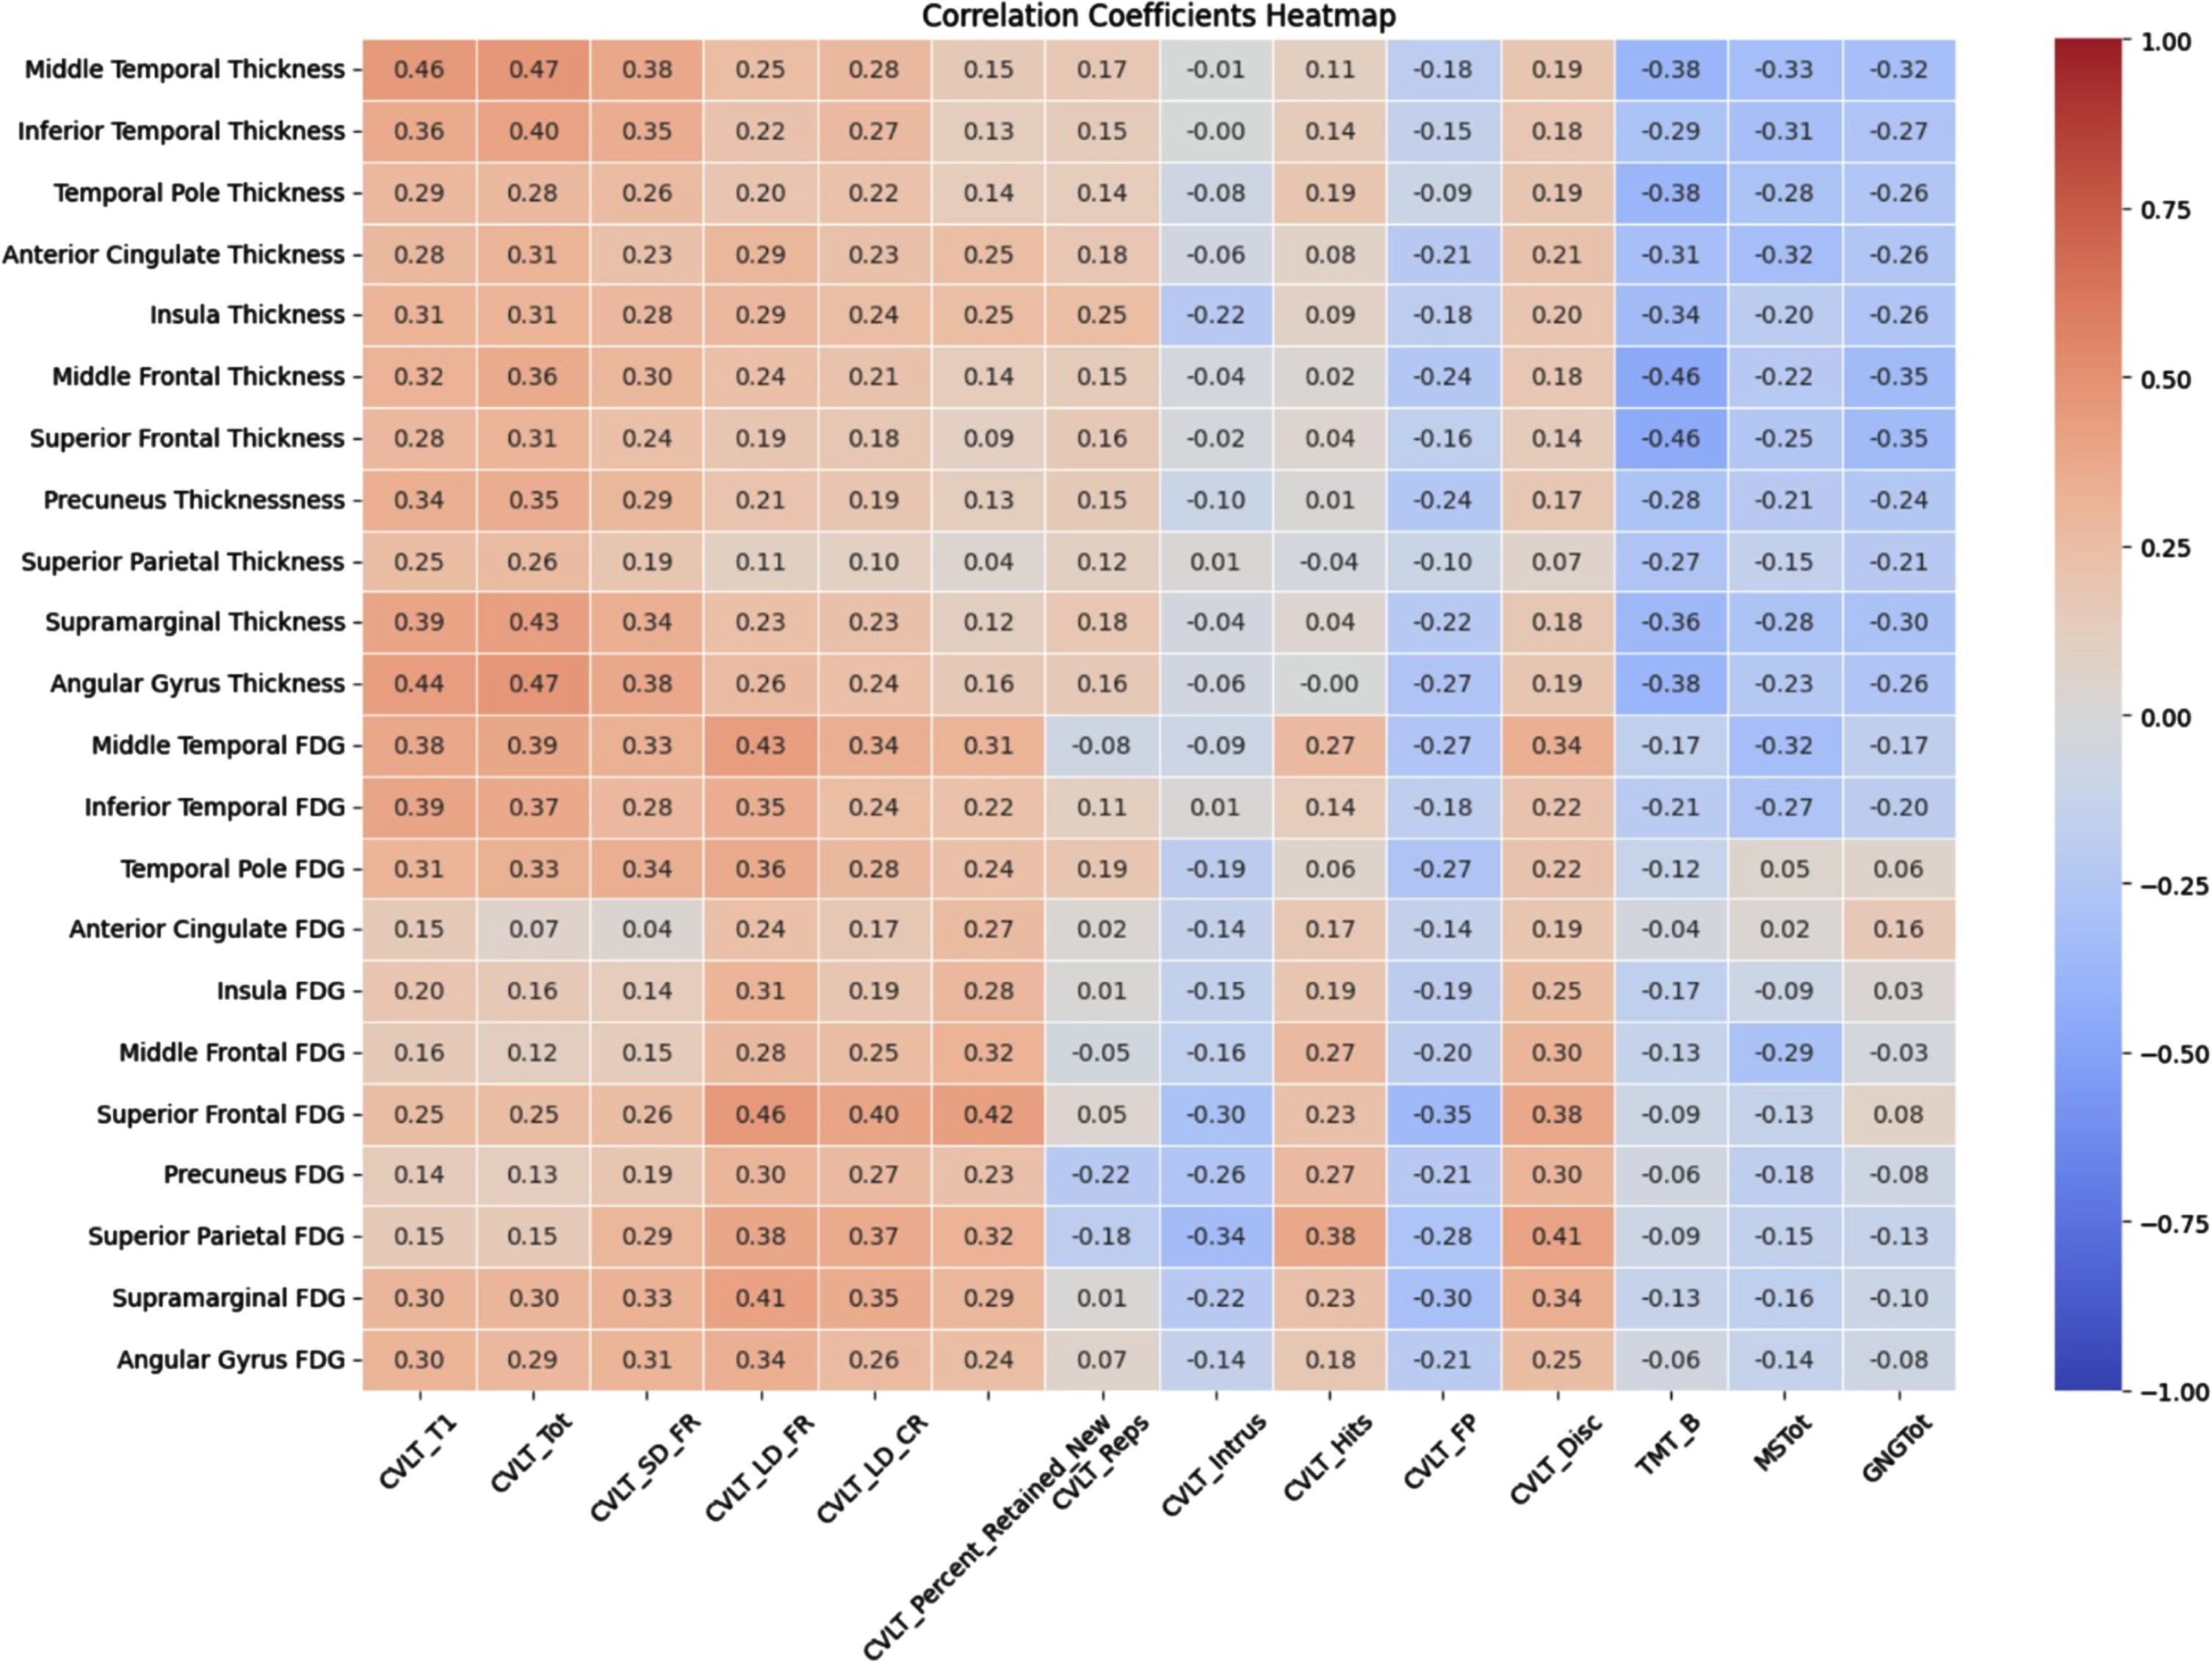 |
Significant correlations correcting for multiple correlations r = 0.29 for cortical thickness and r = 0.44 for glucose metabolism. an = 186; bn = 50; CVLTTOT, total words recalled on CVLT trials 1–4; CVLTSDF, total recalled after 30” delay; CVLTLDF, total recalled after 10’ delay; CVLTLDC, total recalled with category cues; CVLT% R, percentage recalled after 10-min delay relative to trial 4; CVLTRep, total repetition errors; CVLTIntr, total intrusion errors; CVLTHits, total correct on recognition; CVLTFP, total false positive errors on recognition; CVLTDisc, discrimination score from recognition; TMT-B, total time to complete Trail making Test B; MS, score on motor sequencing; G/NG, score on go/no-go.
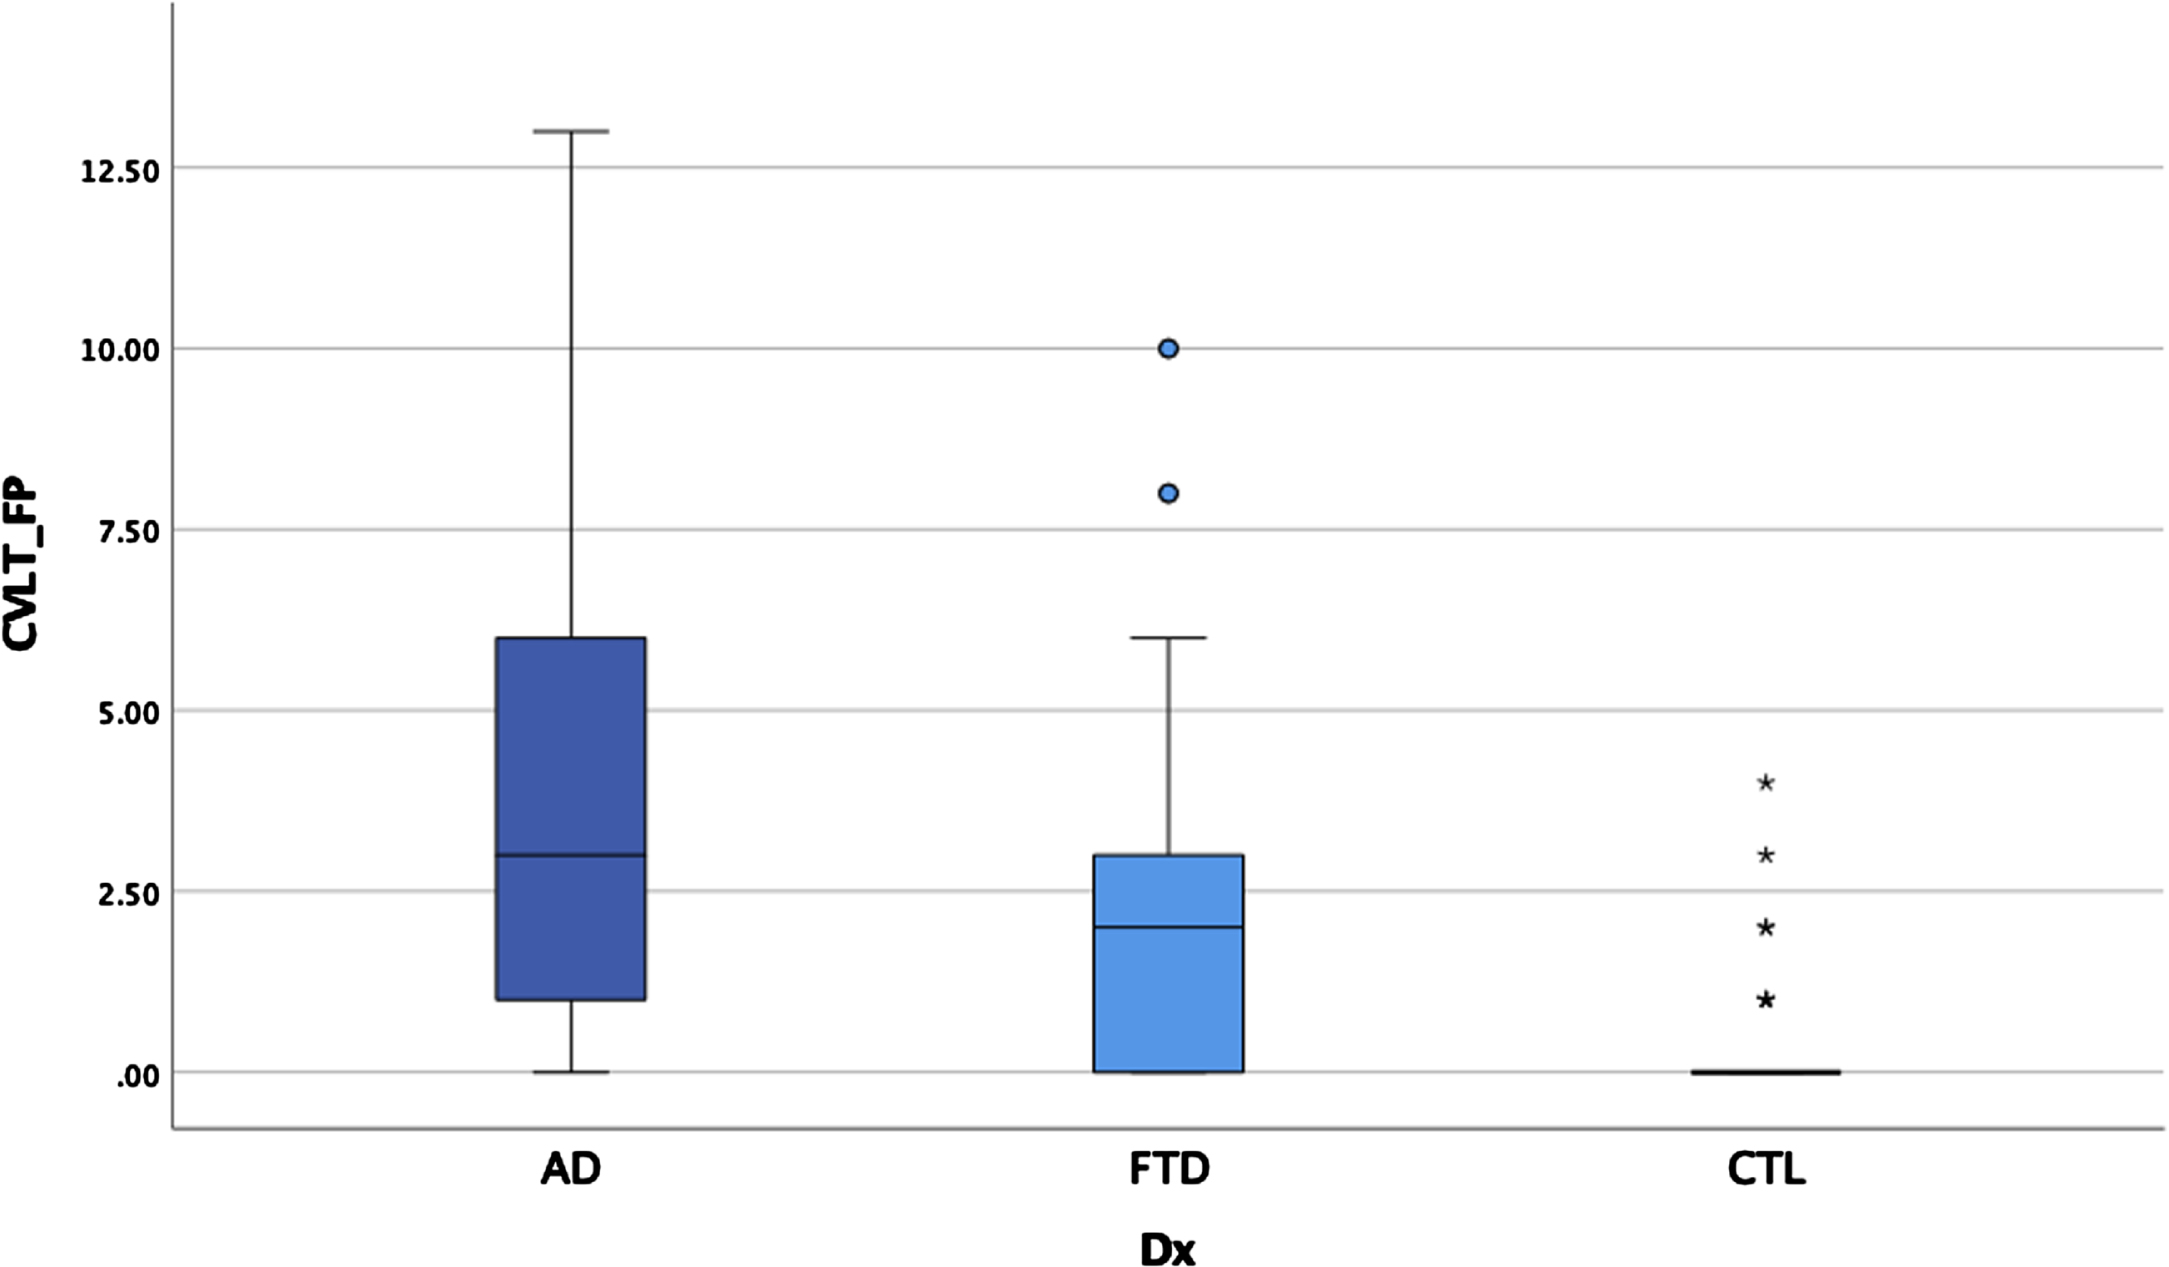
ANOVAS and ANCOVAs examining memory performances for the three groups revealed significant main effects after controlling for age on some measures and after correcting for multiple comparisons (p < 0.00014 for significance) for all CVLT variables except repetition errors, intrusion errors, and number of hits on recognition (see Table 4 and Figs. 2–4). Post-hoc LSD revealed that the clinical groups performed more poorly than the HC on trial 1 recall, total recall, long delay cued recall, and percentage retained, but did not differ from each other. For short delay free recall, long delay free recall, false positive errors, and recognition discrimination, both clinical groups performed more poorly than HC, but AD performed more poorly than bvFTD.
Table 4
Memory and executive functioning by group
| AD N = 81 | bvFTD N = 67 | HC N = 39 | F | Eta2 | |
| Mean (SD) | Mean (SD) | Mean (SD) | |||
| CVLT T1*a | 3.8 (1.6) | 3.8 (1.4) | 5.3 (0.8) | 13.9 | 0.13 |
| CVLTTOT*a | 20.4 (6.3) | 20.8 (5.6) | 28.8 (2.8) | 27.7 | 0.23 |
| CVLTSDF*b | 4.6 (2.2) | 5.2 (2.3) | 7.9 (1.1) | 30.1 | 0.21 |
| CVLTLDF*b | 3.1 (2.7) | 4.0 (2.7) | 7.7 (1.3) | 47.7 | 0.34 |
| CVLTLDC*a | 4.1 (2.5) | 4.6 (2.3) | 7.8 (1.1) | 41.3 | 0.31 |
| CVLT% R*a | 49.2 (41.8) | 59.8 (35.7) | 94.7 (13.7) | 21.6 | 0.19 |
| CVLTRep | 1.3 (1.6) | 1.3 (3.2) | 2.0 (1.9) | 1.3 | 0.01 |
| CVLTIntr | 3.6 (4.2) | 2.6 (3.0) | 0.9 (1.3) | 8.8 | 0.09 |
| CVLTHits | 7.4 (1.6) | 7.5 (2.0) | 8.5 (1.5) | 5.6 | 0.06 |
| CVLTFP*b | 3.7 (3.4) | 2.4 (2.5) | 0.3 (0.7) | 21.1 | 0.19 |
| CVLTDisc*b | 1.9 (1.0) | 2.3 (1.0) | 3.3 (0.4) | 29.5 | 0.24 |
| TMT-B*c | 156.6 (94.9) n = 78 | 197.7 (99.6) n = 67 | 62.6 (24.7) n = 32 | 19.6 | 0.18 |
| MS*d | 4.3 (3.0) n = 79 | 4.9 (3.0) n = 64 | 1.3 (1.4) n = 31 | 14.3 | 0.15 |
| G/NG*d | 2.2 (1.6) n = 80 | 2.8 (1.9) n = 63 | 0.7 (1.0) n = 31 | 11.9 | 0.12 |
*Main effects after correcting for multiple comparisons p < 0.00014; aAD = bvFTD < HC; bAD < bvFTD < HC; c bvFTD > AD > HC; dAD = bvFTD > HC; CVLT1, words recalled on trial 1; CVLTTOT, total words recalled on CVLT trials 1-4; CVLTSDF, total recalled after 30” delay; CVLTLDF, total recalled after 10’ delay; CVLTLDC, total recalled with category cues; CVLT% R, percentage recalled after 10-min delay relative to trial 4; CVLTRep, total repetition errors; CVLTIntr, total intrusion errors; CVLTHits, total correct on recognition; CVLTFP, total false positive errors on recognition; CVLTDisc, discrimination score from recognition; TMT-B, total time to complete Trail Making Test B in seconds (lower score indicates better performance); MS, error score on motor sequencing (lower score = fewer errors); G/NG, error score on go/no-go (lower score = fewer errors).
Fig. 2
Total learning by group.
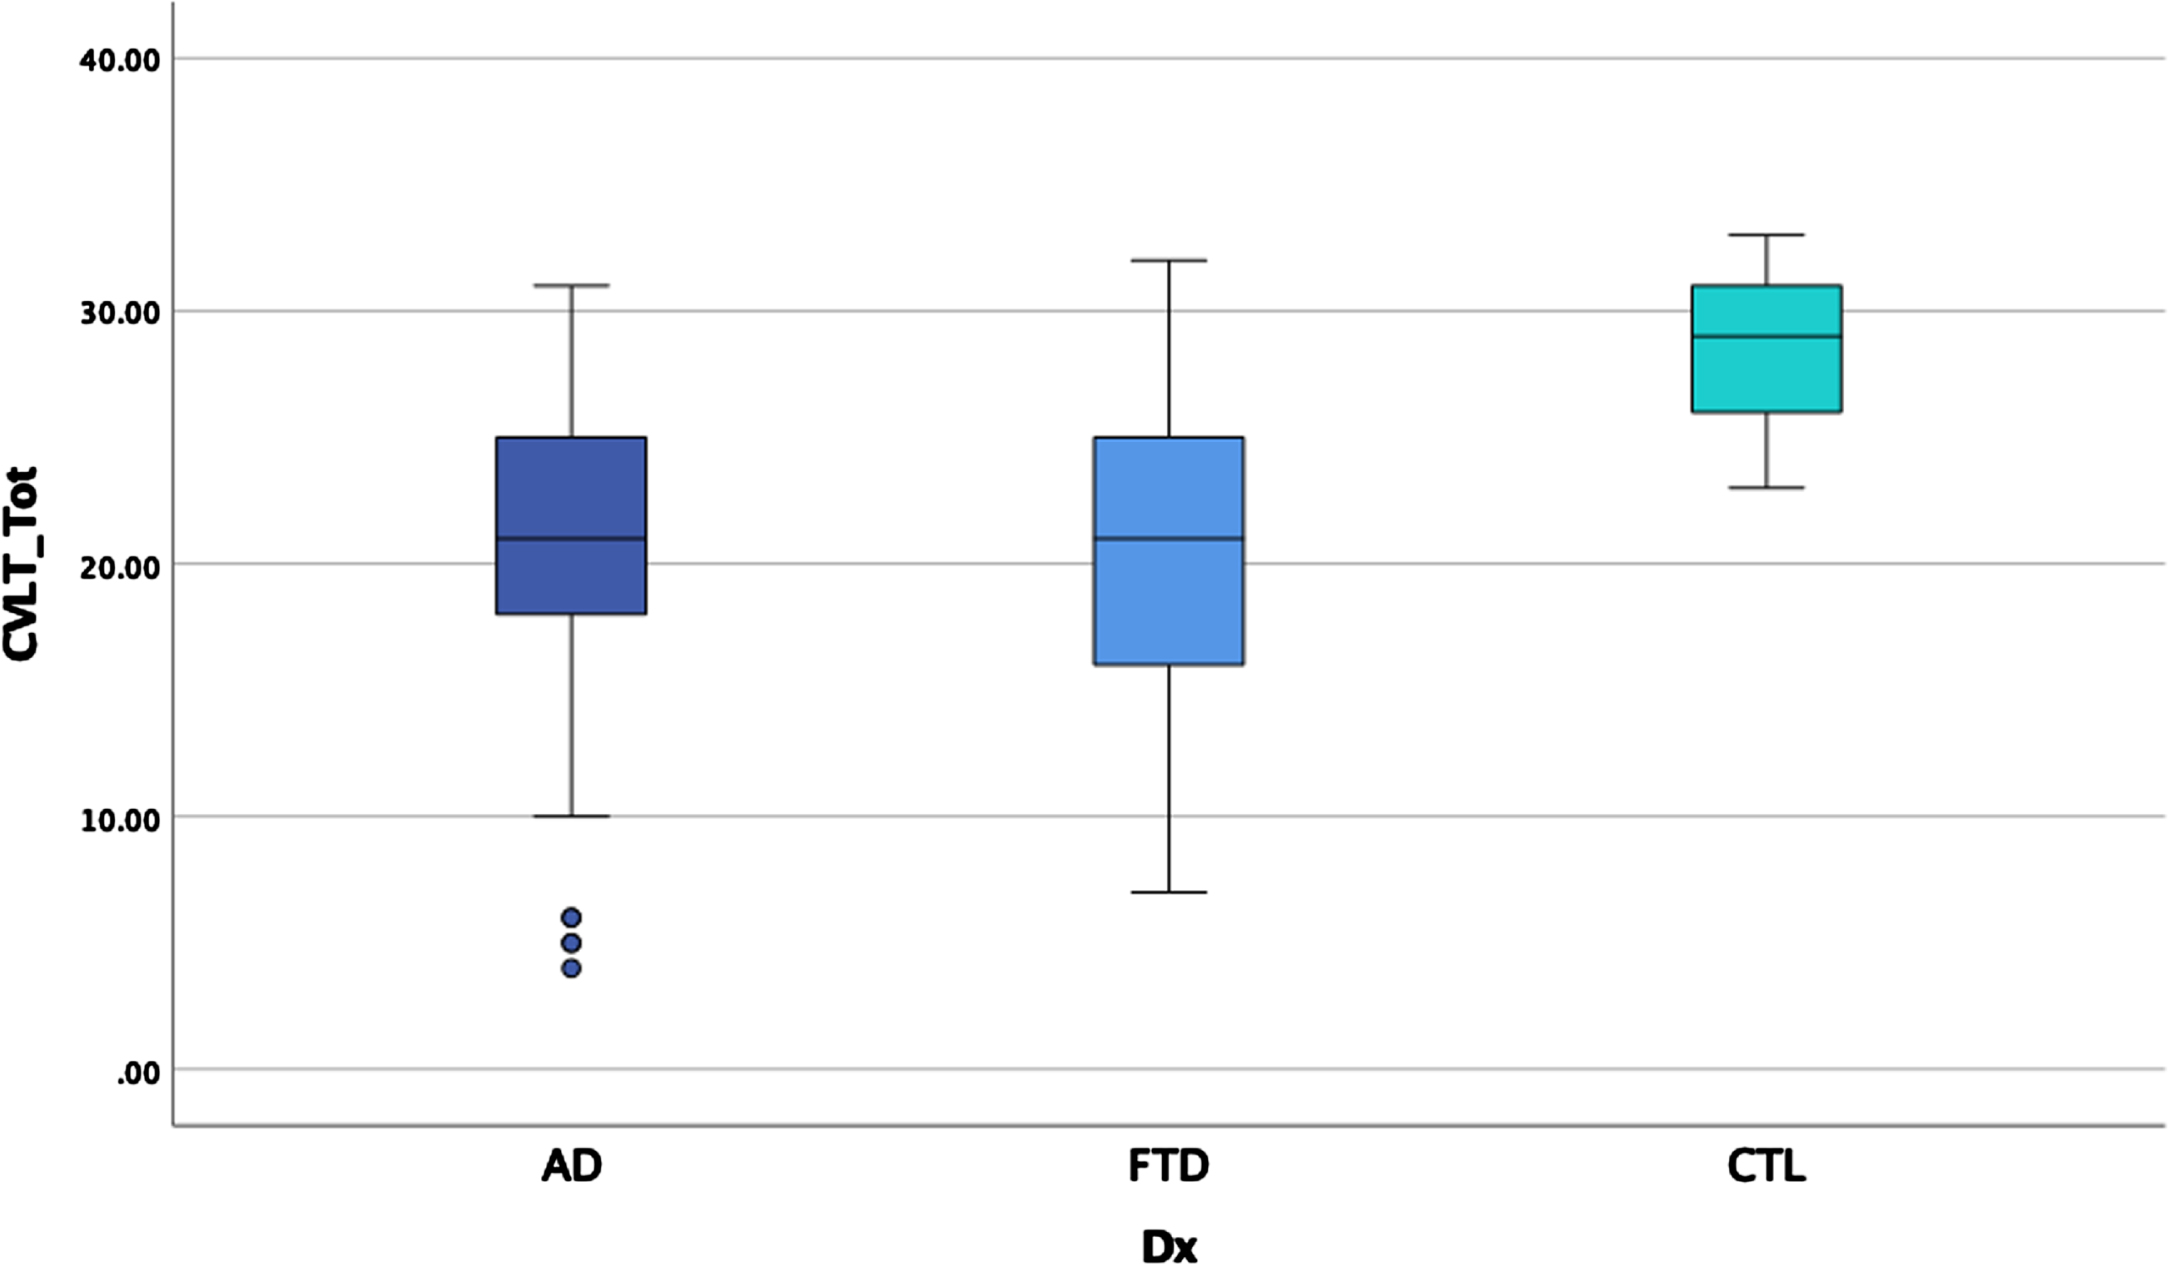
Fig. 3
Retention by group.
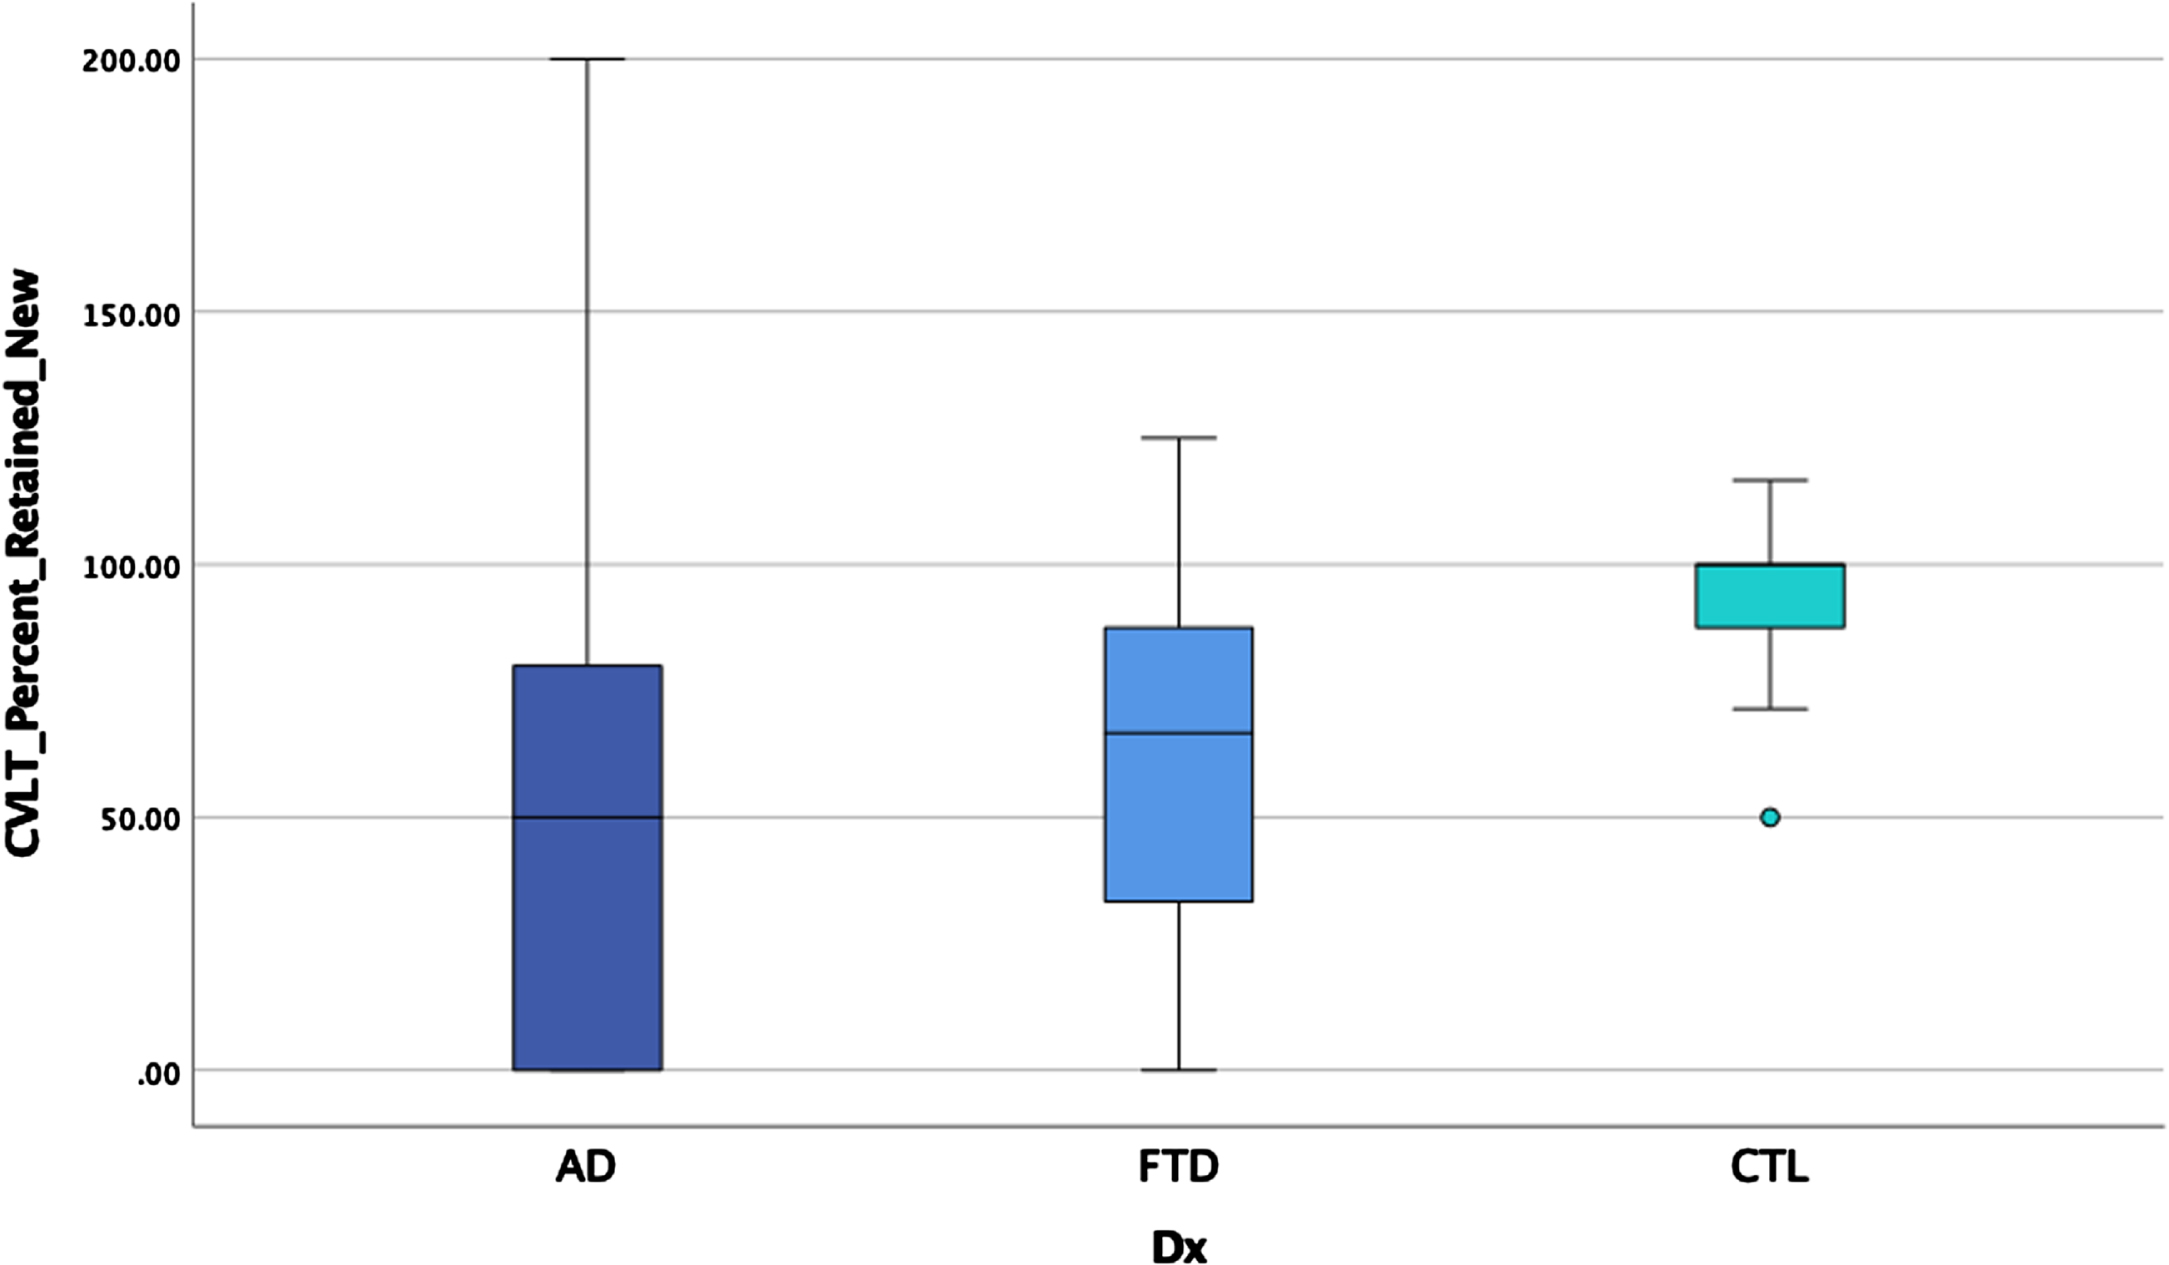
Fig. 4
False positive errors by group.
ANCOVAs examining executive performances between the three groups covarying age, WMH, and WRAT-4 dependent on the measure, demonstrated significant main effects for TMT-B, MS, G/NG, after controlling for multiple comparisons (see Table 4). Post hoc LSD revealed the clinical groups performed worse than the healthy controls (with higher scores indicating worse performances for these tasks) for MS and GNG, but there were no differences between the two clinical groups. For TMT-B, AD and bvFTD performed worse than controls and bvFTD performed worse than AD.
ANCOVAs examining cortical thickness between the three groups revealed significant main effects after controlling for scanner in each region, controlling for age for some measures, and correcting for multiple comparisons (p < 0.00014 for significance) in the temporal pole, insula, anterior cingulate gyrus, supramarginal gyrus, and angular gyrus (see Table 5). Post-hoc LSD revealed the clinical groups had thinner cortex than the HC in the anterior cingulate gyrus and supramarginal gyrus but did not differ from each other. The bvFTD group had thinner temporal pole and insula relative to AD and HC (see Figs. 5 and 6) who also differed from each other. The AD group showed thinner angular gyrus relative to bvFTD and HC (see Fig. 7), who also differed from each other. ANOVAs examining glucose metabolism on FDG PET for the two clinical groups revealed significantly lower glucose metabolism in the angular gyrus in AD relative to bvFTD (see Table 5 and Fig. 8).
Fig. 5
Insula thickness by group.
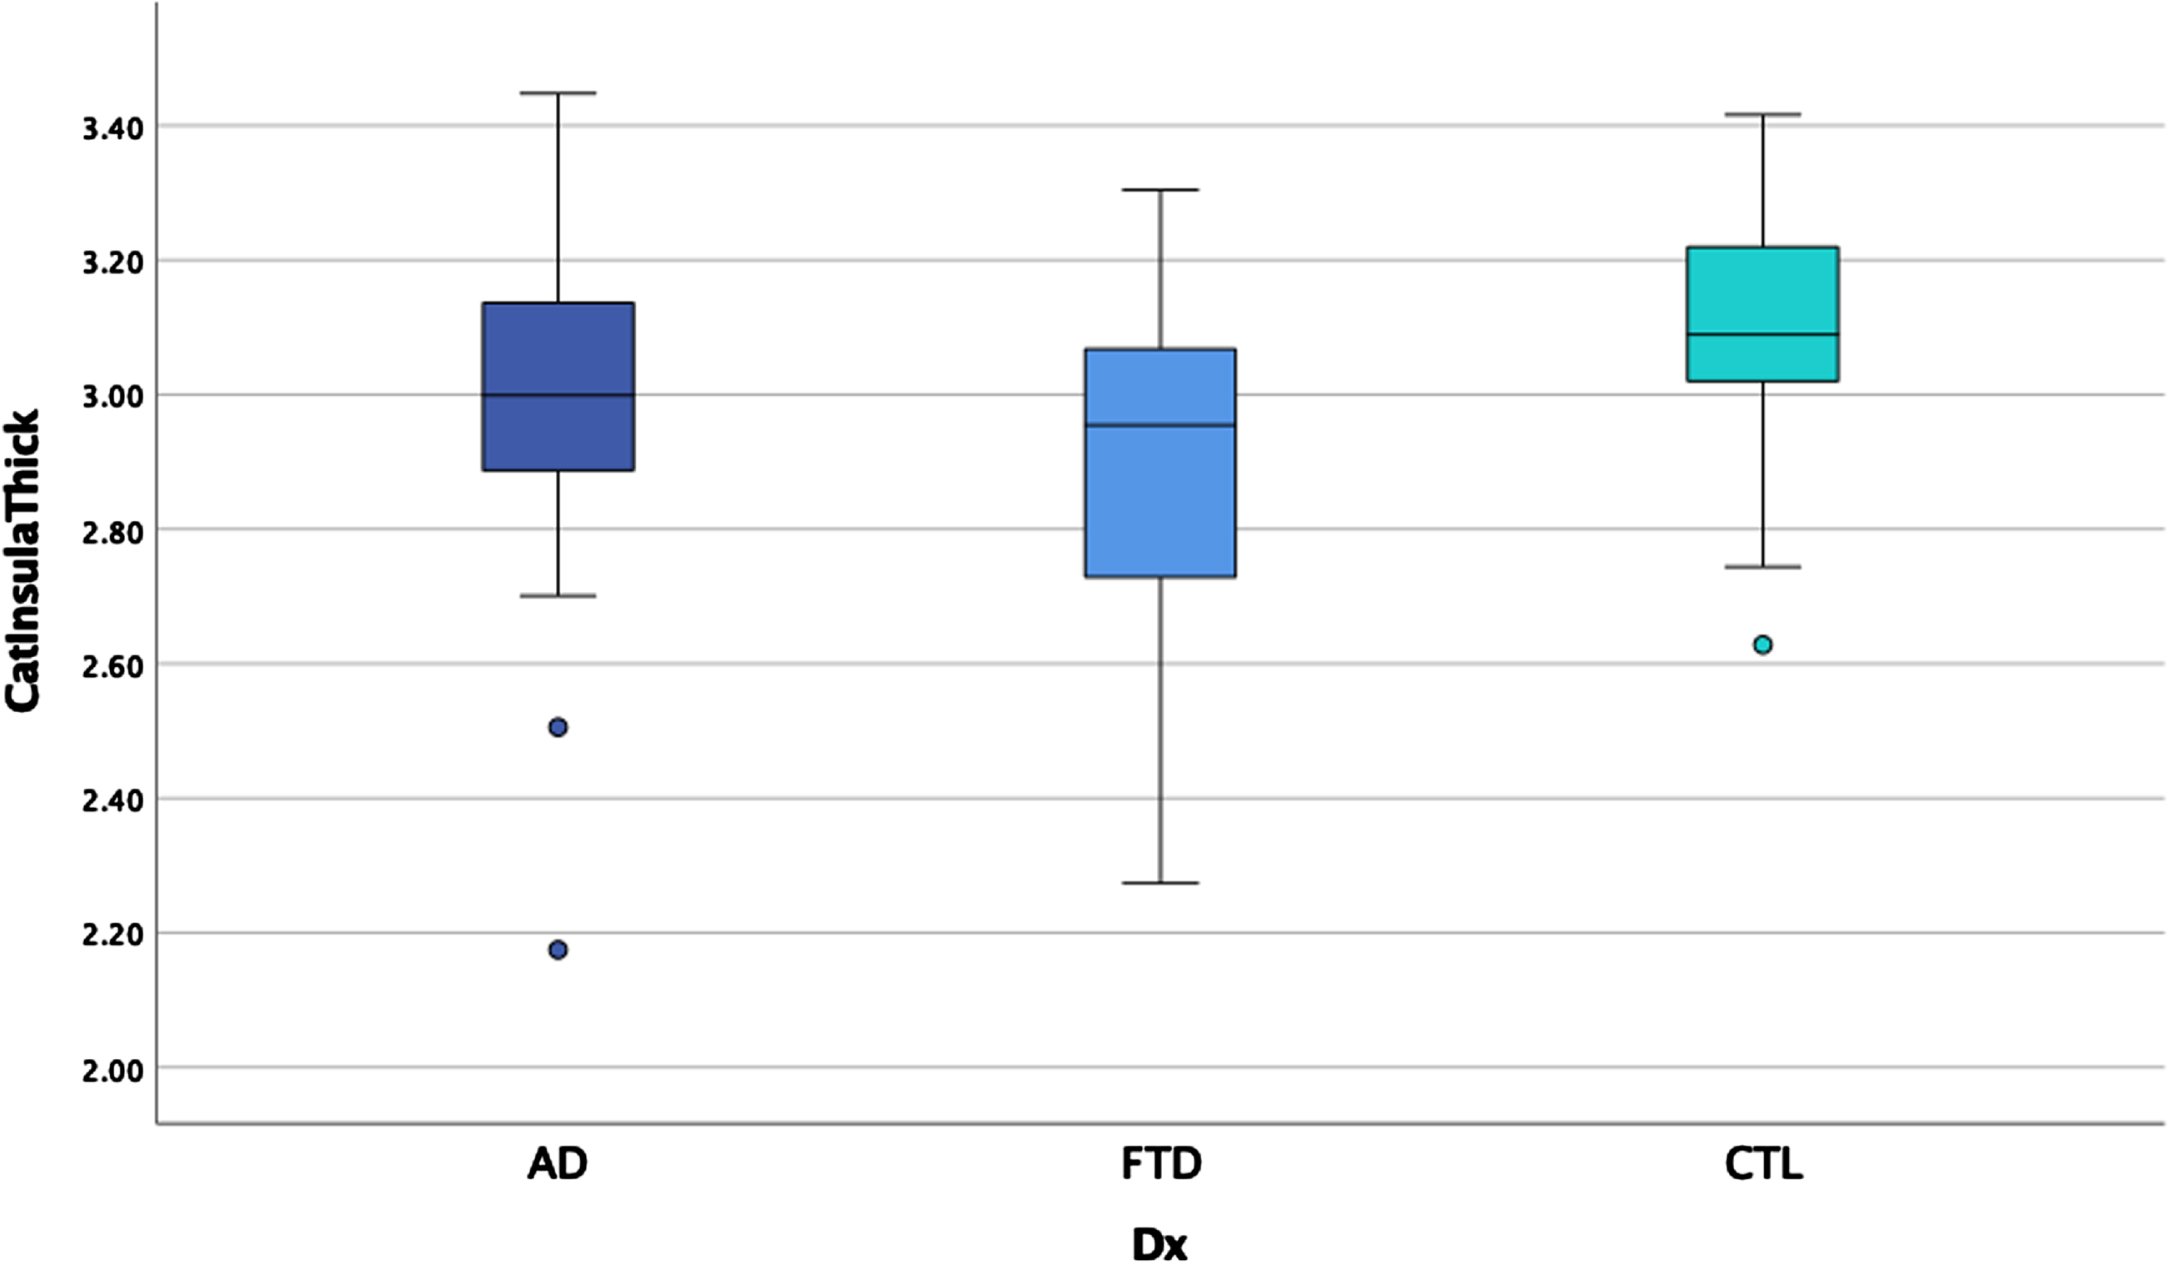
Fig. 6
Temporal pole thickness by group.
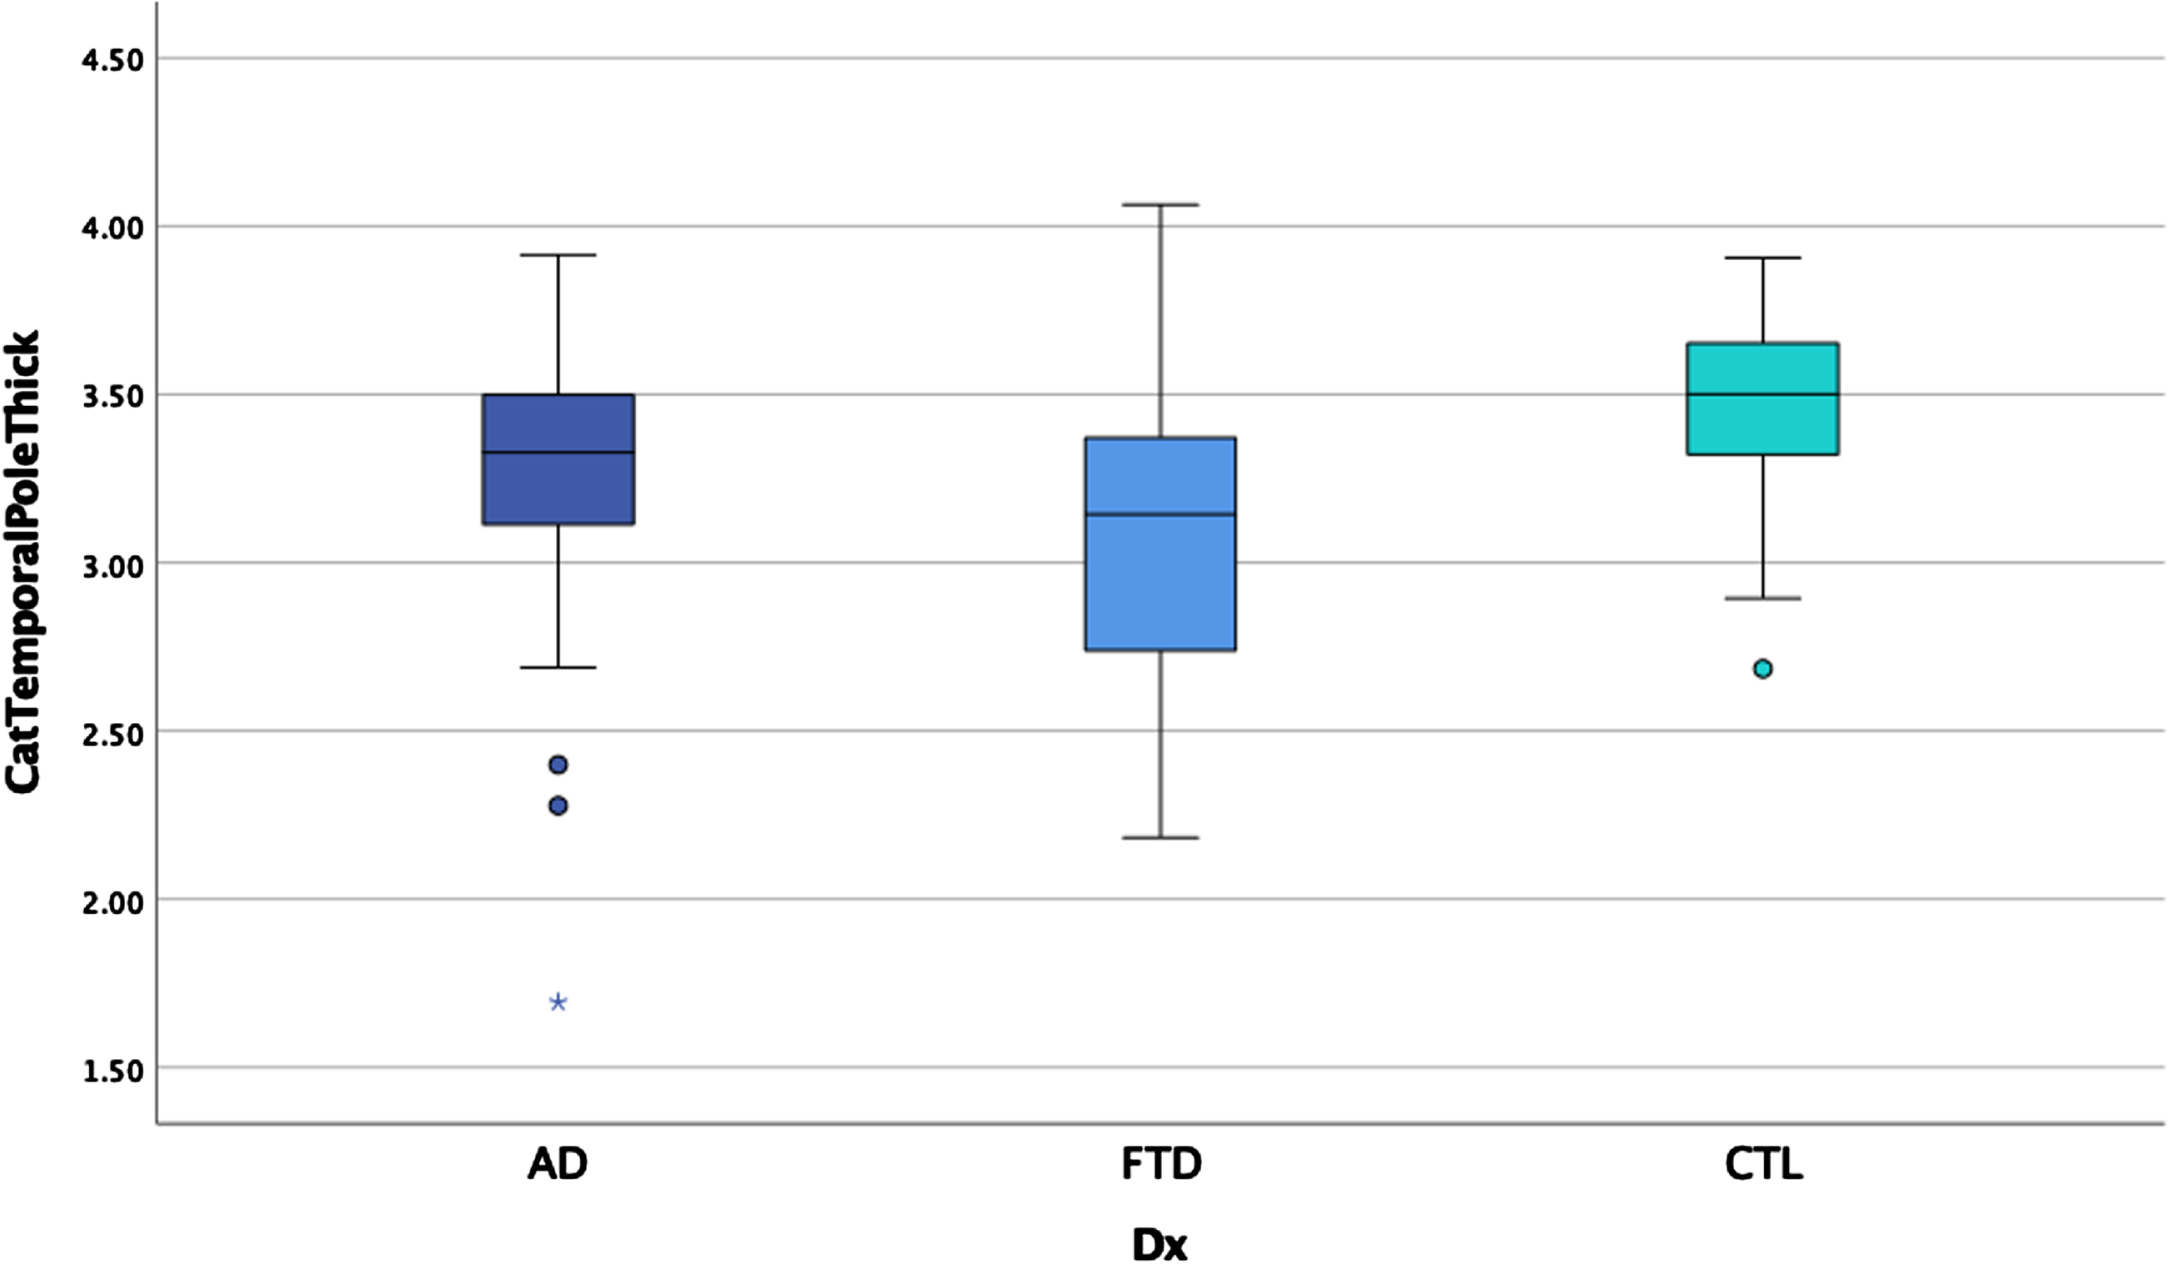
Fig. 7
Angular gyrus thickness by group.
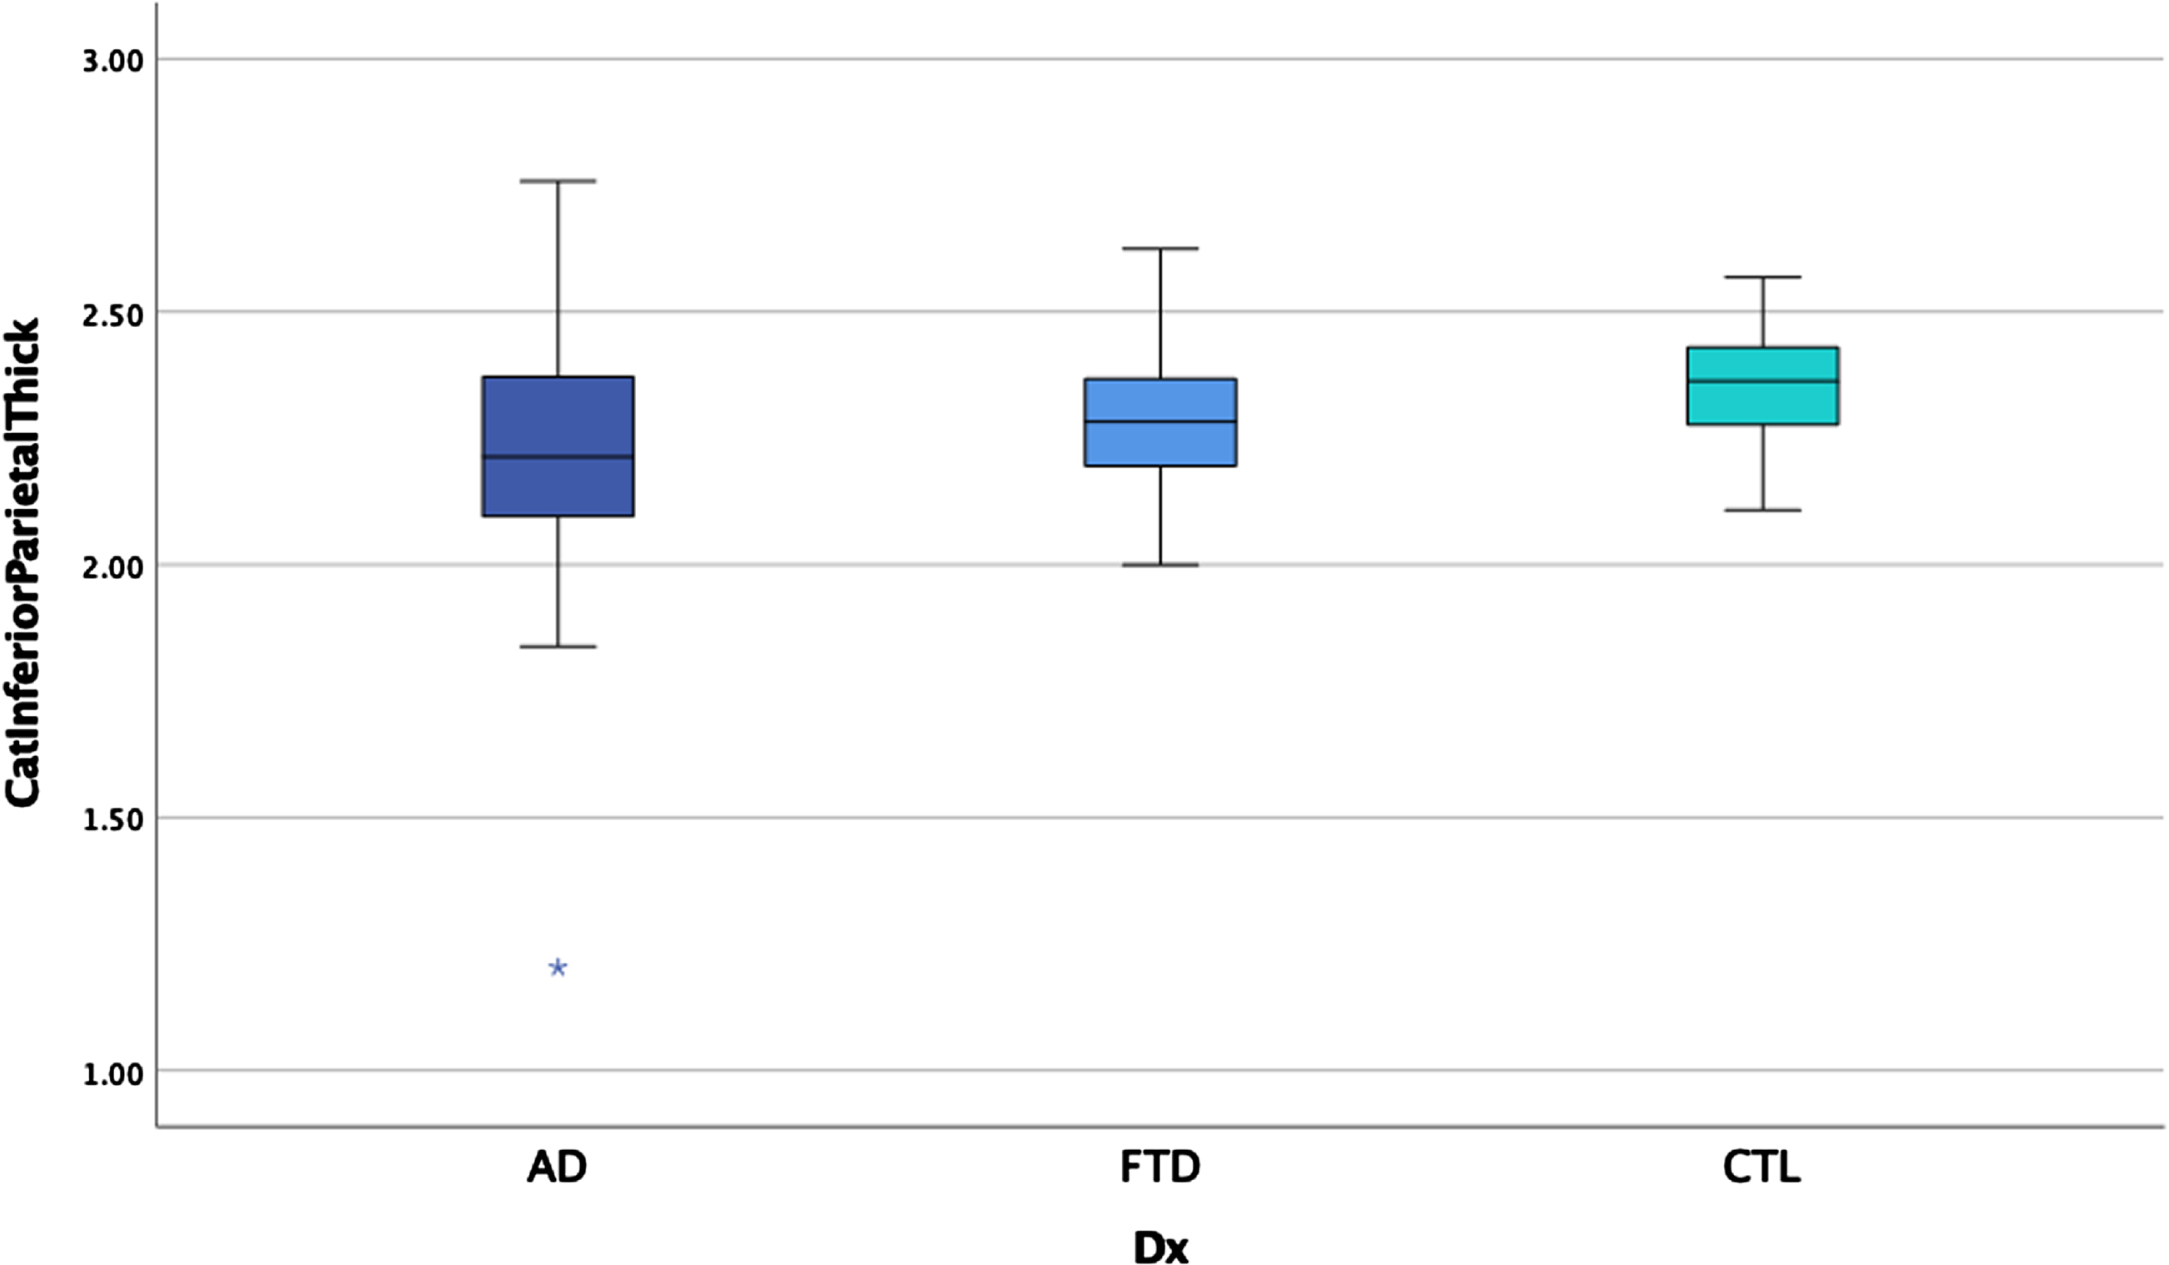
Fig. 8
Angular gyrus metabolism by group.
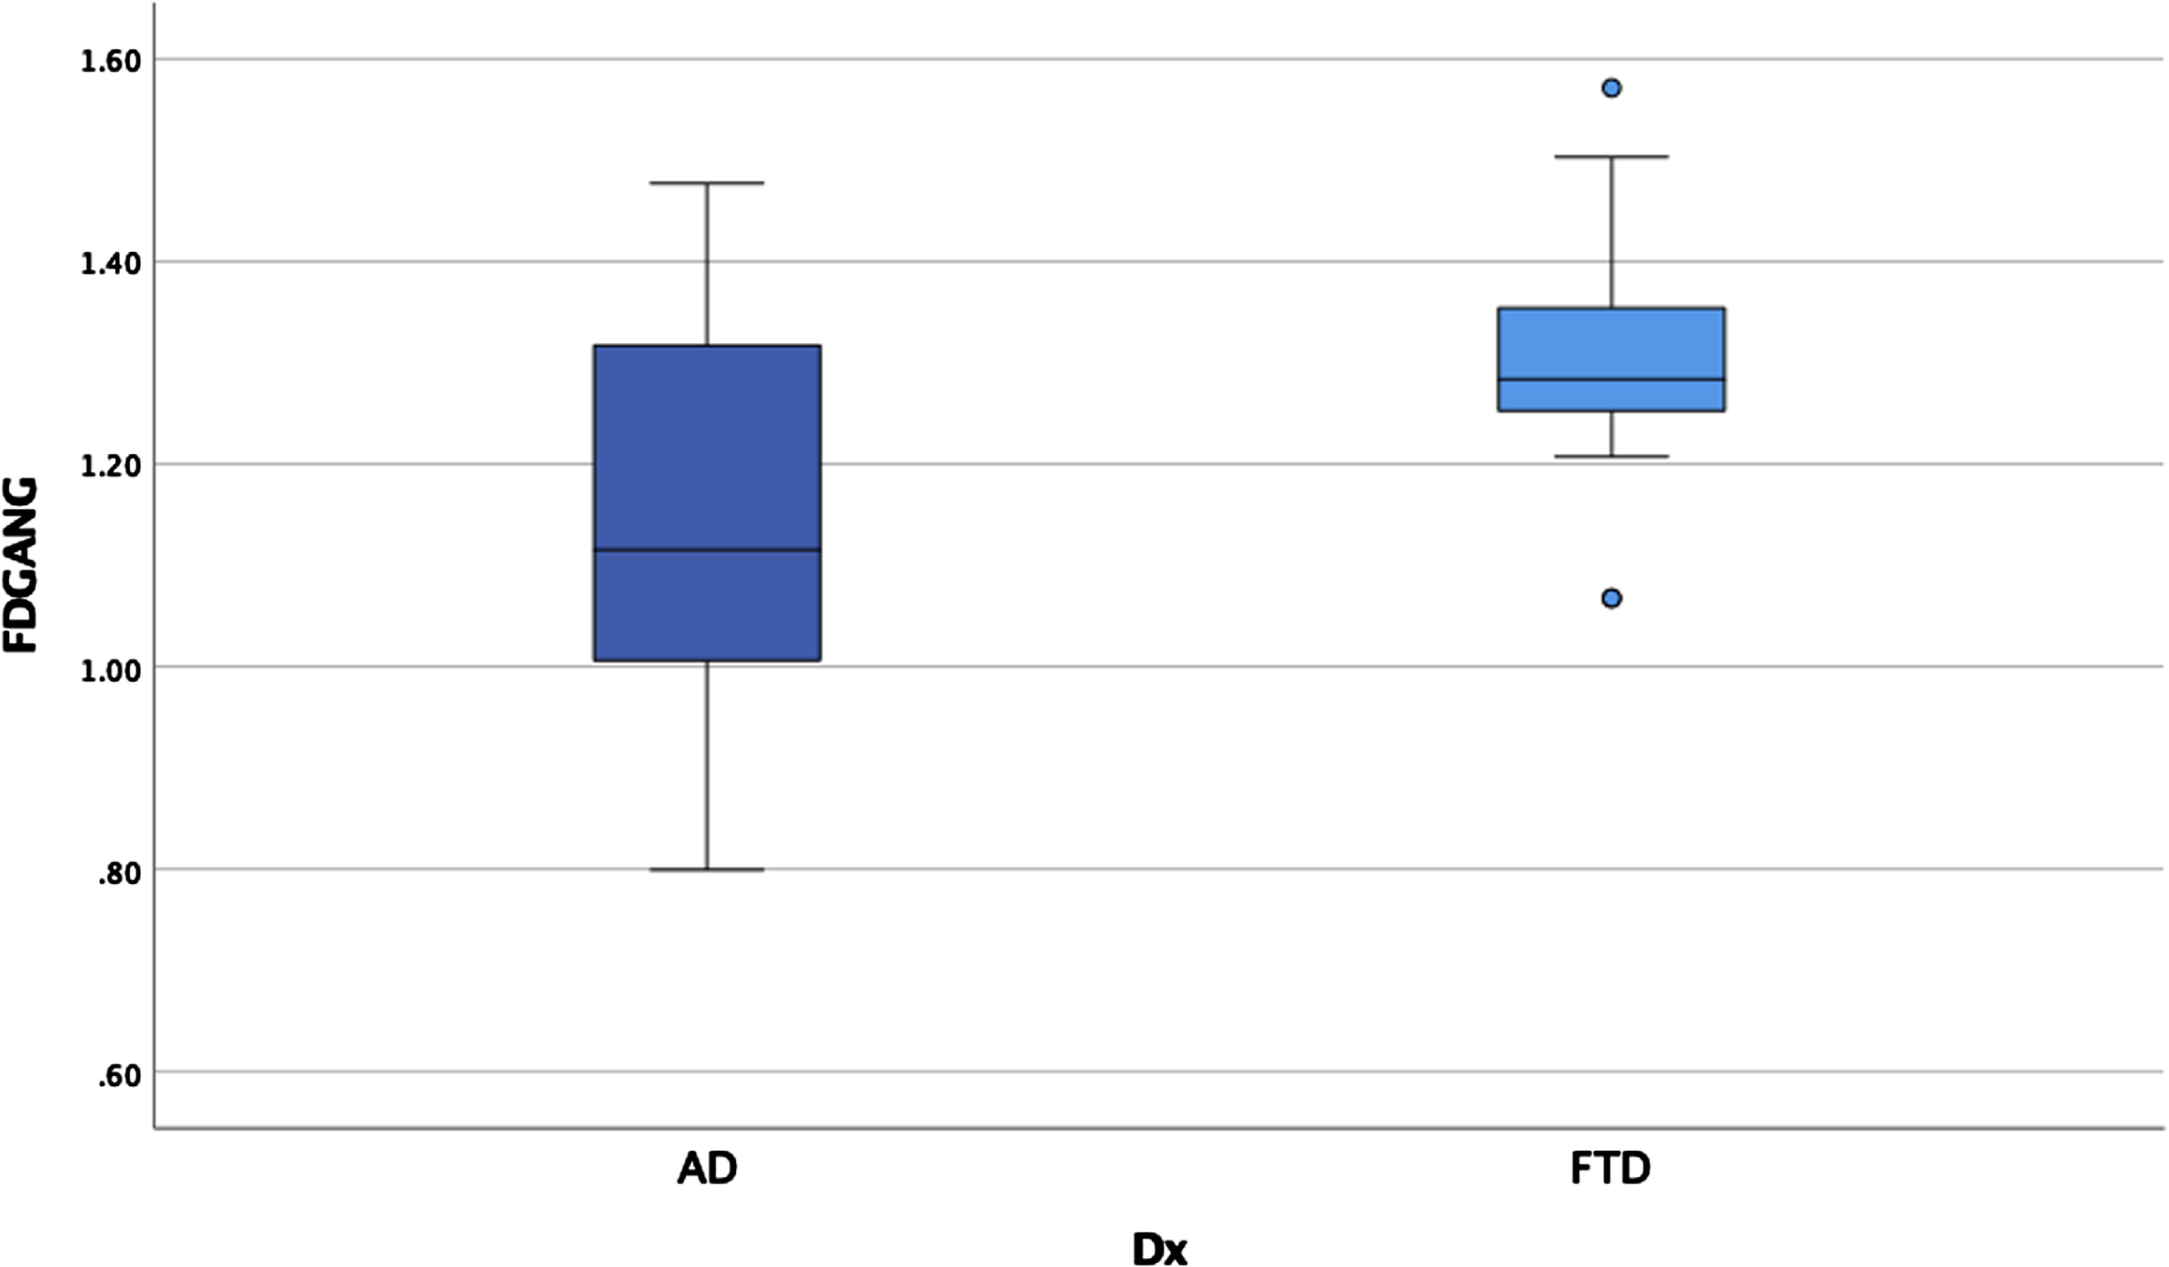
Table 5
Cortical thickness and glucose metabolism by group
| Cortical thicknessa | |||||
| Area | AD n = 79 | FTD n = 57 | HC n = 39 | F | Eta2 |
| Mean (SD) | Mean (SD) | Mean (SD) | |||
| Middle temporal gyrus | 2.5 (0.2) | 2.5 (0.2) | 2.7 (0.1) | 5.6 | 0.06 |
| Inferior temporal gyrus | 2.5 (0.2) | 2.4 (0.2) | 2.6 (0.1) | 8.7 | 0.09 |
| Temporal pole*c | 3.3 (0.4) | 3.1 (0.5) | 3.5 (0.3) | 13.1 | 0.13 |
| Anterior cingulate*d | 2.4 (0.1) | 2.4 (0.1) | 2.5 (0.1) | 14.8 | 0.15 |
| Insula*c | 3.0 (0.2) | 2.9 (0.3) | 3.1 (0.2) | 10.6 | 0.11 |
| Middle frontal gyrus | 2.3 (0.2) | 2.3 (0.2) | 2.4 (0.1) | 5.1 | 0.06 |
| Superior frontal gyrus | 2.5 (0.2) | 2.4 (0.2) | 2.6 (0.1) | 5.5 | 0.06 |
| Precuneus | 2.2 (0.2) | 2.2 (0.1) | 2.3 (0.1) | 7.0 | 0.08 |
| Superior parietal lobule | 2.0 (0.2) | 2.1 (0.1) | 2.2 (0.1) | 6.1 | 0.07 |
| Supramarginal gyrus*d | 2.3 (0.2) | 2.3 (0.1) | 2.4 (0.1) | 9.8 | 0.10 |
| Angular gyrus*e | 2.2 (0.2) | 2.3 (0.1) | 2.4 (0.1) | 10.1 | 0.10 |
| FDGb | |||||
| Area | AD n = 20 | FTD n = 30 | F | Eta2 | |
| Mean (SD) | Mean (SD) | ||||
| Middle temporal gyrus | 1.1 (0.1) | 1.2 (0.1) | 2.9 | 0.06 | |
| Inferior temporal gyrus | 1.1 (0.1) | 1.1 (0.2) | 0.8 | 0.02 | |
| Temporal pole | 0.9 (0.1) | 1.0 (0.2) | 2.1 | 0.04 | |
| Anterior cingulate gyrus | 1.1 (0.1) | 1.1 (0.1) | 0.0 | 0.00 | |
| Insula | 1.1 (0.1) | 1.1 (0.1) | 0.0 | 0.00 | |
| Middle frontal gyrus | 1.3 (0.1) | 1.3 (0.1) | 0.3 | 0.00 | |
| Superior frontal gyrus | 1.2 (0.1) | 1.3 (0.1) | 1.3 | 0.03 | |
| Precuneus | 1.2 (0.1) | 1.4 (0.1) | 8.0 | 0.14 | |
| Superior parietal lobule | 1.1 (0.1) | 1.2 (0.1) | 8.1 | 0.14 | |
| Supramarginal gyrus | 1.1 (0.2) | 1.3 (0.2) | 6.8 | 0.12 | |
| Angular gyrus* | 1.1 (0.2) | 1.4 (0.2) | 14.0 | 0.23 | |
*Main effects after correcting for multiple comparisons for thickness and metabolism p < 0.00014; covarying scanner type for thickness for each brain region and covarying scanner type and age for thickness of Middle Temporal Gyrus, Middle Frontal Gyrus, and Superior Frontal Gyrus; aThickness is in mm3; bMetabolism is in SUVr, post hoc comparisons by LSD for main effects; cbvFTD < AD < HC; dAD = bvFTD < HC; eAD < bvFTD < HC.
DISCUSSION
In the current study, we aimed to characterize neuropsychological and neuroanatomical correlates of AD relative to bvFTD in a clinically diagnosed sample within an interdisciplinary memory clinic setting. This study is the first we are aware of to contrast AD and bvFTD within the signature regions for both AD [26] and those newly published for bvFTD [30]. All participants with AD had biomarker evidence of amyloid through CSF analysis and/or amyloid PET imaging. Results indicated more similarities than differences between the clinical groups. Consistent with our hypotheses, comparison of performances on measures of a range of memory processes revealed worse performances in patients with AD relative to bvFTD, although both clinical groups performed worse than HCs. In contrast to our hypotheses, performance on executive functioning tasks were lower for both AD and bvFTD relative to HCs, with bvFTD performing worse than AD on TMT-B but not MS or G/NG. Imaging findings paralleled and expanded upon these behavioral similarities and differences. For cortical thickness, participants with AD showed thinner angular gyrus relative to bvFTD and healthy controls, while participants with bvFTD showed thinner insula and temporal poles. This was only partially consistent with our hypotheses, as we did not find thinner cortex in temporal regions in AD or thinner frontal cortex in bvFTD as expected. Finally, partially consistent with expectations, participants with AD showed lower glucose metabolism in the angular gyrus than participants with bvFTD, but the two clinical groups did not differ in frontal or temporal lobe metabolism.
Poorer overall memory performances observed in participants with AD were consistent with our hypotheses and with previous reports [7–10, 18]. Participants with bvFTD showed poorer memory performances than healthy controls but performed better than the AD group for many aspects of memory examined, including short and long delay free recall, false positive errors during recognition, and recognition discriminability. In contrast, the two clinical groups did not differ from each other for initial learning, total words recalled over learning trials, cued recall, and percent retention. Taken together, participants in the AD group showed more indications of consolidation problems as evidenced by worse free recall and discriminability differences on recognition. In our sample, participants with AD also displayed more false positive errors during recognition relative to participants with bvFTD, in contrast with some previous studies [18, 51] but consistent with others [52]. Group differences in memory performances add further support to the known retrieval, storage, and consolidation difficulties associated with AD, but also demonstrate that bvFTD show memory difficulty relative to controls. The poorer performances for many aspects of memory were observed in the AD group despite similar levels of cortical thickness and hypometabolism in multiple temporal lobe regions for clinical groups. This may be a function of the complexity of larger scale interactions between multiple brain regions involved in memory functions [6, 53].
For executive functioning measures, participants with AD and bvFTD performed worse than HC for all three measures, but the hypothesized group differences were only observed for TMT-B with worse performance in bvFTD relative to AD. We did not observe performance differences between the clinical groups for MS or G/NG. These findings were observed in the context of mixed literature, with some existing research indicating greater executive dysfunction in bvFTD compared to AD [9, 14] and other findings suggesting that executive functioning tasks discriminate poorly between these diseases [16, 17]. The absence of group differences in bvFTD versus AD for MS and G/NG specifically has been supported by a prior study [16]. As executive functions are complex and can be assessed by a wide range of tasks [54], replication and extension of these findings are needed with a broader range of tests. It is also possible that differences as a function of disease stage may occur, such that earlier in the course of FTD, they may show more executive functioning deficits relative to earlier in the course of typical AD. Future studies examining large samples of mildly affected participants will be beneficial to further clarify differences across disease stages, as our sample was not adequately powered to separately examine MCI and dementia.
MRI results revealed cortical thinning in both bvFTD and AD in multiple signature regions compared to HCs. Thinner insula and temporal poles were specific to the bvFTD group and thinner angular gyrus was specific to the AD group. These findings are partially consistent with expectations and prior research published on signature areas for AD [26], and more recently, bvFTD [30]. While there are multiple overlapping signature areas proposed between these two diseases, the insula and anterior cingulate have been suggested to be unique to bvFTD and parietal regions specific to AD. The temporal poles, rather than the anterior cingulate, unexpectedly showed thinning in bvFTD relative to AD in our sample despite the temporal pole being a proposed overlapping signature area. Nonetheless, temporal lobe-mediated cognitive functions (e.g., memory) were more impaired in the AD group in our sample and as such, it is possible that greater disruption to temporal lobe function exists in AD through other complex connections. While not all signature regions in the parietal cortex were thinner in AD relative to bvFTD, we did observe thinner cortex in the angular gyrus. We did not observe hypothesized differences in cortical thickness in the frontal signature regions independent of the insula. Consistent with cortical thickness findings, glucose metabolism findings demonstrated hypometabolism in the angular gyrus in AD relative to bvFTD without significant differences observed for frontal or temporal lobes. In other words, participants with bvFTD showed the expected pattern of cortical thinning and hypometabolism in the frontal and temporal lobes but findings for those regions were unexpectedly not different from the AD group. Cortical thickness and glucose metabolism findings were consistent with prior reports suggesting that neurodegeneration is more diffuse in AD (e.g., impacting both anterior and posterior brain regions) and more localized to frontal and temporal lobes in FTD than posterior regions [23, 24]. These findings add to a growing body of literature highlighting the importance of considering the prevalence of frontal dysfunction in AD [5, 6]. Interestingly, both memory and executive functioning showed diffuse correlations with cortical thickness in multiple signature brain regions, although learning and recall correlations were stronger and more diffuse. These widespread correlations have been reported by others [55, 56] and support the diffuse nature of both disease processes.
Taken together, our results suggest that AD and bvFTD may be more similar than different with respect to cognitive and neuroimaging correlates, especially for frontal regions and aspects of temporal regions. These diseases have been historically conceptualized as clinically distinct, especially in the earlier stages prior to advanced disease progression. However, previous literature highlighting neuropsychological and neuroimaging differences between AD and bvFTD are highly mixed, likely for a variety of reasons. The recent development of signature regions specific to AD and bvFTD involving widespread cortical regions highlight the growing interest and understanding that these diseases are complex and diffuse with significant overlap. We are the first we are aware of to examine these signature regions for both diseases, and our findings indicate that while there were key differences between AD and bvFTD, there were more similarities in cognitive performances and neuroimaging variables. These similarities were observed in a sample whose symptoms were generally mild (with included participants ranging from MCI to mild dementia), when clinical differences representing distinct pathology are thought to be most prominent. While mixed pathology must be considered as a possible contributor and is supported by autopsy studies as common [57], the role of potential shared mechanisms and widespread network dysfunction impacted by both diseases should also be considered [58, 59].
This study is not without limitations. Our sample was clinically diagnosed, and while the AD group was biomarker-defined, we did not have pathology-based biomarker data to further confirm the specificity of the diagnosis for the bvFTD group. Nonetheless, twenty-five percent of participants with bvFTD had additional biomarker data available (CSF or amyloid PET) showing amyloid-negative results, all participants in the bvFTD group had biomarker evidence of frontal and/temporal lobe atrophy on MRI, and nearly half had additional support from FDG PET. Differences in functional status, neuropsychiatric symptoms, and level of caregiver burden also support more behavioral disturbance in the bvFTD group. It is important to note that we examined signature brain areas for AD and bvFTD and as such, there may be existing structural (MRI) or functional/metabolic (FDG) differences between clinical groups for other brain regions not examined. Similarly, it is possible that with greater diversity of measures of executive function, additional group differences may emerge. Perhaps more sensitive and comprehensive measures are needed to better differentiate these disease processes. In addition, as this was a clinical sample in which not all participants received all measures examined; the sample had lower numbers of FDG PETs relative to brain MRIs and a lower number of MRIs than cognitive examinations. As imaging measures were used in both diagnostic classification and as variables of interest, imaging comparisons might be considered circular. However, our neuroradiologists visually interpreted brain volume for large areas of cortex, whereas our analyses involved quantitatively processed specific regions of interest that differed from those examined clinically. Some participants in the HC group were seen clinically for subjective cognitive concerns which can represent the earliest signs of a neurodegenerative process in some individuals; however, there was no concern for a neurodegenerative etiology in the included HC participants based on clinical presentation, cognitive evaluation, and neuroimaging findings. The current study was also cross-sectional with MCI and mild dementia participants in both groups, and results may differ at different stages in the disease processes; longitudinal studies may help clarify such patterns. This would be particularly informative to aid in predicting conversion from MCI to dementia and how this differs across etiologies. Our sample was well-educated, and further larger scale studies would be beneficial to investigate the impact of education on these observed relationships and replicate our findings. Finally, our sample was limited with regard to racial diversity and studies with a larger sample of more diverse patients would improve generalizability. Nonetheless, the present study is reflective of a rural Appalachian population which is often understudied despite known health disparities and high rates of risk factors for dementia [60–63].
In conclusion, results of this study are indicative of much overlap in cognitive and neuroimaging correlates of AD and bvFTD in a memory clinic sample. Participants with AD showed worse performances on some aspects of memory along with more cortical thinning and reduced hypometabolism in the angular gyrus relative to bvFTD. Participants with bvFTD showed more thinning in the insula and temporal pole and worse performance on one measure of executive functioning. Cortical thickness and hypometabolism as assessed in this study were otherwise similar in both clinical groups for multiple signature regions. Additional research is needed to further examine the mechanisms behind this overlap in structure and function between these diseases and how these relationships progress longitudinally. By focusing on similarities, it is hoped that advances in one disease may have applicability with the other.
CR
ediT AUTHOR STATEMENT
Cierra M. Keith, PhD (Investigation; Methodology; Writing –original draft; Writing –review & editing); Marc W. Haut, PhD (Conceptualization; Formal analysis; Investigation; Methodology; Writing –original draft; Writing –review & editing); Pierre-François D’Haese, PhD (Data curation; Formal analysis; Software; Writing –review & editing); Rashi I. Mehta, MD (Investigation; Writing –review & editing); Camila Vieira Ligo Teixeira, PhD (Formal analysis; Writing –review & editing); Michelle Coleman (Data curation; Formal analysis; Writing –review & editing); Mark Miller, MD (Investigation; Writing –review & editing); Melanie Ward, MD (Investigation; Writing –review & editing); R. Osvaldo Navia, MD (Investigation; Writing –review & editing); Gary Marano, MD (Investigation; Writing –review & editing); Xiaofei Wang, MD/PhD (Investigation; Writing –review & editing); William T. McCuddy, PhD (Data curation; Writing –review & editing); Katharine Lindberg, PhD (Data curation; Writing –review & editing); Kirk C. Wilhelmsen, MD/PhD (Conceptualization; Investigation; Methodology; Writing –review & editing)
ACKNOWLEDGMENTS
We would like to acknowledge and thank the patients, families, and staff of the Rockefeller Neuroscience Institute Memory Health Clinic as this work would not be possible without them.
FUNDING
The authors have no funding to report.
CONFLICT OF INTEREST
The authors have no conflict of interest to report.
DATA AVAILABILITY
The data analysis supporting the findings of this study are available on request from the corresponding author. The data are not publicly available due to privacy or ethical restrictions.
SUPPLEMENTARY MATERIAL
[1] The supplementary material is available in the electronic version of this article: https://dx.doi.org/10.3233/ADR-230049.
References
[1] | McKhann GM , Knopman DS , Chertkow H , Hyman BT , Jack CR , Kawas CH , Klunk WE , Koroshetz WJ , Manly JJ , Mayeux R , Mohs RC , Morris JC , Rossor MN , Scheltens P , Carrillo MC , Thies B , Weintraub S , Phelps CH ((2011) ) The diagnosis of dementia due to Alzheimer’s disease: Recommendations from the National Institute on Aging-Alzheimer’s Association workgroups on diagnostic guidelines for Alzheimer’s disease, Alzheimers Dement 7: , 263–269. |
[2] | Blennerhassett R , Lillo P , Halliday GM , Hodges JR , Kril JJ ((2014) ) Distribution of pathology in frontal variant Alzheimer’s disease. J Alzheimers Dis 39: , 63–70. |
[3] | Ossenkoppele R , Lyoo CH , Sudre CH , Westen D , Cho H , Ryu YH , Choi JY , Smith R , Strandberg O , Palmqvist S , Westman E , Tsai R , Kramer J , Boxer AL , Gorno-Tempini ML , La Joie R , Miller BL , Rabinovici GD , Hansson O ((2020) ) Distinct tau PET patterns in atrophy-defined subtypes of Alzheimer’s disease. Alzheimers Dement 16: , 335–344. |
[4] | Townley RA , Graff-Radford J , Mantyh WG , Botha H , Polsinelli AJ , Przybelski SA , Machulda MM , Makhlouf AT , Senjem ML , Murray ME , Reichard RR , Savica R , Boeve BF , Drubach DA , Josephs KA , Knopman DS , Lowe VJ , Jack CR Jr , Petersen RC , Jones DT ((2020) ) Progressive dysexecutive syndrome due to Alzheimer’s disease: A description of 55 cases and comparison to other phenotypes, Brain Commun 2: , fcaa068. |
[5] | Guarino A , Favieri F , Boncompagni I , Agostini F , Cantone M , Casagrande M ((2019) ) Executive functions in Alzheimer disease: A systematic review. Front Aging Neurosci 10: , 437. |
[6] | Keith CM , Haut MW , Wilhelmsen K , Mehta RI , Miller M , Navia RO , Ward M , Lindberg K , Coleman M , McCuddy WT , Deib G , Giolzetti A , D’Haese PF ((2023) ) Frontal and temporal lobe correlates of verbal learning and memory in aMCI and suspected Alzheimer’s disease dementia. Neuropsychol Dev Cogn B Aging Neuropsychol Cogn 30: , 923–939. |
[7] | Binetti G , Locascio JJ , Corkin S , Vonsattel JP , Growdon JH ((2000) ) Differences between Pick disease and Alzheimer disease in clinical appearance and rate of cognitive decline. Arch Neurol 57: , 225. |
[8] | Glosser G , Gallo JL , Clark CM , Grossman M ((2002) ) Memory encoding and retrieval in frontotemporal dementia and Alzheimer’s disease. Neuropsychology 16: , 190–196. |
[9] | Pachana NA , Boone KB , Miller BL , Cummings JL , Berman N ((1996) ) Comparison of neuropsychological functioning in Alzheimer’s disease and frontotemporal dementia. J Int Neuropsychol Soc 2: , 505–510. |
[10] | Rascovsky K , Salmon D , Ho G , Galasko D , Peavy G , Hansen L , Thal L ((2002) ) Cognitive profiles differ in autopsy-confirmed frontotemporal dementia and AD. Neurology 58: , 1801–1808. |
[11] | Hutchinson AD , Mathias JL ((2007) ) Neuropsychological deficits in frontotemporal dementia and Alzheimer’s disease: A meta-analytic review. J Neurol Neurosurg Psychiatry 78: , 917–928. |
[12] | Hornberger M , Piguet O , Graham AJ , Nestor PJ , Hodges JR ((2010) ) How preserved is episodic memory in behavioral variant frontotemporal dementia? Neurology 74: , 472–479. |
[13] | Graham A , Davies R , Xuereb J , Halliday G , Kril J , Creasey H , Graham K , Hodges J ((2005) ) Pathologically proven frontotemporal dementia presenting with severe amnesia. Brain 128: , 597–605. |
[14] | Walker AJ , Meares S , Sachdev PS , Brodaty H ((2005) ) The differentiation of mild frontotemporal dementia from Alzheimer’s disease and healthy aging by neuropsychological tests. Int Psychogeriatr 17: , 57–68. |
[15] | Collette F , Amieva H , Adam S , Hogge M , Van Der Linden M , Fabrigoule C , Salmon E ((2007) ) Comparison of inhibitory functioning in mild Alzheimer’s disease and frontotemporal dementia. Cortex 43: , 866–874. |
[16] | Gregory CA , Orrell M , Sahakian B , Hodges JR ((1997) ) Can frontotemporal dementia and Alzheimer’s disease be differentiated using a brief battery of tests? Int J Geriatr Psychiatry 12: , 375–383. |
[17] | Nedjam Z , Devouche E , Dalla Barba G ((2004) ) Confabulation, but not executive dysfunction discriminate AD from frontotemporal dementia. Eur J Neurol 11: , 728–733. |
[18] | Mansoor Y , Jastrzab L , Dutt S , Miller BL , Seeley WW , Kramer JH ((2015) ) Memory profiles in pathology or biomarker confirmed Alzheimer disease and frontotemporal dementia. Alzheimer Dis Assoc Disord 29: , 135–140. |
[19] | Devanand DP , Pradhaban G , Liu X , Khandji A , De Santi S , Segal S , Rusinek H , Pelton GH , Honig LS , Mayeux R , Stern Y , Tabert MH , De Leon MJ ((2007) ) Hippocampal and entorhinal atrophy in mild cognitive impairment: Prediction of Alzheimer disease. Neurology 68: , 828–836. |
[20] | Seeley WW , Crawford R , Rascovsky K , Kramer JH , Weiner M , Miller BL , Gorno-Tempini ML ((2008) ) Frontal paralimbic network atrophy in very mild behavioral variant frontotemporal dementia. Arch Neurol 65: , 249–255. |
[21] | De Souza LC , Chupin M , Bertoux M , Lehericy S , Dubois B , Lamari F , Le Ber I , Bottlaender M , Colliot O , Sarazin M ((2013) ) Is hippocampal volume a good marker to differentiate Alzheimer’s disease from frontotemporal dementia? J Alzheimers Dis 36: , 57–66. |
[22] | Regeur L ((2000) ) Increasing loss of brain tissue with increasing dementia: A stereological study of post-mortem brains from elderly females. Eur J Neurol 7: , 47–54. |
[23] | Richards BA , Chertkow H , Singh V , Robillard A , Massoud F , Evans AC , Kabani NJ ((2009) ) Patterns of cortical thinning in Alzheimer’s disease and frontotemporal dementia. Neurobiol Aging 30: , 1626–1636. |
[24] | Möller C , Hafkemeijer A , Pijnenburg YA , Rombouts SA , van der Grond J , Dopper E , van Swieten J , Versteeg A , Steenwijk MD , Barkhof F , Scheltens P , Vrenken H , van der Flier WM ((2016) ) Different patterns of cortical gray matter loss over time in behavioral variant frontotemporal dementia and Alzheimer’s disease. Neurobiol Aging 38: , 21–31. |
[25] | Perez SD , Phillips JS , Norise C , Kinney NG , Vaddi P , Halpin A , Rascovsky K , Irwin DJ , McMillan CT , Xie L , Wisse LEM , Yushkevich PA , Kallogjeri D , Grossman M , Cousins KAQ ((2022) ) Neuropsychological and neuroanatomical features of patients with behavioral/dysexecutive variant Alzheimer’s disease (AD): A comparison to behavioral variant frontotemporal dementia and amnestic AD groups. J Alzheimers Dis 89: , 641–658. |
[26] | Dickerson BC , Bakkour A , Salat DH , Feczko E , Pacheco J , Greve DN , Grodstein F , Wright CI , Blacker D , Rosas HD , Sperling RA , Atri A , Growdon JH , Hyman BT , Morris JC , Fischl B , Buckner RL ((2009) ) The cortical signature of Alzheimer’s disease: Regionally specific cortical thinning relates to symptom severity in very mild to mild AD dementia and is detectable in asymptomatic amyloid-positive individuals. Cereb Cortex 19: , 497–510. |
[27] | Busovaca E , Zimmerman ME , Meier IB , Griffith EY , Grieve SM , Korgaonkar MS , Williams LM , Brickman AM ((2016) ) Is the Alzheimer’s disease cortical thickness signature a biological marker for memory? Brain Imaging Behav 10: , 517–523. |
[28] | Bakkour A , Morris JC , Dickerson BC ((2009) ) The cortical signature of prodromal AD: Regional thinning predicts mild AD dementia. Neurology 72: , 1048–1055. |
[29] | Dickerson BC , Stoub TR , Shah RC , Sperling RA , Killiany RJ , Albert MS , Hyman BT , Blacker D , Detoledo-Morrell L ((2011) ) Alzheimer-signature MRI biomarker predicts AD dementia in cognitively normal adults. Neurology 76: , 1395–1402. |
[30] | Eldaief MC , Brickhouse M , Katsumi Y , Rosen H , Carvalho N , Touroutoglou A , Dickerson BC ((2023) ) Atrophy in behavioural variant frontotemporal dementia spans multiple large-scale prefrontal and temporal networks. Brain 146: , 4476–4485. |
[31] | Foster NL , Heidebrink JL , Clark CM , Jagust WJ , Arnold SE , Barbas NR , DeCarli CS , Scott Turner R , Koeppe RA , Higdon R , Minoshima S ((2007) ) FDG-PET improves accuracy in distinguishing frontotemporal dementia and Alzheimer’s disease. Brain 130: , 2616–2635. |
[32] | Mosconi L , Tsui WH , Herholz K , Pupi A , Drzezga A , Lucignani G , Reiman EM , Holthoff V , Kalbe E , Sorbi S , Diehl-Schmid J , Perneczky R , Clerici F , Caselli R , Beuthien-Baumann B , Kurz A , Minoshima S , De Leon MJ ((2008) ) Multicenter standardized 18F-FDG PET diagnosis of mild cognitive impairment, Alzheimer’s disease, and other dementias. J Nucl Med 49: , 390–398. |
[33] | Fernandez-Matarrubia M , Matías-Guiu JA , Cabrera-Martín MN , Moreno-Ramos T , Valles-Salgado M , Carreras JL , Matías-Guiu J ((2017) ) Episodic memory dysfunction in behavioral variant frontotemporal dementia: A clinical and FDG-PET study. J Alzheimers Dis 57: , 1251–1264. |
[34] | Albert MS , Dekosky ST , Dickson D , Dubois B , Feldman HH , Fox NC , Gamst A , Holtzman DM , Jagust WJ , Petersen RC , Snyder PJ , Carrillo MC , Thies B , Phelps CH ((2011) ) The diagnosis of mild cognitive impairment due to Alzheimer’s disease: Recommendations from the National Institute on Aging-Alzheimer’s Association workgroups on diagnostic guidelines for Alzheimer’s disease. Alzheimers Dement 7: , 270–279. |
[35] | Rascovsky K , Hodges JR , Knopman D , Mendez MF , Kramer JH , Neuhaus J , van Swieten JC , Seelaar H , Dopper EGP , Onyike CU , Hillis AE , Josephs KA , Boeve BF , Kertesz A , Seeley WW , Rankin KP , Johnson JK , Gorno-Tempini M-L , Rosen H , Prioleau-Latham CE , Lee A , Kipps CM , Lillo P , Piguet O , Rohrer JD , Rossor MN , Warren JD , Fox NC , Galasko D , Salmon DP , Black SE , Mesulam M , Weintraub S , Dickerson BC , Diehl-Schmid J , Pasquier F , Deramecourt V , Lebert F , Pijnenburg Y , Chow TW , Manes F , Grafman J , Cappa SF , Freedman M , Grossman M , Miller BL ((2011) ) Sensitivity of revised diagnostic criteria for the behavioural variant of frontotemporal dementia. Brain 134: , 2456–2477. |
[36] | Fazekas F , Chawluk JB , Alavi A , Hurtig HI , Zimmerman RA ((1987) ) MR signal abnormalities at 1.5 T in Alzheimer’s dementia and normal aging. Am J Neuroradiol 8: , 421–426. |
[37] | Delis DC , Kramer JH , Kaplan E , Ober BA (2000) California verbal learning test. APA PsycTests. |
[38] | Keifer E , Haut MW (2014) Neurobehavioral examination. In Clinical neuropsychology: A pocket handbook for assessment, 3rd ed. American Psychological Association, Washington, DC, US, pp. 31-52. |
[39] | Folstein MF , Folstein SE , McHugh PR ((1975) ) “Mini-mental state”: A practical method for grading the cognitive state of patients for the clinician. J Psychiatr Res 12: , 189–198. |
[40] | Wilkinson G , Robertson G (2006) Wide Range Achievement Test 4 (WRAT4). Psychological Assessment Resources, Lutz, FL. |
[41] | Pfeffer RI , Kurosaki TT , Harrah CH Jr , Chance JM , Filos S ((1982) ) Measurement of functional activities in older adults in the community. J Gerontol 37: , 323–329. |
[42] | Cummings JL , Mega M , Gray K , Rosenberg-Thompson S , Carusi DA , Gornbein J ((1994) ) The Neuropsychiatric Inventory: Comprehensive assessment of psychopathology in dementia. Neurology 44: , 2308–2308. |
[43] | Kaufer DI , Cummings JL , Ketchel P , Smith V , Macmillan A , Shelley T , Lopez OL , Dekosky ST ((2000) ) Validation of the NPI-Q, a Brief Clinical Form of the Neuropsychiatric Inventory. J Neuropsychiatry Clin Neurosci 12: , 233–239. |
[44] | Bedard M , Molloy DW , Squire L , Dubois S , Lever JA , O’Donnell M ((2001) ) The Zarit Burden Interview: A new short version and screening version. Gerontologist 41: , 652–657. |
[45] | Gaser C , Dahnke R , Thompson PM , Kurth F , Luders E Alzheimer’s Disease Neuroimaging Initiative (2022) CAT–A computational anatomy toolbox for the analysis of structural MRI data. biorxiv, doi: https://doi.org/10.1101/2022.06.11.495736 [Preprint]. Posted November 28, 2023. |
[46] | Destrieux C , Fischl B , Dale A , Halgren E ((2010) ) Automatic parcellation of human cortical gyri and sulci using standard anatomical nomenclature. Neuroimage 53: , 1–15. |
[47] | Schmidt P , Gaser C , Arsic M , Buck D , Förschler A , Berthele A , Hoshi M , Ilg R , Schmid VJ , Zimmer C , Hemmer B , Mühlau M ((2012) ) An automated tool for detection of FLAIR-hyperintense white-matter lesions in multiple sclerosis. Neuroimage 59: , 3774–3783. |
[48] | Heinen R , Steenwijk MD , Barkhof F , Biesbroek JM , van der Flier WM , Kuijf HJ , Prins ND , Vrenken H , Biessels GJ , de Bresser J ((2019) ) Performance of five automated white matter hyperintensity segmentation methods in a multicenter dataset. Sci Rep 9: , 16742. |
[49] | Huo Y , Xu Z , Xiong Y , Aboud K , Parvathaneni P , Bao S , Bermudez C , Resnick SM , Cutting LE , Landman BA ((2019) ) 3D whole brain segmentation using spatially localized atlas network tiles. Neuroimage 194: , 105–119. |
[50] | Lavely WC , Scarfone C , Cevikalp H , Li R , Byrne DW , Cmelak AJ , Dawant B , Price RR , Hallahan DE , Fitzpatrick JM ((2004) ) Phantom validation of coregistration of PET and CT for image-guided radiotherapy. Med Phys 31: , 1083–1092. |
[51] | Donnelly J , Jurik J , Kramer J , Miller B ((2000) ) Rate of forgetting, intrusions and recognition in Alzheimer’s and frontotemporal dementia as indexed by the CVLT-Short Form. Arch Clin Neuropsychol 15: , 708–708. |
[52] | Pasquier F , Grymonprez L , Lebert F , Van der Linden M ((2001) ) Memory impairment differs in frontotemporal dementia and Alzheimer’s disease. Neurocase 7: , 161–171. |
[53] | Ketz NA , Jensen O , O’Reilly RC ((2015) ) Thalamic pathways underlying prefrontal cortex–medial temporal lobe oscillatory interactions. Trends Neurosci 38: , 3–12. |
[54] | Suchy Y ((2009) ) Executive functioning: Overview, assessment, and research issues for non-neuropsychologists. Ann Behav Med 37: , 106–116. |
[55] | Nho K , Risacher SL , Crane PK , Decarli C , Glymour MM , Habeck C , Kim S , Lee GJ , Mormino E , Mukherjee S , Shen L , West JD , Saykin AJ ((2012) ) Voxel and surface-based topography of memory and executive deficits in mild cognitive impairment and Alzheimer’s disease. Brain Imaging Behav 6: , 551–567. |
[56] | Coleman MM , Keith CM , Wilhelmsen K , Mehta RI , Vieira Ligo Teixeira C , Miller M , Ward M , Navia RO , McCuddy WT , D’Haese PF , Haut MW ((2023) ) Surface-based correlates of cognition along the Alzheimer’s continuum in a memory clinic population. Front Neurol 14: , 1214083. |
[57] | Schneider JA , Arvanitakis Z , Bang W , Bennett DA ((2007) ) Mixed brain pathologies account for most dementia cases in community-dwelling older persons. Neurology 69: , 2197–2204. |
[58] | Eggins P , Wong S , Wei G , Hodges JR , Husain M , Piguet O , Irish M , Kumfor F ((2022) ) A shared cognitive and neural basis underpinning cognitive apathy and planning in behavioural-variant frontotemporal dementia and Alzheimer’s disease. Cortex 154: , 241–253. |
[59] | Arneson D , Zhang Y , Yang X , Narayanan M ((2018) ) Shared mechanisms among neurodegenerative diseases: From genetic factors to gene networks. J Genet 97: , 795–806. |
[60] | Apostle EP , O’Connell ME , Vezeau TM ((2011) ) Health disparities of coal miners and coal mining communities: The role of occupational health nurses. AAOHN J 59: , 311–322. |
[61] | DiNapoli EA , Wu B , Scogin F ((2014) ) Social isolation and cognitive function in Appalachian older adults. Res Aging 36: , 161–179. |
[62] | Ho JY , Franco Y ((2022) ) The rising burden of Alzheimer’s disease mortality in rural America. SSM Popul Health 17: , 101052. |
[63] | Wing JJ , Levine DA , Ramamurthy A , Reider C ((2020) ) Alzheimer’s disease and related disorders prevalence differs by Appalachian residence in Ohio. J Alzheimers Dis 76: , 1309–1316. |


