
A Non-Invasive Determination of Ketosis-Induced Elimination of Chronic Daytime Somnolence in a Patient with Late-Stage Dementia (Assessed with Type 3 Diabetes): A Potential Role of Neurogenesis
Abstract
Background:
The study involved a female patient diagnosed with late-stage dementia, with chronic daytime somnolence (CDS) as a prominent symptom.
Objective:
To explore whether her dementia resulted from Type 3 diabetes, and whether it could be reversed through ketosis therapy.
Methods:
A ketogenic diet (KD) generating low-dose 100 μM Blood Ketone Levels (BKL) enhanced by a brief Ketone Mono Ester (KME) regimen with high-dose 2–4 mM BKLs was used.
Results:
Three sets of data describe relief (assessed by % days awake) from CDS: 1) incremental, slow, time-dependent KD plus KME-induced sigmoid curve responses which resulted in partial wakefulness (0–40% in 255 days) and complete wakefulness (40–85% in 50 days); 2) both levels of wakefulness were shown to be permanent; 3) initial permanent relief from CDS with low-dose ketosis from 6.7% to 40% took 87 days. Subsequent low-dose recovery from illness-induced CDS (6.9% to 40%) took 10 days. We deduce that the first restoration involved permanent repair, and the second energized the repaired circuits.
Conclusion:
The results suggest a role for ketosis in the elimination of CDS with the permanent functional restoration of the awake neural circuits of the Sleep-Wake cycle. We discuss whether available evidence supports ketosis-induced bioenergetics alone or whether other mechanisms of functional renewal were the basis for the elimination of CDS. Given evidence for permanent repair, two direct links between ketosis and neurogenesis in the adult mammalian brain are discussed: Ketosis-induced 1) brain-derived neurotrophic factor, resulting in neural progenitor/stem cell proliferation, and 2) mitochondrial bioenergetics-induced stem cell biogenesis.
INTRODUCTION
In neurons, insulin plays an important role in glucose-driven mitochondrial bioenergetics as well as in signal transduction pathways that are necessary for neural progenitor/stem cell proliferation, migration, differentiation, neuronal outgrowth, and plasticity [1]. Type 3 diabetes (T3D) is the result of brain insulin resistance, which has been described as insulin inefficiency, or the inability of insulin and the insulin-like growth factor (IGF-1) to bind functionally to their respective intra membrane receptors, the receptor tyrosine kinases [2, 3]. Insulin resistance is associated with 1) brain glucose hypometabolism which results in decreased bioenergetics in the neurons and 2) defective insulin and IGF signaling within the neurons of the brain, which leads to neuronal dysfunction and cognitive impairment [3–7].
Defects in insulin signaling reduce or eliminate functionality in signal transduction pathways [8, 9] such as the phosphatidylinositol 3-Kinase-Akt (Protein Kinase B) signaling pathway and the Shc-Ras-MAPK pathway, which lead to the disruption of neurogenesis and neuronal differentiation. Intraneuronal signaling by brain-derived neurotrophic factor (BDNF) whose expression is induced by insulin and IGF, is also induced by ketones, e.g., beta-hydroxybutyrate (βHB) which generates similar signaling pathways. BDNF initiates signaling after binding to its own high affinity receptor tyrosine kinase B [10–12].
Abnormal insulin production leads to synapse malfunction and acetylcholine deficiency and has been shown to be a significant factor in the etiology of neurodegenerative diseases such as Alzheimer’s disease (AD) [13–17]. Defects in mitochondrial energy production have also been shown to contribute to the pathophysiology of AD, Parkinson’s disease, and Huntington’s disease [13,18)] and defective signaling is known to be a causative factor for AD [9,20].
The term T3D was originally coined in 2005 by Suzanne de la Monte [3–6, 10, 20], who linked the concept of T3D to brain insulin resistance and sporadic AD; much support for this concept has subsequently been reported [19, 21–33]. The concept of brain-restricted insulin resistance had also been explored in earlier work [34–37].
Ketosis therapy in which ketones (βHB or acetoacetate) promote mitochondrial bioenergetics, neurogenesis, and intraneuronal signaling, [12, 38–41] has been proposed and/or demonstrated experimentally, as a possible viable treatment for sporadic AD and Parkinson’s disease [13, 42–54].
The clinical basis for the etiology of most neurodegenerative diseases has been described as chronic inflammation of the brain [55], and the neuroprotective and anti-inflammatory properties of ketones have been identified as possible factors in reversing, preventing, or delaying the onset of neurodegenerative diseases [55–58]. VanItallie [59] described chronic inflammation which precedes these diseases as the result of the over-reaction of microglia to intracellular oligomeric forms of amyloid-β protein and proposed that the anti-inflammatory properties of βHB, which have also been described in recent reviews [12, 39, 40, and 60, 61], could serve a prophylactic function. Thus, ketones, e.g., βHB, both in ancillary and default capacities not only replicate the functions of both glucose and insulin but make an additional anti-inflammatory contribution to brain health. We wished to explore whether this patient’s dementia could be the result of T3D, and whether it could be reversed through ketosis therapy. We will explore evidence that the ketosis-induced, complete elimination of daytime somnolence in this patient could be due hypothetically, to both ketosis-induced neurogenesis and increased mitochondrial bioenergetics, which would lend support to the hypothesis that the patient’s dementia, caused by energy-deficient neurons, is related to T3D.
MATERIALS AND METHODS
Background description as a basis for the methodology
The female patient was described at age 59, as suffering from atypical mild cognitive impairment in a neuropsychological report in October of 2003 that ruled out early onset AD. Genetic testing showed the normal sequence for alleles of both Presenilin 1 and 2 genes, mutations of which have about a 10% probability of association with early-onset AD [62]. She was, however, heterozygous (epsilon3/4) for the APOE gene, a strong predictor of late-onset AD [63, 64]. An 18Fluorodeoxyglucose positron emission tomography (FDG-PET) scan in that same year, whose findings were described as being most compatible with AD, showed inefficient uptake of FDG in the bilateral posterior parietal and temporal lobes, with a notable sparing of the sensorimotor cortex. These early FDG-PET results did not show reduced uptake in the prefrontal cortex, posterior cingulate, entorhinal cortex, or hippocampus which are important precursors or initiators of early-onset AD [13, 46, 65, 67]. These results were inconclusive in ruling in or out an AD diagnosis.
Comparative magnetic resonance imaging (MRI) of the head in 2003 and 2007 showed a progression from mild to moderate cortical atrophy. A putative determination of T3D was hypothesized in 2013 by the patient’s primary care physician but has never been definitively confirmed. Although a significant increase in alertness which followed a 6-week treatment with coconut oil [68] hinted at T3D as the probable cause of her illness, this treatment was aborted in February 2015, following an attack of cholecystitis and a subsequent cholecystectomy.
Computerized axial tomography (CAT) scans in January of 2016 and October of 2018 showed global atrophy of the sulci, ventricles, and basal cisterns of the cerebral cortex. Consistent in all four images and scans was the absence of any large territorial infarct, intracranial hemorrhage, extra axial collection, or any mass effect. While there was no evidence for acute ischemia in the MRIs, the 2016 CAT scan showed mild periventricular white matter hypoattenuation compatible with chronic microvascular ischemic changes.
In October 2016, the patient’s illness was diagnosed by her primary care physician as late-stage dementia. Her deterioration appears to have been exacerbated by three surgical interventions including a cholecystectomy (2015), periodontal surgery (2016), and percutaneous endoscopic gastrostomy (PEG) tube placement (2016) following accidental but avoidable aspiration during feeding. All of her surgeries required general anesthesia but her condition which had worsened over the preceding 3 years was exacerbated as a result of the two surgeries in 2016 [69]; by that time, she presented with chronic daytime somnolence (CDS), severe cognitive impairment, lethargy, aphasia, head drop syndrome, non-ambulation, loss of gross and fine motor control, and a weakened gag reflex with a resultant tendency for aspiration. Other than these neurological changes, the patient remained in relatively good health, with vital signs and semi-annual comprehensive metabolic panels showing only minor deviations from the norm.
Regimens and treatments
The patient had given her full consent by means of a Health Care Proxy in 2007 for any work directed toward the reversal of her Illness, and the procedures used were in accordance with ethical standards in the revised 2013 edition of the 1975 Helsinki Declaration on human experimentation and Medical Care. All protocols and treatments were developed and supervised by the late Dr. Theodore VanItallie. The placement of the PEG tube required that her primary source of nutrition be provided through enteral feedings of 240 ml of Jevity 1.2 (Abbott Nutrition, Abbot Park, Chicago, IL) four times a day.
An N-MET supplement (a product of Neural Essence LLC, Pawling NY) was introduced into the patient’s enterally fed diet in June of 2016. N-Met is a Neural-Metabolic Enhancement Therapy nutritional supplement for treating neuronal disorders. The acetyl-L-carnitine ingredient in N-MET has been shown to facilitate mitochondrial bioenergetics and fatty acid metabolism [70]. Carnitine is an essential co-factor in cerebral bioenergetics and neuroprotection and has been used successfully in treating chronic neurodegenerative diseases [71]. In situations of caloric restriction, the group of acetyl-carnitine transporters play an important role in fatty acid oxidation/ketogenesis [71, 72]. In addition, acetyl carnitine may also play a role in increasing the availability of acetyl groups for the synthesis of the neurotransmitter acetylcholine [73]. Mitochondrial dysfunctionality may be produced by repeated doses of anesthesia [69] and in a test of whether this was the case and could be counteracted, the patient received 8.0 ml of N-MET twice a day with the morning and evening meals.
The patient was introduced to ketosis therapy in August of 2017. Ketone salts, ketone esters, and a ketogenic diet (KD) were all considered for ketosis therapy. Ketone salts were eliminated from consideration because of the negative risks from high [Na+] in a geriatric patient. Ketone esters were not available at that time, and given the patient’s history of a cholecystectomy, a decision was made to start with a dilute ketogenic breakfast (KB). Ketocal 1 : 4 (KC; 88% fat, a product of Nutricia North America Inc, Gaithersburg, MD) was used in different dilutions with Jevity 1.2 and fed enterally. A NOVA Max Glucose and Ketone monitor (Nova Diabetes Care Inc., Billerica MA) was used for the measurement of glucose and ketone blood Levels during this KD.
A ketone ester which would allow a more precise delivery of the recommended therapeutic dose for ketosis [52] without the need for a high fat diet, was introduced in May 2018. The patient was given the ketone mono ester (KME), D-beta-hydroxybutyrate-R-1,3 butanediol monoester previously known as [(R)-3hydroxy Butyl (R)-3 hydroxy Butyrate] [52] when it became available, from the HVMN Co. (San Francisco CA). The product was granted FDA GRAS (Generally Regarded As Safe) status as a supplement for human consumption [74] and was used successfully in reversing the symptoms of a patient with stage 4 AD [52]. The daily dose was 547 mg/kg body weight/day.
Assessment of periods of daytime somnolence and wakefulness
Assessment of the extent of daytime somnolence, was carried out independently by half a dozen Health Care Aides over the 46-month period of this study. The tenures of aides did not overlap during this period. Each was trained independently in the evaluation of the three criteria for describing wakefulness or daytime somnolence viz., completely awake status, completely asleep status, and a “twilight” status, which for these analyses was included in the asleep category. Record keeping sheets were prepared for the aides and their assignment was simply to record the interval of time for each observed status. None of the aides was aware of the reasons for the collection the awake/sleep data nor involved in the analysis of the data; nor were they involved in the enteral feeding of the patient, which was carried out independently by nurses. Nurses were not directly involved in the collection of the awake/sleep data but did supervise the assessment for its accuracy. In addition, the role of the corresponding author was limited to reviewing the collected information with the aides and nurses on a daily basis to ensure its accuracy. The detailed analysis and interpretation of the raw data occurred at approximately 2-3-month intervals. These approaches introduced an aspect of blinding into the collection and analysis of the data.
The principal criterion for the evaluation of wakefulness was the patient’s ability to participate in the Sensory Stimulation Activities provided by the Dementia Specialist who worked in-person with the patient twice a month. These included games such as Match It, Flash Cards, Tactile Numbers, and Great States, among others. The patient was never awakened for these activities. The most important criteria for assessing her sleep-wake status were her alertness and responsiveness seen by positive eye contact, repeated raising of the eyebrows, the movement of her mouth, and the emanation of sounds. The sleep state was always associated with eyes completely shut or the “twilight” state which was one of unresponsiveness and eyelids at least halfway shut.
RESULTS AND DISCUSSION
A graphic (Fig. 1) and tabular chart (Table 1) overview and summary of the effects of ketosis therapy over a 27-month period
Fig. 1
Extent of wakefulness determined by the most stringent of three parameters used in the study (Parameter 2, i.e., percent days awake for≥11 h in a 12 h day, see Table 2). Table 1 and the narrative description in the Results and Discussion section (part I) that describes Table 1, give details of Treatment Modalities (TMs) in Periods A and B (Pretreatment), C, G, and H (ii) (low-dose ketosis, 0.1 mM BKLs), D (high-dose ketosis, 3-4 mM BKLs), and F (endogenous ketosis 0.6 mM BKL). Periods E and H (i) are periods of illness.
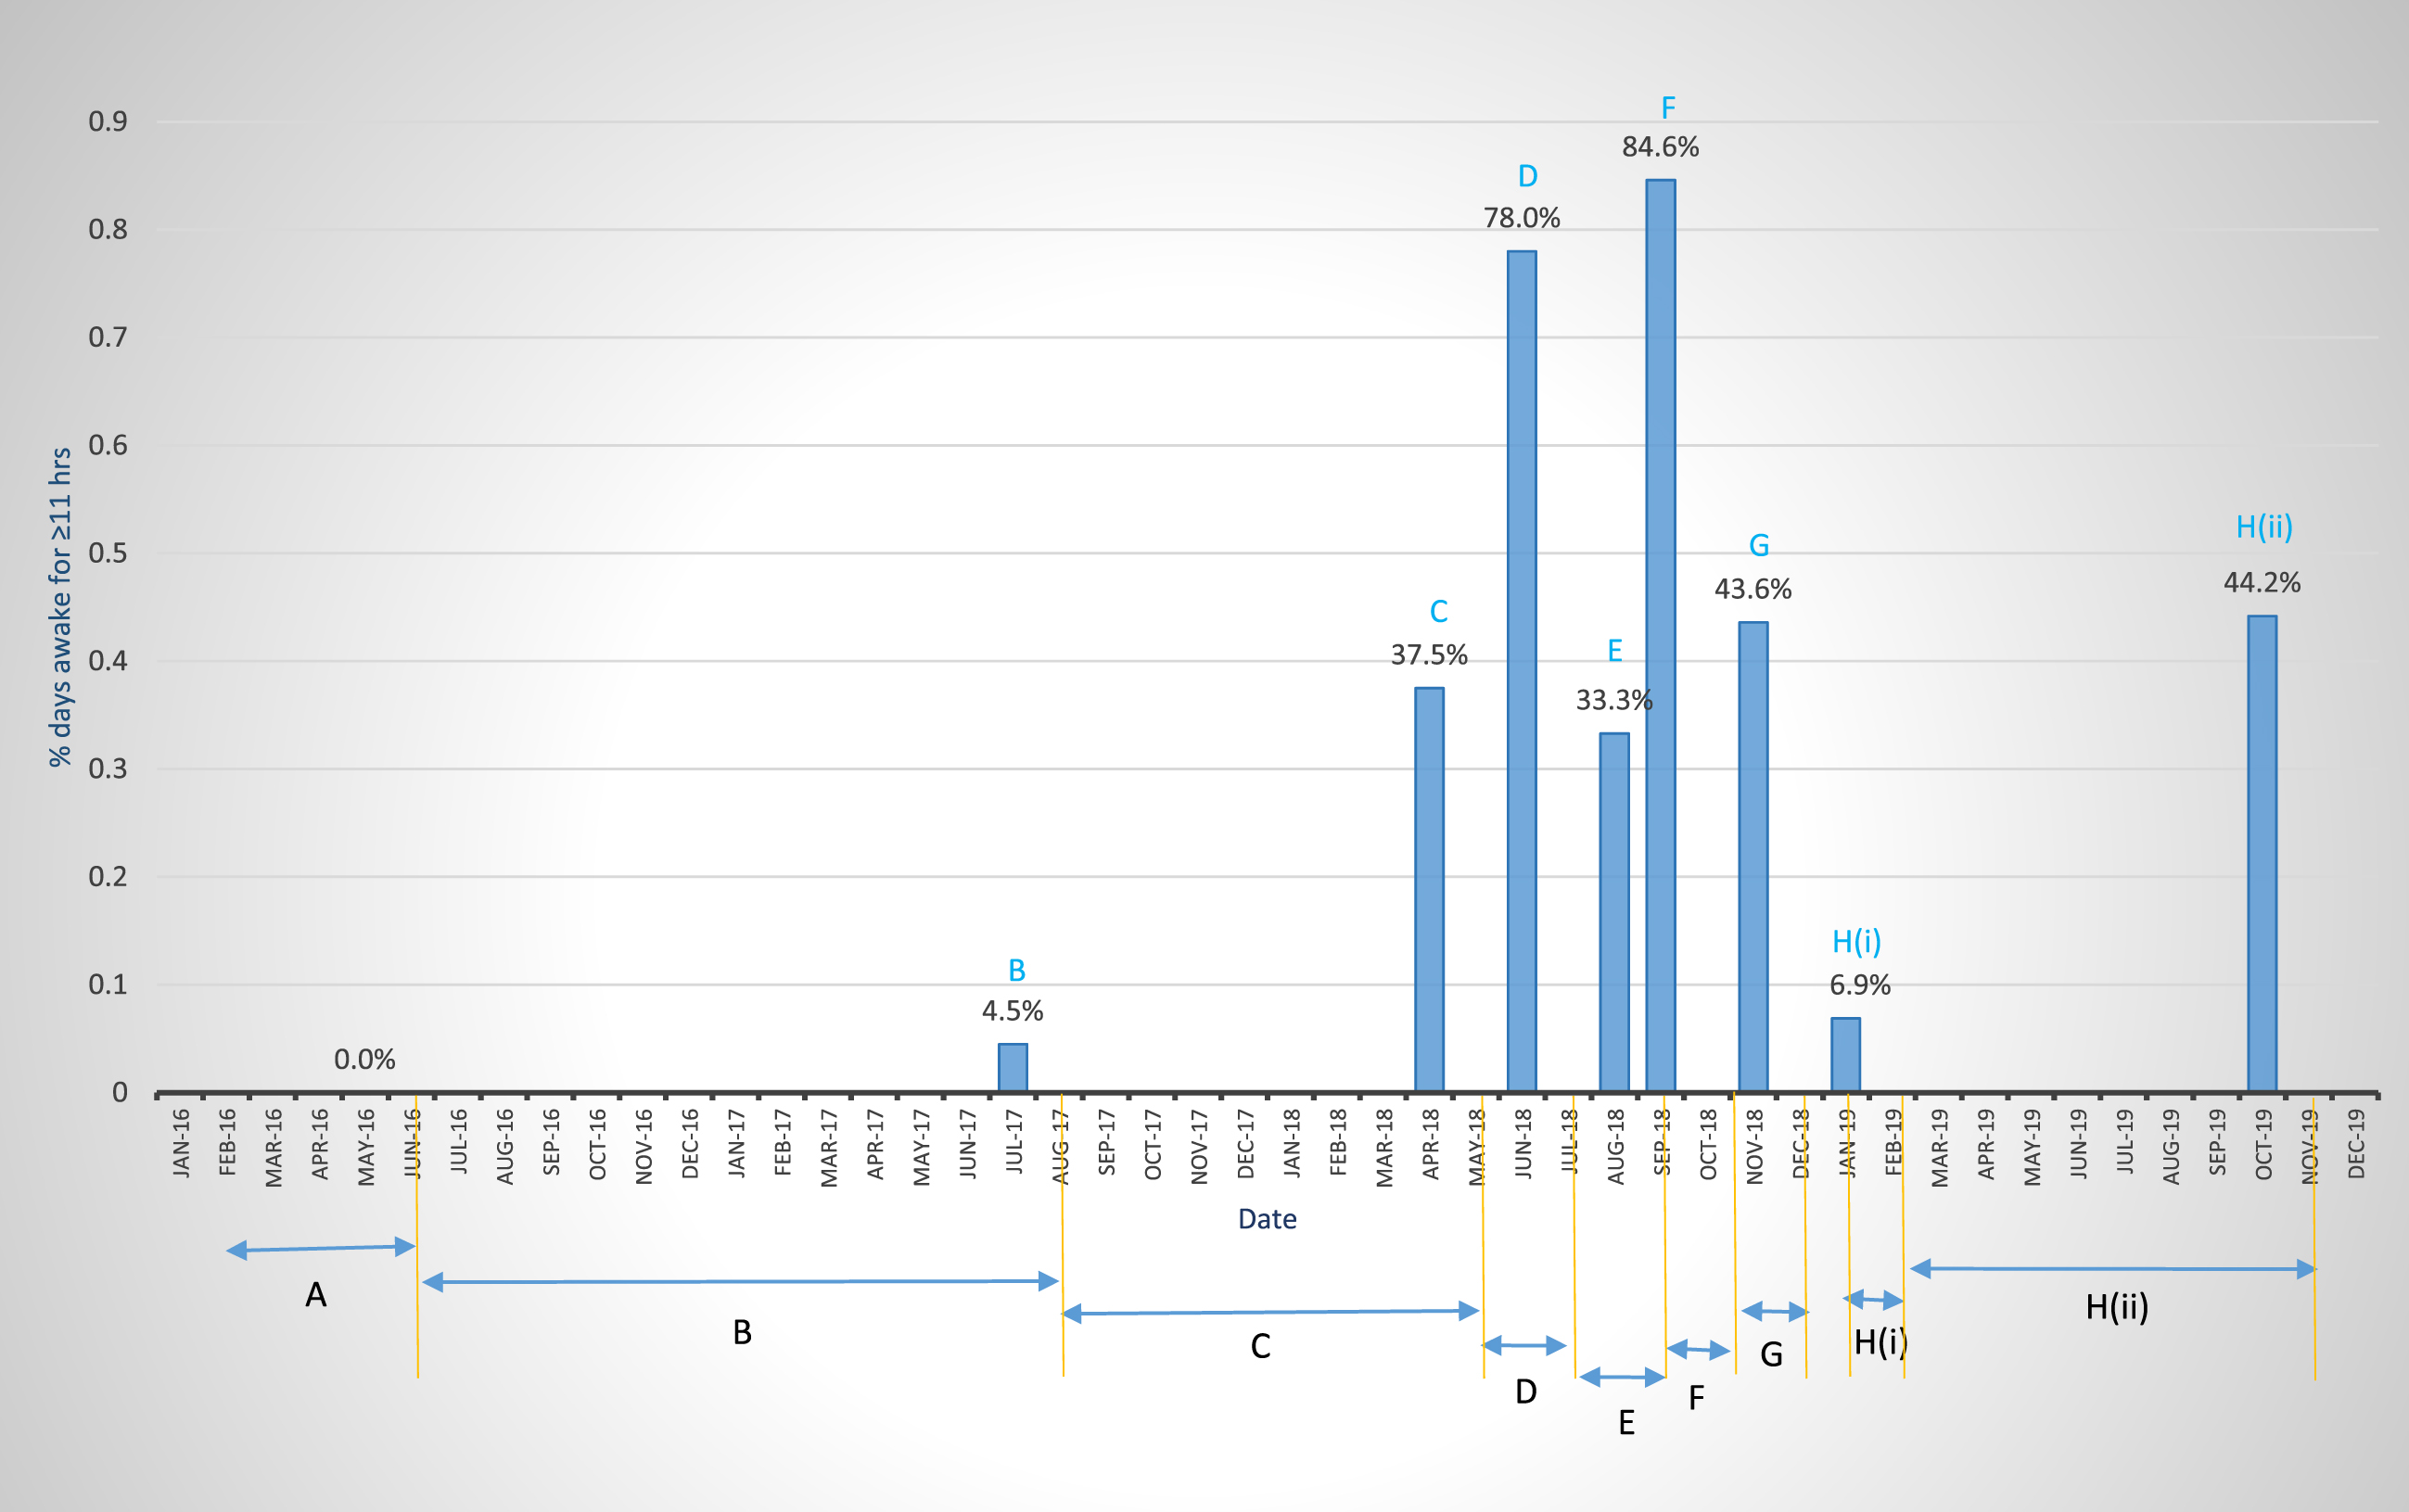
Table 1
Timeline and results of 47 months [Periods C to H(iii)] of ketosis therapy with KD and KME regimens
| Description of ketosis regimens | Date of treatment (M/Y) | Length of treatment (days) | BKLs (mM) | Degree Of Wakefulness: EDW Parameter 2(c) – % days awake for ≥11 h. With comments |
| A. Pretreatment | 2/15/16 – 5/19/16 | 83 | < 0.1 | 0% - Prevalent CDS |
| B. N-MET | 6/23/16 – 8/8/17 | 378 | < 0.1 | 4.5% - No significant relief from CDS |
| C. Low-dose Ketosis therapy (KD) (0.1 mM BKLs) | 8/9/17 – 5/5/18 | 255 | 0.1 | 37.5%*,a - Slow incremental partial relief from CDS from 0.1 BKLs. |
| D. 4-day high-dose ketosis (2.9–3.8 BKLs) | 5/5/18 – 6/26/18 | 50 | 3.8 and 2.9 | 78.0%** - Rapid and complete relief from CDS with therapeutic doses of ketosis (2.9–3.8 BKLs) |
| E. KME-induced gastritis. End of high-dose ketosis. KD continues | 7/2018 – 8/2018 | 11 | 3.3 + 0.1 | 33.3% - gastritis-induced daytime somnolence |
| F. Endogenous ketosis+KD (0.6 mM BKL) | 9/10/18 – 9/25/18 | 16 | 0.6 | 84.6%** - Complete relief from daytime somnolence with moderate-dose (endogenous) ketosis (0.6 mM BKL) |
| G. Low-dose KD | 9/26/18 – 11/21/18 | 55 | 0.2 | 43.6%*,a - Partial low-dose relief from CDS |
| H. Low-dose KD | (i) 1/1/19 – 1/31/19 | 31 | 0.1 | 6.9% - Illness-induced CDS |
| (ii) 2/1/19 – 10/31/19 | 247 | 0.1 | 44.2%*,a - Recovery from CDS | |
| (iii) 7/1/20 – 7/1/21 | 365 | 0–1 | 34.5%*,a - Low-dose maintenance ketosis therapy |
*χ2 = 1.60 with 3 degrees of freedom. Average 40.0%. **χ2 = 0.27 one degree of freedom. Average 81.3%. aPartially restored functionality. Statistically similar peaks from the low-dose ketosis (0.1 mM BKL) regimen in 2018, 2019, 2020, and 2021, recorded up to 38 months apart.
Figure 1 and Table 1 present a timeline, overview, and summary of the results of 1) 19 months of pretreatment (Periods A and B), and 2) 27 months of ketosis treatment consisting of (a) low-dose KD therapy, 0.1 mM BKL [Periods C, G and H (ii)] and (b) high-dose KME therapy 2–4 mM BKLs (Period D), to address the problem of CDS. These graphic and tabular charts are presented to provide a simplified overview of the results of the multifaceted 27-month (8/2017-10/2019) of low-dose and high-dose ketosis treatment as well as maintenance on the low-dose therapy through July 2021 [Table 1 H (iii)].
Pretreatment Periods A and B represent classical examples of CDS in the pre-ketosis treatment phase with B showing a slight improvement from the N-MET regimen.
Periods C-H illustrate the partial (Period C) and complete (Period D) recovery from daytime somnolence, based on the % days awake for≥11 h, as well as the permanent restoration of complete wakefulness (Period F), and of partial wakefulness [Periods G and H (ii)]. These reflect complete and partial neuronal function respectively of the neural circuits of the sleep-wake cycle [75–77]. In Period C (10 months of a KD), low-dose ketosis therapy (BKLs of 100 μM) showed an approximate 10-fold increase in wakefulness over pre-treatment levels and this occurred incrementally from ∼4% to 37.5%. This could represent a phase of partial restoration of neuronal function in the neural components of the awake circuits of the sleep-wake cycle.
The first high-dose ketosis regimen with the KME (Period D) produced a phase of almost complete restoration of daytime wakefulness and the function of the neural system which supports it, with a 2-fold increase in wakefulness over that in Period C (from 37.5% to 78%). An attempt to repeat this regimen was aborted in Period E, following the patient’s severe adverse reaction to the KME, manifested as gastritis, which increased lethargy and daytime somnolence.
A restricted calorie diet imposed in Period F to address the KME-induced gastritis produced endogenous ketosis (BKLs of 600 μM), which resulted in complete wakefulness (84.6%) and thus the complete restoration of function, of the neural networks after illness induced somnolence in Period E. This suggested that the complete restoration of neuronal function first observed at the high level in Period D, was permanent, and its expression was facilitated by the bioenergetics provided by the moderate level-ketosis (0.6 mM BKL). This conclusion of the permanency of the restoration of neuronal function was further supported by the results from the restoration of partial expression of the circuits in Period H (ii) (Fig. 1) and its maintenance in Period H (iii) (Table 1) 39 months after it was first observed in Period C.
Periods H (ii) in 2018-2019 and H (iii) 2020-2021 (Table 1) represent a return to the low-dose (0.1 mM BKL) ketosis regimen of 2018 following illness-induced CDS in Period H (i). The restored levels of wakefulness in Periods G and H (ii) in November 2018 and 2019 (43.6% and 44.2%) and H (iii) July 2020 to July 2021, 34.5% (which are statistically equivalent to that (37.5%) in Period C (May 2018), suggest that this partially restored level of neuronal function first observed in May of 2018, and restored up to 39 months later, was permanent. Given the complete restoration of function in Period F (84.6%), which is statistically equivalent to that in Period D (78.0%) 3 months earlier, we suggest hypothetically that, the observed partial level of expression of the neural circuits in Periods G, H (ii), and H (iii), could be a function of the limited bioenergetics provided by the 0.1 mM BKL.
Description of the pre-treatment status
Chronic daytime somnolence
The extent of CDS is shown in Table 2 by the three parameters which measure percent days awake. These are (a) Parameter 1, which measures arousal and the extent of morning wakefulness, defined by the percentage of days awake for up to 4 h without a nap, after awakening, (b) Parameter 2 (percent days awake for up to and exceeding 11 h) which measures arousal and extended daytime wakefulness (EDW) within the limits of a defined 12 h period, and (c) Parameter 3 (percent days awake for up to and exceeding 90% of the time) also designed to measure EDW from time of awakening to time asleep, without being restricted to a specific time limitation. It is a less stringent measure of wakefulness, in that the calculus is not affected by late arousal times. Two initial treatment modalities (TMs) are described in Table 2: TM-A, an 83-day pretreatment period in which the patient was fed only Jevity 1.2; and TM-B, in which Jevity was supplemented with 8.0 ml of N-MET twice a day. The parameters describe the extent of CDS during TM-A. Parameter 1 was 2.4%, Parameter 2, zero%, and Parameter 3, 1.2%.
Table 2
Ketosis-induced relief from dementia-associated chronic daytime somnolence, during a 12 h waking day
| Treatment Modalities (TM) A-Ha | |||||
| Parameters | # 1 | # 2 | # 3 | ||
| Treatments | Dates | 240 min (c) | ≥11 h (c) | ≥90% (c) | Days/Total # of daysb |
| A. Pretreatment | 2/15/16 – 5/19/16 | 2.4 | 0 | 1.2 | 83 |
| B. N-MET+JV | 6/23/16 – 1/24/17 | 3.1 | 5.7 | 13.7 | 190 |
| C. Low-dose ketosis, Ketogenic Diet-KC: JV 1 : 1 (KD). BKL 100 μM | (i) 8/9/17 – 11/30/17 | 3.2 | 6.3 | 18.9 | 110/110 |
| (ii) 12/1/17 – 1/31/18 | 6.5 | 6.7 | 28.6 | 56/166 | |
| (iii) 2/1/18 – 3/31/18 | 12.5 | 15.8 | 44.4 | 54/220 | |
| (iv) 4/1/18 – 5/5/18 | 37.5 | 37.5 | 77.1 | 35/255 | |
| D. KME regimen cAverage BKL 3.8 mM in May and 2.9 mM to mid-June. Plus, a 1 : 1 KC: JV, KD | 5/6/18 – 6/26/18 | 56.0 d | 78.0 d | 90.0 d | 50/305 |
| E. 11 dose 23-day KME regimene. Average BKL 3.3 mM. KD was also administered in this TM | 6/29/18 – 8/24/18 | 35.7 | 33.3 | 62.5 | 57/362 |
| F. Recovery from gastric distress with a Restricted Calorie diet. BKL 600 μM | (i) 8/25/18 – 9/9/18 | 46.6 | 20.0 | 66.7 | 15/377 |
| (ii) 9/10/18 – 9/25/18 | 53.8 | 84.6 | 84.6 | 16/390 | |
| G. Post KME recovery with the low-dose ketosis KD. BKL 200 μMf | 9/26/18 – 11/21/18 | 67.3 | 43.6 | 83.6 | 55/445 |
| H. Post-KME low-dose ketosis KD. BKL 100 μM | 2/1/19 – 10/1/19 | 34.7 | 44.2 | 97.3 | 273/718 |
aTreatment Modalities are: A, B) Pretreatment and the N-MET treatment protocol respectively; C (i-iv)) low-dose ketosis (100 μM BKL), i.e., a ketogenic diet (KD) in the form of a KC: JV 1 : 1 ketogenic breakfast (KB); D) A 46-day KD period following a 4-day high-dose ketosis (KME) regimen; E) An additional KME regimen during an 11-day period, followed by a 46-day period with gastritis; F) A 31-day recovery period consisting of a restricted caloric diet, with 600 μM endogenous ketosis; G) A 57-day low-dose KD with 200 μM endogenous ketosis; H) A 9-month low-dose ketosis regimen similar to that in TM-C and which produced a statistically similar level of partial wakefulness to that in TM-C (iv) for the two most stringent parameters, 1 and 2. bDays/Total Days, identifies the number of days at the end of each specific Treatment Modality plus the cumulative number of days for all ketosis treatments, i.e., Treatment Modalities C to H. cThe KME regimen ((R)-3-hydroxybutyl (R)-3-hydroxybutyrate [69]) was given from 5/6/18 to 5/9/18 as 547 mg of the KME/kgbw/day with the KB. It was followed from 5/10/18 to 6/28/18, by the mild KB only. dThese parameters, % days awake for 240 min after awakening, % days awake for > 11 h per day, and % days awake for 90% or more of each day, reached their statistically maximum values in the 46-day period after brief exposures to the KME. eThe KME dosage regimens were 195.5 mg/kgbw/day, from 6/29/18-7/4/18 : 7/5/18-7/8/18 and 7/19/18-7/24/18. The average BKL during this TM was 3.3 mM. This TM was associated with a period of KME-induced gastric distress and increased daytime somnolence. fThe 200 μM BKL appears to be the result of the tail-end of the period of endogenous ketosis. The anomaly of a partial response for Parameter 2 (43.6%) and a complete response for Parameter 1 (67.3%) is discussed in Table 3.
Table 3
Percent days awake for Parameters 1, and 2, and for the linked appearancea of the two parameters during the 50-day KME regimen with BKLs of 3.8 and 2.9 mM
| Dates | Real-time analysis in # of days shown | Parameter 2. Percent days awake for ≥11 h | Parameter 2. Percent days awake for ≥240 min | Percent days awake for linked parameters | |
| 1. | 8/9/2017–5/5/2018. KD-only treatment | N/Ab | 37.5 | 37.5 | 20.0 |
| 2. | 5/6/18–5/19/18. Includes KME treatment 5/6–5/9. BKLs 3.8 and 2.9 (See Table 1, TM-D) | 13 | 76.9 | 23.1 | 15.4 |
| 3. | 5/20/18 – 6/20/2018. KD-only continues from 5/10/18, Average BKL 2.0 | 31 | 83.9 | 74.2 | 64.5 |
| 4. | 6/21/18 – 6/26/2018. BKL 100 μM | 6 | 50.0 | 33.3 | 16.7 |
| 5. | 50-day summary: 5/6/18–6/26/2018 | 50 | 78.0 | 56.0 | 44.0 |
aThe linked appearance of the two parameters is the most stringent indicator of complete daytime wakefulness. These data track the progress of wakefulness over a 50-day period, following a 4-day regimen of KME, as described in Treatment Modality D in Table 1. bPeriod 1 (8/9/17 to 5/5/18) is included as a KD-only treatment control (BKL 100 μM).
The role of N-MET
N-MET was introduced into the patient’s diet in June of 2016 initially for 7 months (TM-B) and its role in the partial reduction of daytime somnolence was defined by the restriction of its effect to the less stringent components of all three parameters. We observed significant increases only for the morning wakefulness Parameter 1 (% days awake for≥3 h without a nap, from 14.3% to 62.3%) and the EDW Parameter 2 (percentage of days awake for 9 or more hours, from 12.1% to 60.4%; data not shown), but the most stringent components of these parameters, e.g., % days awake for≥240 min, showed no significant change, from 2.4% to 3.1%, while awake for≥11 h per day, was 4.5% up from 0%. The use of N-MET has remained a part of the treatment to reverse the symptoms of dementia.
Analysis of data from four specific treatment regimens
(i) Effect of a KD (low-dose ketosis; BKL 100 μM) on the reduction of daytime somnolence: Short-term trials
Ketocal 1 : 4 (KD) (the basis for the ketogenic diet with 88% fat) was administered once in the morning diluted with Jevity 1.2 (JV) and fed enterally. Its effect on the reduction of daytime somnolence was immediately evident at the lowest dilution, i.e., 1 : 1, enhancing the results seen with N-MET, with an increase in % days awake for the less stringent component of Parameter 1 (awake for≥3 h) from 62.3% to 75% (data not shown) over a period from day-2 to day-25 of the treatment. No other significant increases were observed for either the most stringent component of Parameter 1 or for any of the components of Parameters 2 or 3, which measure EDW.
Several dilutions of the KC: JV mixture (2 : 1, 3 : 1, and 4 : 1) were administered in unsuccessful attempts to improve EDW. The same was true when two or three meals of the 1 : 1 mixture were given during the day. In all cases the morning results with the initial KD (1 : 1 JV: KC) were immediately reversed, probably the result of discomfort due to the patient’s inability, in the absence of a gall bladder, to tolerate the high fat content of these meals.
One explanation for the restriction of reduced somnolence to the morning period, was the low BKL, i.e., < 100 μM (according to the manufacturer’s instructions). Readings were at “low” before and up to 2 h after meals but increased to 100 μM 3 h after the meal and returned to “low” 4 h later. Several other factors appear to be in play. First, those areas of the midbrain, hypothalamus, and cerebral cortex which must be optimally functional to send and respond-to sleep arousal signals [75, 76], clearly possessed suboptimal neuronal function; secondly, given the very low BKLs, there was most likely, limited availability of ketosis for day-long mitochondrial bioenergetics. Thirdly and more importantly, daylong relief from somnolence might be a time-dependent process which could not be completed in 25 days.
(ii) Result of the initial long-term, low-dose ketosis treatment
The 1 : 1 KC: JV KD, was administered for 9 months (August 2017 to May 2018) [Table 2, (Treatment Modality-C (i-iv)]. The data show the time-dependent, incremental nature of the increase in wakefulness and the elimination of CDS for all three parameters. In Table 2 TM-C, we identified for the first time, a significant increase in morning wakefulness for the most stringent component of Parameter 1 (percentage of days awake for≥4 h without a nap) from 3.2% during the first 110 days, to 37.5% at the end of the period. This compares with 2.4% during the 83-day pretreatment period. We also observed for the first time, a significant incremental increase in EDW (Parameter 2). After 166 days without an increase [from 6.3% to 6.7%, Table 2, TM-C (i-ii)], this parameter also rose to 37.5% during an 89-day period on the KD regimen [Table 2, TM-C (iii-iv); graphic and tabular charts (Fig. 1 and Table 1) Period C]. This contrasts with 0% in the 3-month pretreatment period (TM A). Similar time-dependent incremental increases in wakefulness are observed for the less stringent Parameter 3.
(iii) Effect of a brief regimen of high-dose ketosis with KME on daytime somnolence
KME was administered to the patient as a 4-day regimen in May of 2018. For several hours after receiving the KME on the first day, blood ketone levels (BKLs) averaged 3.8 mM and a dramatic change in the patient’s affect was observed. The patient sat up in bed, on her own, for the first time in 2-3 years and her head-drop symptom disappeared. She stayed awake for the entire day. She made eye contact with each person in the room and appeared to be trying to get out of bed. We were unable to repeat this result in the following days, due to a brief period of (3-4 days) discomfort due to gastritis that led to a decision to temporarily terminate this KME regimen, as the probable cause of that illness.
These observations correspond to the prediction by the creator of the KME, that we would know on day-one, the potential, or lack thereof of the long-term restorative therapeutic value of a ketone ester regimen (Veech RL, personal communication). This result also lends support to a T3D hypothesis, by demonstrating that a therapeutic dose of ketones can activate energy (glucose)-starved neurons, within hours, an indication of on-going glucose hypometabolism. We note that this result is unlikely to have occurred if the source of the CDS were vascular dementia, Lewy body dementia, or Creutzfeldt-Jakob disease.
The timeline of changes in wakefulness over 50 days, in response to this four-day high-dose KME regimen are described in Table 3 and summarized in Table 2 (TM-D) and Period D of the graphic and tabular charts (Fig. 1 and Table 1). The most compelling indicator of the complete restoration of daytime wakefulness should come from the responses of Parameters 1 and 2, the most stringent time-limited of the three parameters used. Under the influence of the 3-4 mM BKLs, both parameters 1 and 2 achieved new peaks after 31 days (74.2% and 83.9.0% respectively), that are about twice as high as those described for low-dose ketosis therapy [37.5% each, Table 2 TM-C (iv)].
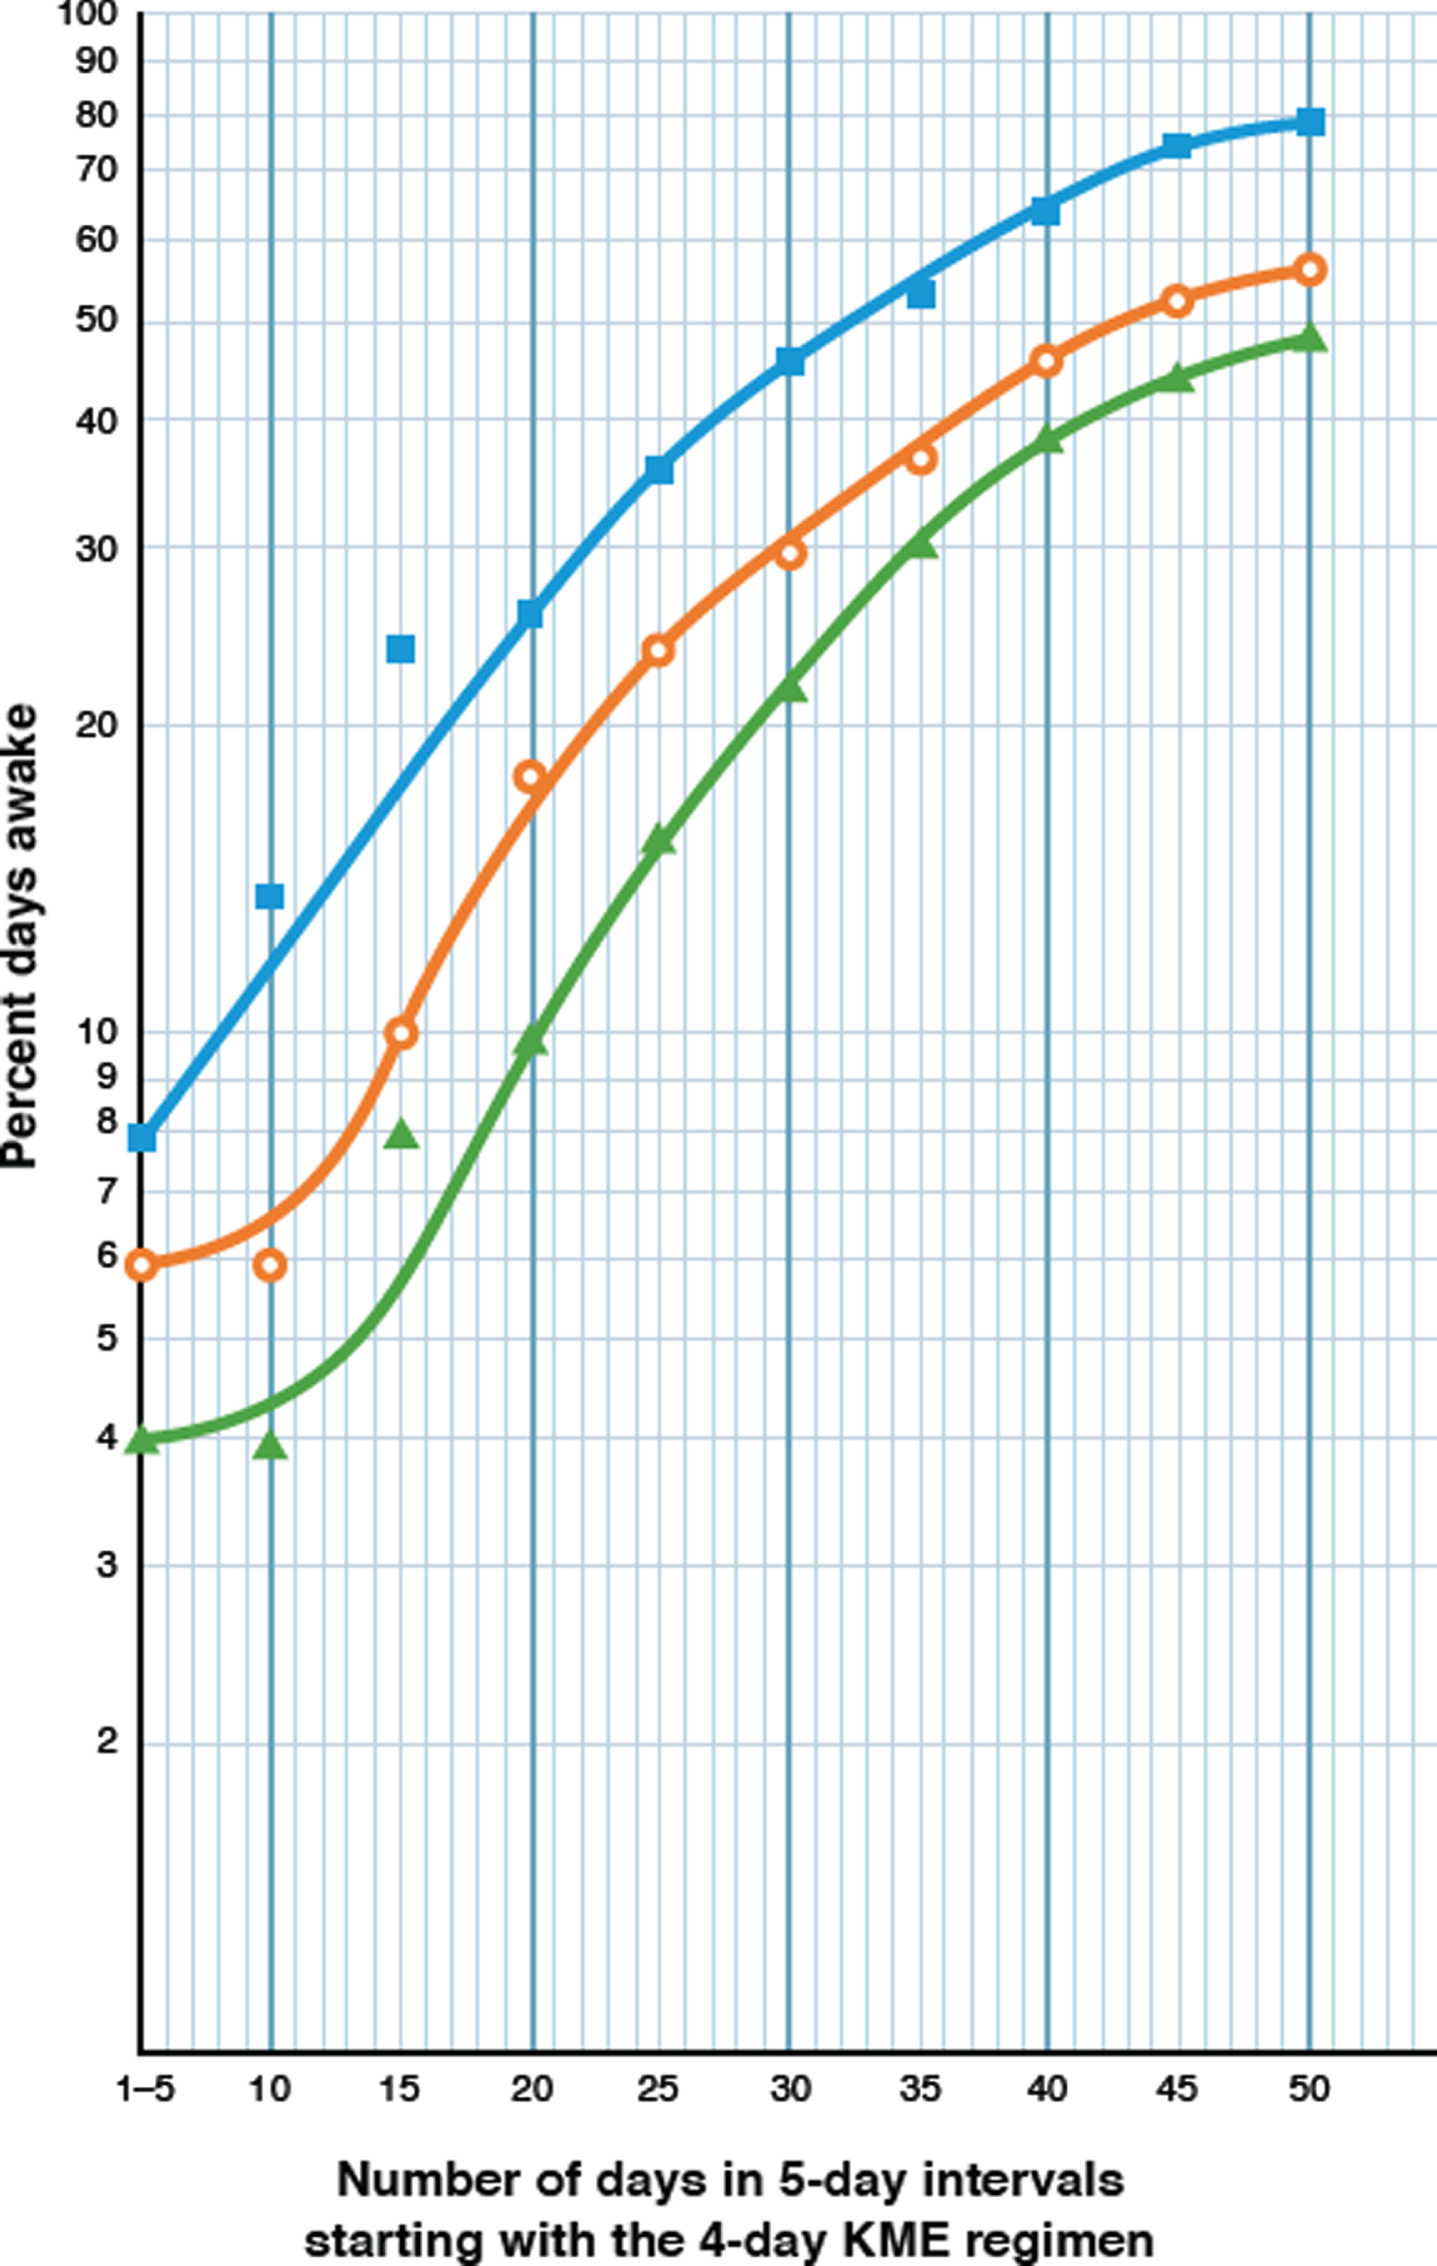
The results in Table 3 were examined from the different perspective of a semilogarithmic analysis in Fig. 2. They indicate that under the 4-day influence of the 3-4 mM BKLs of the KME, the most striking result is the logarithmic increase in the percentage days awake for both parameters over the next 31 days. By definition, a biological logarithmic progression describes the doubling in number of some physical entity at a constant rate over a defined period of time. Since wakefulness is clearly not a physical entity, we propose that the physical basis for wakefulness, i.e., the neurons of the neural circuits which control the wake component of the sleep-wake cycle [75, 76], were the entities which responded to this high-dose ketosis regimen. An additional attempt was made (Table 2, TM-E) to determine whether the observed impact of the KME could be sustained, with an 11-dose KME regimen, 2 months later. BKLs averaging 2.9 mM were recorded. The return to daytime somnolence ostensibly from an adverse reaction to the KME, however, is shown by marked decreases in wakefulness in Parameters 1 and 2. The cause of this was diagnosed as the KME-induced gastritis, and the treatment was permanently aborted. Parameter 2 decreased by 57.5% and Parameter 1 by 36.2%. This association between illness and somnolence was evident on several occasions during the earlier years of the patient’s illness.
Fig. 2
Semi logarithmic plot of a real-time, day-by-day, 50-day analysis of the effect of a 4-day regimen of KME, on the increasing percentages of days awake for Parameters 1 and 2. The KME generated BKLs of 3.0–4.0 mM, averaging 3.8 mM over the first 30 days and 2.0 mM in the last 20 days. The Y axis shows the percentage of days awake for each parameter and the X axis shows the number of days elapsed, starting with the 4-day KME regimen. Each pair of coordinates represent the percent days awake at 5-day intervals. Filled blue squares (□) represent Parameter 2, the percentage of days awake for 11 or more hours; open orange circles (○) represent Parameter 1, the percent days awake for 4 or more hours (≥240 min) without a nap, after awakening; and filled green triangles (Δ) represent the linked appearance of these two parameters.
(iv) The effect of endogenous ketosis on the restoration of daytime wakefulness
Following the confirmation of gastritis, the patient was administered Treatment Modality F (Table 2), which consisted of a restricted calorie diet of 120 ml of Jevity 1.2, once a day, and 240 ml of a clear liquid diet with 23.3 g of sucrose, three times a day, for 31 days (Table 2 TM-F(i)-(ii); 8/25-9/25, 2018), and prescribed a twice daily regimen of Famotidine and Omeprazole. Partial daytime somnolence [TM-F (i)] continued during the first 15 days of this treatment. However, a complete and rapid elimination of daytime somnolence occurred in the following 16 days [Table 2, TM-F(ii) and Period F, graphic and tabular charts (Fig. 1 and Table 1)] more than two months after the original exposure to the KME, in the absence of any exogenous supply of ketones, but with daily BKLs at 600 μM. During the 31-day period on this restricted calorie diet, the patient experienced weight loss from 148.8 lbs. to 140.5 lbs., suggesting that endogenous ketosis [78] may have accounted for the βHB readings of 600 μM. During this period [compare TM-D with TM-F(ii)], the earlier peak of Parameter 1, 56.0%, was restored to 53.8%, and that of Parameter 2, 78.0%, was restored to 84.6%. The percentage of days awake for Parameter 3 was also at 84.6%, similar to its previous peak of 90.2%.
Table 2 TM-F(ii) shows the rapid return to normalcy for Parameter 2 during the endogenous ketosis period with an overall recovery from 20% to 84.6% in 16 days. During the last 10 days of daytime somnolence [August 30 to September 9 this value was 10%, and for the first 10 days of recovery, September 10 to 19 it was 90% (Table 5 Periods 3-4). When we compare this rapid increase to the slow but incremental increase over a 305-day period of the KD/KME regimens to arrive at optimal functionality (78%), complete restoration in 10 days, supports the hypothesis that during the KME regimen in TM-D, the neural circuits in the networks of the mid brain, the hypothalamus, and the cerebral cortex that regulate the wake components of the sleep-wake-cycle [79–82] were restored (repaired) to optimal neuronal functionality during the slow incremental process, but in this case the repaired circuits were energized by the daily 600 μM BKL of endogenous ketosis. This implies that this BKL is sufficient to maintain that new level of complete functionality, by providing appropriate levels of mitochondrial bioenergetics to the circuits. One can therefore extend this reasoning, to conclude that the return to optimal functionality (65 days after the initial restoration) was permanent.
Additional evidence to support the conclusion that the return of the circuits to functionality was at or near completion in TM-D is also found in Table 2, TMs E and F (ii). The second 11-dose KME regimen (TM-E), with BKLs that averaged 3.3 mM, was administered in July after the first KME regimen (TM-D) in May. But percentages of wakefulness for Parameters 1 and 2 produced in response to endogenous ketosis in September (TM-F (ii)), were not statistically greater than those recorded in June (Table 2, TM-D, Parameter 1, 53.8% versus 56.0%; Parameter 2, 84.6% versus 78.0%; χ2 0.4 with one degree of freedom for Parameter 2). This suggests that optimal functionality had been achieved in June and maintained at the same level after the second KME regimen and expressed in the period of endogenous ketosis.
Table 4
Differences in blood ketone levels and distribution of nap frequencies explain the differences in daytime somnolence in 4 analytical periods, as measured by Parameters 1 and 2
| Analytical periods with complete or partial elimination of chronic daytime somnolence, and their sources | % days awake for Parameters 1 and 2/Number of days per analytical period | Frequencies of naps (% of the total number of naps in each interval shown) | |||||
| Total # of naps | Before 11 a.m. | 11 : 00 –1 : 00 | After 1 : 00 p.m. | Frequency of naps per day | Average lengths of naps (min) before and after 11 : 00 am | ||
| 1. 5/20/18 to 6/20/18 (3.8 &2.9 mM BKLs). Table 2, Period 3 | 74.2/83.9 (31 days) | 34 | 16.3 | 18.0 | 65.7 | 1.1 | 6.8/27.3 |
| 2. 9/10/18 to 9/25/18 (600 μM BKL). Table 1, TM-F (ii) | 53.6/84.6 (14 days) | 17 | 25.3 | 11.8 | 62.9 | 1.2 | 17.1/24.2 |
| 3. 9/26/18 to 11/21/18 (200 μM BKL). Table 1, TM-G | 67.2/43.6 (55 days) | 66 | 16.7 | 17.6 | 65.7 | 1.2 | 15.1/76.9 |
| 4. 10/01/19 to 10/31/19 (100 μM BKL). This Table | 33.3/41.2 (30 days) | 39 | 25.0 | 56.5 | 18.5 | 1.3 | 5.8/22.2 |
Table 5
Two cases of rapid recovery from illness-induced CDS. In the first (Periods 2–4, BKL 600 μM), complete function was restored (compare Periods 1b and 4). In the second (Periods 7-8, BKLs 100 μM), partial function was restored (compare Periods 1a and 8). Rapid recoveries (10–16 days) are presumed to be in response to bioenergetics provided to completely repaired neural circuits, by the 600 μM BKL, the lowest level which supports complete function and by low-dose ketosis (100 μM BKLs) which only supports partial function (Periods 1a and 9). Period 5 illustrates these two levels of function as described in the text
| Periods assayed | No. of days | Parameter 1(c) (% days awake ≥4 h in the a.m.) | Parameter 2(c) (% days awake for≥11 h) | Significance |
| 1a. 8/9/17 – 5/5/18. | 255 | 37.5 | 37.5 | Elimination of CDS concomitant with low-dose and high-dose ketosis therapy |
| 1b. 5/6/18 – 6/28/18 Table 2, TMs-C and D. (a) 0.1 (b) 3.8 mM BKLs | 50 | 56.0 | 78.0 | |
| 2a. 6/29/18 – 8/24/18 Table 2, TM-E 3.8 mM | 57 | 35.7 | 33.3 | Gastritis-induced daytime somnolence. Last 10 days |
| 2b. 8/31/18–9/9/18 | 10 | 30.0 | 20.0 | |
| 3. 9/10/18 – 9/20/18 Table 2, TM-F(ii) (600 μM BKL) | 10 | 40.0 | 90.0 | First 10 days of EDW recovery from endogenous ketosis |
| 4. 9/10/18 – 9/25/18 Table 2, TM-F(ii) (600 μM BKL) | 16 | 53.8 | 86.4 | Complete recovery from endogenous ketosis confirmed within 16 days |
| 5. 9/26/18 – 11/21/18 Low-dose ketosis Table 2 TM-G | 55 | 67.3 | 43.6 | Post KME. Tail end of endogenous ketosis 200 μM BKL |
| 6. 11/22/18 – 12/31/18 Low-dose KD ketosis (100 μM BKL). This Table. | 39 | 41.0 | 38.5 | Post-KME return to low-dose ketosis levels of wakefulness |
| 7. 1/1/19 – 1/31/19 Low-dose KD ketosis (100 μM BKL). This Table | 31 | 0.0 | 6.9 | Ulcerative Tinea Pedis-induced illness and CDS |
| 8. 2/1/19 – 2/10/19 Low-dose KD ketosis (100 μM BKL). This Table | 10 | 40.0 | 40.0 | First 10 days of recovery from Ulcerative Tinea Pedis-induced illness |
| 9. 2/1/19 – 10/31/19 Low-dose KD ketosis (100 μM BKL). Table 1 TM-H | 273 | 34.7 | 44.2 | Recovery concomitant with low-dose Ketosis Therapy |
Table 4, Period 3 explains the anomaly in Table 2, TM-G of high values (67.3%) for Parameter 1 (morning wakefulness) and low values (43.6%) for Parameter 2 (EDW) fueled by 200 μM BKL, which occurred at the tail-end of the period of endogenous ketosis. This difference represents a departure from the observed consistent linkage of high or low values for these two parameters (Fig. 1). Low frequencies of mid to late morning naps (16.7%) explain the high percentage of days awake for Parameter 1 (67.3%). However, high probabilities of naps after 1 : 00 p.m. (65.7%), and the high average length of naps after 11 : 00 a.m. (76.9 min) produced low percentages of days awake for Parameter 2 (43.6%).
These results suggest that at 200 μM BKLs, the bioenergetics produced can only sustain optimal morning wakefulness for the first half of the day but are insufficient to sustain EDW at its peak value. They also lend support for the hypothesis of the existence of two functional levels, based on their simultaneous expression in a single assay. More importantly, this result provides evidence for the hypothesis of the complete repair of the neural circuits and that the subsequent level of expression of functionality following illness-induced CDS, is determined by the level of available bioenergetics. (Compare Table 5, Periods 2–4 and 7-8).
Analysis of the elimination of chronic daytime somnolence as a function of time, over an 11-month period
The 31-day logarithmic increases following the initial KME regimen (Fig. 2) for Parameters 1 and 2 suggested that the increases occurred as a result of ketosis-induced restoration of complete or near complete functionality to the neural circuits of the awake components of the sleep wake cycle. We wished to determine whether this result would be borne out with data from the 390-day period of low and therapeutic doses [52] of ketosis therapy (8/9/17-9/25/18) [Table 2, TMs-C (i) to F (ii)].
Data for all parameters (Table 2) were plotted semi logarithmically against time (Fig. 3). The results were classical three-phase sigmoid curves for all three. Parameter 2 showed a lag phase for the first 166 days (∼5.5 months), and most importantly an extensive log phase (4 doublings at a rate of increase of 0.50% per day) which increased its value from 6.7% to 37.5% over the next 89 days during the KD regimen. Treatment with the KME (days 256–259) enhanced the value of 37.5% to 78.0%, at which point the curve transitions to the stationary phase, rising to 84.6% (due to endogenous ketosis) at day 390.
Fig. 3
Semilogarithmic plot showing the increase of daytime wakefulness induced by the low-dose (0.1 mM BKL) ketogenic diet (KD), and two brief treatments of the high-dose (3-4 mM BKLs) KME regimen, as described in Treatment Modalities (TMs) C to G in Table 2. The extent of wakefulness is measured by three parameters as described below. The Y axis shows the percentage of days awake for each parameter and the X axis shows the number of days elapsed for the 390-day treatment period. Each pair of coordinates represents the percent days awake at the end of each TM, as indicated in Table 2. The KD regimen was given throughout and the KME regimens were given on days 256 to 259 and 306–329. Filled green circles (•) represent Parameter 1, the percent days awake for four or more hours (≥240 min) without a nap, after awakening. Open orange circles (○) represent Parameter 2, the percentage of days awake for more than 11 or more hours, and filled blue squares (□) represent Parameter 3, the percentage days awake for 90% or more of the time, from awakening to time asleep.
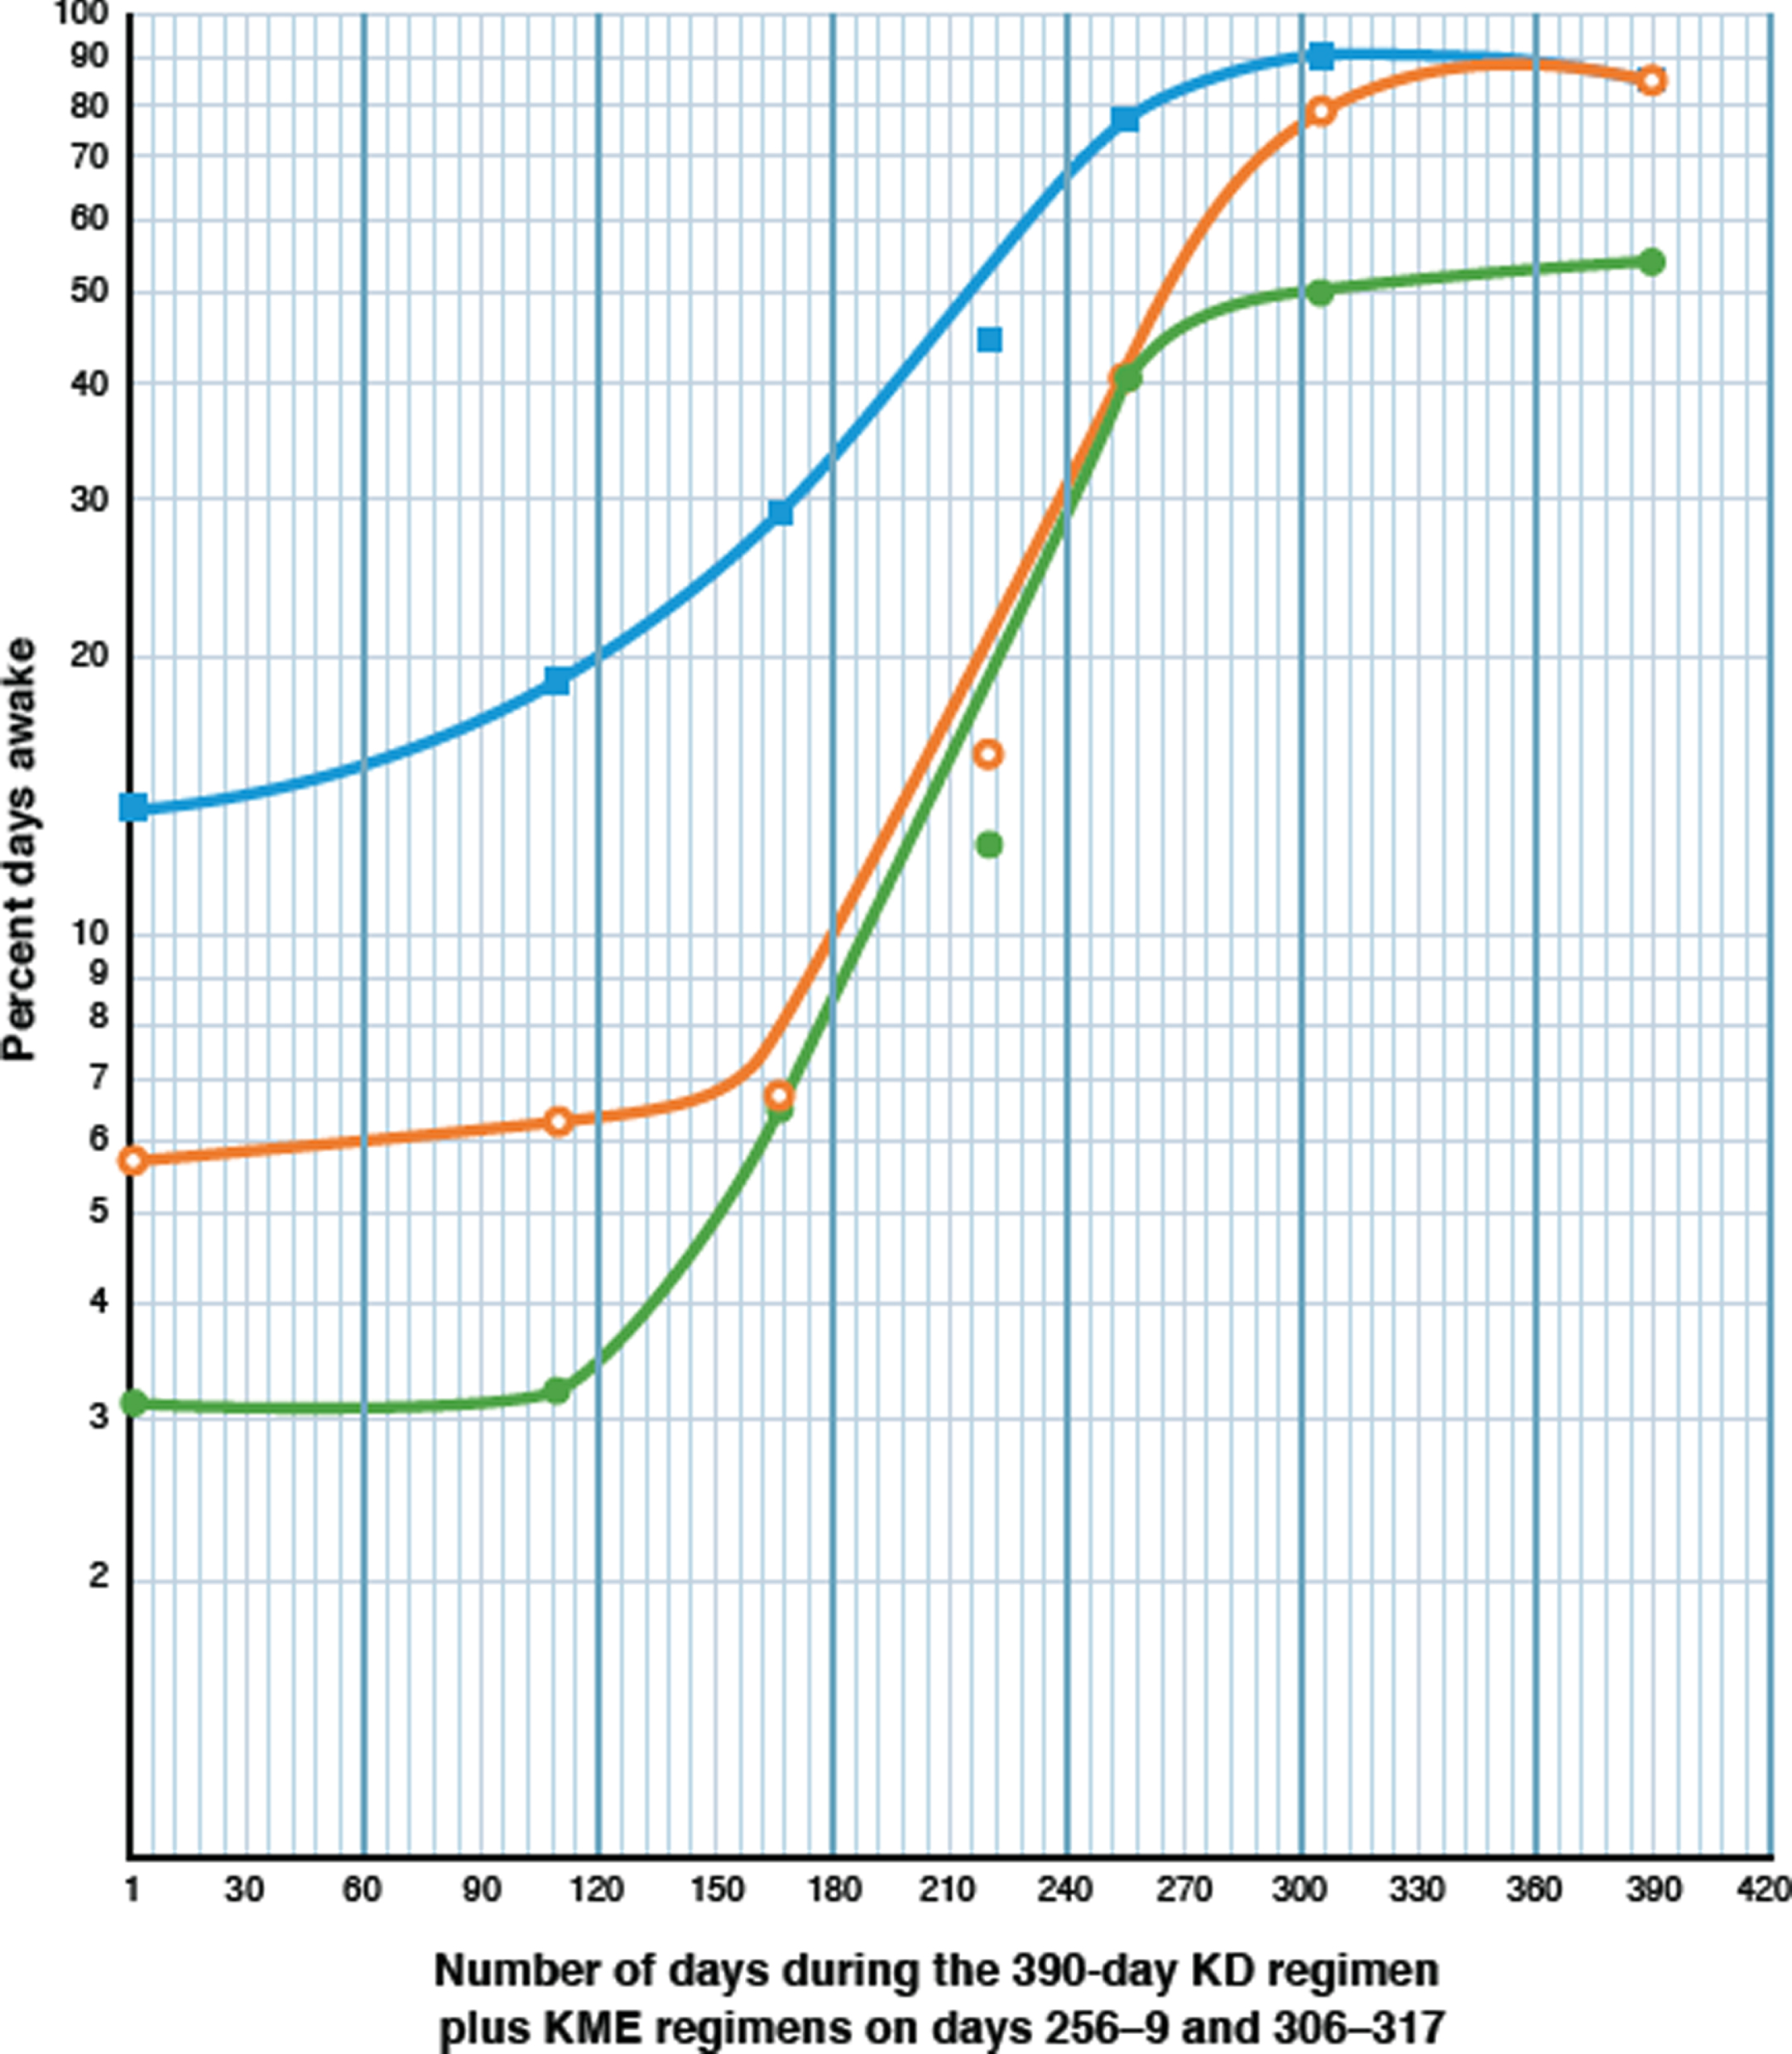
Parameter 1 produced very similar results for its sigmoid curve with its rate of increase of the log phase (four doublings) at a constant rate of 0.49% /day, that is almost identical to that of Parameter 2. The curve peaks at 50% on day 270, after the KME regimen, and transitions to a stationary phase over the next 120 days to a value between 50% and 60%.
An explanation for the lower values for Parameter 1 is provided in Table 4 (Analytical Periods 1–3). Peak values for Parameter 1 were limited to an average of 62.8% from four readings, (56.0, 53.8, 67.3 [Table 2 TMs-D, G, and F (ii)] and 74.2 (Table 3, Period 3), χ2 0.5 with 3 degrees of freedom). The reason for the limitation of the four statistically similar peak values of Parameter 1, to an average of 62.8%, was the statistically equal probability in all of the analytical periods (average 20.4%; χ2 4.33 with 3 degrees of freedom) of short naps (average 9.4 min) occurring before 11 : 00 a.m., regardless of the available BKL. Thus, in the absence of daily therapeutic BKLs, these short morning naps were a factor in restricting the maximum percentage of days awake for Parameter 1 (62.8%) to values about 20% less than those of the peak values for Parameter 2 (78.0%, 83.9%, and 84.6%, average 82.2%), without contributing to CDS. Parameter 3 shows a log phase with two doublings at a similar constant rate (0.48% per day) and the curve peaks at 90.2% after 305 days.
Comparative analysis of potential hypotheses which may explain the data. Can neurogenesis or mitochondrial bioenergetics or both, explain the permanent restoration of neuronal function in the neural circuits of the sleep-wake-cycle?
These studies suggest that chronic daytime somnolence resulted from the presence of nonfunctional neurons (likely from glucose hypometabolism) of the awake neural circuits of the sleep-wake cycle and that their function was restored with regimens of exogenous ketosis. Ketone bodies provide an evolution-based alternative source of energy and an alternate source of maintenance of neural plasticity during periods of starvation or insulin deficiency or inefficiency [42]. Increases in wakefulness may be explained by the renewed functioning of the neural circuits of the sleep-wake cycle by either or both of two principal hypotheses: 1) ketosis-induced bioenergetics which compensates for glucose hypometabolism [3–7] and 2) ketosis-induced BDNF [9] which has been shown to induce neurogenesis [83] with the subsequent replacement of nonfunctional or apoptotic neurons in these neural circuits. Both of these processes are likely to be in play for optimal restoration of functionality in the repair of the diseased brain.
The two hypotheses were differentiated in our data by two observations: 1) The mitochondrial bioenergetics-activation hypothesis explains increases in wakefulness that occurred in very short, non-incremental time frames, in some cases in a matter of hours, and in others, in a matter of days; 2) The neurogenesis hypothesis explains a longer-term, slower, incremental, and time-dependent logarithmic process. Analysis of the data helped to differentiate between these two principal hypotheses and to test the validity of a third hypothesis, elimination of daytime somnolence by mitochondrial bioenergetics alone.
We will use the sigmoid curve data from Fig. 3, and nine analytical periods taken from Tables 2 and 4 and summarized in Table 5, to create three data sets. these data sets will be used to illustrate first, that different rates of increase in wakefulness and the lengths of time required for the completion of the increase, imply that two different mechanisms are responsible for the ketosis-induced elimination of daytime somnolence and secondly, to hypothesize the nature of these mechanisms. These hypotheses should serve as the basis for future research.
Period 1 (Table 5) identifies the two ketosis-induced levels of neural circuit functionality of the sleep-wake cycle, partial and complete. Partial functionality of these circuits (Period 1a) is associated with low-dose ketosis or 0.1 mM BKLs. Complete functionality (Period 1b) is associated with high-dose ketosis (3-4 mM BKLs) or with endogenously produced levels (0.6 mM).
Periods 2–4 describe gastritis-induced daytime somnolence and its recovery, with percent days awake for Parameters 1 and 2 initially in the range of 20% (Period 2b) followed by a return to complete functionality in 10–16 days, the result of endogenous ketosis with BKLs at 600 μM (Periods 3-4).
Period 5 shows the simultaneous occurrence of both complete and partial functionality for Parameters 1 and 2, based on the response to an available intermediate-dose of 200 μM BKL, the tail end of endogenous ketosis.
Periods 6–9 (November of 2018 to October 2019) demonstrate the restriction to partial functionality (percent days awake at 40% for Parameters 1 and 2), associated with 100 μM BKLs, about 17 months after that level of functionality was first described in May 2018 (Period 1a). The KD was administered as the sole therapy (Period 6) following the termination of the KME regimen. Illness-induced CDS (0% and 6.9%; Period 7) in January of 2019 was subsequently reversed in the first 10 days of February (Period 8), and the partially functional level (∼40%) characteristic of 100 μM BKLs was restored in that month and for the remainder of that year (Period 9).
Data set 1
Four aspects of the logarithmic or exponential phases of the sigmoid curves (Fig. 3) which characterized increases of wakefulness in response to the combined KD-KME ketosis regimens, are discussed. (a) the biological inferences that can be drawn from the existence of the logarithmic phases, (b) the influence of different BKLs on the rates of logarithmic increases of wakefulness, (c) a comparison of the slow, incremental, low logarithmic rates with rapid, non-incremental high rates produced during recovery from illness-induced CDS, and (d) evidence that the initial logarithmically-produced restoration was permanent.
(a) The biological significance of the logarithmic increase in wakefulness. The classical sigmoid curves [84], associated with increases in daytime wakefulness for Parameters 1 and 2 (Fig. 3), suggest, from a biological standpoint, that these results originated from increases in the physical entities, that are responsible for wakefulness. All three phases of the sigmoid curves in Fig. 3, support the inference of a physical basis for the origin of these curves. 1) The exponential phases occurred during 137 days of the 390-day curve, the result of the combined effect of the KD (the first 97 days, i.e., 159–255) and the KME (days 256–305) regimens. An exponential phase is defined as that which results from the doubling of some physical entity, produced by a multistep process at a constant rate (in this case ∼0.5% /day) over a defined period of time. That entity could be the neurons of the circuits of the sleep-wake cycle [75–77; 79–82]. 2) The lag phase would represent ketosis-induced BDNF signaling [83] within the neural progenitor/stem cell population, leading to cell division. 3) The saturation phase (days 306–390) identifies the carrying capacity [85] of the neural networks. This is confirmed by the failure of the second KME regimen [Table 2, TMs-E to F (ii) and Fig. 3, days 306–317] to increase the percent days awake for Parameters 1 and 2 (53.8% and 84.6% Table 5, Period 4), over that generated from the first KME regimen [Table 2, TM-D (56.0% and 78.0%) and Fig. 3 (days 256–305)]. The saturation phase [85], would represent ketosis-BDNF-induced neuronal migration, differentiation, and integration [83] into the neural circuits of the sleep-wake cycle.
(b) the influence of different BKLs on the rates of logarithmic increase of wakefulness. The rate of increase of the percent days awake during logarithmic progressions (Fig. 3) is a function of the different BKLs produced by low and high-dose ketosis regimens. During the initial low-dose ketosis therapy with 100 μM BKLs [Table 2, TM-C (i-iv)], the percentage of days awake for Parameter 2 increased incrementally during the exponential phase, from 6.7% to 37.5%, at the rate of 0.35% /day, over an 87-day period [Table 2, TM- C (ii)-C (iv); Fig. 3, days 168–255]. During the first KME regimen (BKLs 3-4), a similar but more rapid incremental increase during the exponential phase of 0.83% /day, occurred over a 50-day period, according to one measurement (Table 2 TM-D) and from a second measurement, (Fig. 2, days 1–30), from 8.0% to 46.0% at 1.3% per day for an average of 1.07% /day. Thus, the rate of logarithmic increase is clearly a function of and the product of, the BKL.
(c) A comparison of the initial slow, incremental increases and the low logarithmic rates which resulted in the elimination of CDS by the KD-KME regimens, with the subsequent rapid non-incremental increases and high rates produced during recovery from illness-induced CDS, suggests that repair of the circuits had taken place. Alternative inferences can be drawn from increases in wakefulness that occurred in short time frames at high rates and those increases which occurred with lower rates over longer periods of time (associated with exponential phases).
For example, an analysis of data during low-dose (100 μM BKL) ketosis therapy in 2019 (Table 5 Periods 6–9), provided evidence that permanent repair of the circuits had taken place. Following a period of ulcerative tinea pedis-induced CDS in January of 2019 [Table 5, Period 7)], recovery resulted in the restoration of partial functionality, with increases to 40% each in the first 10 days of February at rates of 3.3-4.0% /day [Table 5, Period 8, see also graphic and tabular charts (Fig. 1 and Table 1 Periods H (i) and H (ii)]. In contrast, we note that for Parameters 1 and 2, similar low-dose therapy during the initial KD/KME regimens produced incremental increases from 6.5% and 6.7% to 37.5% each, in May of 2018, in 87 days, at a rate of 0.35% /day (Table 2, TMs-C (ii) to C (iv). These results suggest that repair of the circuits took place in May of 2018, by a multi-step, time-dependent process in 87 days, that permanently repaired the circuits, which were then energized in February of 2019 in 10 days to produce the maximum functional level for low-dose ketosis, at 10 times the rate in 1/9th of the time.
(d) Additional evidence that the logarithmically produced restoration was permanent. In February of 2019, the partial restoration of neural function at 40% for both Parameter 1 and 2, occurred in 10 days, after recovery from illness-induced CDS (0% and 6.9% respectively) with the available low-dose ketosis (100 μM BKLs, Table 5, Periods 7-8). These levels persisted through October of 2019 (34.7% and 44.2%; Table 5, Period 9). In addition, for the 17 months, ending July of 2021, these percentages have been 31.0% and 34.5%, for Parameters 1 and 2. All low-dose ketosis values from 2019 to 2021 are statistically equivalent to the previous low-dose ketosis values of 37.5% 38 months earlier, from May of 2018, for both parameters [Table 2, TM-C (iv); χ2 2.6 with 5 degrees of freedom], demonstrating the permanency of the repair.
Similarly, the restoration of completely functional levels manifested by the percent days awake for Parameters 1 and 2 (following gastritis-induced daytime somnolence) produced by the available 600 μM BKL in September of 2018 (Table 5, Periods 3-4) occurred with increases from 20% each, to 53.8% and 84.6% respectively in 10–16 days. These levels are statistically similar to those established in June of 2018, after increasing from CDS levels of 6.5% and 6.7% to 56.0% and 78.0% respectively, in 139 days, (χ2 0.6 with 1 degree of freedom for Parameter 2), as a result of a combination of low-dose and high-dose KD-KME ketosis (Table 2 TM-C (ii) to TM-D).
These results suggest a ketosis-dependent, time-dependent repair process and the permanency of the restoration of complete functionality. The higher rates of restoration of wakefulness produced in short periods of time, we propose, resulted from a response to bioenergetics provided to the repaired circuits, respectively by the 100 μM BKL (which permits only partial functionality) and the 600 μM BKL (the lowest BKL which can energize complete functionality).
Data set 2
Results discussed below based on the rates of increase in wakefulness, suggest the need for continued research to explore whether the neurogenesis hypothesis or a bioenergetics-only hypothesis better explains the restoration of wakefulness.
Low-dose ketosis therapy (100 μM BKL) during the initial treatment of CDS in August 2017 to May 2018, increased wakefulness as measured by Parameter 1, from the pretreatment level of 3.1% to 37.5% in 255 days (Table 2, TMs B to C) at a rate of 0.14% /day. On the other hand, the recovery from illness-induced CDS in January of 2019, from 0% to 40% in 10 days (Table 5 Periods 7-8), also with an available BKL of 100 μM, occurred at the rate of 4.0% /day, a 2,900% increase over that of May 2018 with the identical 0.1 mM BKL. Similarly, for Parameter 2, during the initial 100 μM BKL treatment of CDS in August 2017 to May 2018, percent days awake increased logarithmically, from 4.5% to 37.5% at a rate of 0.13% /day. The recovery from gastritis-induced daytime somnolence with endogenous ketosis (0.6 mM) observed in September 2018, produced an increase for Parameter 2 from 20% to an average of 88.2%, in 10 days at the rate of 6.8% /day (Table 5, Periods 2b-4), a rate that is about 4,500% greater than that of May 2018. If one assumes that neurogenesis and repair did not initially occur and that all observed increases are due solely to mitochondrial bioenergetics, it seems quite unlikely that the function of neural circuits which initially increased at a rate of 0.13% /day could, 17 months later, be increased at a rate that is about 3,000% greater with the same 0.1 mM BKL, or 4,500% greater from a BKL that was only six times greater. These results for Parameters 1 and 2 suggest that a permanent and complete repair and renewal of the neural circuits is a more likely explanation than that of bioenergetics activation alone. In addition, we conclude from the analysis of these high recovery-from-illness rates, that the low rates of logarithmic increases are unlikely to be caused by mitochondrial bioenergetics only. Levels of response of these putatively completely renewed circuits, are however, dependent on the extent of bioenergetics provided by the available BKL. This is confirmed in Data Set 3 below.
Data set 3
In a single low-dose post-KME analytical period (Table 2 TM-G; Table 5 Period 5) we identified and explained earlier from an analysis in Table 4, two different, simultaneously occurring levels of recovery from illness-induced daytime somnolence; complete recovery for Parameter 1 (67.3%) but only partial recovery for Parameter 2 (43.6%). We explore whether these results are an indication of the initial complete and permanent restoration of neural function which can later be expressed at two different levels.
The two hypotheses of partial and completely renewed functionality of the neural circuits of the sleep-wake cycle, include two caveats. Either (a) low-dose ketosis (100 μM BKLs, Table 5, Periods 8-9) can only supply bioenergetics to permit partial functioning (∼40%) of completely and permanently repaired functional neural circuits (Table 5, Period 1b); [This 40% level is the equivalent of the hypothetical capability of repair of the 100 μM BKL (Table 5, period 1a)]. Or (b) low-dose ketosis is incapable of maintaining the integrity and functionality of the completely renewed circuits in the absence of the high-dose KME regimen. This latter caveat implies that if repair did occur, it would not be permanent.
Evidence in support of the former supposition is shown in Table 5, Period 5 for Parameters 1 and 2. We proposed, in describing these results in Table 4, that EDW requires bioenergetics at a higher level than that provided by the endogenously produced 200 μM BKL, which sufficed for morning wakefulness, but which was insufficient for full EDW functionality. This result provides evidence for the simultaneous demonstration of both levels of function by the two parameters in the same period. The results not only indicate the permanency of the completely repaired network, shown by Parameter 1, which was restored 5 months earlier and which still functioned at its peak (Table 2, compare TM-D with TM-G) but that expression of the neural circuits, for each of the two parameters, depends on the extent of bioenergetics provided by the available 0.2mM BKL, which was clearly insufficient for the peak expression of Parameter 2.
Ketones and neurodegenerative disease
How might ketones generate newly functional neurons?
In response to ketosis, sub functional neurons may demonstrate functionality from either or both of two processes, bioenergetics [86–89] and neurogenesis [9]. The data from these studies suggest hypothetically that both of these processes may have been involved in the elimination of CDS. Existing functional but energy (glucose)-starved neurons can be energized to functionality through ketone (βHB)-induced mitochondrial bioenergetics, which provides them with a source of Acetyl-CoA when glucose is unavailable or inefficiently supplied [9, 42, 86–89]. βHB crosses the blood-brain barrier [90] resulting in activation of mitochondrial function, through oxidative phosphorylation, electron transport, and ATP synthesis [9, 86–89]. Secondly, defective or apoptotic neurons can be replaced by neurogenesis, which can result from two processes: 1) βHB-induced bioenergetics-driven mitochondrial biogenesis which regulates the cell cycle [91,92] and 2) βHB-induced expression of BDNF [9]. BDNF (like insulin) binds to its high affinity receptor, receptor tyrosine kinase B, triggering multiple intracellular signal transduction pathways in the neural progenitor/stem cell population that lead to proliferation, migration, neuronal outgrowth and differentiation, long-term potentiation, synaptic plasticity, learning, and neuroprotection [83, 93–98].
Summary of the evidence that ketosis-induced BDNF and BDNF-induced neurogenesis can result in local and global repair of injury in the adult mammalian (including human) brain
Neurogenesis occurs in the adult mammalian brain (including the human brain) generating distinct populations of differentiating cells. Neurogenesis in the adult mammalian brain occurs primarily in two neurogenic or neuroproliferative niches in the forebrain, the subventricular zone of the lateral ventricles, and the subgranular zone of the dentate gyrus of the hippocampus [99–105].
In vivo BDNF induction, following injury in the adult mammalian brain, induces mature neurons to initiate BDNF signaling. Tonchev et al. [106] described BDNF’s role in responding to brain injury at the cellular level in the CA1 sector of the dentate gyrus of the hippocampus of adult Macaque monkeys. They illustrated how existing mature neurons, in responding to ischemic insult through the expression of BDNF, control the functioning of astrocytes as neural precursor/stem cells in initiating neurogenesis.
The adult mammalian (including human) brain has a global potential for restorative neurogenesis in response to injury or disease. Neurogenesis has been shown in adult rodent and murine species, to originate, in response to stroke, cortical infarction or ischemia, from the Pia mater [107], or from Layer 1 of the cerebral cortex [108] and oligodendrocyte precursors (NG2-glia) in the parenchyma [109–112]. Studies of the brains of human Huntington’s disease patients [113, 114], demonstrated a significant increase in proliferative activity of neural progenitor cells as well as glia in the subependymal zone adjacent to the caudate nucleus in response to cell death in the caudate nucleus (a preferential target of the disease). This illustrates that the diseased adult human brain has regenerative potential.
Given the lack of consistent therapeutic doses in the treatments described here, we hypothesize that there may be a potential role for therapeutic doses of a ketone ester to be a factor in the relief of this patient’s dementia, as previously demonstrated [52,68] when it becomes available in a tolerable formulation for her.
Conclusions. Ketones represent an important part of a multi-therapy approach to the treatment of neurodegenerative disease in humans
The results of this study suggest that a therapeutic approach utilizing ketosis, anchored to the use of genetically engineered BDNF or functionally related TrkB agonists, represents the future for the successful treatment in humans, of neurodegenerative injury and disease [97,115]. Although the brain clearly has the potential for restorative neurogenesis, not only from its neurogenic niches but globally, the extent of the injury, or of the toxic effect of disease biproducts, can have a negative effect on the efficiency of endogenous neurogenesis. But there is real potential for a multiple-therapy approach that would bypass this potential block to the endogenous initiation of neurogenesis. It would consist of: (a) ketosis, which can reverse the effects of chronic inflammation with its anti-inflammatory and neuroprotective properties, and promote neural proliferation, migration, differentiation and integration into new neural circuits, while simultaneously providing the bioenergetics for newly created neural networks; (b) therapeutic levels of BDNF from transgenically modified hMSC-BDNF cells [97, 115] to enhance the endogenous levels of BDNF; and (c) anti-toxicity efforts to reduce or eliminate sources of anti-neurogenesis toxicity, as illustrated in AD. Examples of these developing anti-toxicity approaches which show promise for future use are, gamma wave and ultrasound stimulation, microglial depletion, antibody therapy against Aβ oligomers, and anti ApoE4 immunotherapy [116–121].
ACKNOWLEDGMENTS
This paper is dedicated to the memories of the late Drs. Theodore VanItallie and Richard Veech. Dr. VanItallie for his wisdom and humanity and for his foresight, inspiration, and encouragement, which led to this project. This dedication honors the brilliance of his life-long work and his contributions to the fields of Neurology and Metabolic Therapy. Dr. Veech is memorialized for his valuable insights, wisdom, and persistence in the development of ketosis-based metabolic therapy, and for his counsel during this project. We also acknowledge the help of Dr. Kieran Clarke for discussions related to the therapy with the Ketone Mono Ester also referred to as ΔG. We gratefully acknowledge the assistance of Noriel Mariano, Infection Control Epidemiologist in the Department of Infection Prevention and Control, New York Presbyterian Hospital, Queens, for his work on digitizing the Graphic Chart and the Tables, and of Astrid Lewis Reedy for her work in digitizing Figs. 1 and 2.
FUNDING
The authors have no funding to report.
CONFLICT OF INTEREST
The authors have no conflict of interest to report.
REFERENCES
[1] | Csajbók ÉA , Tamás G ((2016) ) Cerebral cortex: a target and source of insulin? Diabetologia 59: , 1609–1615. |
[2] | Hubbard SR , Miller WT ((2007) ) Receptor tyrosine kinases: mechanisms of activation and signaling. Curr Opin Cell Biol 19: , 117–123. |
[3] | de la Monte SM , Wands JR ((2005) ) Review of insulin and insulin-like growth factor expression, signaling, and malfunction in the central nervous system: relevance to Alzheimer’s disease. J Alzheimers Dis 7: , 45–61. |
[4] | de la Monte SM , Wands JR ((2008) ) Alzheimer’s disease is type 3 diabetes–evidence reviewed. Technol 2,: , 1101–1113. |
[5] | de la Monte SM ((2009) ) Insulin resistance and Alzheimer’s disease. BMB Rep 42: , 475-48. |
[6] | de la Monte SM ((2014) ) Type 3 diabetes is sporadic Alzheimer’s disease: mini review. Eur Neuropsychopharmacol 24,: , 1954–1960. |
[7] | Mujica-Parodi LR , Amgalan A , Sultan SF , Antal B , Sun X , Skiena S , Lithen A , Adra N , Ratai E-M , Weistuch C , Govindarajan ST , Strey HH , Dill KA , Stufflebeam SM , Veech RL , Clarke K ((2020) ) Diet modulates brain network stability, a biomarker for brain aging, in young adults. U S A 117: , 6170–6177. |
[8] | Bateman JM , McNeill H ((2006) ) Insulin/IGF signaling in neurogenesis. Cell Mol Life Sci 63: , 1701–1705. |
[9] | Sleiman SF , Henry J , Al-Haddad R , El Hayek L , Haidar EA , Stringer T , Ulja D , Saravanan S , Karuppagounder SS , Holson EB , Ratan RR , Ninan I , Chao MV ((2016) ) Exercise promotes the expression of brain derived neurotrophic factor (BDNF) through the action of the ketone body β-hydroxybutyrate. Elife 5: , e15092. |
[10] | Steen E , Terry BM , Rivera EJ , Cannon JL , Neely TR , Tavares R , Xu J , Wands JR , de la Monte SM ((2005) ) Impaired insulin and insulin-like growth factor expression and signaling mechanisms in Alzheimer’s disease–is this Type 3 diabetes? J Alzheimers Dis 7: , 63–80. |
[11] | Williams AJ , Umemori H ((2014) ) The best-laid plans go oft awry: synaptogenic growth factor signaling in neuropsychiatric disease. Front Synaptic Neurosci 6: , 4. |
[12] | Koppel SJ , Swerdlow RH ((2018) ) Neuroketotherapeutics: A modern review of a century-old therapy. Neurochem Int 117: , 114–125. |
[13] | Kashiwaya Y , Takeshima T , Mori N , Nakashima K , Clarke K , Veech RL ((2000) ) D-β-hydroxybutyrate protects neurons in models of Alzheimer’s and Parkinson’s disease. Proc Natl Acad Sci U S A 97: , 5440–5444. |
[14] | Caselli RJ , Chen K , Lee W , Alexander GE , Reiman EM ((2008) ) Correlating cerebral hypometabolism with future memory decline in subsequent converters to amnestic pre-mild cognitive impairment. Arch Neurol 65: , 1231–1236. |
[15] | Ruskin DN , Ross JL , Kawamura M Jr , Ruiz TL , Geiger JD , Masino SA ((2011) ) A ketogenic diet delays weight loss and does not impair working memory or motor function in the R6/2 1J mouse model of Huntington’s disease. Physiol Behav 103: , 501–507. |
[16] | Godoy JA , Rios JA , Zolezzi JM , Braidy N , Inestrosa NC ((2014) ) Signaling pathway cross talk in Alzheimer’s disease. Signal 12: , 23. |
[17] | Kroner Z ((2009) ) The relationship between Alzheimer’s disease and diabetes: Type 3 diabetes? Alternative Med Rev 14: , 373–379. |
[18] | Correia SC , Santos RX , Carvalho C , Cardoso S , Candeias E , Santos MS , Oliveira CR , Moreira PI ((2012) ) Insulin signaling, glucose metabolism and mitochondria: Major players in Alzheimer’s disease and diabetes interrelation. Brain Res 1441: , 64–78. |
[19] | Krikorian R , Shidler M , Dangelo K , Couch SC , Benoit SC , Clegg DJ ((2012) ) Dietary ketosis enhances memory in mild cognitive impairment. Neurobiol Aging 33: , 425e19–425e27. |
[20] | Rivera EJ , Goldin A , Fulmer N , Tavares R , Wands JR , de la Monte SM ((2005) ) Insulin and insulin-like growth factor expression and function deteriorate with progression of Alzheimer’s disease: link to brain reductions in acetylcholine. J Alzheimers Dis 8: , 247–268. |
[21] | Watson GS , Craft S ((2003) ) The role of insulin resistance in the pathogenesis of Alzheimer’s disease: implications for treatment. CNS Drugs 17: , 27–45. |
[22] | Watson GS , Craft S ((2006) ) Insulin resistance, inflammation, and cognition in Alzheimer’s Disease: lessons for multiple sclerosis. J Neurol Sci 245: , 21–33. |
[23] | de la Monte SM , Tong M , Lester-Coll N , Plater M Jr , Wands JR ((2006) ) Therapeutic rescue of neurodegeneration in experimental Type 3 diabetes: relevance to Alzheimer’s disease. J Alzheimers Dis 10: , 89–109. |
[24] | Craft S. ((2007) ) Insulin resistance and Alzheimer’s disease pathogenesis: potential mechanisms and implications for treatment. Curr Alzheimer Res 4: , 147–152. |
[25] | Neumann KF , Rojo L , Navarrete LP , Farias G , Reyes P , Maccioni RB ((2008) ) Insulin resistance and Alzheimer’s disease: molecular links & clinical implications. Curr Alzheimer Res 5: , 438–447. |
[26] | Luchsinger JA ((2010) ) Type 2 diabetes, related conditions, in relation and dementia: an opportunity for prevention? J Alzheimers Dis 20: , 723–736. |
[27] | Baker LD , Cross DJ , Minoshima S , Belongia D , Watson GS , Craft S ((2011) ) Insulin resistance and Alzheimer-like reductions in regional cerebral glucose metabolism for cognitively normal adults with prediabetes or early Type 2 diabetes. Arch Neurol 68: , 51–57. |
[28] | Cunnane S , Nugent S , Roy M , Courchesne-Loyer A , Croteau E , Tremblay S , Castellano A , Pifferi F , Bocti C , Paquet N , Begdouri H , Bentourkia M , Turcotte E , Allard M , Barberger-Gateau P , Fulop T , Rapoport SI ((2011) ) Brain Fuel metabolism, aging and Alzheimer’s disease. Nutrition 27: , 3–20. |
[29] | de la Monte SM ((2012) ) Therapeutic targets of brain insulin resistance in sporadic Alzheimer’s disease. Front Biosci (Elite Ed) 4: , 1582–1605. |
[30] | de la Monte SM ((2017) ) Insulin resistance and neurodegeneration: progress towards the development of new therapeutics for Alzheimer’s disease. Drugs 77: , 47–65. |
[31] | Talbot K , Wang HY , Kazi H , Han LY , Bakshi KP , Stucky A , Fuino RL , Kawaguchi KR , Samoyedny AJ , Wilson RS , Arvanitakis Z , Schneider JA , Wolf BA , Bennett DA , Trojanowski JQ , Arnold SE ((2012) ) Demonstrated brain insulin resistance in Alzheimer’s disease patients is associated with IGF-1. J Clin Invest 122: , 1316–1338. |
[32] | Shaw K ((2013) ) ‘Type 3 diabetes’: linking a brain insulin-resistant state with dementia and Alzheimer’s disease. . Practical Diabetes 30: , 102–103. |
[33] | Leszek J , Trypka E , Tarasov VV , Ashraf GM , Aliev G ((2017) ) Type 3 diabetes mellitus: a novel implication of Alzheimer’s disease. Curr Top Med Chem 17: , 1331–1335. |
[34] | Iwangoff P , Armbruster R , Enz A , Meier-Ruge W ((1980) ) Glycolytic enzymes from human autoptic brain cortex: normal aged and demented cases. Mech Ageing Dev 14: , 203–209. |
[35] | Hoyer S , Henneberg N , Knapp S , Lannert H , Martin E ((1996) ) Brain glucose metabolism is controlled by amplification and desensitization of the neuronal insulin receptor. Ann N Y Acad Sci 777: , 374–379. |
[36] | Hoyer S ((2004) ) Glucose metabolism and insulin receptor signal transduction in Alzheimer disease. Eur J Pharmacol 490: , 115–125. |
[37] | Schubert M , Gautam G , Surjo D , Ueki K , Baudler S , Schubert D , Kondo T , Alber J , Galldiks N , Küstermann E , Arndt S , Jacobs AH , Krone W , Kahn CR , Brüning JC ((2004) ) Role for neuronal insulin resistance in neurodegenerative diseases. Proc Natl Acad Sci U S A 101: , 3100–3105. |
[38] | Taylor MK , Sullivan DK , Mahnken JD , Burns JM , Swerdlow RH ((2017) ) Feasibility and efficacy data from a ketogenic diet intervention in Alzheimer’s disease. (NY) 4: , 28–36. |
[39] | McDonald TJW , Cervenka MC ((2018) ) The expanding role of ketogenic diets in adult neurological disorders. Brain Sci 8: , 148. |
[40] | McDonald TJW , Cervenka MC ((2018) ) Ketogenic diets for adult neurological disorders. Neurotherapeutics 15: , 1018–1031. |
[41] | Augustin K , Khabbush A , Williams S , Eaton S , Orford M , Cross JH , Heales SJR , Walker MC , Williams RSB ((2018) ) Mechanisms of action for the medium-chain triglyceride ketogenic diet in neurological and metabolic disorders. Lancet Neurol 17: , 84–93. |
[42] | Veech RL , Chance B , Kashiwaya Y , Lardy HA , Cahill GF Jr. ((2001) ) Ketone bodies, potential therapeutic uses. IUBMB Life 51: , 241–247. |
[43] | Veech RL ((2004) ) The therapeutic implications of ketone bodies: the effects of ketone bodies in pathological conditions: ketosis, ketogenic diet, redox states, insulin resistance, and mitochondrial metabolism. Prostaglandins Leukot Essent Fatty Acids 70: , 309–319. |
[44] | Reger MA , Henderson ST , Hale C , Cholerton B , Baker LD , Watson GS , Hyde K , Chapman D , Craft S ((2004) ) Effects of beta-hydroxybutyrate on cognition in memory-impaired adults. Neurobiol Aging 25: , 311–314. |
[45] | Vanitallie TB , Nonas C , di Rocco A , Boyar K , Hyams K , Heymsfield SB ((2005) ) Treatment of Parkinson disease with diet-induced hyperketonemia: A feasibility study. Neurology 64: , 728–730. |
[46] | Henderson ST ((2008) ) Ketone bodies as a therapeutic for Alzheimer’s disease. Neurotherapeutics 5: , 470–480. |
[47] | Henderson ST , Vogel JL , Barr LJ , Garvin F , Jones JJ , Costantini LC ((2009) ) Study of the ketogenic agent AC-1202 in mild to moderate Alzheimer’s disease: a randomized, double-blind, placebo-controlled, multicenter trial. . Nutr Metab (Lond) 6: , 31. |
[48] | Cunnane SC , Courchesne-Loyer A , St-Pierre V , Vandenberghe C , Pierotti T , Fortier M , Croteau E , Castellano C-A ((2016) ) Can ketones compensate for deteriorating brain glucose uptake during aging? Implications for the risk and treatment of Alzheimer’s disease. . Ann N Y Acad Sci 1367: , 12–20. |
[49] | Kashiwaya Y , Bergman C , Lee J-H , Wan R , King MT , Mughal MR , Okun E , Clarke K , Mattson MP , Veech RL ((2013) ) A ketone ester diet exhibits anxiolytic and cognition-sparing properties and lessens amyloid and tau pathologies in a mouse model of Alzheimer’s disease. Neurobiol Aging 34: , 1530–1539. |
[50] | Paoli A , Rubini A , Volek JS , Grimaldi KA ((2013) ) Beyond weight loss: a review of the therapeutic uses of very-low-carbohydrate (ketogenic) diets. Eur J Clin Nutr 67: , 789–796. |
[51] | Hashim SA , VanItallie TB ((2014) ) Ketone body therapy: from the ketogenic diet to the oral adminsitration of ketone ester. J Lipid Res 55: , 1818–1826. |
[52] | Newport MT , VanItallie TB , Kashiwaya Y , King MT , Veech RL ((2015) ) A new way to produce hyperketonemia: use of ketone ester in a case of Alzheimer’s disease. Alzheimers Dement 11: , 99–103. |
[53] | Veech RL ((2014) ) Ketone ester effects on metabolism and transcription. J Lipid Res 55: , 2004–2006. |
[54] | Lange KW , Lange KM , Gertruda EM , Nakamura Y , Reissmann A , Kanaya S , Hauser J ((2017) ) Ketogenic diets and Alzheimer’s disease. . Food Sci Human Wellness 6: , 1–9. |
[55] | Minghetti L ((2005) ) Role of inflammation in neurodegenerative diseases. Curr Opin Neurol 18: , 315–321. |
[56] | Gasior M , Rogawski MA , Hartman AL ((2006) ) Neuroprotective and disease-modifying effects of the ketogenic diet. Behav Pharmacol 17: , 431–439. |
[57] | Kim DY , Hao J , Liu R , Turner G , Shi FD , Rho JM ((2012) ) Inflammation-mediated, memory dysfunction and effects of a ketogenic diet in a murine model of multiple sclerosis. PLoS One 7: , e35476. |
[58] | Maalouf MA , Rho JM , Mattson MP ((2009) ) The neuroprotective properties of calorie restriction, the ketogenic diet, and ketone bodies. Brain Res Rev 59: , 293–315. |
[59] | VanItallie TB ((2017) ) Alzheimer’s disease: Innate immunity gone awry? Metabolism 69S: , S41–S49. |
[60] | Chen W , Zhang X , Huang WJ ((2016) ) Role of neuroinflammation in neurodegenerative diseases (Review). Mol Med Rep 13: , 3391–3396. |
[61] | Pinto A , Bonucci A , Maggi E , Corsi M , Businaro R ((2018) ) Anti-oxidant and anti-inflammatory activity of ketogenic diet: new perspectives for neuroprotection in Alzheimer’s disease. Antioxidants (Basel) 7: , E63. |
[62] | Mendez MF ((2019) ) Early-onset Alzheimer disease and its variants. Continuum 25: , 34–51. |
[63] | Liu CC , Kanekiyo T , Xu H , Bu G ((2013) ) Apolipoprotein E and Alzheimer’s disease: risk, mechanisms, and therapy. Nat Rev Neurol 9: , 106–118. |
[64] | Langbaum JBS , Chen K , Caselli RJ , Lee W , Reschke C , Bandy D , Alexander GE , Burns CM , Kaszniak AW , Reeder SA , Corneveaux JJ , Allen AN , Pruzin J , Huentelman MJ , Fleisher AS , Reiman EM ((2010) ) Hypometabolism in Alzheimer-affected brain regions in cognitively healthy Latino individuals carrying the apolipoprotein E ɛ4 allele. Arch Neurol 67: , 462–468. |
[65] | Mosconi L , Pupi A , de Leon MJ. ((2008) ) Brain glucose hypometabolism and oxidative stress in preclinical Alzheimer’s disease. Ann NY Acad Sci 1147: , 180–195. |
[66] | Mosconi L , Mistur R , Switalski R , Brys M , Glodzik L , Rich K , Pirraglia E , Tsui W , De Santi S , de Leon MJ ((2009) ) Declining brain glucose metabolism in normal individuals with a maternal history of Alzheimer’s disease. . Neurology 72: , 513–520. |
[67] | Ishibashi K , Kawasaki K , Ishiwata K , Ishii K ((2015) ) Reduced uptake of 18F-FDG and 15O-H2O in Alzheimer’s disease-related regions after glucose loading. J Cereb Blood Flow Metab 35: , 1380–1385. |
[68] | Newport MT ((2019) ) The Complete Book of Ketones, Turner Publishing Co. Nashville. |
[69] | Muravchick S , Levy RJ , Warltier DC ((2006) ) Clinical implications of mitochondrial dysfunction. Anesthesiology 105: , 819–837. |
[70] | Flanagan JL , Simmons PA , Vehige J , Willcox MDP , Garrett Q ((2010) ) Role of carnitine in disease. Nutr Metab (Lond) 7: , 30. |
[71] | Inazu M , Matsumiya T ((2008) ) Physiological functions of carnitine and carnitine transporters in the central nervous system. Nihon Shinkei Seishin Yakurigaku Zasshi 28: , 113–120. |
[72] | Foster DW ((2004) ) The role of the carnitine system in human metabolism. Ann N Y Acad Sci 1033: , 1–16. |
[73] | Mendelson SD ((2008) ) Nutritional supplements and metabolic syndrome. In: Metabolic Syndrome and Psychiatric Illness Interactions, Pathophysiology, Assessment and Treatment. Academic Press, New York, pp. 49–72. |
[74] | Clarke K , Tchabanenko K , Pawlosky R , Carter E , King MT , Musa-Veloso K , Ho M , Roberts A , Robertson J , Vanitallie TB , Veech RL ((2012) ) Kinetics, safety and tolerability of (R)-3-hydroxybutyl (R)-3-hydroxybutyrate in healthy adult subjects. Regul Toxicol Pharmacol 63,: , 401–408. |
[75] | Jones BE ((1989) ) The sleep-wake cycle: Basic mechanisms. J. Rheumatol Suppl 19: , 49–51. |
[76] | Jones BE ((2011) ) Neurobiology of waking and sleeping. Handbook Clin Neurol 98: , 131–149. |
[77] | Boucetta S , Cissé Y , Mainville L , Morales M , Jones BE ((2014) ) Discharge profiles across the sleep–waking cycle of identified cholinergic, GABAergic, and glutamatergic neurons in the pontomesencephalic tegmentum of the rat. J Neurosci 34: , 4708–4727. |
[78] | Cahill GF Jr ((1970) ) Starvation in man. N Engl J Med 282: , 668–675. |
[79] | Jones BE ((2017) ) Principal cell types of sleep-wake regulatory circuits. Curr Opin Neurobiol 44: , 101–109. |
[80] | Schwartz JRL , Roth T ((2008) ) Neurophysiology of sleep and wakefulness: basic science and clinical implications. Curr Neuropharmacol 6: , 367–378. |
[81] | Saper CB , Chou TC , Scammell TE ((2001) ) The sleep switch: hypothalamic control of sleep and wakefulness. Trends Neurosci 24: , 726–731. |
[82] | Scammell TE , Arrigoni E , Lipton JO ((2017) ) Neural circuitry of wakefulness and sleep. Neuron 93: , 747–765. |
[83] | Chen BY , Wang X , Wang ZY , Wang YZ , Chen LW , Luo ZJ ((2013) ) Brain-derived neurotrophic factor stimulates proliferation and differentiation of neural stem cells, possibly by triggering the Wnt/β-catenin signaling pathway. J Neurosci Res 91: , 30–41. |
[84] | Monod J ((1949) ) The growth of bacterial cultures. Ann Rev Micriobiol 3: , 371–394. |
[85] | Huete-Stauffer TM , Arandia-Gorostidi N , Díaz-Pérez L , Morán XAG. ((2015) ) Temperature dependences of growth rates and carrying capacities of marine bacteria depart from metabolic theoretical predictions. FEMS Microbiol Ecol 91,: , fiv111. |
[86] | Jensen JN , Wodschow HZ , Nilsson M , Rungby J ((2020) ) Effects of ketone bodies on brain metabolism and function in neurodegenerative diseases. Int J Mol Sci 21,: , 8767. |
[87] | Owen OE , Morgan AP , Kemp HG , Sullivan JM , Herrera MG , Cahill GF Jr. ((1967) ) Brain metabolism during fasting. J Clin Invest 46: , 1589–1595. |
[88] | Hasselbalch SG , Knudsen GM , Jakobsen J , Hageman LP , Holm S , Paulson OB ((1994) ) Brain metabolism during short-term starvation in humans. . J Cereb Blood Flow Metab 14: , 125–131. |
[89] | Camandola S , Mattson MP ((2017) ) Brain metabolism in health, aging, and neurodegeneration. EMBO J 36: , 1474–1492. |
[90] | White H , Venkatesh B ((2011) ) Clinical review: ketones and brain injury. Critical Care 15: , 219–228. |
[91] | Mitra K , Wunder C , Roysam B , Lin G , Lippincott-Schwartz J ((2009) ) A hyperfused mitochondrial state achieved at G1-S regulates cyclin E buildup and entry into S phase. Proc Natl Acad Sci U S A 21: , 11960–11965. |
[92] | Finkel T , Hwang PM ((2009) ) The Krebs cycle meets the cell cycle: mitochondria and the G1-S transition. Proc Natl Acad Sci U S A 106: , 11825–11826. |
[93] | Chao MV , Rajagopal R , Lee FS ((2006) ) Neurotrophin signaling in health and disease. Clin Sci (Lond) 110: , 167–173. |
[94] | Huang EJ , Reichardt LF ((2003) ) Trk receptors: roles in neuronal signal transduction. Annu Rev Biochem 72: , 609–642. |
[95] | Yoshii A , Constantine-Paton M ((2010) ) Postsynaptic BDNF-TrkB signaling in synapse maturation, plasticity, and disease. Dev Neurobiol 70: , 304–322. |
[96] | Swerdlow RH ((2014) ) Comment: BDNF, fitness, and the brain. Neurolog 83: , y1351. |
[97] | Deng P , Anderson JD , Yu AS , Annett G , Fink KD , Nolta JA ((2016) ) Engineered BDNF producing cells as a potential treatment for neurologic disease. Expert Opin Biol Ther 16: , 1025–1033. |
[98] | Kowiański P , Lietzau G , Czuba E , Waśkow M , Steliga A , Moryś J ((2018) ) BDNF: a key factor with multipotent impact on brain signaling and synaptic plasticity. Cell Mol Neurobiol 38: , 579–593. |
[99] | Ming GL , Song H ((2011) ) Adult neurogenesis in the mammalian brain: significant answers and significant questions. Neuron 70: , 687–702. |
[100] | Spaulding KL , Bergman O , Alkass K , Bernard S , Salehpour M , Huttner HB , Boström E , Westerlund I , Vial C , Buchholz BA , Possnert G , Mash DC , Druid H , Frisén J ((2013) ) Dynamics of hippocampal neurogenesis in adult humans. Cell 153: , 1219–1227. |
[101] | Urbán N , Guillemot F ((2014) ) Neurogenesis in the embryonic and adult brain: same regulators, different roles. Front Cell Neurosci 8: , 396. |
[102] | Vadodaria KC , Gage FH ((2014) ) Snapshot: adult hippocampal neurogenesis. Cell 156: , 1114-1114.e1. |
[103] | Braun SMG , Jessberger S ((2014) ) Adult neurogenesis: mechanisms and functional significance. Development 141: , 1983–1986. |
[104] | Capilla-Gonzalez V , Lavell E , Quiñones-Hinojosa A , Guerrero-Cazares H ((2015) ) Regulation of subventricular zone-derived cells migration in the adult brain. Adv Exp Med Biol 853: , 1–21. |
[105] | Peng L , Bonaguidi MA ((2018) ) Function and dysfunction of adult hippocampal neurogenesis in regeneration and disease. Am J Pathol 188: , 23–28. |
[106] | Tonchev AB ((2011) ) Brain ischemia, neurogenesis, and neurotrophic receptor expression in primates. Arch Ital Biol 149: , 225–231. |
[107] | NakagomiT, MolnárZ, Nakano-DoiA, TaguchiA, SainoO, KuboS, ClausenM, YoshikawaH, NakagomiN, MatsuyamaT ((2011) ) Ischemia-induced neural stem/progenitor cells in the pia mater following cortical infarction. Stem Cells Dev 20: , 2037–2051. |
[108] | Ohira K , Furuta T , Hioki H , Nakamura KC , Kuramoto E , Tanaka Y , Funatsu N , Shimizu K , Oishi T , Hayashi M , Miyakawa T , Kaneko T , Nakamura S ((2010) ) Ischemia-induced neurogenesis of neocortical layer 1 progenitor cells. Nat Neurosci 13: , 173–179. |
[109] | Rivers LE , Young KM , Rizzi M , Jamen F , Psachoulia K , Wade A , Kessaris N , Richardson WD ((2008) ) PDGFRA/NG2 glia generate myelinating oligodendrocytes and piriform projection neurons in adult mice. Nat Neurosci 11: , 1392–1401. |
[110] | Nakagomi T, Taguchi A, Fujimori Y, Saino O, Nakano-Doi A, Kubo S, Gotoh A, Soma T, Yoshikawa H, Nishizaki T, Nakagomi N, Stern DM, Matsuyama T (2009) Isolation and characterization of neural stem/progenitor cells from post-stroke cerebral cortex in mice. Eur J Neurosci 29: , 1842–1852. |
[111] | NakagomiT, MolnárZ, TaguchiA, Nakano-DoiA, LuS, KasaharaY, NakagomiN, MatsuyamaT ((2012) ) Leptomeningeal-derived doublecortin-expressing cells in poststroke brain. Stem Cells Dev 21: , 2350–2354. |
[112] | Lindvall O , Kokaia Z ((2015) ) Neurogenesis following stroke affecting the adult brain. Cold Spring Harb Perspect Biol 7: , a0199034. |
[113] | Curtis MA , Penney EB , Pearson AG , van Roon-Mom WMC , Butterworth NJ , Dragunow M , Connor B , Faull RLM ((2003) ) Increased cell proliferation and neurogenesis in the adult human Huntington’s disease brain. Proc Natl Acad Sci U S A 100: , 9023–9027. |
[114] | Curtis MA , Penney EB , Pearson J , Dragunow M , Connor B , Faull RL ((2005) ) The distribution of progenitor cells in the subependymal layer of the lateral ventricle in the normal and Huntington’s disease human brain. Neuroscience 132: , 777–788. |
[115] | Pollock K , Dahlenburg H , Nelson H , Fink KD , Cary W , Hendrix K , Annett G , Torrest A , Deng P , Gutierrez J , Nacey C , Pepper K , Kalomoiris S , Anderson JD , McGee J , Gruenloh W , Fury B , Bauer G , Duffy A , Tempkin T , Wheelock V , Nolta JA ((2016) ) Human mesenchymal stem cells genetically engineered to overexpress brain-derived neurotrophic factor improve outcomes in Huntington’s disease mouse models. Mol Ther 24: , 965–977. |
[116] | Martorell AJ , Paulson AL , Suk HJ , Abdurrob F , Drummond GT , Guan W , Young JZ , Kim DN-W , Kritskiy O , Barker SJ , Mangena V , Prince SM , Brown EM , Chung K , Boyden ES , Singer AC , Li-Huei Tsai L-H ((2019) ) Multi-sensory gamma stimulation ameliorates Alzheimer’s-associated pathology and improves cognition. Cell 177: , 256–271. |
[117] | Leinenga G , Götz J ((2015) ) Scanning ultrasound removes amyloid-β and restores memory in an Alzheimer’s disease mouse model. Sci Transl Med 7: , 278ra33. |
[118] | Spangenberg E , Severson PL , Hohsfield LA Crapser J , Zhang J , Burton EA , Zhang Y , Spevak W , Lin J , Phan NY , Habets G , Rymar A , Tsang G , Walters J , Nespi M , Singh P , Broome S , Ibrahim P , Zhang C , Bollag G , Brian L West BL , Green KN ((2019) ) Sustained microglial depletion with CSF1R inhibitor impairs parenchymal plaque development in an Alzheimer’s disease model. Nat Commun 10: , 3758. |
[119] | Sengupta U , Nilson AN , Kayeda R. ((2016) ) The role of amyloid-β oligomers in toxicity, propagation, and immunotherapy. EBioMedicine 6: , 42–49. |
[120] | van Dyck CH ((2018) ) Anti-amyloid-β monoclonal antibodies for Alzheimer’s disease: pitfalls and promise. Biol Psychiatry 83: , 311–319. |
[121] | Liao F , Li A , Xiong M , Bien-Ly N , Jiang H , Zhang Y , Finn MB , Hoyle R , Keyser J , Lefton KB , Robinson GO , Serrano JR , Silverman AP , Guo JL , Getz J , Henne K , Leyns CE , Gallardo G , Ulrich JD , Sullivan PM , Lerner EP , Hudry E , Sweeney ZK , Dennis MS , Hyman BT , Watts RJ , Holtzman DM ((2018) ) Targeting of nonlipidated, aggregated apoE with antibodies inhibits amyloid accumulation. J Clin Invest 128: , 2144–2155. |


