
Corpus Callosum Atrophy in Detection of Mild and Moderate Alzheimer’s Disease Using Brain Magnetic Resonance Image Processing and Machine Learning Techniques
Abstract
Background:
The total number of people with dementia is projected to reach 82 million in 2030 and 152 in 2050. Early and accurate identification of the underlying causes of dementia, such as Alzheimer’s disease (AD) is of utmost importance. A large body of research has shown that imaging techniques are most promising technologies to improve subclinical and early diagnosis of dementia. Morphological changes, especially atrophy in various structures like cingulate gyri, caudate nucleus, hippocampus, frontotemporal lobe, etc., have been established as markers for AD. Being the largest white matter structure with a high demand of blood supply from several main arterial systems, anatomical alterations of the corpus callosum (CC) may serve as potential indication neurodegenerative disease.
Objective:
To detect mild and moderate AD using brain magnetic resonance image (MRI) processing and machine learning techniques.
Methods:
We have performed automatic detection and segmentation of the CC and calculated its morphological features to feed into a multivariate pattern analysis using support vector machine (SVM) learning techniques.
Results:
Our results using large patients’ cohort show CC atrophy-based features are capable of distinguishing healthy and mild/moderate AD patients. Our classifiers obtain more than 90%sensitivity and specificity in differentiating demented patients from healthy cohorts and importantly, achieved more than 90%sensitivity and > 80%specificity in detecting mild AD patients.
Conclusion:
Results from this analysis are encouraging and advocate development of an image analysis software package to detect dementia from brain MRI using morphological alterations of the CC.
INTRODUCTION
The clinical symptoms of Alzheimer’s disease (AD) arise from progressive neuron and synapse loss, with the resulting tissue atrophy visible on high-resolution structural magnetic resonance imaging (MRI). As expected from the pathology and clinical expression of AD, significant atrophy is observed in early disease stages in the memory-related structures of the medial temporal lobe, particularly the hippocampus [1, 2] and entorhinal cortex [3, 4], with the degree of atrophy correlating with memory impairment [4–6]. Structural MRI measures can discriminate AD from healthy control data with high sensitivity and specificity, with the accuracy of discrimination improved when measures of atrophy beyond the medial temporal lobe are included in the analysis [7–9]. Importantly, it has been demonstrated that the degree of atrophy correlates well with disease stage determined from histopathology [10]. Regional atrophy patterns have also been found to differ between AD and other dementing disorders, such as frontotemporal dementia and dementia with Lewy bodies [11–15]. Thus, quantitative measures of atrophy from structural MRIs are sensitive to the neurodegeneration that occurs in AD, and although atrophy itself is nonspecific to AD, the topographical pattern of atrophy may be a sensitive and specific surrogate marker of AD pathology. Recently, several groups have used multivariate analysis techniques to reduce the pattern of regional atrophy that best discriminates AD from healthy control data to a single numeric index [7–9], and we also observed that grey matter, white matter [16], non-white matter [17], and even whole brain [18] have been used as region of interest (ROI) for detection of AD. These studies have demonstrated that the degree to which individuals with mild cognitive impairment (MCI) express the characteristic AD atrophy pattern is predictive of a decline in cognitive function, progressive structural brain loss and conversion to AD.
Brain MRI analysis is one of the most active fields in the medical image analysis community. For the last couple of decades, a vast number of studies have come up with accurate extraction of quantitative measures from brain MRI data. These studies showed that there is scope to develop automatic classifier to identify AD or MCI [19] and apply a more quantitative approach both in dementia research and in clinical practice. Atrophy is an important landmark of dementia; assessment of shape and size of neuro-structures such as hippocampus has received considerable attention in the last few years. However, despite several efforts, accurate and non-supervised methods for brain image orientation, registration, and segmentation is limited.
Corpus callosum (CC) is the largest fiber bundle connecting the two cerebral hemispheres. Earlier, researchers have found structural changes in the rostrum and genu, rostral body, mid body, isthmus, and splenium of CC [20–22] may lead to functional disability and MCI. Zhu et al. [23] confirmed CC atrophy occurs at an early stage of AD due to reduced inter-hemispheric integration. It is a region that has been examined intensively for indications to AD [9, 23–27]. This is due, in part, to its size, its widespread cortical projections, and its unambiguous signal with contemporary neuroimaging techniques. As the mid-sagittal section of the CC is fairly well defined, it has been the primary focus of examination. Recent advances have included diffusion tensor imaging (DTI), T1-weighted high-resolution imaging, and automatic segmentation algorithms. To this date, morphological studies of CC in AD have been mainly concerned with size reflecting these degenerative processes. However, in addition to these effects, CC shape may also change because of ventricular dilation reflecting an overall brain atrophic process. Being the largest white matter structure with a high demand of blood supply from several main arterial systems, CC has been reported to be vulnerable to both MCI and AD [24, 28–31]. Therefore, anatomical alterations of the CC may serve as potential discriminators of the concurrent but possibly different effects of vascular and neurodegenerative components. The most prominent age-related changes are seen in the anterior CC, which have been associated with deficits of psychomotor speed, executive function, and working memory. In AD, a pattern of posterior CC changes occurring early in the disease, which spread to the anterior CC as the disease progresses, may exist. CC atrophy may act as a surrogate marker of cortical atrophy as another study suggested existence of CC radiomics features related to the diagnosis of AD [32]. Distinct patterns of callosal atrophy are associated with neurodegenerative diseases such as AD and frontotemporal dementia. Since CC is easily identified and delineated on the midsagittal slice of a MRI, it may serve as a biomarker for distinguishing between these diseases. Different parts of the CC are involved in different functions, with the posterior CC being more involved in visual processing, and the anterior involved in higher cognitive functions [5, 6].
Use of different machine learning (ML) algorithms in analyzing bio-medical images is quite common since last decade. Different ML algorithms, e.g., discrete wavelet transform [33] and principal component analysis [17, 34, 35] have been used to identify significant features and K-Means [1] and Fuzzy C-Means [33, 36] for clustering, where Random Forest [37, 38], K-nearest neighbor [39, 40], and support vector machine (SVM) [16, 34, 41, 42] have been used for classifying data. Artificial neural network and convolutional neural network [18, 43–46] have been found to be widely used for identifying biomarkers and classifying bio-medical images. The implementation of convolutional neural network involves steps like finding convoluted layer followed by max pooling in a repeated way using tensorflow [47], keras [48], and theano [49]. However, these algorithms require powerful graphics and high-speed processors and take comparatively more time to be executed. Studies have also compared performance of different ML algorithms to find out optimized predictive model [37, 41, 50].
Here, we aimed to identify the morphological changes of CC caused by AD and developed tools and techniques for automatic identification followed segmentation of CC in order to calculate its two-dimensional (2D) features to feed into a multivariate pattern analysis using statistical machine learning technique, SVM. Using the publicly available Alzheimer’s Disease Neuroimaging Initiative (ADNI) data [51], we compared the CC features between demented and non-demented samples. MR images from 1,437 AD patients (45–90 years age group) and an age-matched healthy cohort were collected from the ADNI database. The cohorts were grouped into three categories based on the definition of the severity of the disease by three independent clinical scoring schemes, Clinical Dementia Rating (CDR), Mini-Mental State Examination (MMSE), and Global Deterioration Scale (GDS), respectively. In addition, we have also divided the cohorts based on ADNI grouping where disease severity is marked based on a defined protocol [52]. In each category, patient and healthy cohort data (MR brain slice image) were further grouped in train-test and validation cohorts. A 100-fold cross validation method was implemented where 100 times randomly selected 80%of the whole data has been used to train the SVM model and the remaining 20%has been used as test data. Our classifiers obtain more than 90%sensitivity and specificity in differentiating demented patients from healthy cohorts and importantly, and achieved more than 90%sensitivity and > 80%specificity in detecting mild AD patients in training-testing experiments using CDR-based categorization. Similarly, performances of the best models generated in the train-test exercises were measured using separate validation cohort datasets and obtained reasonably high accuracies in identifying mild and moderate AD patients, respectively. We believe our method is simple but quite effective and results from our analysis strongly advocate CC atrophy as an AD marker. Future works will involve development of an image analysis software package to detect dementia from brain MRI using morphological alterations of the CC.
MATERIALS AND METHODS
Data collection
Data used in this article was obtained from the ADNI database (http://www.loni.ucla.edu/ADNI), launched in 2003 by the National Institute on Aging, the National Institute of Biomedical Imaging and Bioengineering, the Food and Drug Administration, private pharmaceutical companies, and non-profit organizations. For our work, T1 weighted (with slice thickness 0–1.5 mm in sagittal plane) MR images of AD patients (45–90 age group) were collected which sums up to total 1,437 MRI of patients and healthy samples. As we considered CC as our only region of interest, we have taken slices between 82.8 mm to 106.8 mm in sagittal view of MR scan. Theoretically, in a continuous 3D scan, there is no spacing between slices, and the slice thickness is 1.2 mm.
Classification of dataset according to scoring function
The data from the ADNI database were classified based on three independent clinical scoring functions: CDR, MMSE, and GDS, respectively.
CDR
The CDR is a global rating device that was first introduced in a prospective study of patients with mild “senile dementia of AD type” in 1982 [53]. CDR is calculated on the basis of testing six different cognitive and behavioral domains such as memory, orientation, judgment and problem solving, community affairs, home and hobbies performance, and personal care.
MMSE
The MMSE is a widely used test of cognitive function among the elderly; it includes tests of orientation, attention, memory, language, and visual-spatial skills.
GDS
The GDS, developed by Dr. Barry Reisberg [54], provides an overview of the stages of cognitive function for those suffering from a primary degenerative dementia such as AD, classified with a range of clinical score [55].
We have also divided the cohorts based on ADNI grouping where disease severity is marked based on a defined clinical protocol [52] under supervision of Ronald Petersen.
Supplementary Table 1 provides the standard score ranges for definitions of healthy and the disease status for three scoring functions (CDR, MMSE, GDS, respectively).
Train-test and validation dataset for each classified group
CDR grouping yielded 1,019 demented and 418 healthy samples. Out of these 1,019 demented samples, 828 were kept for training-testing exercise and 191 as part of separate validation dataset. Similarly, the healthy cohort of 418 samples was divided into 293 and 125 for train-test and validation cohorts, respectively.
MMSE categorization produced 471 and 966 demented and healthy samples, respectively. Due to large bias of healthy samples, we removed some of the healthy samples and considered 650 healthy samples for train-test and validation experiments. 471 demented samples were divided into train-test and validation cohorts.
Similar bias on healthy samples was also observed in GDS-based grouping where only 106 samples were termed as demented and 1,331 were as healthy out of which 180 were randomly chosen for train-test and validation experiments.
ADNI grouping cohort is divided into 468 AD control, 359 MCI, and 312 healthy controls for training and testing experiment. Additionally, performances of the best training models were evaluated using a separate validation dataset comprising 116 AD, 88 MCI, and 78 healthy controls.
Table 1 provides a detailed overview of the number of samples for each category.
Table 1
Classification criteria of different clinical scoring methods
| Alzheimer’s disease detection scoring functions | ||||||||
| CDR | MMSE | GDS | ADNI | |||||
| Models | Samples | Models | Samples | Models | Samples | Models | Samples | |
| Train Test Dataset | Mild versus Healthy | MC: 500 | Mild versus Healthy | MC: 202 | Mild versus Healthy | MC: 25 | MCI versus Healthy | MC: 359 |
| HC: 293 | HC: 400 | HC:100 | HC: 312 | |||||
| Moderate versus Healthy | MoC: 274 | Moderate versus Healthy | MoC: 100 | Moderate versus Healthy | MoC: 26 | |||
| HC: 293 | HC: 400 | HC:100 | ||||||
| Severe versus Healthy | SC: 54 | Severe versus Healthy | SC: 7 | Severe versus Healthy | SC: 12 | |||
| HC: 293 | HC: 400 | HC:100 | ||||||
| All Demented versus Healthy | DC: 828 | All Demented versus Healthy | DC: 309 | All Demented versus Healthy | DC: 63 | AD versus Healthy | DC:468 | |
| HC: 293 | HC: 400 | HC: 100 | HC: 312 | |||||
| Validation Dataset | Mild versus Healthy | MC: 101 | Mild versus Healthy | MC: 100 | Mild versus Healthy | MC: 20 | MCI versus Healthy | MC: 88 |
| HC: 125 | HC: 250 | HC: 80 | HC: 78 | |||||
| Moderate versus Healthy | MoC: 60 | Moderate versus Healthy | MoC: 60 | Moderate versus Healthy | MoC: 20 | |||
| HC: 125 | HC: 250 | HC: 80 | ||||||
| Severe versus Healthy | SC: 30 | Severe versus Healthy | SC: 2 | Severe versus Healthy | SC: 3 | |||
| HC: 125 | HC: 250 | HC: 80 | ||||||
| All Demented versus Healthy | DC: 191 | All Demented versus Healthy | DC: 162 | All Demented versus Healthy | DC: 43 | AD versus Healthy | DC: 116 | |
| HC:125 | HC:250 | HC: 80 | HC: 78 | |||||
MC, mild cohort; MoC, moderate cohort; SC, severe cohort; HC, healthy cohort, MCI, mild cognitive impairment; AD, Alzheimer’s disease.
Pre-processing of MR images
NIFTI/DICOM to JPEG conversion of the MR images
Initially all 3D data (NIFTI format) of the brain MR images collected from the ADNI database were converted into 2D slices for the ease of handling the images and further pre-processing of the images. 2D images saved in DICOM format were converted into JPEG format. An in-house code was written to perform NIFTI/DICOM to JPEG conversion of the MR images. In this case different functions, [dicomread(), dicominfo(), and rgb2gray()], of MATLAB Image Processing Toolbox [56] have been used. dicomread() reads the image data of the dicom files. dicominfo() reads the metadata of the dicom file. rgb2gray() converts the RGB image to grayscale image.
Orientation
Since quality of data is subjected to the efficiency of the operator and flexibility of the head of the subject, the orientation of brain substructures differs in subjects. Hence, this variation of orientation of the brain images needs to be adjusted and normalized with respect to fix reference frame. We oriented the images that seemed to be inclined due to image collection variations.
The following formula and corresponding rotation matrix were used to rotate the image at an angle, θ toward positive direction of x-axis assuming the centroid at the center of rotation
where, (x′, y′) is the new coordinates of a pixel whose current coordinate is (x,y)
Processing of MR images
Automatic detection of CC
An image segment is best understood by its neighborhood if the difference in average intensity of two regions is categorized in different intensity level. This categorization of the intensity range (0,255) under sixteen specific intensity window e.g., 0, 16, 32, 48 . . . 224, 240 was done using the following formula:
where round(x) implies largest integer ≤x, I′ (i, j) and I (i, j) are the categorized intensities and original intensity respective of the pixel having coordinate (i,j).
It primarily isolates CC from its neighborhood. We used basic morphological functions like dilation and erosion using MATLAB in-built imdilate() and imerode() functions to join unwanted breakages or to remove unwanted branches. At this point, the largest highlighted region of the centroid part of the head is supposed to be a sub/superset of CC. We use bwconncomp(), regionprops(), and bwperim() functions to detect possible CC at this stage.
Further, we use a novel in-house shape matching algorithm to select the best matched CC. Our approach is tuned for recognizing a shape using the concept of a closed walk through the boundary of a segmented region. We searched for a defined geometrical pattern, which is supposed to be similar to the shape of our target object, i.e., a well segmented complete CC (Supplementary Figure 1A), considering biological variation from human to human, and simultaneously different to the shape of any object other than a well segmented CC. The set of objects, other than a complete well segmented CC, includes every possible arbitrary segmentation with or without partly or complete CC, i.e., an object containing the whole CC along with some branches connected at rostrum (Supplementary Figure 1B), genu or splenium region or an object containing a sub-part of anterior or posterior CC with or without branches or an object containing no such part which is shared with CC. Although there is no such complete similarity in geometrical pattern among the objects of the set of non-native CCs, but all of those are supposed to differ with the pattern of a complete well segmented CC. In this way, we manually selected 152 well distinguished CC and 1,773 non-native CC structures, which contain various types of small to large dissimilarity with respect to native CC regions.
An algorithm was developed that aimed to calculate the change in angles of the periphery points of the segmented CC. While traversing through the boundary of CC, the algorithm starts from the top-left point (pixel) of an object (e.g., CC) and proceeds toward right or down or left or up direction across the boundary to complete a closed walk. It does not revisit any pixel once traversed, except the starting one. Now traversing to the next neighbor pixel can be done in eight possible ways (Supplementary Figure 1C) and a value is assigned for the change in angle to every possible direction. So, the random walk starts from a point (pixel) to its neighbor (Supplementary Figure 1D) and find the change in angle. Supplementary Figure 1E shows the probable changes in angle from periphery point 1 to 2, 2 to 3, 3 to 4 and 4 to 5 as θ1, θ2, θ3 and θ4 respectively, while traversing from 1 to 5. Here, the cumulative change in angle is measured, which, at point 1, point 2, point 3 and point 4 are θ1, θ1 + θ2, θ1 + θ2 + θ3 and θ1 + θ2 + θ3 + θ4, respectively. It continues this way until return to the starting point.
The cumulative change of angles derived from native and non-native CC regions were used as feature vector to train a radial basis function kernel of SVM classification and testing was performed using a 5-fold cross validation protocol dividing the whole data into train (80%) and test (20%) test set. Accuracy and area under curve (AUC) values were calculated from the 5-fold validation tests.
Feature extraction
MATLAB function regionprops() has been used to find most of the structural features. 28 structural and intensity based features (Supplementary Table 2) including 1) area based features (e.g., area of head, CC, convex hull of CC, ratio of CC to its convex hull, bending coefficient and solidity and extent), 2) length based features (e.g., perimeter of CC, ratio of perimeter to its convex hull, length of major and minor axis of respective convex hull, maximum horizontal and vertical span of segmented CC, maximum inner horizontal and vertical span of segmented CC, width and height of the bounding box covering the CC), 3) point based features (e.g., centroid of respective convex hull), 4) geometric features (eccentricity, orientation, mean and standard deviation of tangent through the boundary), and 5) intensity based features (e.g., intensity threshold at which the image becomes binary, maximum, minimum, average and total intensity) have been isolated. Size and shape of the segmented CC were calculated based on the following parameters/features.
Area and perimeter of CC
Area of CC was defined as the total number of pixels that fill the CC structure identified via automated detection algorithm from each brain slice. We calculated a proportional value by dividing the area of CC with head area of the respective patient or convex hull area of segmented CC. Perimeter is calculated by total number of boundary pixels for the segmented CC.
Convex hull of CC
For calculating different features representing size and shape of CC, we have calculated the convex hull of our segmented region of interest. Convex hull or envelope of some connected pixels of a segmented region is the smallest convex set that contains all the pixel of the segmented region. Area of convex hull of CC is calculated by the total no pixel in the smallest convex set of the CC.
Length and width of CC
Length and width of CC were calculated as the length (in pixels) of the major axis and minor axis of the ellipse that has the same normalized second central moments of CC. Here, we simply divided the values by height or width of the image.
Centroid: X-coordinate and Y-coordinate
It specifies the center of mass of the region. The first element of centroid is the horizontal coordinate (X-coordinate) of the center of mass, and the second element is the vertical coordinate (Y-coordinate).
Eccentricity
Eccentricity is the measure that determines how much a conic section deviates from being circular. The eccentricity is the ratio of the distance between the foci of the ellipse and its major axis length. The value is between 0 (circle) and 1(straight line). So, in other words, eccentricity value of the identified CC region indicates whether the shape of the CC is circular or elliptical.
Sloping (orientation along X-axis)
It specifies the angle between the x-axis and the major axis of the ellipse that has the same second-moments as the region.
Bending coefficient
It is the measure of bending of a segmented CC. It is based on the concept that more the CC bends, the area of the convex hull increases. It is calculated as follows
Tangent
Tangent is calculated by analyzing the slope formed by the adjacent points through the perimeter of the CC and fitting it to a normal distribution. Here, mean and standard deviation of the fitted normal distribution are the measures of the curvature.
Intensity features
Histogram analysis using MATLAB in-built function imhist() was used to calculate intensity based features like mean or total intensity.
Classification and validation using SVM
Features related to shape and size of the CC were utilized for classification and subsequent prediction of dementia via SVM, a supervised machine learning technique. Here, we have used a 100-fold cross validation method where 100 times randomly selected 80%of the data has been used to train the SVM model and the rest 20%has been used as test data. In both train and test dataset, the ratio of healthy and demented samples remains the same. However, features extracted from each brain slice of the individuals (demented and healthy) were used for classification. Supplementary Table 3 provides the number of slices used for train-test and validation cohorts. LibSVM [57, 58] was used to build the classifier models and radial basis kernel function was implemented via 100-fold cross validation method. Performance on the test models was measured using average of the hundred random trials. Average accuracy AUC values were obtained. Performance of the best models obtained from the training-testing experiment was further testified using the separate validation cohort.
Comparison of performance
Standard performance metrics such as sensitivity, specificity, precision, F1 score, Mathew’s correlation coefficient (MCC), etc. were calculated along with the receiver operating characteristic (ROC) statistics to evaluate the performance of our models in different scenario.100 fold randomized selection of the training (80%data) and testing (20%data) followed by SVM-based classification trials were performed using healthy and demented patients data in different category (e.g., healthy versus mild, healthy versus moderate) under different clinical rating scale (CDR, MMSE, GDS, and ADNI grouping, respectively). A pre-separated validation dataset for each category were tested against the best of the 100 models generated during training-testing. AUC value was calculated from the ROC curve of the best performing model as a basic measure of performance. Our training model is able to predict a single entity with a probability threshold estimate of being demented (D) or healthy (H) where, P(D) + P(H) = 1. The following parameters were calculated to measure the performance of our models in different scenario.
where TP, true positive, TN, true negative; FP, false positive; FN, false negative.
RESULTS
Comparison of the datasets
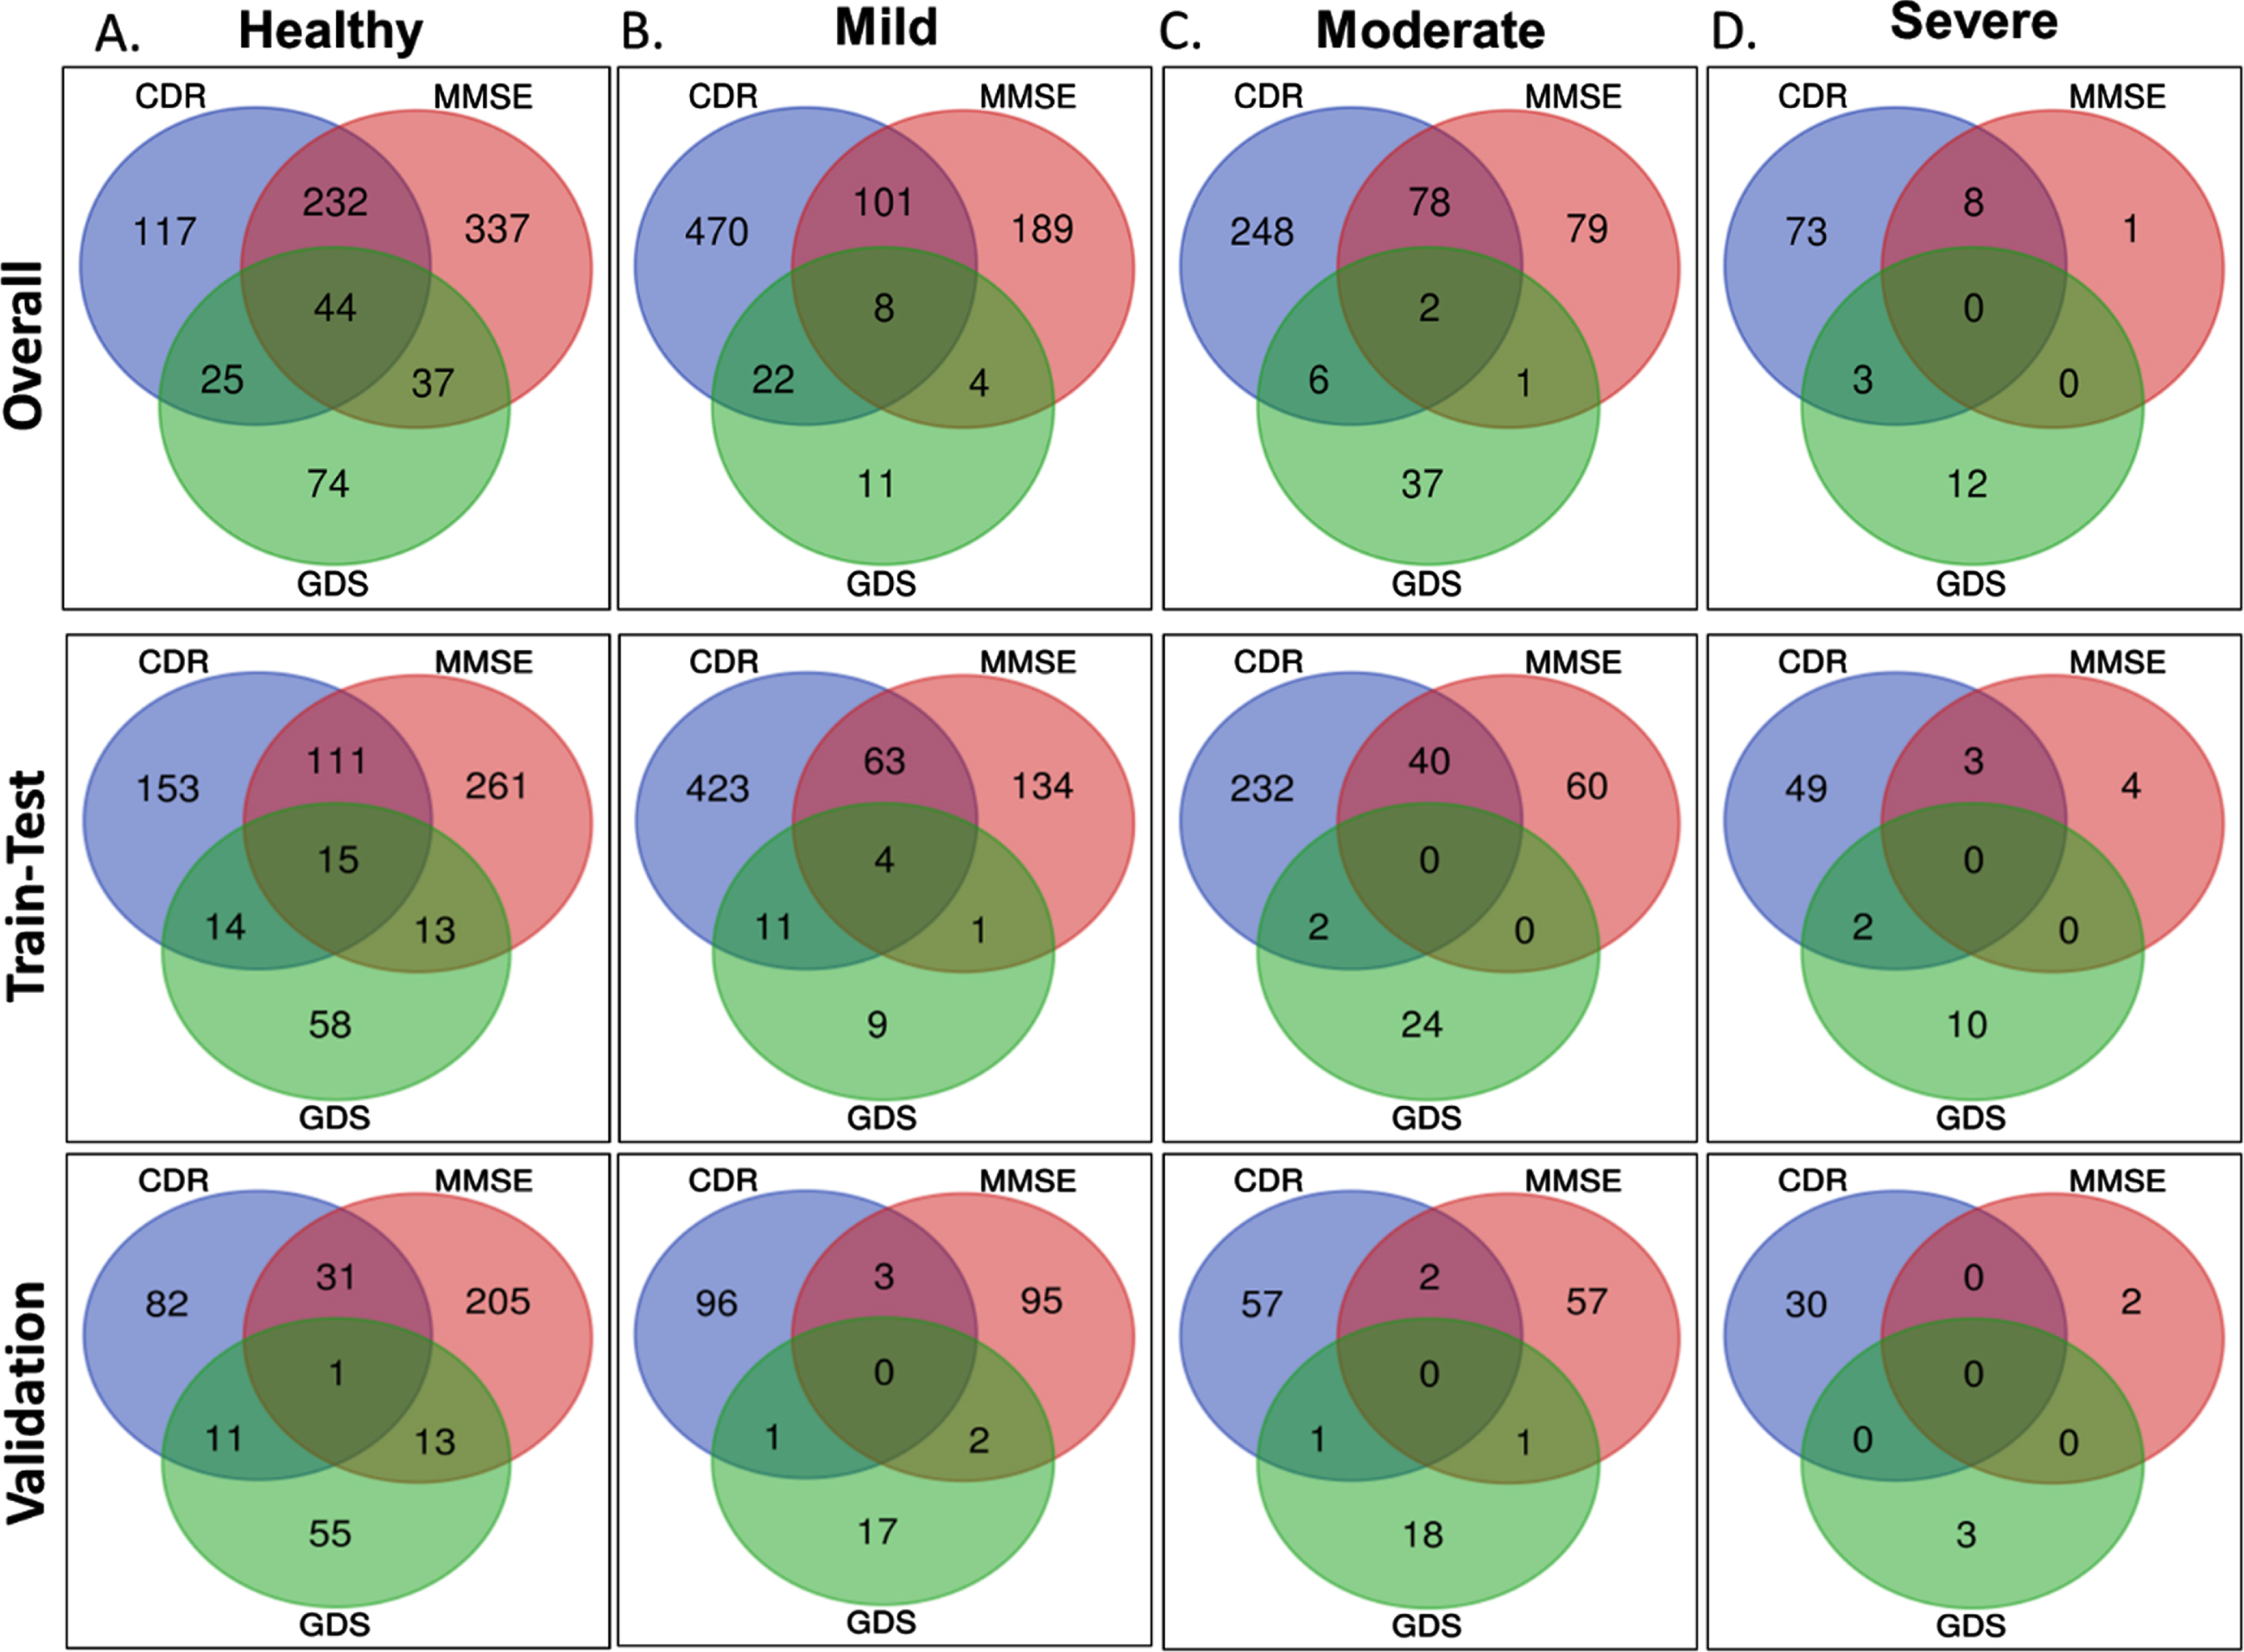
As described in the Methods, the ADNI dataset comprising 1,437 MRI of patients and healthy samples were categorized into demented and healthy using three separate clinical scoring criteria. However, the number of healthy and demented samples suggested by these three scoring functions varies greatly (Table 1). We also observed very low similarity while comparing categorization from three scoring functions (Fig. 1A-D), i.e., when a patient is predicted as moderately demented in CDR definition, there is a strong possibility of predicting the same patient as moderately demented under MMSE or GDS. Interestingly, only 44 samples were diagnosed as ‘healthy’ by all the three scoring methods whereas similar lower number of overlap also observed within the three different demented categories, mild, moderate, and severe, respectively. Hence, we decided to classify the datasets separately instead of pooling the data together. Considering the significant over prediction of healthy samples from MMSE and GDS methods we removed some of the healthy sample to maintain the similar ratio of healthy versus demented samples in three different datasets. Similarly, too few samples were diagnosed as ‘severe’ by MMSE and GDS functions (Fig. 1D). Hence, severe category samples from MMSE and GDS were not used for classification.
Fig. 1
Comparison of the datasets. Panel A, B, C, and D provide the overlap and intersection of samples categorized CDR, MMSE, and GDS scoring schemes into healthy, mild, moderate, and severe categories, respectively. Upper, middle, and lower panels present the samples for overall, training-testing, and validation datasets, respectively.
ADNI grouping cohort is divided into 584 AD control, 447 MCI, and 390 healthy controls. Comparison of this subset with the other three sets suggests higher similarity with CDR categorization than GDS and MMSE, respectively (Supplementary Figure 2).
Automated detection of CC from brain slices
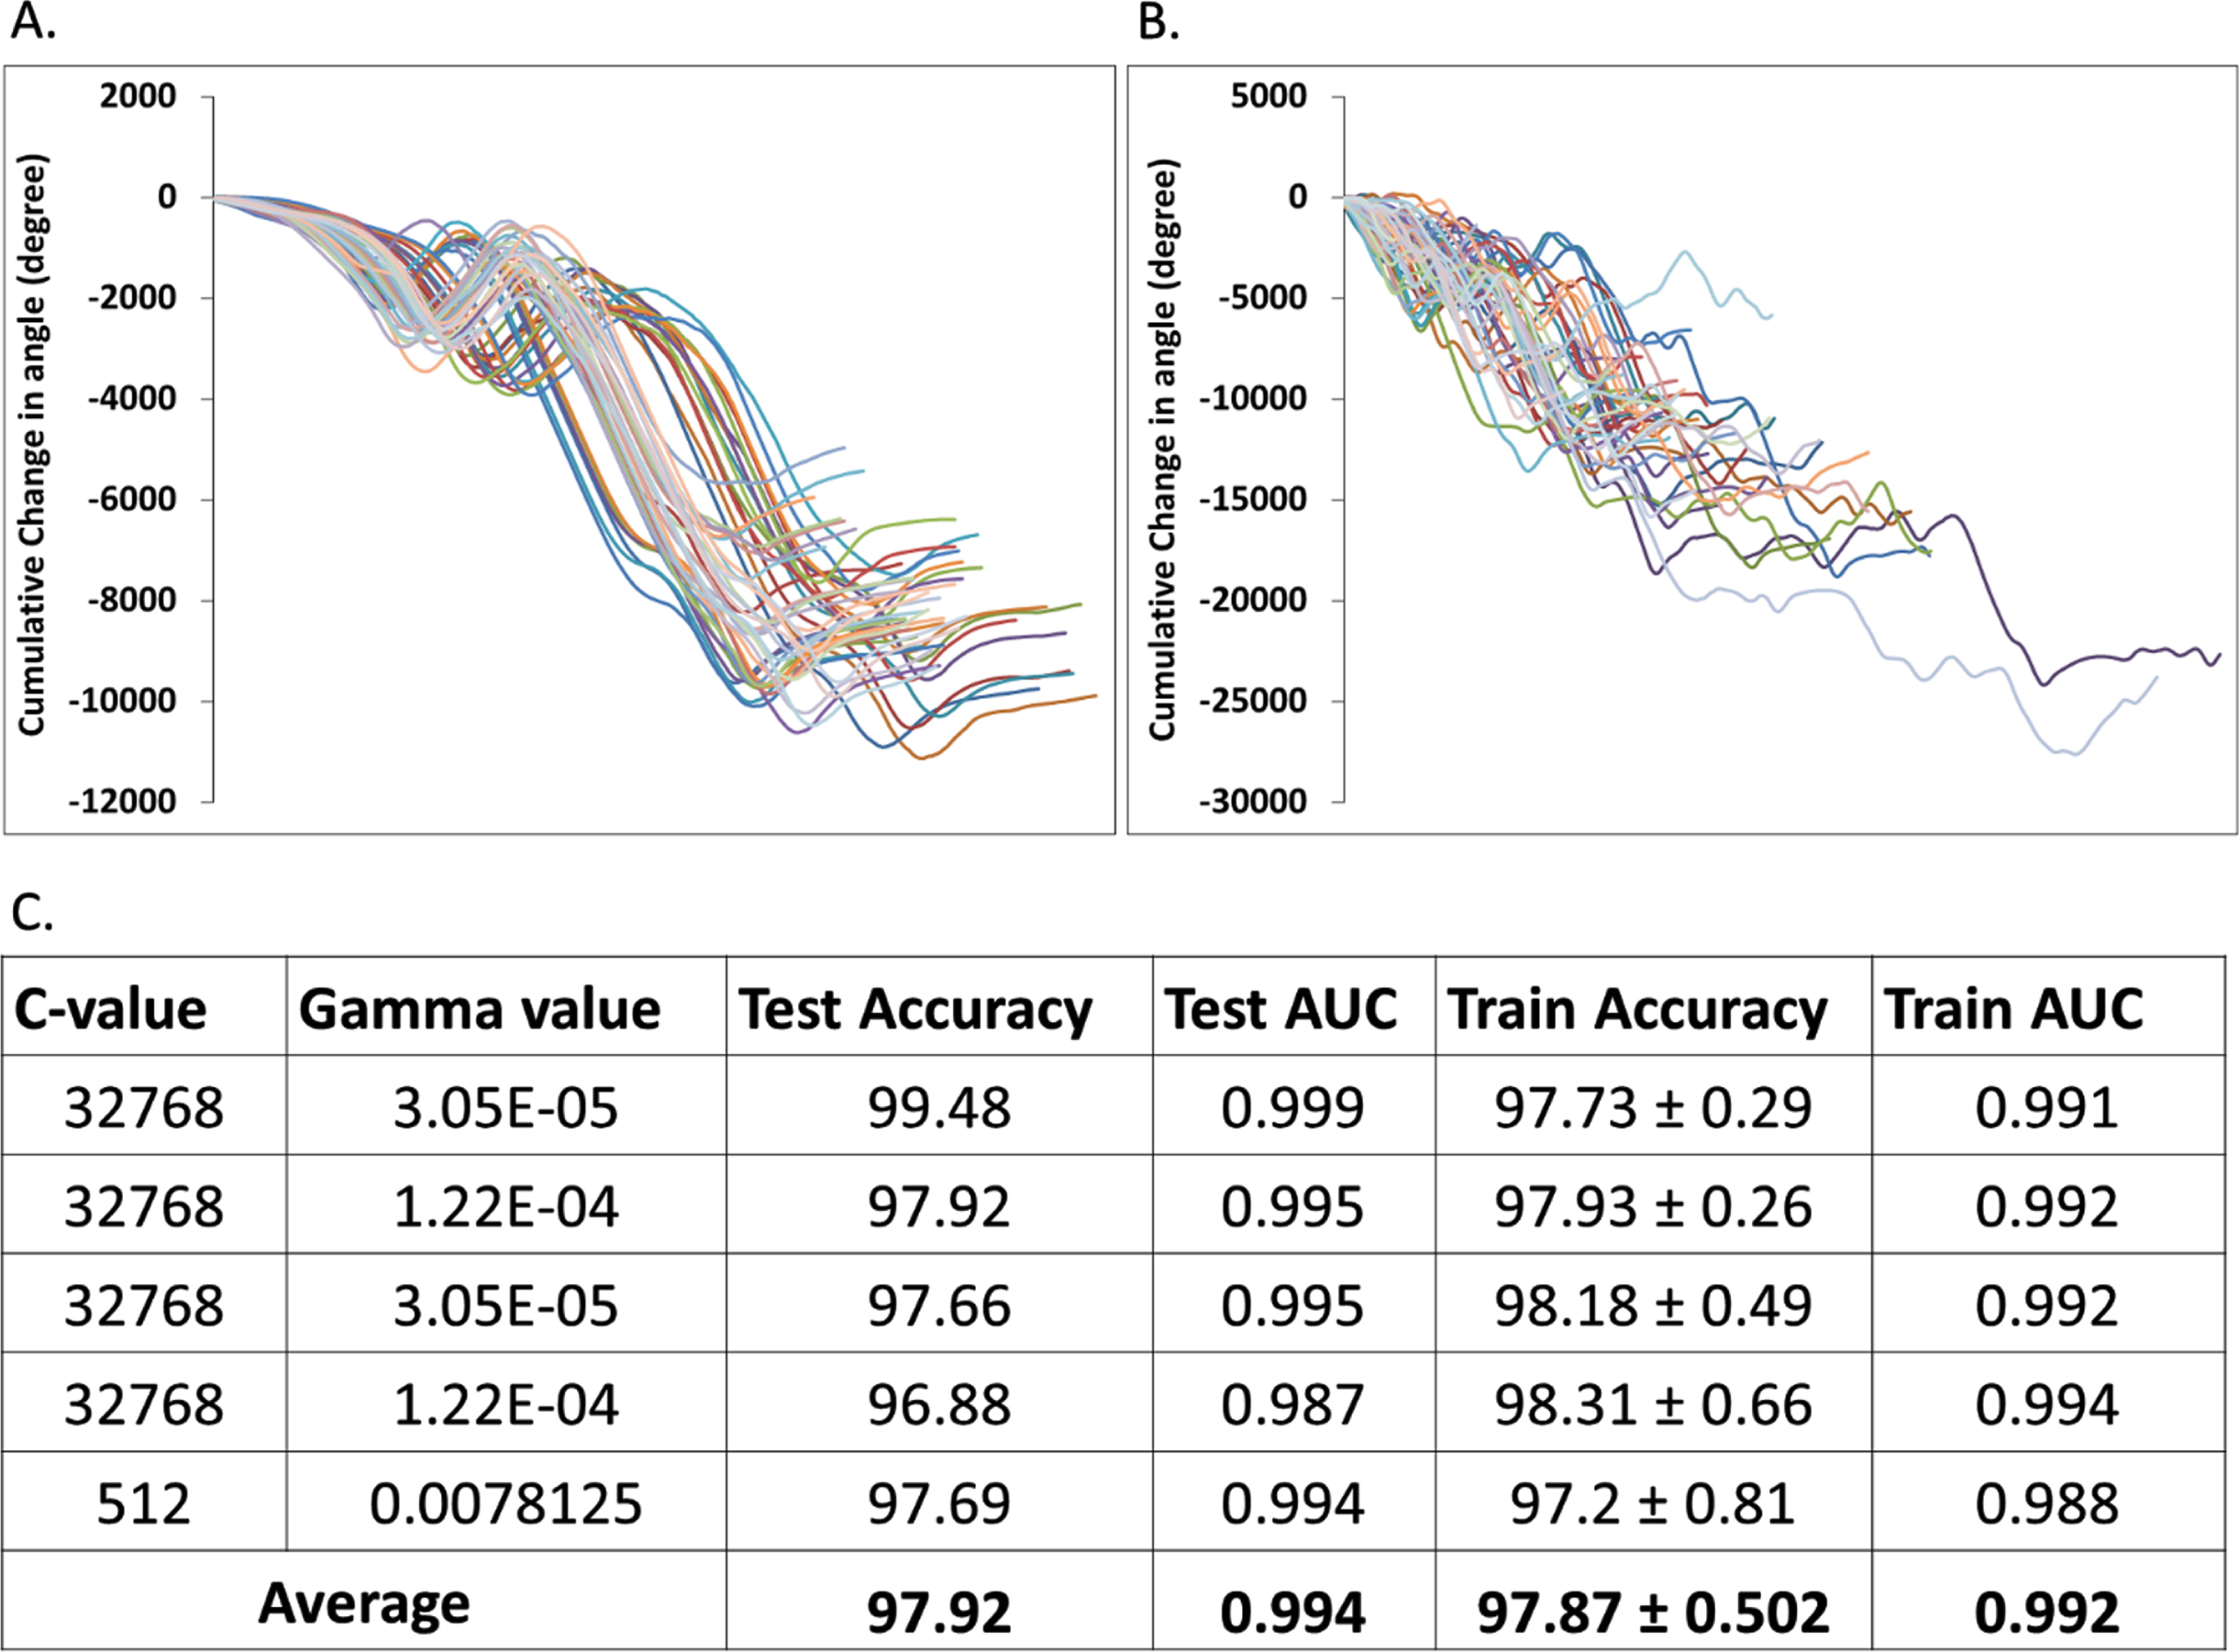
Detection of CC from each slice of the MR images is a critical step and requires manual interventions. To overcome the manual involvement and to reduce the error and bias associated with manual selection, we developed an algorithm to detect CC like sub-structures automatically from the brain slices. We have calculated the change of angles of CC periphery points and generated the distribution plots of the cumulative change of angles from manually selected 152 native CC sub-structures (Fig. 2A). Similar distribution plots for 1773 non-native CC like structures were also generated (Fig. 2B). Using the native and non-native CC like structures and their change of angles of periphery points (Supplementary Figure 1), we trained a SVM method to classify and further predict CC like structure directly from a brain slice. Training-testing experiments suggest very high accuracy and AUC values for our automated CC region detection method (Fig. 2C). This algorithm was further used to detect the CC region from all the brain slices of the datasets used in this study.
Fig. 2
Automated detection of corpus callosum (CC). Panel A and B show the distribution of cumulative change of angles of CC periphery points extracted from native CC sub-structures and non-native CC like structures, respectively. Panel C tubulizes the performance of the automatic CC detection module estimated via 5-fold cross validation training-testing experiments.
Distinguishable structural and morphological features of corpus callosum
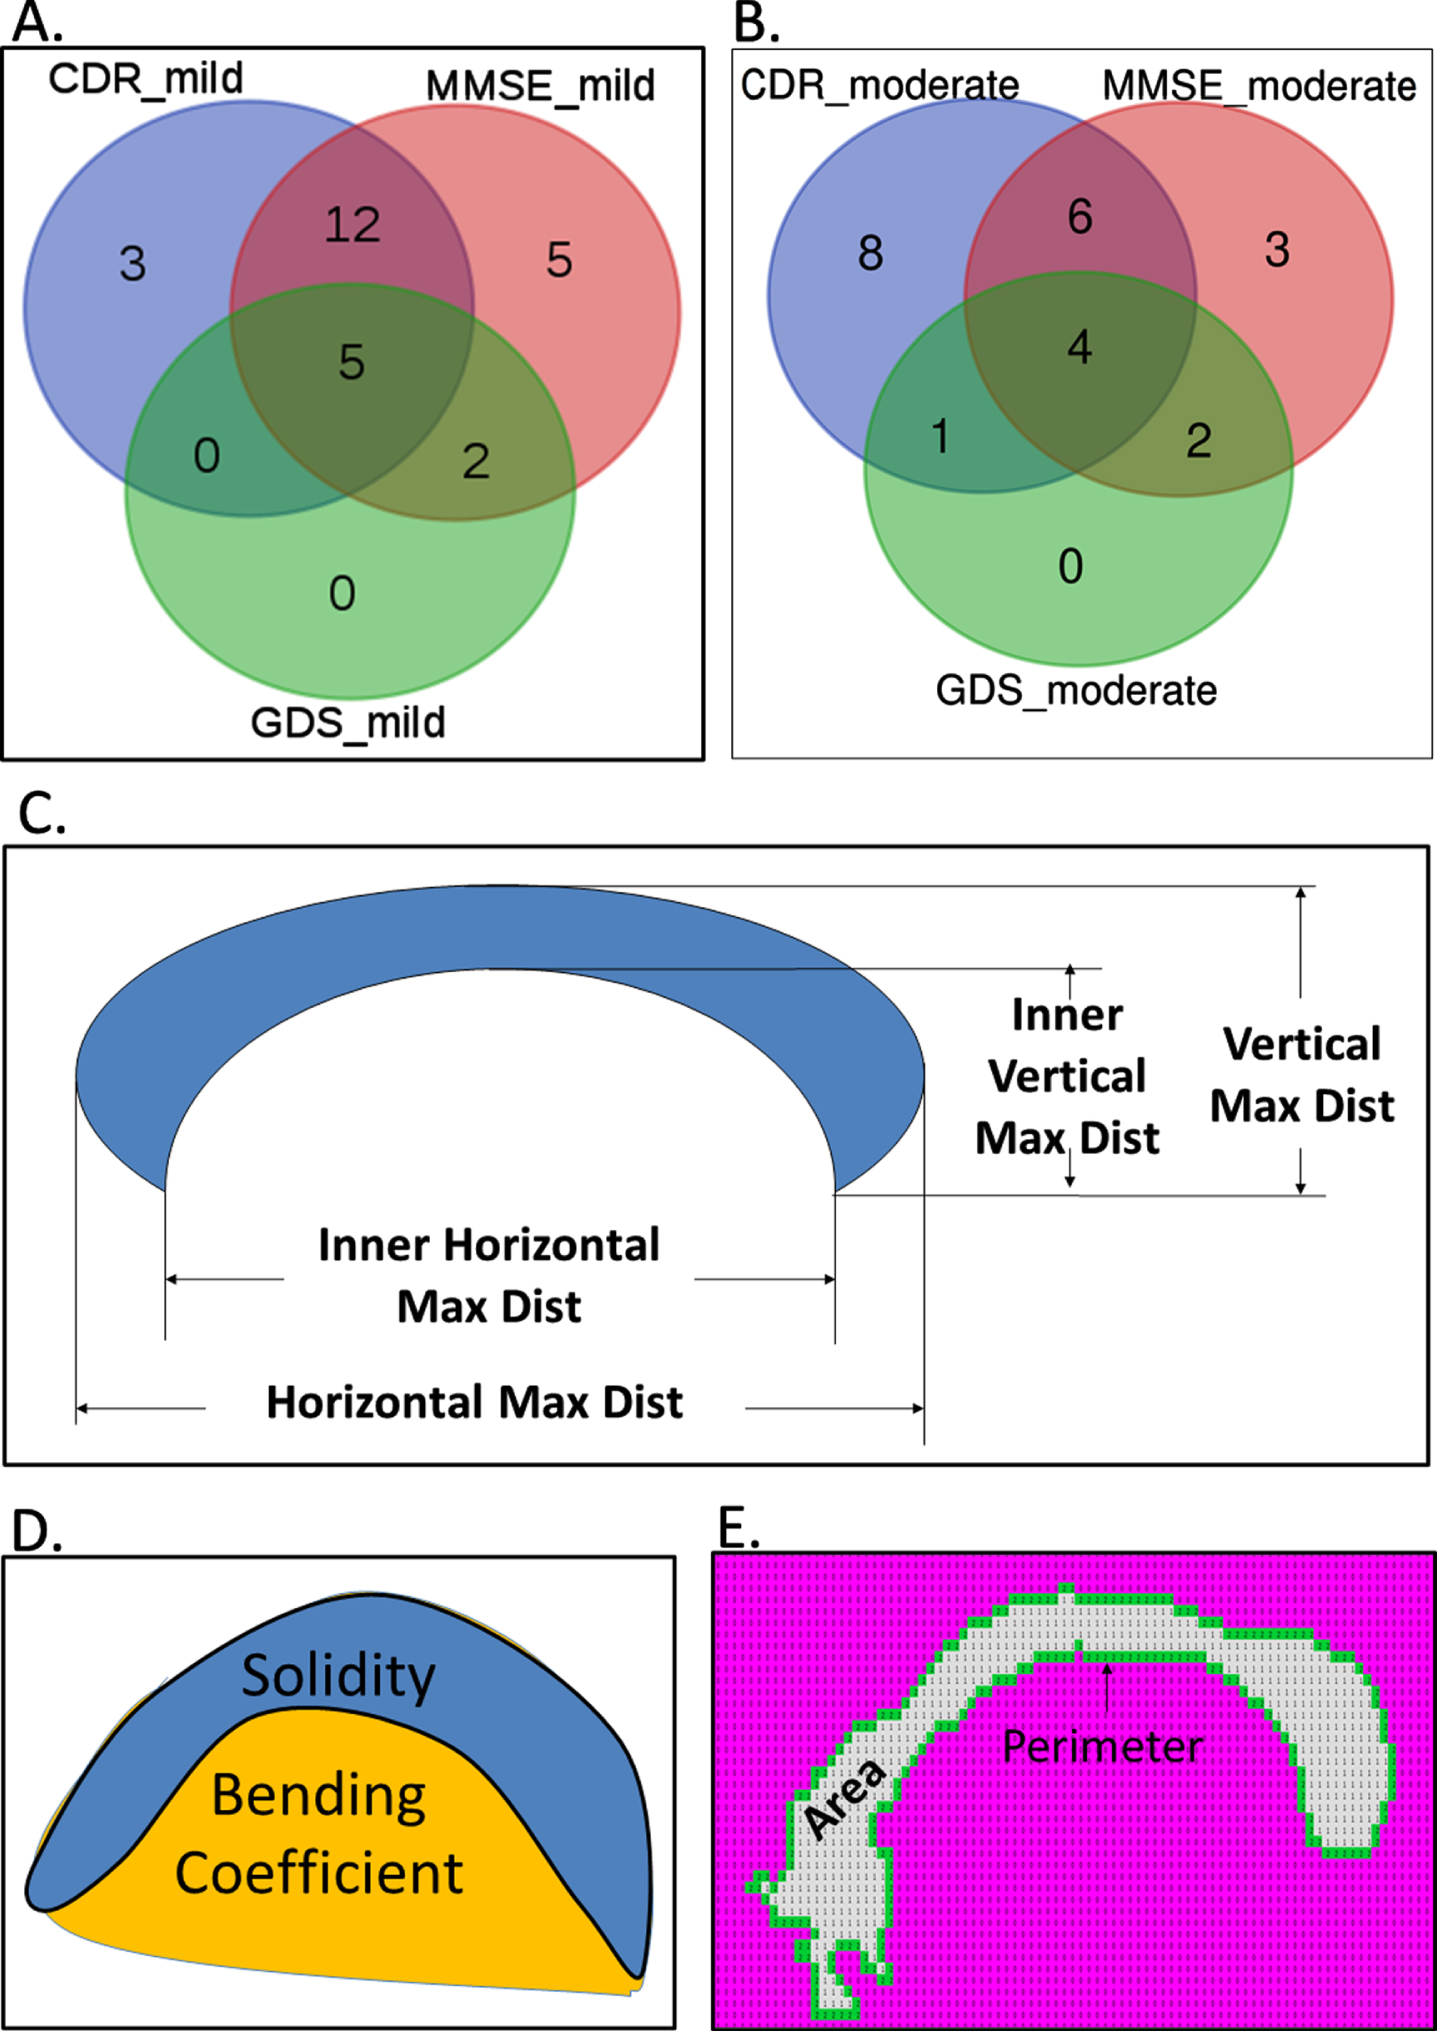
Various features were calculated from the identified and segmented CC isolated from demented and non-demented samples. Figure 3A shows the 20, 24, and 7 such structural features, which were found to be significantly (p < 0.01) different between healthy and mild demented patients, categorized using CDR, MMSE, and GDS clinically rating scales, respectively. Similarly, 19, 15, and 7 features were found to be significantly distinguishable between healthy and moderate samples categorized by CDR, MMSE, and GDS, respectively (Fig. 3B). Figure 3C-F highlight some of the shape-based features like area, perimeter, bending coefficient and solidity, inner and outer maximum horizontal and vertical span of CC were found to be common in differentiating healthy brain samples from that derived from moderate and mild AD samples. Supplementary Figures 3 and 4 provide comparative profile of some of the CC shape-based features that showed significant difference from healthy samples to both mild and moderate AD patients categorized by CDR and MMSE, respectively.
Fig. 3
Structural and morphological features of corpus callosum (CC) that are significantly different between demented and healthy samples. Venn diagrams show the overlap of the CC features that were found to be significantly different (p < 0.01) between healthy and mild (A), healthy and moderate (B), respectively. Panel C, D, and E provide pictorial depiction of the measures of length and thickness, bending, and area of the CC regions, respectively.
Training-testing and model validation
Our initial analysis with SVM and random forest suggested better performance of SVM for the test datasets (Supplementary Table 4). Hence, here we used SVM-based classifications only. In addition, as our feature dataset is relatively smaller, so we preferred SVM instead of neural network-based classifications. SVM was used via implementation of a 100-fold cross validation protocol to classify the data in which randomly selected 80%of the data has been used to train the SVM model and the remaining 20%has been used as test data. Features extracted from each brain slice of the individuals (demented and healthy) were used for classification. Average test accuracies (mean of top 25 model results) of 86.27%, 86.57%, and 92.74%were achieved for CDR, MMSE, and GDS score-based mild AD groups, respectively (Table 2). Similarly, 89.53%, 92.46%, and 93.85%test accuracy values were observed for moderate cases categorized by CDR, MMSE, and GDS scores, respectively. Only CDR-based severe cases were testified via SVM model, which yielded 96.86%accuracy (Table 2). ROC plot analysis was performed using the test set results obtained from the best performing models for three separate clinical rating schemes. True positive rate or sensitivity and false positive rate or 1-specificity values for each classified group were plotted in Fig. 4A-C and Fig. 5A. Best training models from each category yielded very high AUC values ranging from 0.92 to 0.98 for classifying the test set data.
Table 2
Mean test accuracies (calculated for top 25 of 100 runs) for detection of Alzheimer’s disease
| Scoring Functions for Detection of AD | Model Category | |||||
| Mild versus Healthy | Moderate versus Healthy | Severe versus Healthy | ||||
| Mean Test Accuracy (%) | Mean Test AUC | Mean Test Accuracy (%) | Mean Test AUC | Mean Test Accuracy (%) | Mean Test AUC | |
| CDR | 86.26±0.9276 | 0.9199±0.0117 | 89.53±0.9164 | 0.9519±0.0089 | 96.86±0.7771 | 0.9790±0.0097 |
| MMSE | 86.52±0.9099 | 0.9157±0.0126 | 92.46±0.7616 | 0.9478±0.0149 | ||
| GDS | 92.74±1.4427 | 0.9247±0.0355 | 93.85±1.7368 | 0.9196±0.0425 | ||
| MCI versus Healthy | AD versus Healthy | |||||
| Mean Test Accuracy (%) | Mean Test AUC | Mean Test Accuracy (%) | Mean Test AUC | |||
| ADNI Grouping | 84.87±1.75 | 0.93±0.005 | 91.86±0.948 | 0.97±0.003 | ||
Fig. 4
Benchmarking results for test and validation datasets. Panels A, B, and C show the receiver operating characteristics (ROC) curves via plotting the sensitivity and 1-specificity values obtained for classification of test sets using the CDR, GDS, and MMSE categorization based healthy and demented groups, respectively. Panels D, E and F show the ROC plots for the separate validation dataset using the CDR, GDS, and MMSE categorization based healthy and demented groups, respectively. Area under curve (AUC) values correspond to each ROC curve are mentioned.
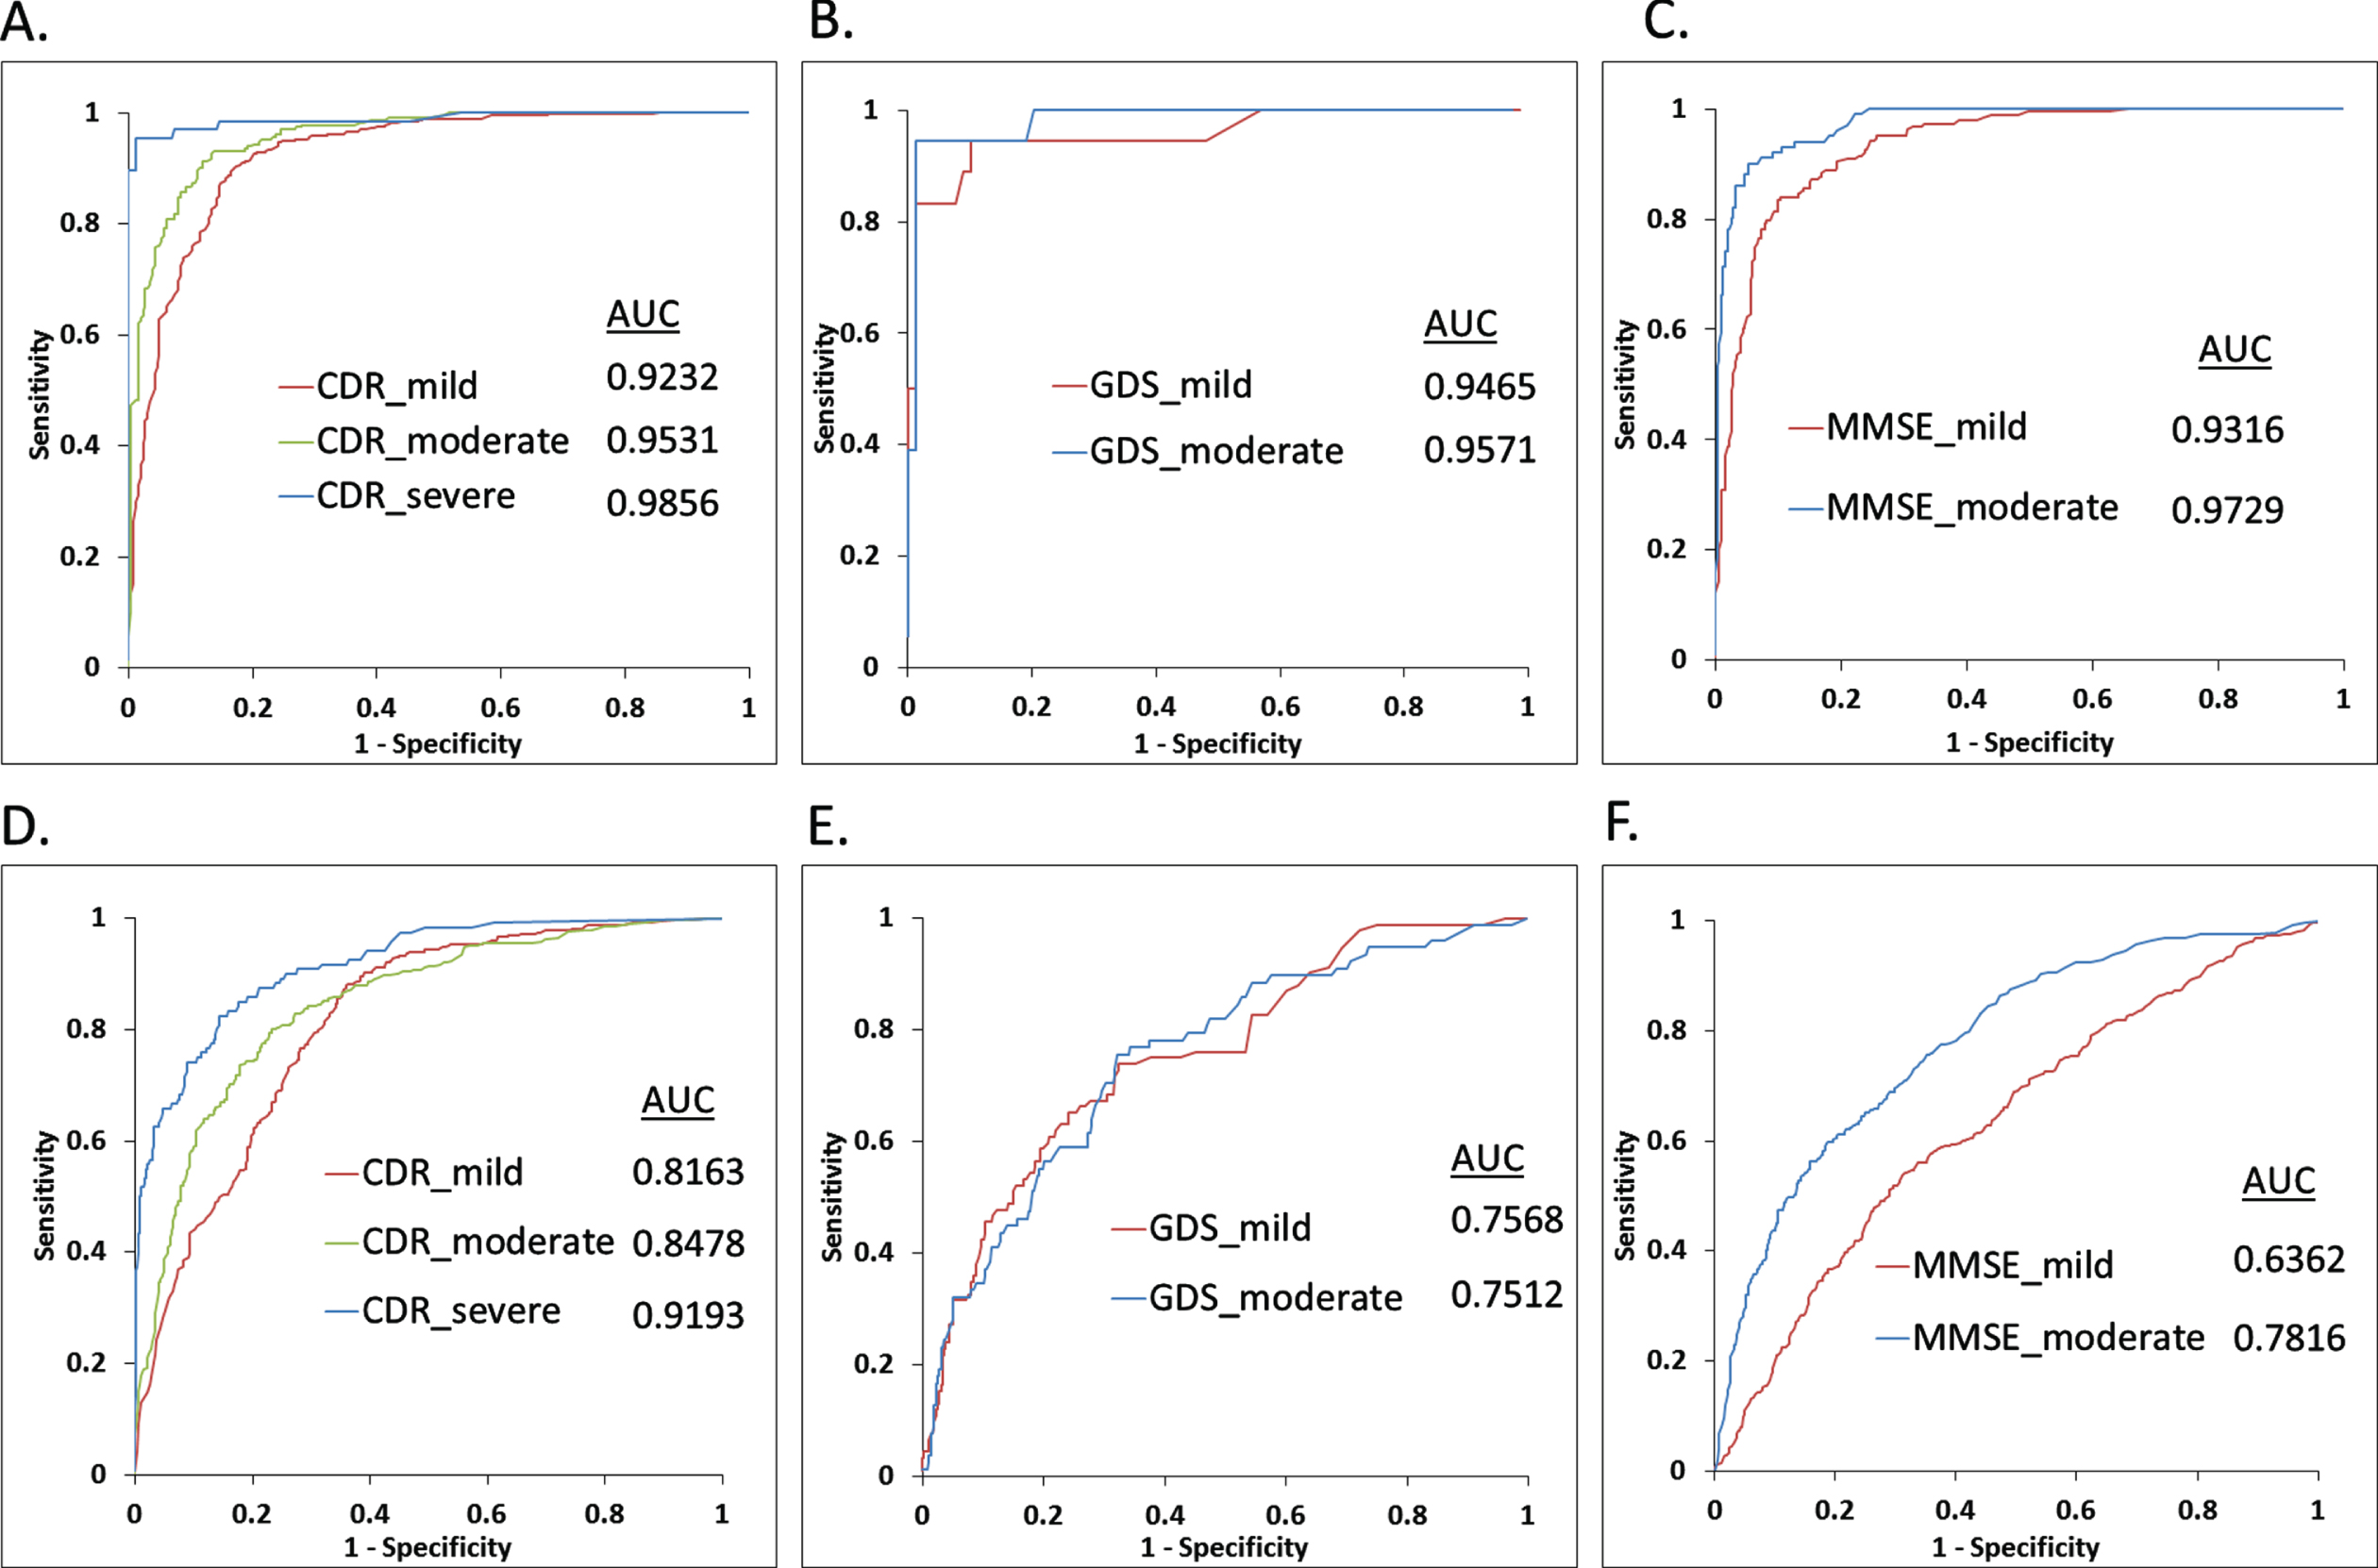
Fig. 5
Benchmarking results for test and validation datasets using ADNI grouping cohort. Panel A shows the receiver operating characteristics (ROC) curves via plotting the sensitivity and 1-specificity values obtained for classification of test sets using the ADNI categorization based healthy and demented groups, respectively. Panel B shows the ROC plots for the separate validation dataset. Area under curve (AUC) values correspond to each ROC curve are mentioned.
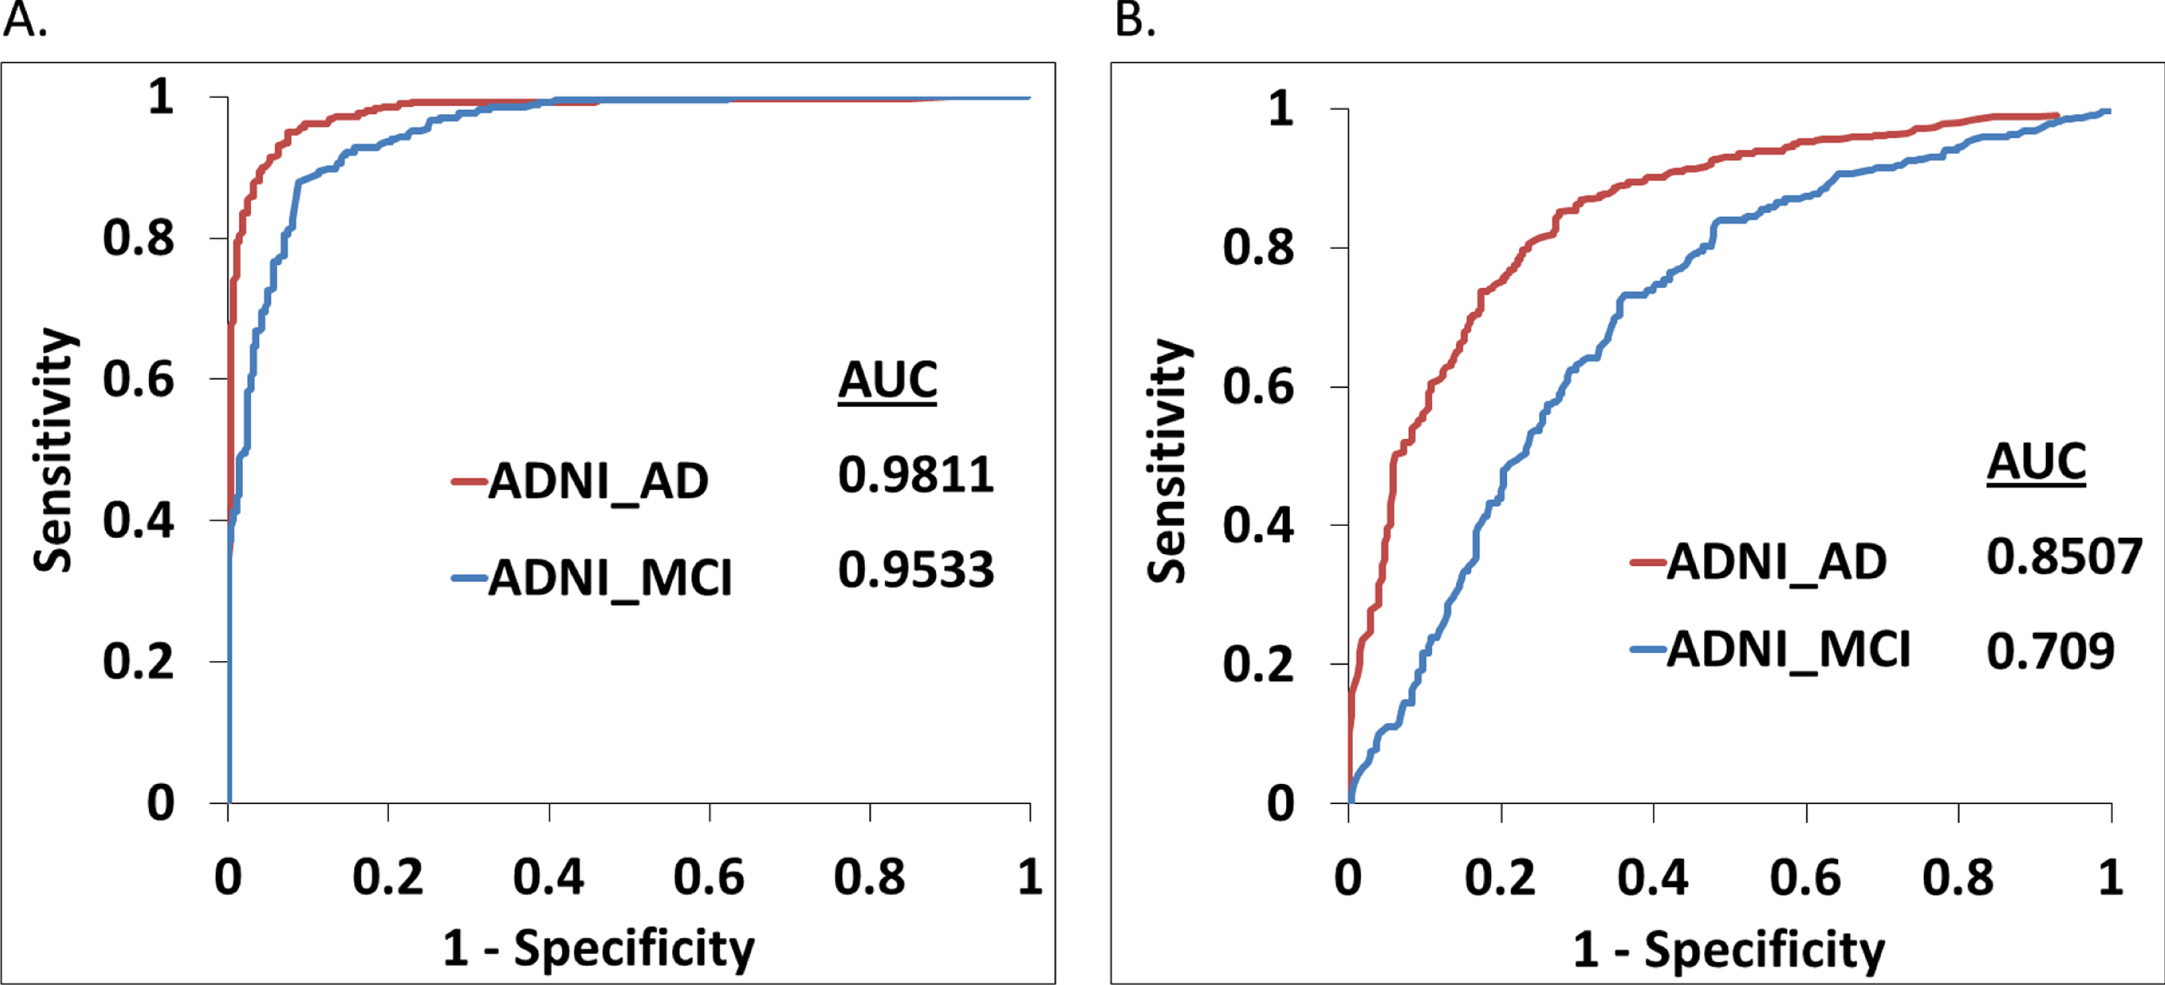
Performance of the best training models was further verified using a separate validation dataset (Table 1) derived from CDR, MMSE, GDS, and ADNI categorizations, respectively. For the CDR-based validation dataset, performance of the classifier model was quite good with 0.82, 0.85, and 0.92 AUC values for distinguishing mild, moderate, and severe AD samples (Fig. 4D). Similar performance is also observed for the ADNI grouping validation cohort (Fig. 5B). However, performance of the model with the GDS validation datasets (mild and moderate AD) are moderate, whereas the MMSE-based mild category was not so well classified by the corresponding training model (Fig, 4E, F). Supplementary Table 5 provides detailed benchmarking results of the validation datasets including accuracy, sensitivity, specificity, precision, F1, and MCC values for each score threshold.
Comparison of performances
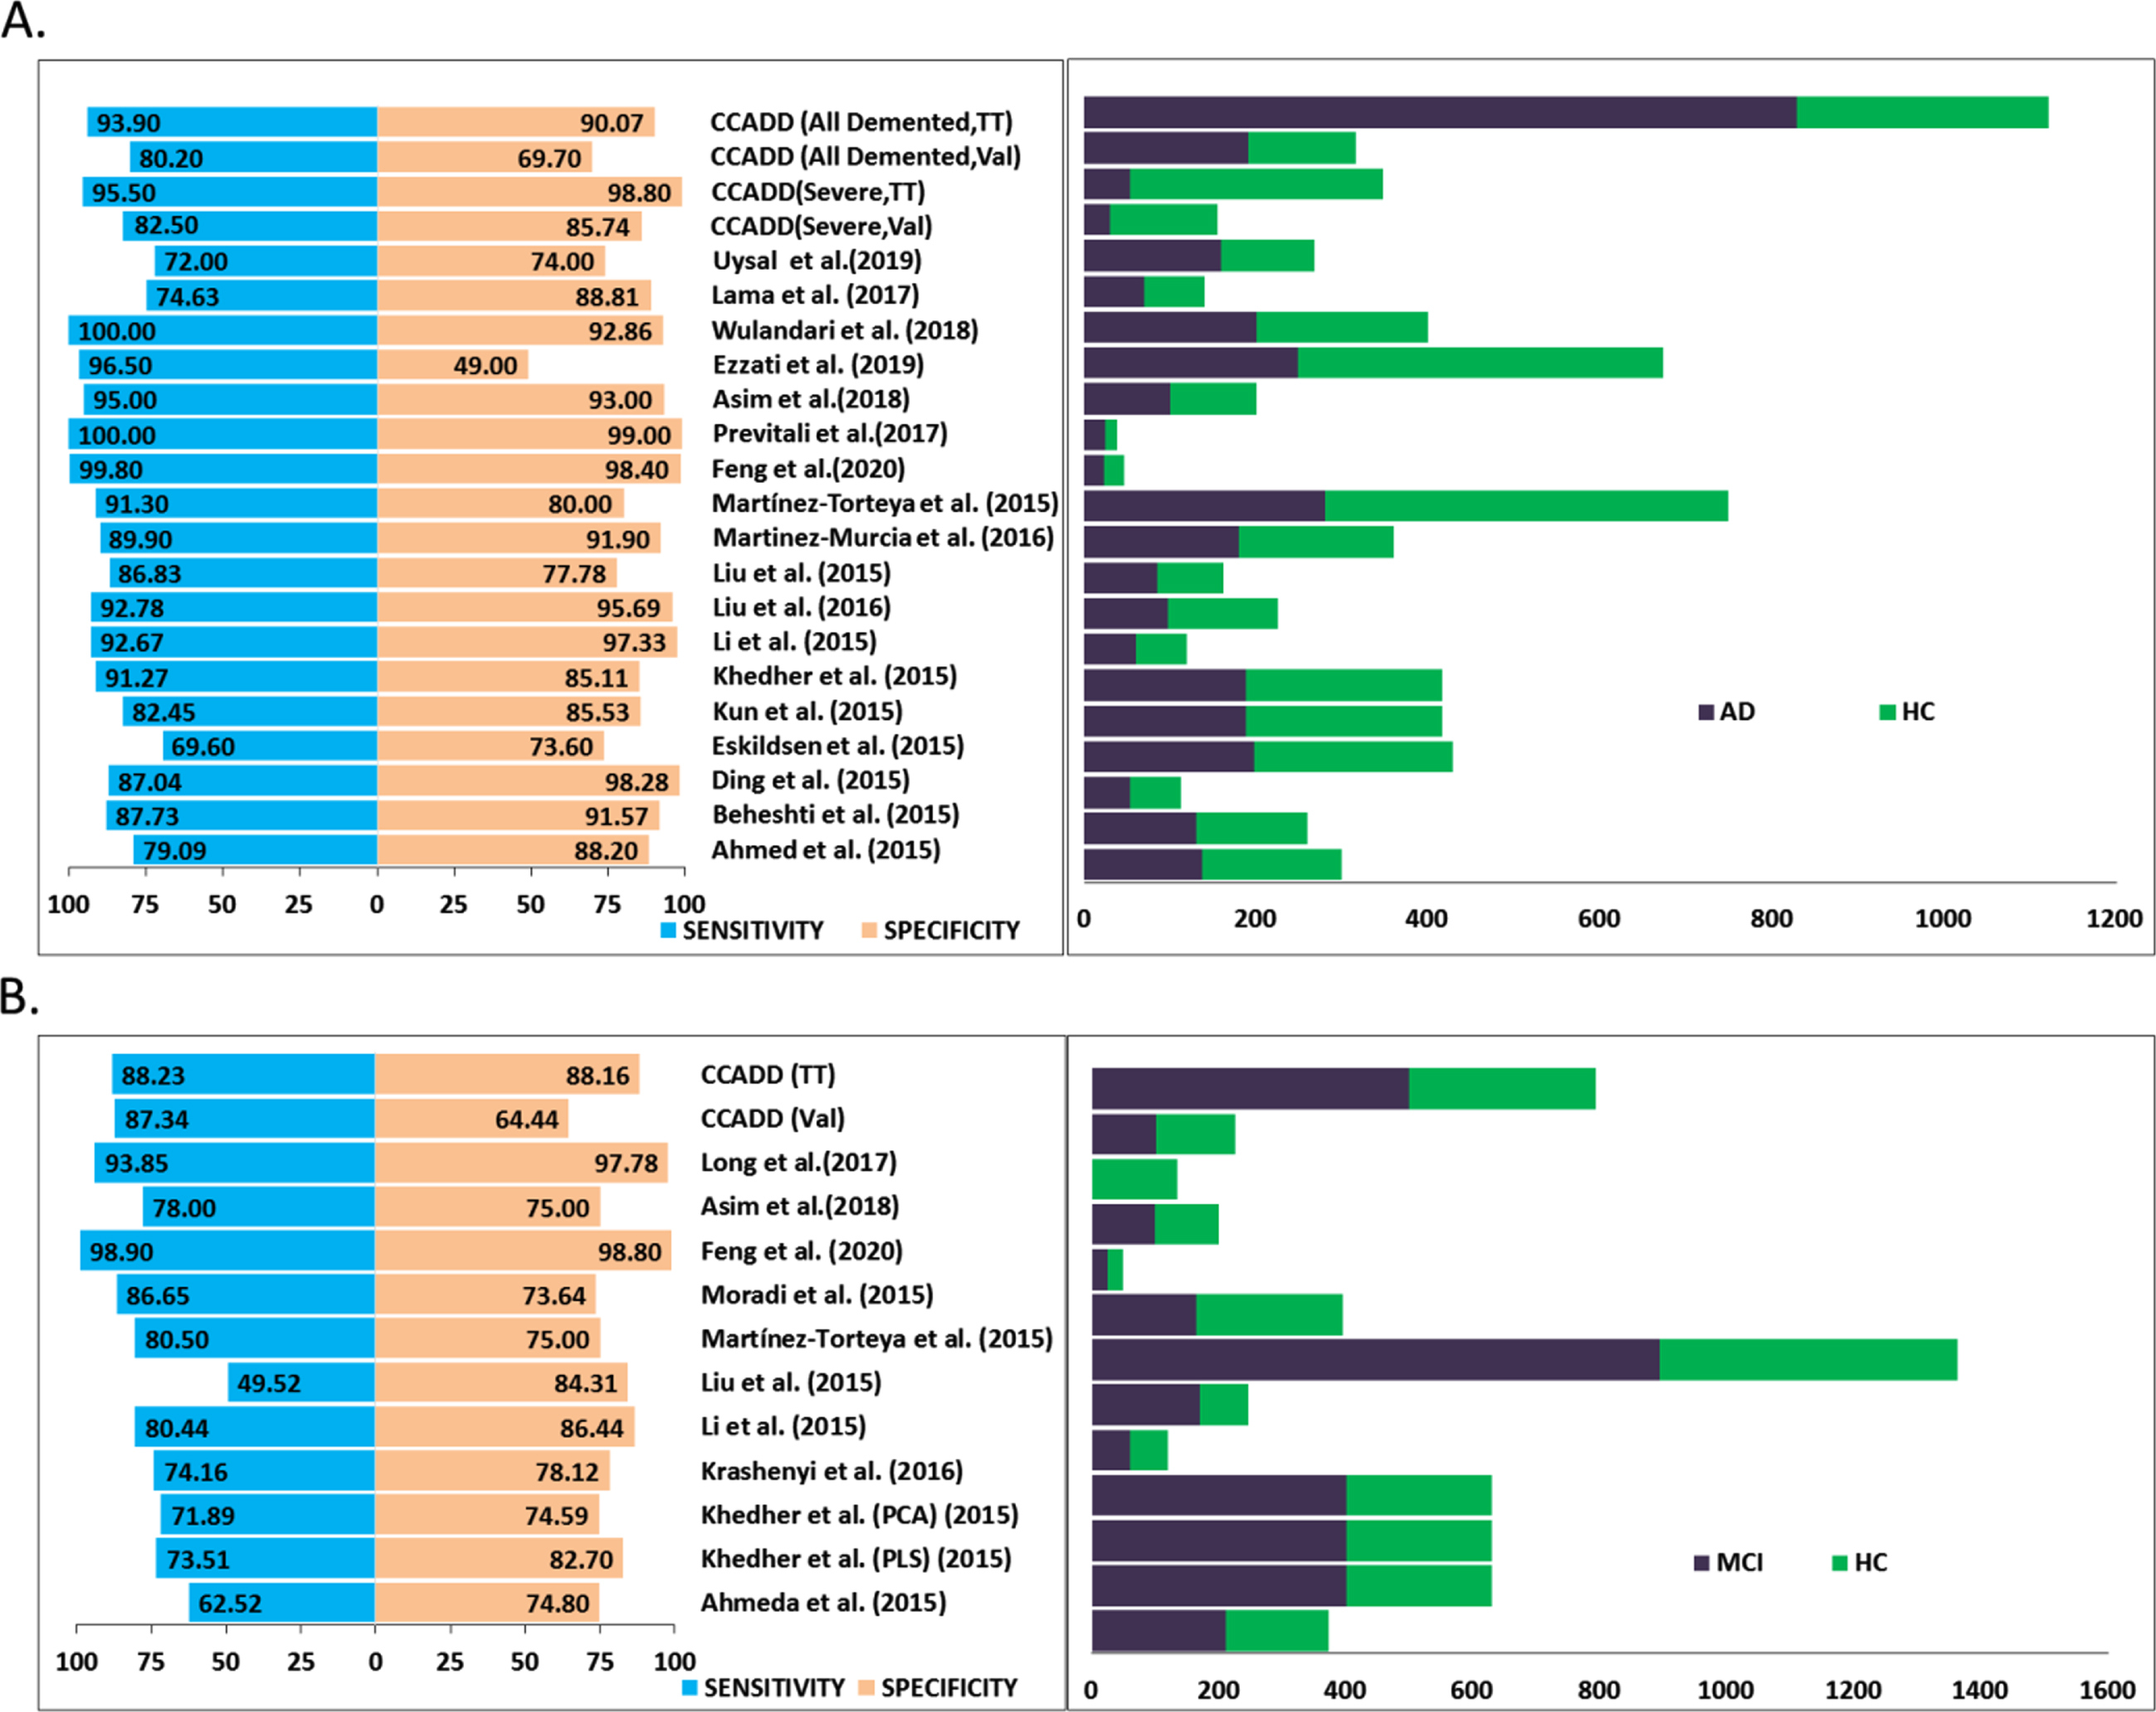
Comparison of the performance of our models is necessary to judge the potential and limitation of the method. However, in absence of any readily available software it was not possible to test the efficacies of other software on the ADNI dataset that we have used in this study. Hence, we opt for comparing the performances of our models with that of earlier reported works. Two relatively recent reviews [59, 60] have provided exhaustive surveys of the existing methods for neuroimaging-based diagnosis of cognitive impairment and dementia. They summarized the nuances of dementia detection methods using feature extraction and pattern classification perspective where feature extraction complies of methods including the voxel, pixel, and ROI-based features and classifier includes the linear discriminant analysis, Bayes classifiers, SVM, and artificial neural networks algorithms, respectively. The comparison indicates that satisfying diagnosis of AD and healthy samples was achieved by various algorithms. However, differentiating MCI from healthy ones still remains a major challenge. In addition, we have searched exhaustively for additional recent works that used image processing followed by SVM classification of the ADNI data. We have extracted the sensitivity and specificity values of the methods that used ADNI dataset and compared the same with the performance of our best training model in differentiating all demented, severe, and mild (MCI) demented samples with respect to the healthy samples categorized by CDR definitions (Fig. 6). It is evident that our method performed quite well with respect to the other methods [22, 32–34, 37, 41–42, 61–77] considering the fact that our dataset size is quite large; second in rank for all the methods compared here. As a matter of fact, we obtained highest sensitivities, ∼94%and ∼96%, for all demented (including severe, moderate, and mild samples) and severe cases, respectively in training-testing evaluation (Fig. 6A). Methods achieved higher specificities than our method (90%and 98%for demented and severe samples, respectively) used smaller datasets in their respective studies. Similar trend is observed in case of mild/MCI classification where we obtained highest sensitivity and a reasonably well specificity (Fig. 6B). Couple of methods that achieved slightly higher specificities used smaller datasets. An acronym, CCADD (corpus callosum based Alzheimer’s disease detection), was provided for our method and performance measures for both test and validation cohorts are provided. However, it must be noted that for other methods [22, 32–34, 37, 41–42, 61–77], it was not possible for us to find out whether the performance values were retrieved from test or separate validation cohorts.
Fig. 6
Comparison of the performance. Panel A plots the sensitivity and specificity values (left side) of our method, CCADD (corpus callosum based Alzheimer’s disease detection) obtained for differentiating all demented and only severely demented patients from healthy controls. ‘TT’ and ‘Val’ signify training-testing and validation cohorts. Corresponding dataset sizes including the demented (AD) and healthy (HC) cohorts have been plotted at the right side. Similarly, performance values and dataset sizes are plotted alongside for other published works as well. Panel B plots sensitivity and specificity values (left side) and dataset size (right side) obtained for differentiating mild demented or mild cognitive impairment (MCI) patients from healthy controls.
Differentiating mild or MCI patients from severe and/or moderate AD patients is also very important to understand the disease progression and associated morphological alterations. Hence, we classified the mild and rest AD samples categorized in terms of CDR scoring and obtained 83.38%sensitivity and 86.57%specificity to differentiate mild samples with respect to other AD samples from the test set. Supplementary Figure 5 shows the relative comparison of the values with other methods dealing with differentiation of MCI versus AD cases. Our method performs reasonably well if not the best considering sensitivity, specificity, and dataset size.
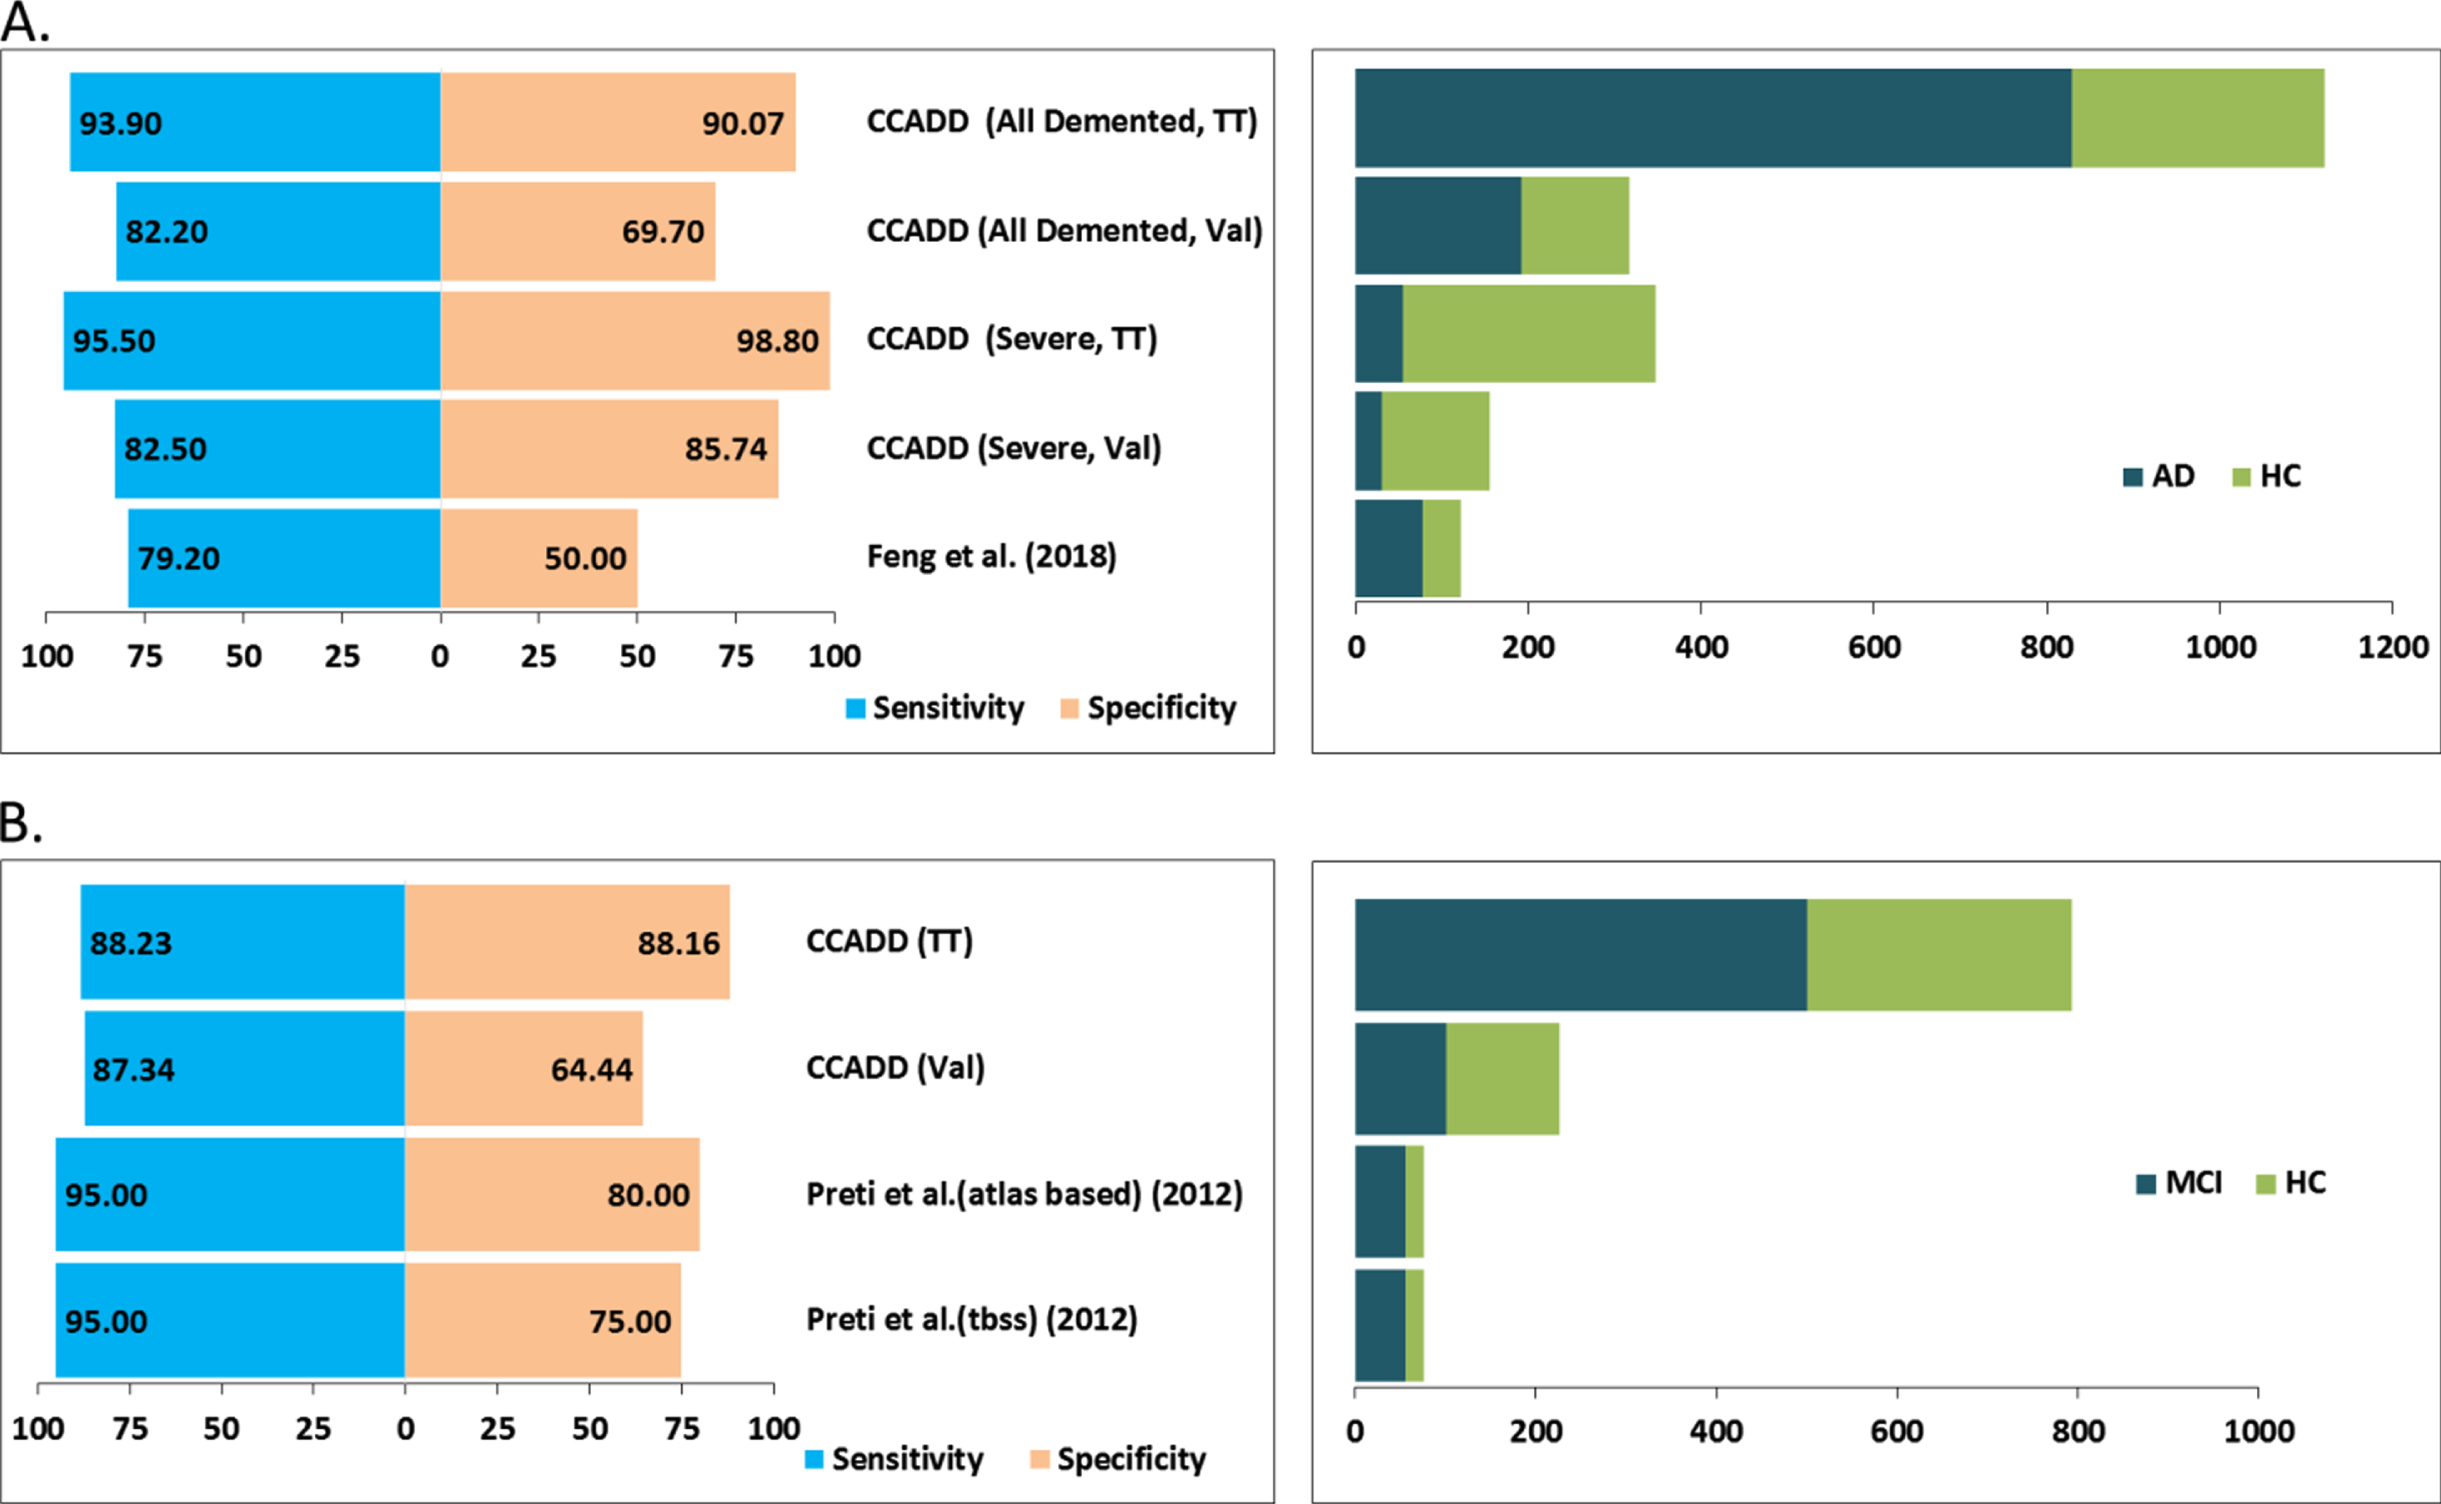
Finally, we attempted to compare the performance of our models with respect to methods that utilized only CC-based features in their classification schemes. Figure 7A shows that our method obtained much better sensitivity and specificity in differentiating all AD patients with respect to the method from Feng et al. [32]. Similarly, our method obtained better specificity and comparable sensitivities in differentiating mild AD or MCI cases with respect to methods from Preti et al. [22] (Fig. 7B).
Fig. 7
Comparison of the performance of CC atrophy-based methods. Panel A plots the sensitivity and specificity values (left side) of our method, CCADD (corpus callosum based Alzheimer’s disease detection) obtained for differentiating all demented and only severely demented patients from healthy controls. ‘TT’ and ‘Val’ signify training-testing and validation cohorts. Corresponding dataset sizes including the demented (AD) and healthy (HC) cohorts have been plotted at the right side. Similarly, performance values and dataset sizes are plotted alongside for other published works as well. Panel B plots sensitivity and specificity values (left side) and dataset size (right side) obtained for differentiating mild demented or mild cognitive impairment (MCI) patients from healthy controls.
Reduction of CC length and thickness
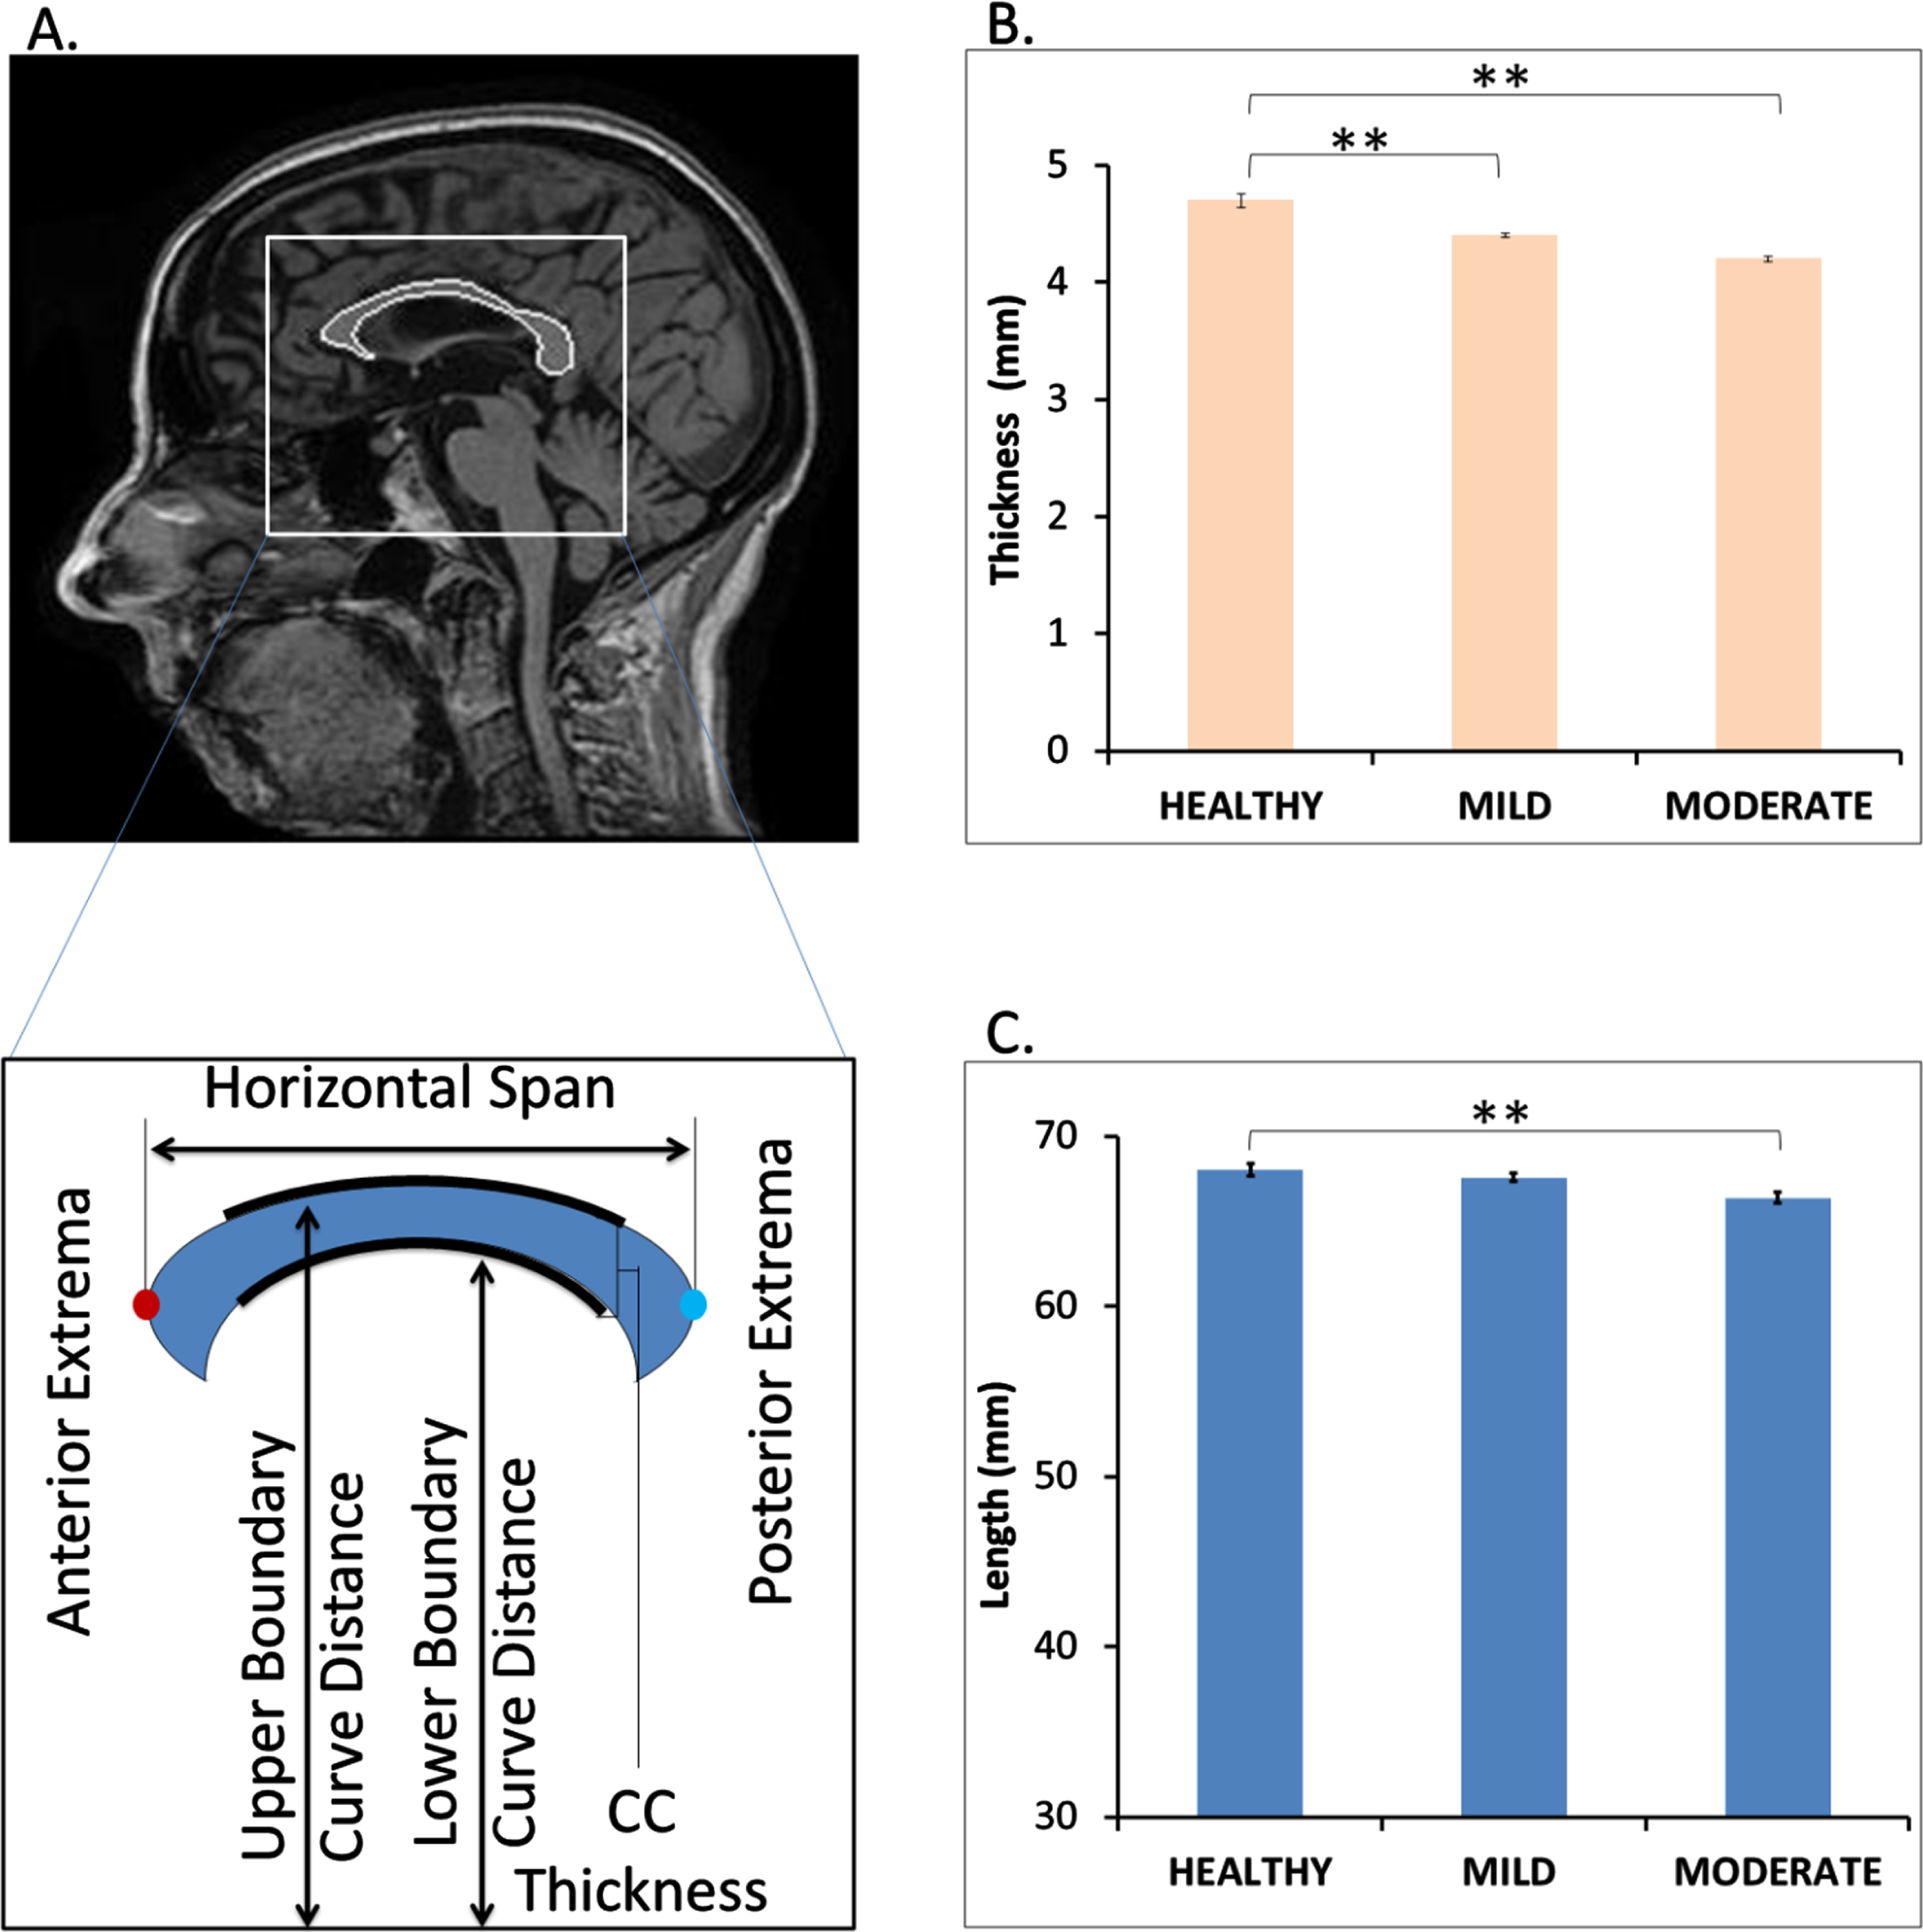
We calculated the length (horizontal span) and thickness of the segmented CC from healthy and demented samples, respectively as shown in Fig. 8A. Comparison of the same between healthy and demented (mild and moderate) shows marked reduction in thickness and length (Fig. 8B, C). Initially the length and thickness were calculated in terms of number of pixels and further the pixel dimension was converted into millimeter scale multiplied by 0.9375 mm (1 pixel is equal to 0.9375 mm for the segmented images in our dataset). The converted length of the healthy CCs is around 68.03 mm on an average which is very similar to the range of actual CC length which is in older male and older female adults were 70.6±3.4 mm and 68.5±4.5 mm, respectively [21]. We have also observed increased perimeter and bending coefficient of CC in mild and moderate AD patients with respect to healthy samples leading to a reduced area of CC (Supplementary Figures 2 and 3).
Fig. 8
Decrease in corpus callosum (CC) length and thickness in mild and moderate dementia patients. Panel A shows a sample mid sagittal view of the segmented CC from healthy person MRI. It also provides a pictorial depiction of the measurement of CC length (horizontal span) and thickness. Panel C and D compares the average CC thickness and length among healthy, mild, and moderately demented samples. p < 0.05 is signified by ** symbol.
DISCUSSION
We aim to identify newer morphological changes of brain tissues caused by AD and establish them as diagnostic marker for detection of dementia. As there is a possibility of existence of hidden patterns in brain MRI that can distinguish a demented subject from normal controlled ones, we performed automatic detection and segmentation of CC. We extracted shape and size-based features of CC visible from the sagittal slices of the brain MRI scans to feed into a multivariate pattern analysis using a widely used machine learning technique, SVM. One of the most comprehensive AD data sources, the ADNI [51, 52], was used where we could retrieve MRI images from 1,437 samples. Definition of the dementia and the severity of the disease vary according to the clinical protocol used. Hence, in this study, three most popular, independent clinical scoring schemes, CDR, MMSE, and GDS, respectively, were used to categorize demented and healthy samples. In addition, a separate grouping (ADNI grouping) of the healthy and disease samples was created using the individual clinical/experimental teams’ insight. A rigorous benchmarking protocol comprising of training-testing and separate validation cohorts was implemented to estimate the accuracy of our trained models. Over 90%sensitivity and specificity in differentiating demented patients from healthy cohorts and importantly, more than 90%sensitivity and > 80%specificity were achieved in detecting mild AD patients in training-testing experiments using CDR-based categorization. Validation cohort-based benchmarking also resulted 73.33%and 77.75%accuracy in identifying mild and moderate AD patients respectively using CDR categorization.
Benchmarking results of our approach is encouraging and definitely promises potential use in clinical field if packaged and tested appropriately. Hence, the first thing one needs to check whether the performance measures are at per with the previously published works. However, we could not test performance of other software on our dataset due to lack of readily available, technically amenable, and equivalent multi-component software packages. Most of the software deposited in public domains are either available in parts or demands multiple dependencies. We took help from two relatively recent reviews [59, 60], which provide a comprehensive survey of the existing methods that aim to differentiate healthy samples from AD cohort using ADNI data, SVM, and T1-weighted MRIs, respectively [22, 32–34, 37, 41–42, 61–77]. Similarly, we have extracted performance measures for additional recent works that utilized image processing followed by SVM classification of the ADNI data. However, in agreement with previous observations, it could be extrapolated that many algorithms could differentiate AD from the normal sample with satisfying accuracy, whereas distinguishing MCI from normal still remains a major challenge. Interestingly, comparison of our method with relevant algorithms mentioned in these works have suggested relatively better performance (in terms of sensitivity and specificity) for detection of both AD and MCI (Figs. 6 and 7, and Supplementary Figure 5). However, we understand that the improvement could be incremental, but it is fair to assume that with more diverse data sets, combinations of different types of ROI-based atrophies, and inclusion of other relevant clinical information, our method could improve even further. For example, research interest is increasingly growing in study of functional connectivity patterns of brain along with structural view which is reflected in different bio medical images like MRI, PET etc. Functional MRI offers considerable promise as a non-invasive tool for detecting morphological brain changes in AD affected patients. In fact, evidence to date indicates that functional brain decline precedes structural decline in pre-clinical samples. Therefore, combination of structural MRI and functional MRI-derived image analysis may provide unique ability to capture the dynamic state of change in the degenerating brain.
We also introduce a novel in-house shape matching algorithm for automatic selection and subsequent segmentation of the CC region from each sagittal brain slice MR images. Detection of CC from MR images is a critical bottleneck step and requires expert manual interventions. Benchmarking results of the automatic CC detection module suggest very high accuracy and hence encourages its usage in extraction of CC regions from all the MR slices used in this study. This is indeed helpful to overcome the manual involvement and to reduce the error and bias associated with manual selection. This module could also be used to identify and extract other critical ROI from MR images.
In the future, we aim to develop an image analysis software package to detect dementia from brain MRI using morphological alterations of various critical regions of interest in combination with brain functional alteration captured via fMRI data. We believe, our work presented here provides a solid foundation toward achieving this goal which would be extremely useful for both academic and clinical communities.
ACKNOWLEDGMENTS
The authors acknowledge CSIR-Indian Institute of Chemical Biology for infrastructural support. SC acknowledges Dr. Amitabha Ghosh and Dr. Somenath Chatterjee for their involvement in initial discussion. SD thanks CSIR for research fellowship. PP acknowledges DST-INSPIRE fellowship from Department of Science and Technology (DST), Government of India.
CONFLICT OF INTEREST
The authors have no conflict of interest to report.
SUPPLEMENTARY MATERIAL
[1] The supplementary material is available in the electronic version of this article: https://dx.doi.org/10.3233/ADR-210314.
REFERENCES
[1] | Holilah D , Bustamam A , SarwindaDevvi ((2021) ) Detection of Alzheimer’s disease with segmentation approach using K-Means Clustering and Watershed Method of MRI image. J Physics Conf Ser 1725: , 012009. |
[2] | Wolz R , Julkunen V , Koikkalainen J , Niskanen E , Zhang DP , Rueckert D , Soininen H , Lötjönen J , Alzheimer’s Disease Neuroimaging Initiative ((2011) ) Multi-method analysis of MRI images in early diagnostics of Alzheimer’s disease. PloS One 6: , e25446. |
[3] | Fennema-Notestine C , Hagler DJ Jr , McEvoy LK , Fleisher AS , Wu EH , Karow DS , Dale AM ((2009) ) Structural MRI biomarkers for preclinical and mild Alzheimer’s disease. Hum Brain Mapp 30: , 3238–3253. |
[4] | Morra JH , Tu Z , Apostolova LG , Green AE , Avedissian C , Madsen SK , Parikshak N , Hua X , Toga AW , Jack CR Jr , Schuff N , Weiner MW , Thompson PM ((2009) ) Automated 3D mapping of hippocampal atrophy and its clinical correlates in 400 subjects with Alzheimer’s disease, mild cognitive impairment, and elderly controls. Hum Brain Mapp 30: , 2766–2788. |
[5] | Walhovd KB , Fjell AM , Dale AM , McEvoy LK , Brewer J , Karow DS , Salmon DP , Fennema-Notestine C ((2010) ) Multi-modal imaging predicts memory performance in normal aging and cognitive decline. Neurobiol Aging 31: , 1107–1121. |
[6] | Kovacevic S , Rafii MS , Brewer JB ((2009) ) High-throughput, fully automated volumetry for prediction of MMSE and CDR decline in mild cognitive impairment. Alzheimer Dis Assoc Disord 23: , 139–145. |
[7] | Fan Y , Batmanghelich N , Clark CM , Davatzikos C ((2008) ) Spatial patterns of brain atrophy in MCI patients, identified via high-dimensional pattern classification, predict subsequent cognitive decline. Neuroimage 39: , 1731–1743. |
[8] | McEvoy LK , Fennema-Notestine C , Roddey JC , Hagler DJ Jr. , Holland D , Karow DS , Pung CJ , Brewer JB , Dale AM ((2009) ) Alzheimer disease: Quantitative structural neuroimaging for detection and prediction of clinical and structural changes in mild cognitive impairment. Radiology 251: , 195–205. |
[9] | Vemuri P , Wiste HJ , Weigand SD , Shaw LM , Trojanowski JQ , Weiner MW , Knopman DS , Petersen RC , Jack CR Jr ((2009) ) MRI and CSF biomarkers in normal, MCI, and AD subjects: Diagnostic discrimination and cognitive correlations. Neurology 73: , 287–293. |
[10] | Vemuri P , Whitwell JL , Kantarci K , Josephs KA , Parisi JE , Shiung MS , Knopman DS , Boeve BF , Petersen RC , Dickson DW , Jack CR Jr ((2008) ) Antemortem MRI based STructural Abnormality iNDex (STAND)-scores correlate with postmortem Braak neurofibrillary tangle stage. Neuroimage 42: , 559–567. |
[11] | Whitwell JL , Josephs KA , Murray ME , Kantarci K , Przybelski SA , Weigand SD , Vemuri P , Senjem ML , Parisi JE , Knopman DS , Boeve BF , Petersen RC , Dickson DW , Jack CR Jr ((2008) ) MRI correlates of neurofibrillary tangle pathology at autopsy: A voxel-based morphometry study. Neurology 71: , 743–749. |
[12] | Du AT , Schuff N , Kramer JH , Rosen HJ , Gorno-Tempini ML , Rankin K , Miller BL , Weiner MW ((2007) ) Different regional patterns of cortical thinning in Alzheimer’s disease and frontotemporal dementia. Brain 130: , 1159–1166. |
[13] | Rabinovici GD , Seeley WW , Kim EJ , Gorno-Tempini ML , Rascovsky K , Pagliaro TA , Allison SC , Halabi C , Kramer JH , Johnson JK , Weiner MW , Forman MS , Trojanowski JQ , Dearmond SJ , Miller BL , Rosen HJ ((2007) ) Distinct MRI atrophy patterns in autopsy-proven Alzheimer’s disease and frontotemporal lobar degeneration. Am J Alzheimers Dis Other Demen 22: , 474–488. |
[14] | Whitwell JL , Weigand SD , Shiung MM , Boeve BF , Ferman TJ , Smith GE , Knopman DS , Petersen RC , Benarroch EE , Josephs KA , Jack CR Jr ((2007) ) Focal atrophy in dementia with Lewy bodies on MRI: A distinct pattern from Alzheimer’s disease. Brain 130: , 708–719. |
[15] | Seeley WW , Crawford RK , Zhou J , Miller BL , Greicius MD ((2009) ) Neurodegenerative diseases target large-scale human brain networks. Neuron 62: , 42–52. |
[16] | Hidalgo-Muñoz AR , Ramírez J , Górriz JM , Padilla P ((2014) ) Regions of interest computed by SVM wrapped method for Alzheimer’s disease examination from segmented MRI. Front Aging Neurosci 6: , 20. |
[17] | Vu TD , Ho NH , Yang HJ , Kim J , Song HC ((2018) ) Non-white matter tissue extraction and deep convolutional neural network for Alzheimer’s disease detection. Soft Comput 22: , 6825–6833. |
[18] | Folego G , Weiler M , Casseb RF , Pires R , Rocha A ((2020) ) Alzheimer’s disease detection through whole-brain 3D-CNN MRI. Front Bioeng Biotechnol 8: , 534592. |
[19] | Rallabandi VPS , Tulpule K , Gattu M ((2020) ) Automatic classification of cognitively normal, mild cognitive impairment and Alzheimer’s disease using structural MRI analysis. Informatics Med Unlocked 18: , 100305. |
[20] | Thomann PA , Wustenberg T , Pantel J , Essig M , Schroder J ((2006) ) Structural changes of the corpus callosum in mild cognitive impairment and Alzheimer’s disease. Dement Geriatr Cogn Disord 21: , 215–220. |
[21] | Allouh MZ , Al Barbarawi MM , Ali HA , Mustafa AG , Alomari SO ((2020) ) Morphometric analysis of the corpus callosum according to age and sex in Middle Eastern Arabs: Racial comparisons and clinical correlations to autism spectrum disorder. Front Syst Neurosci 14: , 30. |
[22] | Preti MG , Baglio F , Laganà MM , Griffanti L , Nemni R , Clerici M , Bozzali M , Baselli G ((2012) ) Assessing corpus callosum changes in Alzheimer’s disease: Comparison between tract-based spatial statistics and atlas-based tractography. PLoS One 7: , e35856. |
[23] | Zhu M , Wang X , Gao W , Shi C , Ge H , Shen H , Lin Z ((2014) ) Corpus callosum atrophy and cognitive decline in early Alzheimer’s disease: Longitudinal MRI study. Dement Geriatr Cogn Disord 37: , 214–222. |
[24] | Paola MD , Iulio FD , Cherubini A , Blundo C , Casini AR , Sancesario G , Passafiume D , Caltagirone C , Spalletta G ((2010) ) When, where, and how the corpus callosum changes in MCI and AD: A multimodal MRI study. Neurology 74: , 1136–1142. |
[25] | Paola MD , Luders E , Iulio FD , Cherubini A , Passafiume D , Thompson PM , Caltagirone C , Toga AW , Spalletta G ((2010) ) Callosal atrophy in mild cognitive impairment and Alzheimer’s disease: Different effects in different stages. Neuroimage 49: , 141–149. |
[26] | Paola MD , Spalletta G , Caltagirone C ((2010) ) In vivo structural neuroanatomy of corpus callosum in Alzheimer’s disease and mild cognitive impairment using different MRI techniques: A review. J Alzheimers Dis 20: , 67–95. |
[27] | Frederiksen KS , Garde E , Skimminge A , Ryberg C , Rostrup E , Baare WF , Siebner HR , Hejl AM , Leffers AM , Waldemar G ((2011) ) Corpus callosum atrophy in patients with mild Alzheimer’s disease. Neurodegener Dis 8: , 476–482. |
[28] | Teipel SJ , Meindl T , Grinberg L , Grothe M , Cantero JL , Reiser MF , Moller HJ , Heinsen H , Hampel H ((2011) ) The cholinergic system in mild cognitive impairment and Alzheimer’s disease: An in vivo MRI and DTI study. Hum Brain Mapp 32: , 1349–1362. |
[29] | Serra L , Cercignani M , Lenzi D , Perri R , Fadda L , Caltagirone C , Macaluso E , Bozzali M ((2010) ) Grey and white matter changes at different stages of Alzheimer’s disease. J Alzheimers Dis 19: , 147–159. |
[30] | Zhang Y , Schuff N , Camacho M , Chao LL , Fletcher TP , Yaffe K , Woolley SC , Madison C , Rosen HJ , Miller BL , Weiner MW ((2013) ) MRI markers for mild cognitive impairment: Comparisons between white matter integrity and gray matter volume measurements. PLoS One 8: , e66367. |
[31] | Teipel SJ , Bayer W , Alexander GE , Zebuhr Y , Teichberg D , Kulic L , Schapiro MB , Moller HJ , Rapoport SI , Hampel H ((2002) ) Progression of corpus callosum atrophy in Alzheimer disease. Arch Neurol 59: , 243–248. |
[32] | Feng Q , Chen Y , Liao Z , Jiang H , Mao D , Wang M , Yu E , Ding Z ((2018) ) Corpus callosum radiomics-based classification model in Alzheimer’s disease: A case-control study. Front Neurol 9: , 618. |
[33] | Wulandari P , Novitasari D , Asyhar A ((2018) ) Identification of Alzheimer’s disease in MRI data using discrete wavelet transform and support vector machine. Proceedings of the International Conference on Mathematics and Islam 1: , 198–204. |
[34] | Lama RK , Gwak J , Park JS , Lee SW ((2017) ) Diagnosis of Alzheimer’s disease based on structural MRI images using a regularized extreme learning machine and PCA features. J Healthc Eng 2017: , 5485080. |
[35] | Aruchamy S , Mounya V , Verma A (2020) Alzheimer’s disease classification in brain MRI using modified kNN algorithm. 2020 IEEE International Symposium on Sustainable Energy, Signal Processing and Cyber Security (iSSSC), pp. 1-6. |
[36] | Kar S , Majumder DD ((2019) ) A novel approach of diffusion tensor visualization based neuro fuzzy classification system for early detection of Alzheimer’s disease. J Alzheimers Dis Rep 3: , 1–18. |
[37] | Ezzati A , Zammit AR , Harvey DJ , Habeck C , Hall CB , Lipton RB , Alzheimer’s Disease Neuroimaging Initiative ((2019) ) Optimizing machine learning methods to improve predictive models of Alzheimer’s disease. J Alzheimers Dis 71: , 1027–1036. |
[38] | Moore PJ , Lyons TJ , Gallacher J , Alzheimer’s Disease Neuroimaging Initiative ((2019) ) Random forest prediction of Alzheimer’s disease using pairwise selection from time series data. PLoS One 14: , e0211558. |
[39] | Borgohain O , Dasgupta M , Kumar P , Talukdar G ((2021) ) Performance analysis of nearest neighbor, K-nearest neighbor and weighted K-nearest neighbor for the classification of Alzheimer disease. In Soft Computing Techniques and Applications, Borah S, Pradhan R, Dey N, Gupta P, eds. Springer, pp. 295–304. |
[40] | Acharya UR , Fernandes SL , WeiKoh JE , Ciaccio EJ , Fabell MKM , Tanik UJ , Rajinikanth V , Yeong CH ((2019) ) Automated detection of Alzheimer’s disease using brain MRI images- a study with various feature extraction techniques. J Med Syst 43: , 302. |
[41] | Uysal G , Ozturk M (2019) Using machine learning methods for detecting Alzheimer’s disease through hippocampal volume analysis. 2019 Medical Technologies Congress (TIPTEKNO), pp. 1-4. |
[42] | Long X , Chen L , Jiang C , Zhang L , Alzheimer’s Disease Neuroimaging Initiative ((2017) ) Prediction and classification of Alzheimer disease based on quantification of MRI deformation. PLoS One 12: , e0173372. |
[43] | Pan D , Zeng A , Jia L , Huang Y , Frizzell T , Song X ((2020) ) Early detection of Alzheimer’s disease using magnetic resonance imaging: A novel approach combining convolutional neural networks and ensemble learning. Front Neurosci 14: , 259. |
[44] | Lin W , Tong T , Gao Q , Guo D , Du X , Yang Y , Guo G , Xiao M , Du M , Qu X , Alzheimer’s Disease Neuroimaging Initiative ((2018) ) Convolutional neural networks-based MRI image analysis for the Alzheimer’s disease prediction from mild cognitive impairment. Front Neurosci 12: , 777. |
[45] | Islam J , Zhang Y ((2018) ) Brain MRI analysis for Alzheimer’s disease diagnosis using an ensemble system of deep convolutional neural networks. Brain Inform 5: , 2. |
[46] | Bae JB , Lee S , Jung W , Park S , Kim W , Oh H , Han JW , Kim GE , Kim JS , Kim JH , Kim KW ((2020) ) Identification of Alzheimer’s disease using a convolutional neural network model based on T1-weighted magnetic resonance imaging. Sci Rep 10: , 22252. |
[47] | Abadi M , Agarwal A , Barham P , Brevdo E , Chen Z , Citro C , Corrado GS , Davis A , Dean J , Devin M , Ghemawat S , Goodfellow I , Harp A , Irving G , Isard M , Jia Y , Jozefowicz R , Kaiser L , Kudlur M , Levenberg J , Mané D , Monga R , Moore S , Murray D , Olah C , Schuster M , Shlens J , Steiner B , Sutskever I , Talwar K , Tucker P , Vanhoucke V , Vasudevan V , Viégas F , Vinyals O , Warden P , Wattenberg M , Wicke M , Yu Y , Zheng X (2015) TensorFlow: Large-scale machine learning on heterogeneous systems. https://www.tensorflow.org/ |
[48] | Chollet F (2015) Keras. https://github.com/keras-team/keras. |
[49] | Bergstra J , Breuleux O , Bastien F , Lamblin P , Pascanu R , Desjardins G , Turian J , Warde-Farley D , Bengio Y ((2010) ) Theano: A CPU and GPU Math Expression Compiler. Proceedings of the Python for Scientific Computing Conference (SciPy), Austin, TX. |
[50] | Wei JKE , Jahmunah V , Pham T-H , Oh SL , Ciaccio EJ , Acharya UR , Ramli N ((2020) ) Automated detection of Alzheimer’s disease using Bi-directional empirical model decomposition. Pattern Recognit Lett 135: , 106–113. |
[51] | Jack CR Jr , Bernstein MA , Fox NC , Thompson P , Alexander G , Harvey D , Borowski B , Britson PJ , J LW , Ward C , Dale AM , Felmlee JP , Gunter JL , Hill DL , Killiany R , Schuff N , Fox-Bosetti S , Lin C , Studholme C , DeCarli CS , Krueger G , Ward HA , Metzger GJ , Scott KT , Mallozzi R , Blezek D , Levy J , Debbins JP , Fleisher AS , Albert M , Green R , Bartzokis G , Glover G , Mugler J , Weiner MW ((2008) ) The Alzheimer’s Disease Neuroimaging Initiative (ADNI): MRI methods. J Magn Reson Imaging 27: , 685–691. |
[52] | 52.Alzheimer’s Disease Neuroimaging protocol, http://adni.loni.usc.edu/wp-content/themes/freshnews-dev-v2/documents/clinical/ADNI-1_Protocol.pdf. |
[53] | Hughes CP , Berg L , Danziger WL , Coben LA , Martin RL ((1982) ) A new clinical scale for the staging of dementia. Br J Psychiatry 140: , 566–572. |
[54] | Reisberg B , Ferris SH , de Leon MJ , Crook T ((1982) ) The Global Deterioration Scale for assessment of primary degenerative dementia. Am J Psychiatry 139: , 1136–1139. |
[55] | Marquié M , Castilla-Martí M , Valero S , Martínez J , Sánchez D , Hernández I , Rosende-Roca M , Vargas L , Mauleón A , Rodríguez-Gómez O , Abdelnour C , Gil S , Santos-Santos MA , Alegret M , Espinosa A , Ortega G , Pérez-Cordón A , Sanabria Á , Roberto N , Moreno-Grau S , de Rojas I , Simó R , Ciudin A , Hernández C , Orellana A , Monté-Rubio G , Benaque A , Ruiz A , Tárraga L , Boada M ((2019) ) Visual impairment in aging and cognitive decline: Experience in a memory clinic. Sci Rep 9: , 8698. |
[56] | ((2014) ) MATLAB and Image Processing Toolbox version R2014a. The MathWorks Inc., Natick, MA. |
[57] | Schölkopf B , Smola A , Williamson R , Bartlett PL ((2000) ) New support vector algorithms. Neural Comput 12: , 1207–1245. |
[58] | Chang CC , Lin CJ ((2011) ) LIBSVM: A library for support vector machines. ACM Trans Intell Syst Technol 2: , 3. |
[59] | Zheng C , Xia Y , Pan Y , Chen J ((2016) ) Automated identification of dementia using medical imaging: A survey from a pattern classification perspective. Brain Inform 3: , 17–27. |
[60] | Pellegrini E , Ballerini L , Hernandez MDCV , Chappell FM , González-Castro V , Anblagan D , Danso S , Muñoz-Maniega S , Job D , Pernet C , Mair G , MacGillivray TJ , Trucco E , Wardlaw JM ((2018) ) Machine learning of neuroimaging for assisted diagnosis of cognitive impairment and dementia: A systematic review. Alzheimers Dement (Amst) 10: , 519–535. |
[61] | Ahmed OB , Mizotin M , Pineau JB , Allard M , Catheline G , Amar CB ((2015) ) Alzheimer’s disease diagnosis on structural MR images using circular harmonic functions descriptors on hippocampus and posterior cingulate cortex. Comput Med Imaging Graph 44: , 13–25. |
[62] | Krashenyi I , Ramírez J , Popov A , Górriz JM ((2016) ) Fuzzy computer-aided Alzheimer’s disease diagnosis based on MRI data. Curr Alzheimer Res 13: , 545–556. |
[63] | Khedher L , Ramírez J , Górriz JM , Brahim A , Segovia F ((2015) ) Early diagnosis of Alzheimer’s disease based on partial least squares, principal component analysis and support vector machine using segmented MRI images. Neurocomputing 151: , 139–150. |
[64] | Korolev IO , Symonds LL , Bozoki AC ((2016) ) Predicting progression from mild cognitive impairment to Alzheimer’s dementia using clinical, MRI, and plasma biomarkers via probabilistic pattern classification. PLoS One 11: , e0138866. |
[65] | Hu K , Wang Y , Chen K , Hou L , Zhang X ((2015) ) Multi-scale features extraction from baseline structure MRI for MCI patient classification and AD early diagnosis. Neurocomputing 175: , 132–145. |
[66] | Liu M , Zhang D , Adeli-Mosabbeb E , Shen D ((2016) ) Inherent structure-based multiview learning with multitemplate feature representation for Alzheimer’s disease diagnosis. IEEE Trans Biomed Eng 63: , 1473–1482. |
[67] | Martínez-Torteya A , Trevino V , Tamez-Pena JG ((2015) ) Improved diagnostic multimodal biomarkers for Alzhei-mer’s disease and mild cognitive impairment. Biomed Res Int 2015: , 961314. |
[68] | Martinez-Murcia FJ , Górriz JM , Ramírez J , Ortiz A ((2016) ) A spherical brain mapping of MR images for the detection of Alzheimer’s disease. Curr Alzheimer Res 13: , 575–588. |
[69] | Li Y , Yan J , Wang P , Lv Y , Qiu M , He X ((2015) ) Classification of Alzheimer’s disease based on multiple anatomical structures’ asymmetric magnetic resonance imaging feature selection. In Neural Information Processing, Arik S, Huang T, LaiW, Liu Q, eds. ICONIP 2015. Lecture Notes in Computer Science, Vol. 9492. Springer; Cham, Switzerland, pp. 280–289. |
[70] | Beheshti I , Demirel H ((2015) ) Probability distribution function-based classification of structural MRI for the detection of Alzheimer’s disease. Comput Biol Med 64: , 208–216. |
[71] | Ding Y , Zhang C , Lan T , Qin Z , Zhang X , Wang W (2015) Classification of Alzheimer’s disease based on the combination of morphometric feature and texture feature. IEEE International Conference on Bioinformatics and Biomedicine (BIBM), pp. 409-412. |
[72] | Eskildsen SF , Coupé P , Fonov VS , Pruessner JC , Collins DL ((2015) ) Structural imaging biomarkers of Alzheimer’s disease: Predicting disease progression. Neurobiol Aging 36: (Suppl 1), S23–31. |
[73] | Liu S , Liu S , Cai W , Che H , Pujol S , Kikinis R , Feng D , Fulham MJ ((2015) ) Multimodal neuroimaging feature learning for multiclass diagnosis of Alzheimer’s disease. IEEE Trans Biomed Eng 62: , 1132–1140. |
[74] | Moradi E , Pepe A , Gaser C , Huttunen H , Tohka J ((2015) ) Machine learning framework for early MRI-based Alzheimer’s conversion prediction in MCI subjects. Neuroimage 4: , 398–412. |
[75] | Feng W , Halm-Lutterodt NV , Tang H , Mecum A , Mesregah MK , Ma Y , Li H , Zhang F , Wu Z , Yao E , Guo X ((2020) ) Automated MRI-based deep learning model for detection of Alzheimer’s disease process. Int J Neural Syst 30: , 2050032. |
[76] | Previtali F , Bertolazzi P , Felici G , Weitschek E ((2017) ) A novel method and software for automatically classifying Alzheimer’s disease patients by magnetic resonance imaging analysis. Comput Methods Programs Biomed 143: , 89–95. |
[77] | Asim Y , Mallik AK , Rathore S , Hussain L , Iftikhar MA ((2018) ) A multi-modal, multi-atlas-based approach for Alzheimer detection via machine learning. Int J Imaging Syst Technol 28: , 113–123. |


