
Salivary Proteomics Identifies Transthyretin as a Biomarker of Early Dementia Conversion
Abstract
Background:
Alzheimer’s disease (AD) remains to date an incurable disease with a long asymptomatic phase. Early diagnosis in peripheral biofluids has emerged as key for identifying subjects at risk and developing therapeutics and preventative approaches.
Objective:
We apply proteomics discovery to identify salivary diagnostic biomarkers for AD, which are suitable for self-sampling and longitudinal biomonitoring during aging.
Methods:
57 participants were recruited for the study and were categorized into Cognitively normal (CNh) (n = 19), mild cognitive impaired (MCI) (n = 21), and Alzheimer’s disease (AD) (n = 17). On a subset of subjects, 3 CNh and 3 mild AD, shot-gun filter aided sample preparation (FASP) proteomics and liquid chromatography mass spectroscopy (LC-MS/MS) was employed in saliva and cerebrospinal fluid (CSF) to identify neural-derived proteins. The protein level of salivary Transthyretin (TTR) was validated using western blot analysis across groups.
Results:
We found that 19.8% of the proteins in saliva are shared with CSF. When we compared the saliva and CSF proteome, 24 hits were decreased with only one protein expressed more. Among the differentially expressed proteins, TTR with reported function in amyloid misfolding, shows a significant drop in AD samples, confirmed by western blot showing a 0.5-fold reduction in MCI and AD compared to CNh.
Conclusion:
A reduction in salivary TTR appears with the onset of cognitive symptoms. More in general, the proteomic profiling of saliva shows a plethora of biomarkers worth pursuing as non-invasive hallmarks of dementia in the preclinical stage.
INTRODUCTION
Alzheimer’s disease (AD) is the most prevalent age-related neurodegenerative disorder currently affecting around 50 million people worldwide [1]. While insoluble amyloid β-42 (Aβ42) and tau hyperphosphorylation are causative hallmarks of senile plaques and neurofibrillary tangles there is currently little understanding of early molecular drivers preceding the cascading effects of amyloid oligomerization. Still to date diagnosis occurs mostly after the onset of clinical symptoms, when pathophysiological events are irreversible. As a result of the long asymptomatic phase, with no diagnostic measures available to identify subjects at risk, disease modifying drugs fail to show effectiveness. Behaviorally, cognitive symptoms are anticipated by smell deficits. While hyposmia is an overarching condition for dementia [2], chemosensory probing can be used as companion diagnostics to identify subjects at risk for dementia conversion [3, 4]. Once cognitive symptoms appear the routine diagnostics are centered on imaging techniques such as magnetic resonance imaging (MRI), positron emission tomography (PET), and cerebrospinal fluid (CSF) analysis and are rather used as confirmatory evidence to support the diagnosis of AD.
In the molecular diagnosis, CSF Aβ42, total tau (t-tau), and phosphorylated tau (p-tau) are employed in differentiating AD from cognitively normal (CNh) and predicting the progression from mild cognitive impairment (MCI) to AD [5].
Nevertheless, in the last two decades, there has been a great effort to develop peripheral biomarkers which could enable timely diagnosis with an accuracy comparable to CSF. In particular, plasma pTau and Aβ [6] have been studied as specific biomarkers for subjects at high risk of cognitive decline. Most recently, p-tau 181, along with p-tau 217 and p-tau231 have been shown to be robust predictors of dementia conversion 2–3 years before the onset of cognitive symptoms and represent the most promising blood biomarker for AD pathology at present [7–9]. In the search for additional neuronal-derived molecules in blood, plasma NFL [10], BDNF [11], and sNRG [12] have been identified as overarching plasma biomarkers of neurodegeneration, without specificity for AD. Finally, a panel of circulating markers such as GRO-alpha, IGFBP6, IL-3, IL-8, MCP-1, MIP-3β, sIL-6R, TGF-β, TIMP-1, and sTNF-RI [13] has been identified as potential predictors for AD, suggesting the use of cytokines for the surveillance and monitoring of inflammatory states which prime neurodegeneration.
To further accelerate early diagnosis of AD a handful of laboratories including ours is attempting to identify early molecular hallmarks in saliva, as non-invasive and self-sampleable sources suitable for point of care (PoC) diagnostics. Saliva is a colorless hypotonic solution produced by salivary acini containing oral mucosal exudates, blood filtrates, and gingival crevicular fluid’s traces. The first work to investigate saliva as a specific biomarker for AD, showed an increase in salivary Aβ1-42 in mild AD as compared to non-demented control subjects while Parkinson’s diseases (PD) patients showed no change [14]. Another work successfully detected a rise in p-tau/t-tau levels in saliva of severe AD patients [15]. In the quest for prodromal biomarkers, a study showed that the levels of lactoferrin (Lf) progressively decline in MCI and AD patients and distinctively classify diseased individuals from healthy controls, implying Lf to be a robust, early novel salivary biomarker [16]. These findings support the use of salivary peripheral biomarkers (Aβ, t-tau/p-tau, Lf) as a simple, non-invasive test that can be used as an adjunct to diagnose AD during its earlier stages [17–19]. On native saliva, OMICs approaches have allowed us to search for large scale salivary proteins associated with AD and other neurodegenerative conditions [20]. Using shotgun proteomics and 2D-mass spectroscopy, unique identified proteins, such as albumins, immunoglobulins, transferrin, and zinc-alpha-glycoproteins were also mapped to pathways associated with AD, Huntington’s disease, and PD [21]. Other identified proteins were cystatin, defensins, lysozyme, and peroxidase; besides their role in the oral defense system, they also have been associated with neuronal damage and cognitive health [22]. Additionally, a recent metabolomic article has shown a distinctive set of metabolites differentiating AD from CN, methylguanosine, histidine-phenylalanine and choline-cytidine, and amino-dihydroxybenzene, glucosyl galactosyl hydroxylysine-H2O, where glutamine-carnitine was unique for MCI [23]. The different metabolite composition of saliva changes the oral microflora likely contributing to the insurgence of periodontitis, identified as a potential causative agent of AD [24]. To corroborate the use of saliva as a diagnostic matrix for AD, a recent work from our laboratory has found a change in microbial profiles starting in prodromal subjects [25]. In the present work, we aimed to identify salivary biomarkers that can inform about the pathogenesis of AD by using FASP-Shotgun-Proteomics, a more convenient and fast procedure as compared to 2D LC-MS/MS. In the differential proteomic panel, we identified a protein candidate, Transthyretin (TTR), with reported role in Aβ clearance, neuronal cell death [26] and gene regulation [27, 28]. The depletion of TTR in AD subjects observed by LC-MS/MS was confirmed in MCI and AD subjects using western blot analysis. The aim of study is to demonstrate that overall saliva is a rich source of biomarkers with great potential for becoming an elective biofluid for early clinical testing of brain health and aging.
METHODS
Participants
A cohort of 57 participants were recruited at the Cantonal Hospital of Fribourg Memory Clinic. We could include patients with clinically diagnosed amnestic MCI and Dementia of Alzheimer type according to the criteria guidelines [29]. To summarize, the clinical diagnosis results from clinical examination, neuropsychological evaluation confirming the cognitive deficit corresponding to the AD clinical characteristics (encoding memory deficit) and a dedicated MRI confirming the radiology pattern of medial temporal atrophy. CDR assessment was done retrospectively based on the medical history and by the interrogation with the certified clinical nurse. The patients with cognitive impairments and the healthy controls were provided with a written consent and all data collection occurred in compliance to the clinical protocol CER-VD2016-01627. The participants were asked not to ingest food for at least 2 h prior to the sample collection occurring between 9 AM and 11 AM. The participants underwent chemosensory probing (University of Pennsylvania Smell Identification Test, UPSIT; 16 odors [25]) followed by cognitive assessment (Mini-Mental Scale Examination, MMSE). The cohort of patients went through an inclusion criteria for categorization (Table 1). From the clinical cohort, CSF was also collected from 3 age-matched cognitively normal subjects (CN) [MMSE = 29±0.60; UPSIT (%) = 0.73±0.04] and 3 age-matched mild AD pathology [MMSE = 20.6±0.88; UPSIT (%) = 0.32±0.01]. After behavioral testing, about 2 ml of whole unstimulated saliva was collected and stored at –20°C for later processing.
Table 1
Classification of the cross-sectional study cohort
| Variable | CNh | MCI | AD |
| Number (F) | 19(13) | 21(16) | 17(9) |
| Age | 64±2.63 | 73±1.51 | 72±1.36 |
| BMI | 26.3±1.1 | 23.9±1.03 | 25.3±0.87 |
| CDR | 0.03±0.03 | 0.76±0.06*** | 1.17±0.12*** |
| MMSE | 28.84±0.22 | 22.85±0.310*** | 15.11±1.140*** |
| UPSIT (%) | 78.61±3.80 | 51.1±3.41*** | 37.86±5.45*** |
CNh, cognitively normal healthy; MCI, mild cognitive impairment; AD, Alzheimer’s disease. Values are indicated as mean±standard error of mean and ***p value ≤0.001 referring to the significant difference between the conditions, MCI or AD, and CNh.
Proteomics analysis
FASP separation
Saliva was depleted of amylase prior to processing using potato starch as previously described [30]. The protein concentration of CSF and saliva from 3 cognitively normal subjects and 3 mild AD patients, with confirmed Aβ pathology, were read using a BCA kit (Roth Chemicals, Germany). CSF and saliva protein content was normalized by the addition of a non-ionic Trizma base protein buffer and further processed using a variation of filter-aided sample preparation. FASP proteolytic digestion of the protein samples [31] combines the purification and digestion of proteins [32]. Reduction and alkylation were performed on a single filter unit, followed by an incubation step with DTT for removal of excess iodoacetamide. During the proteolytic digestion, several urea washing steps were performed, followed by the exchange from urea to a volatile MS-compatible ammonium bicarbonate buffer. Separation of peptides was performed by reverse-phase nonoUPLC at 55°C using 25 cm columns packed with 1.8μm C18 peptides.
Liquid-chromatography/mass spectroscopy (LC-MS/MS)
For LC-MS/MS analysis, digested CSF and saliva samples were resuspended in a mobile phase A solution (2% ACN/water, 0.1% formic acid) and then separated by reversed-phase chromatography using a Dionex Ultimate 3000 RSLC nano UPLC system on a homemade 75μm ID×50 cm C18 capillary column (Reprosil-Pur AQ 120 Å, 1.9μm) in line connected with an Orbitrap Fusion Lumos Mass-Spectrometer (Thermo Fisher Scientific, Waltman, MA, USA). Human CSF and saliva peptides were separated by applying a nonlinear 150 min gradient ranging from 99% solvent A (2% ACN and 0.1% FA) to 90% solvent (90% ACN and 0.1% FA) at a flow rate of 250 nl/min.
MS acquisition was performed using a data-dependent acquisition. First MS scans were acquired with a resolution of 120,000 (at 200 m/z) and the 10 most intense parent ions were selected and fragmented by High energy Collision Dissociation (HCD) with a Normalized Collision Energy (NCE) of 32% using an isolation window of 2.0 m/z. Fragmented ions were then excluded for the following 45 s.
Data processing and label-free quantification
MS data were filtered at a peptide and protein level based on their identification score and type, sequence length, replication rate, false discovery rate (FDR) threshold using PEAKS Studio Pro X (Bioinformatics Solution Inc., USA). The raw data files were imported into PEAKS DB software using the following parameters for the PEAKS database search: For protein identification the UniProt/Swiss-Pro human database (release 2018_03) combined with a decoy database was used. For identifying peptides the following settings were used: Enzyme: Trypsin, missed cleavages: 2 precursor mass tolerance: 10 ppm, fragment mass tolerance: 0.7 Da, minimum charge: 2, maximum charge: 5, fixed modifications: Carbamidomethyl (C), variable modifications: Oxidation (M) and Deamidated (N and Q), Phosphorylation (S,T,Y) and Acetylation (N-term). False discovery rate (FDR) was calculated based on the target /decoy database and the peptides with FDR of ≤0.05 were chosen as true positive hits. A total number of proteins is established between biofluid and label-free quantification, and the relative amount of proteins per sample is determined according to their intensities. Keratin contaminants are excluded from the saliva and CSF proteome (Supplementary Material). Protein intensities are log transformed, normalized against total protein, and compared between the biofluids and condition (AD versus Control). Differential expression analysis is performed using the open-access Perseus-Maxquant application [33]. Post-translational modification (PTM) of the common pool of proteins for CSF and saliva are interrogated using PEAKS Studio. Carbamidomethylation of cysteine was set as a fixed modification.
Bioinformatics and Gene Ontology analysis
CSF and saliva proteome from AD patients and age-matched control subjects were investigated using the open-source MaxQuant Perseus proteomics analysis software; protein expression variability within the clinical group was analyzed using homogeneity of variance. Statistically significant differences in protein expression were analyzed using One-way-Anova followed by Post-hoc Bonferroni correction. Saliva and Common CSF and saliva proteome were analyzed using Gene-ontology (GO) analysis via Panther and based on the annotated signaling pathways. Furthermore, on the set of proteins common to CSF, saliva and the Alzgene dataset (https://www.alzgene.org/) [34], as well as on the differentially expressed proteins in AD versus Controls, we investigated the proteins interactions using string v11.0 to construct a map showing predicted functional association based on knowledge and experimental evidence in different organisms.
Western blot analysis
Native saliva was solubilized by the addition of a 4-fold concentrated Laemmli buffer. The protein solution was denatured at 95°C for 10 min and loaded on an electrophoretic gel. Proteins were separated on 12.5% SDS-PAGE and transferred to nitrocellulose (Biorad, USA). Primary antibodies for TTR (sc-377517, Santa Cruz Biotechnology, USA), Tau (sc-32274 or sc-16606, Santa Cruz Biotechnology, USA), were incubated overnight at 4°C, washed the next day, and incubated with fluorescent conjugated secondary antibodies (Invitrogen, USA) [7]. The proteins were detected using the Omega Lum (Labgene, CH). After immunolabeling, the membranes were stained using total protein impregnating solution Revert (LI-COR Biosciences-GmbH, Germany). The optical density of the protein bands was determined using Image J software and normalized to Revert.
Statistical analysis
The classification of the study cohort and calculations were executed in Excel 2019. For all the other analysis and graphics with R version 3.6.3 was used.
For the statistics, the normality of each data set was tested by the Shapiro-Wilk test and Levene’s test. For normally distributed values, t-test and one-way ANOVA for multiple comparison were conducted, whereas for not normally distributed values, Wilcoxon-Mann-Whitney-Test, Kruskal-Wallis for multiple comparisons were performed. The results were considered statistically significant when the p-value was less than 0.05. Variables are expressed in the text as average±standard error of the mean. For graphical representations, boxplots were produced by using the geom_boxplot() and stat_boxplot() functions of package ggplot2.
RESULTS
FASP proteomic analysis of saliva
To determine target proteins of saliva, FASP-based proteomics was performed on 3 healthy control subjects (CNh; 70±4.35 years of age) and compared to matched CSF samples. After amylase depletion, we detected a total of 1,459 proteins (Molecular weight = 40.77±61.60) in saliva and 879 proteins in CSF (Molecular weight = 73.54±88.65) with comparable molecular weights. Between CSF and saliva, 288 proteins were detected as common (Fig. 1A). According to the GO analysis, the most observed biological pathways (BP) of this subset of proteins are blood coagulation, followed by inflammation, cytokine signaling and integrin signaling pathways. The salivary proteins also belong to pathways associated with neurodegenerative diseases like Huntington’s disease, AD, and PD (Fig. 1B). For further analysis, the Alzgene set, a list of genes reported to be associated with AD [34, 35], was used to identify the set of proteins that are related to AD according to the evidence in the literature. As a result, 27 proteins (shared between CSF and saliva) are associated with AD (Fig. 1C) and are functionally interconnected according to the string STRING map analysis with more than one functional activity (Fig. 1D).
Fig. 1
Shotgun proteomics to compare saliva and CSF and correlation analysis of differentially expressed genes in saliva. A) GO Biological pathways for salivary proteins. B) Number of shared proteins between saliva and CSF. C) Number of shared hits between common proteins and AD related proteins. D) STRING map shows the functional association based on the string database indicating the interactome of commonly shared proteins in saliva and CSF with AD. E) Volcano plots showing differential expression in saliva and F) CSF between AD and CN. G) Abundance rank dot plots for saliva and H) CSF shows the range of expression levels for the differentially expressed proteins. I) STRING map shows the interaction of differentially expressed proteins in saliva and J) in CSF. In the STRING map, the pink line represents the known interaction that is experimentally determined, blue line represents the known interaction from curated databases, green line represents predicted interaction due to gene neighborhood, red line represents prediction due to gene fusions and dark blue line represents prediction due to gene co-occurrence.
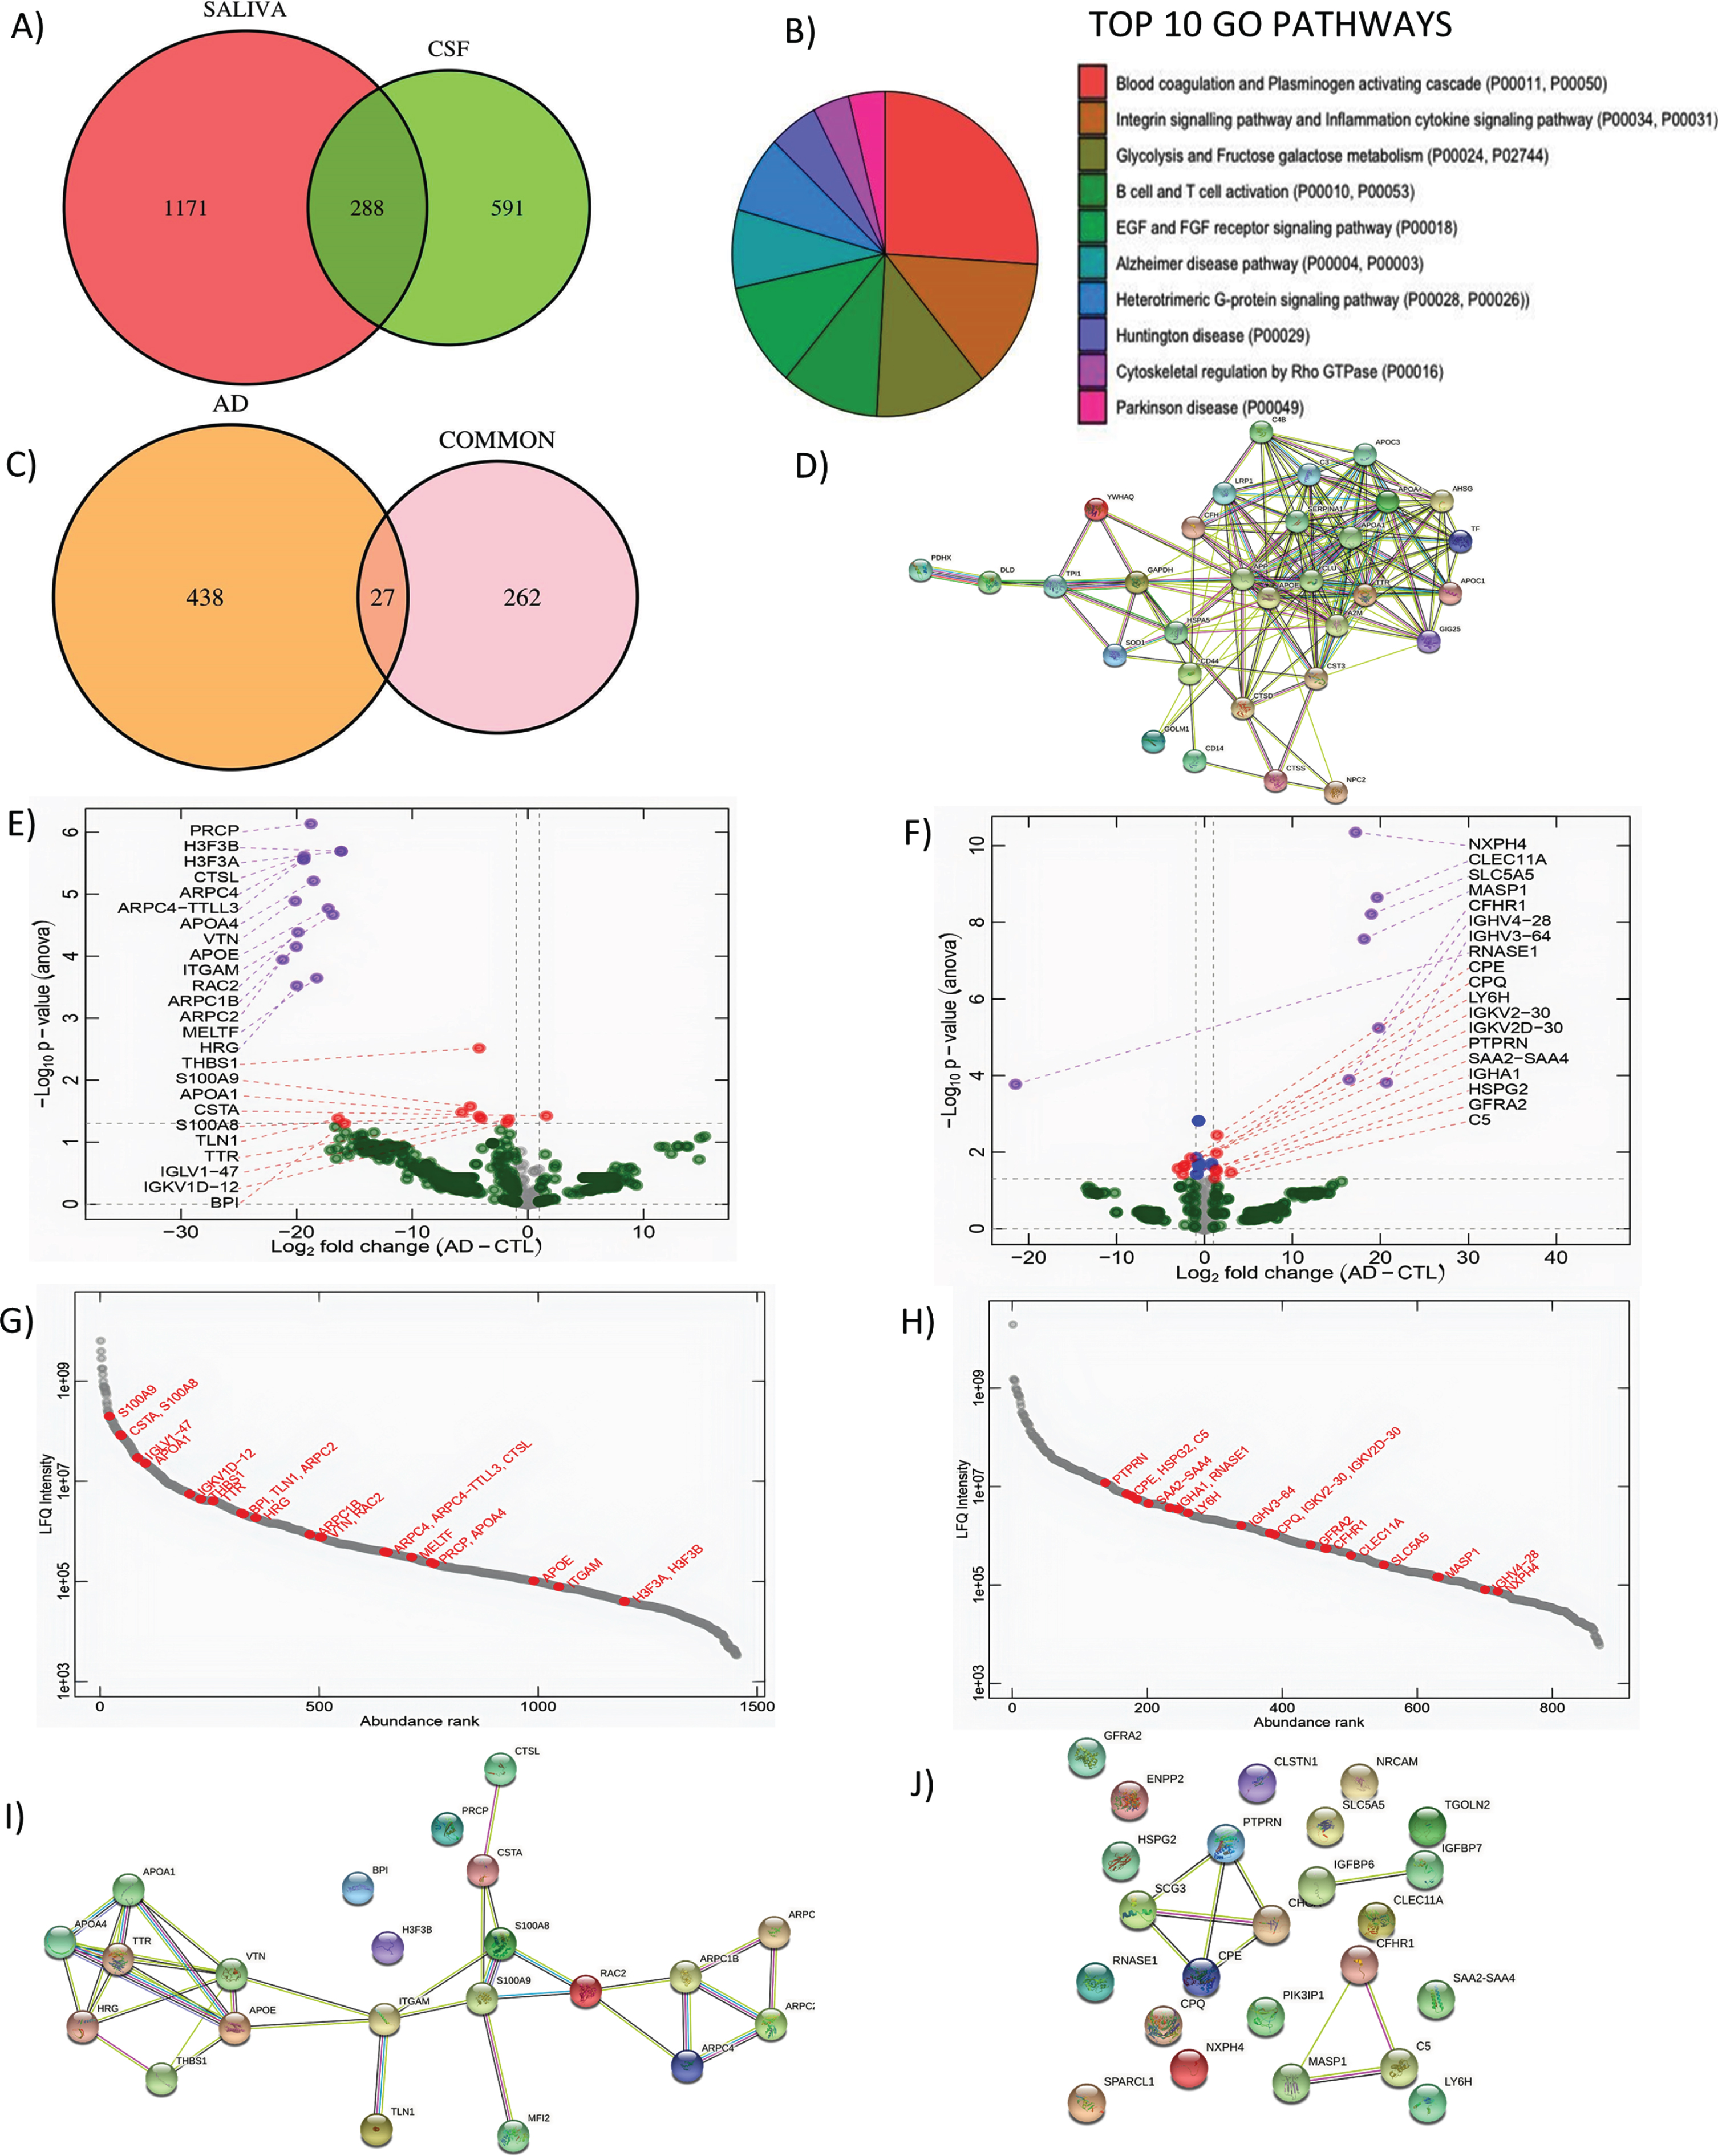
As a further investigation to assess whether the common proteins may have also been shared, the samples were analyzed in PEAKS Studio for post-translational modification (PTM) patterns, with exception of Carbamidomethylation and oxidation which are introduced during the preparation of the samples for LC-MS/MS analysis.
While the saliva peptidome contains 16,241 peptides, the CSF peptidome contains 7,707 peptides, and 2,634 of these peptides are common. More than half of the shared peptidome did not undergo any kind of PTM (1,538). Out of the 27 selected common proteins associated with AD, half of the proteins demonstrated unique PTMs in CSF which are not present in saliva: APOE (Apolipoprotein E), APOA4 (Apolipoprotein A-IV), and APOA1 (Apolipoprotein A-I), HSPA5 (Heat Shock Protein Family A Member 5), SERPINA1 (Serpin Family A Member 1), and TTR. An additional group of shared proteins, CD14 (Cluster Differentiation 14), SOD1 (Superoxide Dismutase 1), CST3 (Cystatin C or cystatin 3), TF (Transferrin), AH5G, and CFH (Complement Factor H), display more PTMs in CSF as compared to saliva and share at least one common type of PTM with the exclusion of TF. On the other hand, selected metabolic proteins in saliva present unique PTMs, which are not present in CSF: YWHAQ (Tyrosine 3-Monooxygenase/Tryptophan 5-Monooxygenase Activation Protein Theta), GOLM1 (Golgi membrane protein 1), ad GAPDH (Glyceraldehyde-3-phosphate dehydrogenase). Overall, we could not find differentiating types of PTMs in saliva and CSF proteins showed on average a higher number of PTMs. The types of PTMs which are more frequent in our analysis did not show any specific relation with AD according to the published literature.
Analysis of the differentially expressed proteins obtained by shotgun proteomics analysis of CSF and saliva from 3 mild AD (20.6±0.88 MMSE, 72±3.6 years of age) and compared to 3 CTL age-matched subjects (29±0.57 MMSE, 70±4.35 years of age) reveals a pool of differential expressed proteins. The salivary and CSF proteome show a deletion of salivary proteins in AD while differential expressed CSF proteins are both up and downregulated in AD as compared to CTL (Fig. 1E, F). The abundance rank dot plots for salivary and CSF show that differentially expressed proteins are distributed over the entire range of intensities with S100A9, S100A8, APOA1, THBS1, and TTR in the highly abundant proteins (Fig. 1G). For CSF, the abundance distribution for the differential expressed protein is narrower than saliva but spans a range of intensities confirming the depth of the analysis for both biofluids (Fig. 1H). Interestingly, in the differentially expressed hits between AD and CTL we identified: S100A9 (CTL = 28.09±1.51, AD = 23.11±2.01, p = 0.026), S100A8 (CTL = 26.75±1.55, AD = 22.54±1.82, p = 0.038), APOA1 (CTL = 25.07±1.25, AD = 19.37±2.82, p = 0.033), THBS1 (CTL = 22.93±0.44, AD = 18.72±1.05, p = 0.030), and TTR (CTL = 26.35±1.41, AD = 18.30±1.90, p = 0.042). These molecules showing a depletion in AD, have previously reported association to Aβ metabolism [36–39]. The STRING analysis for differentially expressed proteins in CSF and saliva indicates that Saliva had more protein-protein interactions as compared to CSF (Fig. 1I, J). In saliva, TTR is found to associate with APOA1 directly and has indirect association to APOE and APOA4, which are known to be a relevant biomarker for AD. S100 A8 was directly associated with Melanotransferrin, and indirectly linked to the APOE family (Fig. 1I). On the other hand, predicted functional associations in CSF are weaker, with only SCG3 (Secretagogin-3; CTL = 25.31±0.24 and AD = 24.98±0.22, p = 0.038) associated with CHGA (Chromogranin-A; CTL = 25.81±0.24 and AD = 24.98±0.22, p = 0.038) and C5 (Complement 5; CTL = 21.64±0.49 and AD = 22.81±0.52, p = 0.048) linked to MASP1 (Mannan binding lectin serine peptidase 1; CTL = 0.00±0.00 and AD = 18.12±0.25, p < 0.001) and CFHR1 (Complement factor H-related protein 1; CTL = 0.00±0.00 and AD = 19.81±0.25, p < 0.001) (Fig. 1J).
The strong interactome map in Saliva suggests that this biofluid is suitable to pursue the investigation of brain-associated biomarkers and their function during aging. Based on the role of TTR in Aβ misfolding, we decided to concentrate on this biomarker to understand whether it could be of potential diagnostic use.
Validation of clinically relevant protein biomarker
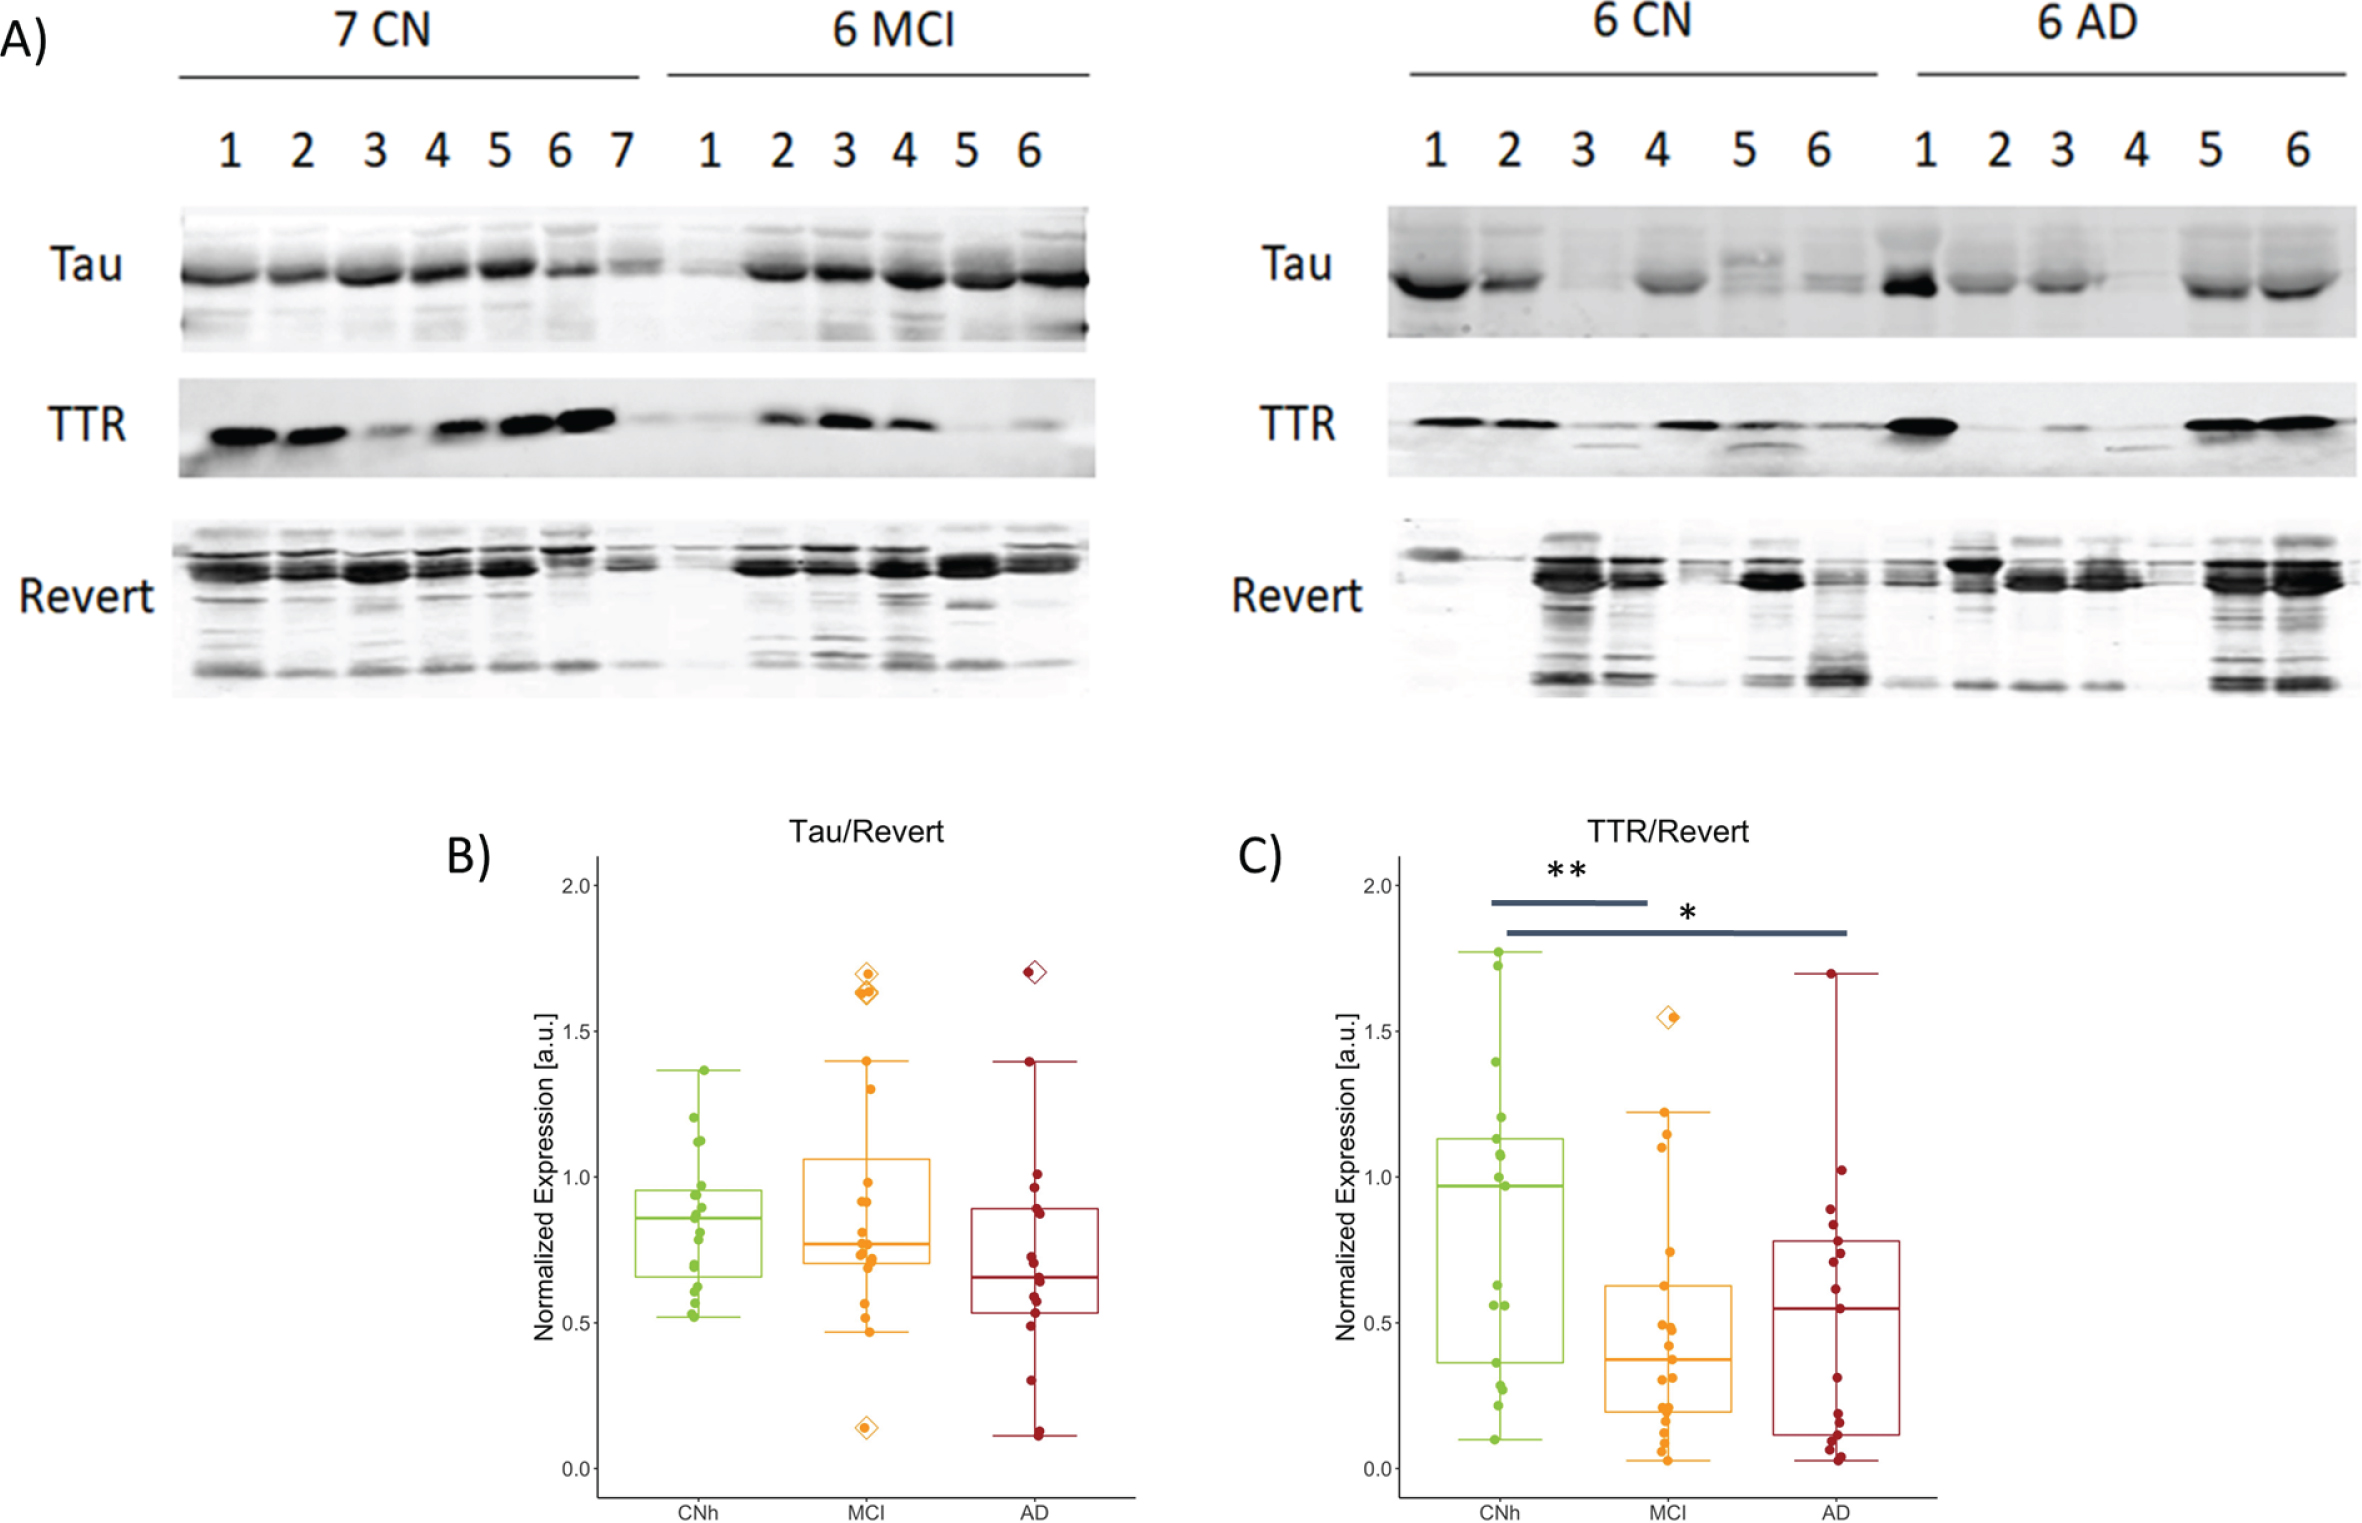
TTR
To validate the expression of TTR in saliva we performed western blot analysis followed by semiquantitative analysis. Representative immunoblots for paired comparisons CNh and MCI and CNh and AD were probed for TTR, the biomarker of interest, Tau as cytoskeletal marker, and counterstained with Revert, as loading control (Fig. 1A). While normalized tau to Revert levels show no significant difference among condition (Fig. 2B; CNh = 0.85±0.24, MCI = 1.20±1.39, AD = 0.72±0.88 (mean±SEM); One-way ANOVA with Post-hoc Tukey’s test, F2,56 = 1.48, p = 0.237), normalized TTR showed a significant difference across conditions with a quantitatively similar reduction in MCI and AD as compared to CNh (Fig. 2C; CNh = 0.99±0.149, MCI = 0.49±0.09, AD = 0.519±0.107, (mean±SEM) One-way ANOVA with Post-hoc Tukey’s test, F2,54 = 5.414, p = 0.00719).
Fig. 2
Abundance of TTR and S100A8 among the stages of AD. A) Representative images from western blot procedure to capture TTR and Tau bands, 17 kDa and 79 kDa respectively. No. of samples analyzed: CNh = 19, MCI = 21, AD = 17. Box plots with jitter across CNh, MCI, and AD groups show B) Tau expression normalized to loading control, Revert, CNh versus MCI t39 = 0.291, p = 0.437; CNh versus AD t35 = 0.278 p = 0.906; MCI versus AD t37 = 0.185 p = 0.241, C) normalized TTR, CNh versus MCI t39 = 0.007 p = 0.437; CNh versus AD t35 = 0.018 p = 0.019; MCI versus AD t37 = 0.845 p = 0.241. The whiskers on the boxplot represents the range of population and the horizontal line the median, *p < 0.05 and **p < 0.01.
DISCUSSION
Our study has the objective of identifying molecular hallmarks in saliva for early diagnostic detection of AD. With a lack of effective therapeutics, the search for early diagnosis methods is taking center stage with the scope of engaging subjects at risk and plan disease modifying interventions as early as possible in the disease continuum. Peripheral biomarkers have been shown to be non-invasive, cost-efficient diagnostic matrices that prominently reflect cerebral Aβ and p-tau/t-tau pathologies.
In particular, blood which is already used as routine biofluid in clinical diagnosis, is a convenient and timely biomarker source in the preclinical stages of AD. Among the plasma biomarkers, p-tau181 and p-tau271 species have emerged as most reliable for identifying prodromal cases with conversion to dementia within 2 years [40, 41]. Nevertheless, blood drawing is usually practiced by a medical professional restricting the direct use by patients. Furthermore, the low concentration of brain-derived molecules in blood requires ultrasensitive technologies for measurement limiting their presence in low-resource environments [42].
On the other hand, saliva, a filtered biofluid with high biological stability, represents a promising non-invasive source for the early diagnosis of AD. The accessibility and the rich composition of saliva have attracted interest in the discovery of new biomarkers species through proteomic analysis informing about the disease states. So far, salivary proteomics has been employed in periodontal disease [43] and oral cancer [44]. Earlier reports have indicated that the salivary proteome transforms with aging [45], suggesting that age-related diseases such as AD, may found in saliva a novel source of sentinel biomarkers. Indeed, previous work has indicated that salivary glands producing Aβ and tau [46, 47] are hypofunctional in AD patients [48] inferring that the biological content of saliva could capture early parasympathetic dysfunctions, already observed in other organs [49]. Our study confirms that saliva and CSF share 288 target proteins of which 27 are directly associated with AD according to the Alzgene dataset underlining the potential use of these targets in monitoring brain health. In addition, previous work indicates that disease states can alter the PTMs of the salivary proteome [50] providing an additional insight in the differential analysis of those salivary hits in AD and Control subjects. Nevertheless, from our shot-gun LC-MS/MS, PTMs of the 27 common hits are generally depleted in saliva as compared to CSF independently of the condition, supporting that PTMs are biofluid-specific and precluding the ability of assigning a neuronal origin for these species using our methodology.
When comparing the salivary proteome from Control subjects and AD patients, we observed a general reduction in protein expression in AD, in contrast to the balance in upregulated and downregulated proteins in CSF with no common differential hit detected. The reduced protein content in saliva from AD subjects is less documented and may be related to the reported salivary flow dysfunction with aging [45]. Already, two studies showed that salivary Lf is progressively reduced with the advancement of the disease and inversely correlates with amyloid pathology [16, 51], suggesting a depletion of the biological composition of saliva linked to oral dysbiosis [25]. Our own LC-MS/MS screen indicates a reducing trend in Lf in saliva from AD subjects, which is however not significant in the set of samples.
Among the differentially expressed salivary proteins in AD, we found TTR already known for a direct association with AD based on its amyloid binding properties, preventing its fibrillogenesis and aggregation [52, 53]. The overproduction of Aβ1-42, which is reported in the saliva of subjects with MCI [14], may indicate the failure of the TTR-mediated sequestering system [54]. Indeed a reduction in TTR expression was previously reported in AD patients both in CSF [55] and blood [56, 57] showing an inverse correlation with the increasing severity of the disease. These studies and the evidence that mutation in TTR gene causes liver amyloidosis [58] indicate that the drop in the clearing capacity of TTR may be instrumental for the increased Aβ42 misfolding also in the brain. We performed validation of TTR changes using western blot on whole saliva. While immunoblot returns only semi quantitative data, proteins in saliva can be directly denatured without pre-processing and can be easily measured also in low technological settings, as previously demonstrated for the assessment of salivary tau species in neurodegenerative diseases [59]. Our own biochemical validation analysis indicates a halving of TTR expression in MCI and AD patients as compared to age-matched healthy controls, whereas tau levels remain unchanged as previously shown [60]. Despite the fact that TTR levels change with the diet and depend on the calories intake [61], the comparable BMI across groups excludes malnutrition as the cause of TTR reduction with the onset of dementia.
The reduction of salivary TTR by increasing Aβ aggregation could influence directly and indirectly the oral microbiome, based on the agglutinating and antimicrobial properties of Aβ [62]. As such, the observed alteration in periodontal and mucosal bacterial species in the progression of AD [25], could be linked to the drop in TTR-dependent Aβ clearance, which is also in line with the reported reduced level of the antimicrobial peptide Lf [16, 51]. Overall, our study suggests TTR as a promising peripheral bioindicator for early AD diagnosis. The results presented here will need subsequent verification but if confirmed, TTR could be added to the existing salivary biomarker panel (Lf and pTau) to obtain a highly accurate estimation of brain health during aging.
The main limitation of the study is the cohort size both in the LC-MS/MS analysis and the subsequent western blot, which provides a preliminary indication about the reduction of TTR already with the onset of cognitive symptoms onward. Nevertheless, our study provides useful information about the protein composition of saliva. The common pool of proteins between saliva and CSF has unveiled a subset of targets with known association with AD that are worth investigating and which support future studies aimed at identifying brain associated markers in saliva for portable and self-samplable PoC applications.
ACKNOWLEDGMENTS
We thank Mrs. Valerie Tache and Mrs. Eva Martin for technical assistance and Dr. Praveen Bathini for his support in the western blot validation.
FUNDING
The study has received funding from the Innovation fund of the Hospital of Fribourg.
CONFLICT OF INTEREST
The authors have no conflict of interest to report.
SUPPLEMENTARY MATERIAL
[1] The supplementary material is available in the electronic version of this article: https://dx.doi.org/10.3233/ADR-210056.
REFERENCES
[1] | Guerchet M , Prince M , Prina M ((2020) ) Numbers of people with dementia worldwide: An update to the estimates in the World Alzheimer Report 2015. Alzheimer’s Disease International, London. |
[2] | Doty RL , Kamath V ((2014) ) The influences of age on olfaction: A review. Front Psychol 5: , 20. |
[3] | Devanand DP , Lee S , Manly J , Andrews H , Schupf N , Doty RL , Stern Y , Zahodne LB , Louis ED , Mayeux R ((2015) ) Olfactory deficits predict cognitive decline and Alzheimer dementia in an urban community. Neurology 84: , 182–189. |
[4] | Devanand DP , Liu X , Tabert MH , Pradhaban G , Cuasay K , Bell K , de Leon MJ , Doty RL , Stern Y , Pelton GH ((2008) ) Combining early markers strongly predicts conversion from mild cognitive impairment to Alzheimer’s disease. Biol Psychiatry 64: , 871–879. |
[5] | Olsson B , Lautner R , Andreasson U , Öhrfelt A , Portelius E , Bjerke M , Hölttä M , Rosén C , Olsson C , Strobel G , Wu E , Dakin K , Petzold M , Blennow K , Zetterberg H ((2016) ) CSF and blood biomarkers for the diagnosis of Alzheimer’s disease: A systematic review and meta-analysis. Lancet Neurol 15: , 673–684. |
[6] | Yaffe K , Weston A , Graff-Radford NR , Satterfield S , Simonsick EM , Younkin SG , Younkin LH , Kuller L , Ayonayon HN , Ding J , Harris TB ((2011) ) Association of plasma beta-amyloid level and cognitive reserve with subsequent cognitive decline. JAMA 305: , 261–266. |
[7] | Tatebe H , Kasai T , Ohmichi T , Kishi Y , Kakeya T , Waragai M , Kondo M , Allsop D , Tokuda T ((2017) ) Quantification of plasma phosphorylated tau to use as a biomarker for brain Alzheimer pathology: Pilot case-control studies including patients with Alzheimer’s disease and down syndrome. Mol Neurodegener 12: , 63. |
[8] | Janelidze S , Berron D , Smith R , Strandberg O , Proctor NK , Dage JL , Stomrud E , Palmqvist S , Mattsson-Carlgren N , Hansson O ((2021) ) Associations of plasma phospho-Tau217 levels with tau positron emission tomography in early Alzheimer disease. JAMA Neurol 78: , 149–156. |
[9] | Ashton NJ , Pascoal TA , Karikari TK , Benedet AL , Lantero-Rodriguez J , Brinkmalm G , Snellman A , Schöll M , Troakes C , Hye A , Gauthier S , Vanmechelen E , Zetterberg H , Rosa-Neto P , Blennow K ((2021) ) Plasma p-tau231: A new biomarker for incipient Alzheimer’s disease pathology. Acta Neuropathol 141: , 709–724. |
[10] | Xiong Y-L , Meng T , Luo J , Zhang H ((2021) ) The potential of neurofilament light as a biomarker in Alzheimer’s disease. Eur Neurol 84: , 6–15. |
[11] | Balietti M , Giuli C , Conti F ((2018) ) Peripheral blood brain-derived neurotrophic factor as a biomarker of Alzheimer’s disease: Are there methodological biases?. Mol Neurobiol 55: , 6661–6672. |
[12] | Chang K-A , Shin KY , Nam E , Lee Y-B , Moon C , Suh Y-H , Lee SH ((2016) ) Plasma soluble neuregulin-1 as a diagnostic biomarker for Alzheimer’s disease. Neurochem Int 97: , 1–7. |
[13] | Delaby C , Gabelle A , Blum D , Schraen-Maschke S , Moulinier A , Boulanghien J , Séverac D , Buée L , Rème T , Lehmann S ((2015) ) Central nervous system and peripheral inflammatory processes in Alzheimer’s disease: Biomarker profiling approach. Front Neurol 6: , 181. |
[14] | Bermejo-Pareja F , Antequera D , Vargas T , Molina JA , Carro E ((2010) ) Saliva levels of Abeta1-42 as potential biomarker of Alzheimer’s disease: A pilot study. BMC Neurol 10: , 108. |
[15] | Shi M , Sui Y-T , Peskind ER , Li G , Hwang H , Devic I , Ginghina C , Edgar JS , Pan C , Goodlett DR , Furay AR , Gonzalez-Cuyar LF , Zhang J ((2011) ) Salivary tau species are potential biomarkers of Alzheimer’s disease. J Alzheimers Dis 27: , 299–305. |
[16] | Carro E , Bartolomé F , Bermejo-Pareja F , Villarejo-Galende A , Molina JA , Ortiz P , Calero M , Rabano A , Cantero JL , Orive G ((2017) ) Early diagnosis of mild cognitive impairment and Alzheimer’s disease based on salivary lactoferrin. Alzheimers Dement 8: , 131–138. |
[17] | Yilmaz A , Geddes T , Han B , Bahado-Singh RO , Wilson GD , Imam K , Maddens M , Graham SF ((2017) ) Diagnostic biomarkers of Alzheimer’s disease as identified in saliva using 1H NMR-based metabolomics. J Alzheimers Dis 58: , 355–359. |
[18] | Sabbagh MN , Shi J , Lee M , Arnold L , Al-Hasan Y , Heim J , McGeer P ((2018) ) Salivary beta amyloid protein levels are detectable and differentiate patients with Alzheimer’s disease dementia from normal controls: Preliminary findings. BMC Neurol 18: , 155. |
[19] | Figueira J , Jonsson P , Nordin Adolfsson A , Adolfsson R , Nyberg L , Öhman A ((2016) ) NMR analysis of the human saliva metabolome distinguishes dementia patients from matched controls. Mol Biosyst 12: , 2562–2571. |
[20] | Hu S , Xie Y , Ramachandran P , Ogorzalek Loo RR , Li Y , Loo JA , Wong DT ((2005) ) Large-scale identification of proteins in human salivary proteome by liquid chromatography/mass spectrometry and two-dimensional gel electrophoresis-mass spectrometry. Proteomics 5: , 1714–1728. |
[21] | Denny P , Hagen FK , Hardt M , Liao L , Yan W , Arellanno M , Bassilian S , Bedi GS , Boontheung P , Cociorva D , Delahunty CM , Denny T , Dunsmore J , Faull KF , Gilligan J , Gonzalez-Begne M , Halgand F , Hall SC , Han X , Henson B , Hewel J , Hu S , Jeffrey S , Jiang J , Loo JA , Ogorzalek Loo RR , Malamud D , Melvin JE , Miroshnychenko O , Navazesh M , Niles R , Park SK , Prakobphol A , Ramachandran P , Richert M , Robinson S , Sondej M , Souda P , Sullivan MA , Takashima J , Than S , Wang J , Whitelegge JP , Witkowska HE , Wolinsky L , Xie Y , Xu T , Yu W , Ytterberg J , Wong DT , Yates JR 3rd , Fisher SJ ((2008) ) The proteomes of human parotid and submandibular/sublingual gland salivas collected as the ductal secretions. J Proteome Res 7: , 1994–2006. |
[22] | Rice AO ((2021) ) Alzheimer’s disease and oral-systemic health: Bidirectional care integration improving outcomes. Front Oral Health 2: , 10.3389/froh.2021.674329. |
[23] | Huan T , Tran T , Zheng J , Sapkota S , MacDonald SW , Camicioli R , Dixon RA , Li L ((2018) ) Metabolomics analyses of saliva detect novel biomarkers of Alzheimer’s disease. J Alzheimers Dis 65: , 1401–1416. |
[24] | Dominy SS , Lynch C , Ermini F , Benedyk M , Marczyk A , Konradi A , Nguyen M , Haditsch U , Raha D , Griffin C , Holsinger LJ , Arastu-Kapur S , Kaba S , Lee A , Ryder MI , Potempa B , Mydel P , Hellvard A , Adamowicz K , Hasturk H , Walker GD , Reynolds EC , Faull RLM , Curtis MA , Dragunow M , Potempa J ((2019) ) Porphyromonas gingivalis in Alzheimer’s disease brains: Evidence for disease causation and treatment with small-molecule inhibitors. Sci Adv 5: , eaau3333. |
[25] | Bathini P , Foucras S , Al E ((2020) ) Classifying dementia progression using microbial profiling of saliva. Alzheimers Dement (Amst) 12: , e12000. |
[26] | Santos SD , Lambertsen KL , Clausen BH , Akinc A , Alvarez R , Finsen B , Saraiva MJ ((2010) ) CSF transthyretin neuroprotection in a mouse model of brain ischemia. J Neurochem 115: , 1434–1444. |
[27] | Zhou L , Tang X , Li X , Bai Y , Buxbaum JN , Chen G ((2019) ) Identification of transthyretin as a novel interacting partner for the δ subunit of GABAA receptors. PLoS One 14: , e0210094. |
[28] | Vieira M , Gomes JR , Saraiva MJ ((2015) ) Transthyretin induces insulin-like growth factor I nuclear translocation regulating its levels in the hippocampus. Mol Neurobiol 51: , 1468–1479. |
[29] | Bürge M , Bieri G , Brühlmeier M , Colombo F , Demonet J-F , Felbecker A , Georgescu D , Gietl A , Brioschi Guevara A , Jüngling F , Kirsch E , Kressig RW , Kulic L , Monsch AU , Ott M , Pihan H , Popp J , Rampa L , Rüegger-Frey B , Schneitter M , Unschuld PG , von Gunten A , Weinheimer B , Wiest R , Savaskan E ((2018) ) Recommendations of Swiss memory clinics for the diagnosis of dementia. Praxis 107: , 435–451. |
[30] | Krief G , Deutsch O , Gariba S , Zaks B , Aframian DJ , Palmon A ((2011) ) Improved visualization of low abundance oral fluid proteins after triple depletion of alpha amylase, albumin and IgG. Oral Dis 17: , 45–52. |
[31] | Distler U , Kuharev J , Navarro P , Tenzer S ((2016) ) Label-free quantification in ion mobility-enhanced data-independent acquisition proteomics. Nat Protoc 11: , 795–812. |
[32] | Wiśniewski JR , Zougman A , Nagaraj N , Mann M ((2009) ) Universal sample preparation method for proteome analysis. Nat Methods 6: , 359–362. |
[33] | Tyanova S , Temu T , Sinitcyn P , Carlson A , Hein MY , Geiger T , Mann M , Cox J ((2016) ) The Perseus computational platform for comprehensive analysis of (prote)omics data. Nat Methods 13: , 731–740. |
[34] | Bertram L , McQueen MB , Mullin K , Blacker D , Tanzi RE ((2007) ) Systematic meta-analyses of Alzheimer disease genetic association studies: The AlzGene database. Nat Genet 39: , 17–23. |
[35] | Hu Y-S , Xin J , Hu Y , Zhang L , Wang J ((2017) ) Analyzing the genes related to Alzheimer’s disease via a network and pathway-based approach. Alzheimers Res Ther 9: , 29. |
[36] | Andrade C ((1952) ) A peculiar form of peripheral neuropathy; familiar atypical generalized amyloidosis with special involvement of the peripheral nerves. Brain 75: , 408–427. |
[37] | Deane R , Du Yan S , Submamaryan RK , LaRue B , Jovanovic S , Hogg E , Welch D , Manness L , Lin C , Yu J , Zhu H , Ghiso J , Frangione B , Stern A , Schmidt AM , Armstrong DL , Arnold B , Liliensiek B , Nawroth P , Hofman F , Kindy M , Stern D , Zlokovic B ((2003) ) RAGE mediates amyloid-beta peptide transport across the blood-brain barrier and accumulation in brain. Nat Med 9: , 907–913. |
[38] | Iwata N , Higuchi M , Saido TC ((2005) ) Metabolism of amyloid-beta peptide and Alzheimer’s disease. Pharmacol Ther 108: , 129–148. |
[39] | Son SM , Nam DW , Cha M-Y , Kim KH , Byun J , Ryu H , Mook-Jung I ((2015) ) Thrombospondin-1 prevents amyloid beta-mediated synaptic pathology in Alzheimer’s disease. Neurobiol Aging 36: , 3214–3227. |
[40] | Moscoso A , Grothe MJ , Ashton NJ , Karikari TK , Lantero Rodríguez J , Snellman A , Suárez-Calvet M , Blennow K , Zetterberg H , Schöll M , Alzheimer’s Disease Neuroimaging Initiative ((2021) ) Longitudinal associations of blood phosphorylated Tau181 and neurofilament light chain with neurodegeneration in Alzheimer disease. JAMA Neurol 78: , 396–406. |
[41] | Palmqvist S , Janelidze S , Quiroz YT , Zetterberg H , Lopera F , Stomrud E , Su Y , Chen Y , Serrano GE , Leuzy A , Mattsson-Carlgren N , Strandberg O , Smith R , Villegas A , Sepulveda-Falla D , Chai X , Proctor NK , Beach TG , Blennow K , Dage JL , Reiman EM , Hansson O ((2020) ) Discriminative accuracy of plasma phospho-tau217 for Alzheimer disease vs other neurodegenerative disorders. JAMA 324: , 772–781. |
[42] | Andreasson U , Blennow K , Zetterberg H ((2016) ) Update on ultrasensitive technologies to facilitate research on blood biomarkers for central nervous system disorders. Alzheimers Dement (Amst) 3: , 98–102. |
[43] | Ghallab NA ((2018) ) Diagnostic potential and future directions of biomarkers in gingival crevicular fluid and saliva of periodontal diseases: Review of the current evidence. Arch Oral Biol 87: , 115–124. |
[44] | Wu C-C , Chu H-W , Hsu C-W , Chang K-P , Liu H-P ((2015) ) Saliva proteome profiling reveals potential salivary biomarkers for detection of oral cavity squamous cell carcinoma. Proteomics 15: , 3394–3404. |
[45] | Helmerhorst EJ , Oppenheim FG ((2007) ) Saliva: A dynamic proteome. J Dent Res 86: , 680–693. |
[46] | Conrad C , Vianna C , Freeman M , Davies P ((2002) ) A polymorphic gene nested within an intron of the tau gene: Implications for Alzheimer’s disease. Proc Natl Acad Sci U S A 99: , 7751–7756. |
[47] | Oh YS , Turner RJ ((2006) ) Effect of γ-secretase inhibitors on muscarinic receptor-mediated calcium signaling in human salivary epithelial cells. Am J Physiol Cell Physiol 291: , C76–C82. |
[48] | Ship JA , DeCarli C , Friedland RP , Baum BJ ((1990) ) Diminished submandibular salivary flow in dementia of the Alzheimer type. J Gerontol 45: , M61–66. |
[49] | Aharon-Peretz J , Harel T , Revach M , Ben-Haim SA ((1992) ) Increased sympathetic and decreased parasympathetic cardiac innervation in patients with Alzheimer’s disease. Arch Neurol 49: , 919–922. |
[50] | Manconi B , Liori B , Cabras T , Vincenzoni F , Iavarone F , Castagnola M , Messana I , Olianas A ((2017) ) Salivary cystatins: Exploring new post-translational modifications and polymorphisms by top-down high-resolution mass spectrometry. J Proteome Res 16: , 4196–4207. |
[51] | González-Sánchez M , Bartolome F , Antequera D , Puertas-Martín V , González P , Gómez-Grande A , Llamas-Velasco S , Herrero-San Martín A , Pérez-Martínez D , Villarejo-Galende A , Atienza M , Palomar-Bonet M , Cantero JL , Perry G , Orive G , Ibañez B , Bueno H , Fuster V , Carro E ((2020) ) Decreased salivary lactoferrin levels are specific to Alzheimer’s disease. EBioMedicine 57: , 102834. |
[52] | Du J , Cho PY , Yang DT , Murphy RM ((2012) ) Identification of beta-amyloid-binding sites on transthyretin. Protein Eng Des Sel 25: , 337–345. |
[53] | Costa R , Gonçalves A , Saraiva MJ , Cardoso I ((2008) ) Transthyretin binding to A-Beta peptide–impact on A-Beta fibrillogenesis and toxicity. FEBS Lett 582: , 936–942. |
[54] | Schwarzman AL , Gregori L , Vitek MP , Lyubski S , Strittmatter WJ , Enghilde JJ , Bhasin R , Silverman J , Weisgraber KH , Coyle PK ((1994) ) Transthyretin sequesters amyloid beta protein and prevents amyloid formation. Proc Natl Acad Sci U S A 91: , 8368. |
[55] | Serot JM , Christmann D , Dubost T , Couturier M ((1997) ) Cerebrospinal fluid transthyretin: Aging and late onset Alzheimer’s disease. J Neurol Neurosurg Psychiatry 63: , 506–508. |
[56] | Velayudhan L , Killick R , Hye A , Kinsey A , Güntert A , Lynham S , Ward M , Leung R , Lourdusamy A , To AWM , Powell J , Lovestone S ((2012) ) Plasma transthyretin as a candidate marker for Alzheimer’s disease. J Alzheimers Dis 28: , 369–375. |
[57] | Han S-H , Jung ES , Sohn J-H , Hong HJ , Hong HS , Kim JW , Na DL , Kim M , Kim H , Ha HJ , Kim YH , Huh N , Jung MW , Mook-Jung I ((2011) ) Human serum transthyretin levels correlate inversely with Alzheimer’s disease. J Alzheimers Dis 25: , 77–84. |
[58] | Adams D , Koike H , Slama M , Coelho T ((2019) ) Hereditary transthyretin amyloidosis: A model of medical progress for a fatal disease. Nat Rev Neurol 15: , 387–404. |
[59] | Pekeles H , Qureshi HY , Paudel HK , Schipper HM , Gornistky M , Chertkow H ((2019) ) Development and validation of a salivary tau biomarker in Alzheimer’s disease. Alzheimers Dement 11: , 53–60. |
[60] | Ashton NJ , Ide M , Schöll M , Blennow K , Lovestone S , Hye A , Zetterberg H ((2018) ) No association of salivary total tau concentration with Alzheimer’s disease. Neurobiol Aging 70: , 125–127. |
[61] | Dellière S , Cynober L ((2017) ) Is transthyretin a good marker of nutritional status?. Clin Nutr 36: , 364–370. |
[62] | Lee EY , Srinivasan Y , de Anda J , Nicastro LK , Tükel Ç , Wong GCL ((2020) ) Functional reciprocity of amyloids and antimicrobial peptides: Rethinking the role of supramolecular assembly in host defense, immune activation, and inflammation. Front Immunol 11: , 1629. |


