
Molecular Investigation of the Unfolded Protein Response in Select Human Tauopathies
Abstract
Background:
Tauopathies are a group of neurodegenerative diseases associated with the accumulation of misfolded tau protein. The mechanisms underpinning tau-dependent proteinopathy remain to be elucidated. A protein quality control pathway within the endoplasmic reticulum, the unfolded protein response (UPR), has been suggested as a possible pathway modulating cellular responses in a range of neurodegenerative diseases, including those associated with misfolded cytosolic tau.
Objective:
In this study we investigated three different clinically defined tauopathies to establish whether these diseases are accompanied by the activation of UPR.
Methods:
We used PCR and western blotting to probe for the modulation of several reliable UPR markers in mRNA and proteins extracted from three distinct tauopathies: 20 brain samples from Alzheimer’s disease patients, 11 from Pick’s disease, and 10 from progressive supranuclear palsy. In each disease samples from these patients were compared with equal numbers of age-matched non-demented controls.
Results:
Our investigation showed that different markers of UPR are not changed at the late stage of any of the human tauopathies investigated. Interestingly, UPR signatures were often observed in non-demented controls.
Conclusion:
These data from late-stage human cortical tissue report an activation of UPR markers within the aged brain across all cohorts investigated and further support the emerging evidence that the accumulation of misfolded cytosolic tau does not drive a disease-associated activation of UPR.
INTRODUCTION
The microtubule associated protein tau is hyperphosphorylated, misfolded, and accumulated in an aggregated form in several conditions, including the most common cause of dementia, Alzheimer’s disease (AD) [1]. In AD, the accumulation of tau lesions forms neurofibrillary tangles (NFTs) and is accompanied by the deposition of amyloid-β (Aβ) plaques [2]. The presence of Aβ plaques alone is not sufficient to cause disease, and Aβ deposition has been reported in aged brains without the presence of clinical symptoms of dementia [3, 4]. In contrast, tau pathology in AD is well correlated with the cognitive and clinical symptoms. Further, deposition of tau can be observed in other neurodegenerative diseases independent of Aβ plaques [5]. These diseases are classified as primary tauopathies due to the fact that misfolded tau is a primary hallmark of the observed pathology [2]. Different tauopathies are distinguished by the relative contribution or prevalence of the distinct tau isoforms (3R or 4R) to the misfolded tau deposits. They are associated with differential anatomical distribution of the disease-affected cell types [6]. Pick’s disease (PiD) is a 3R tauopathy in which tau accumulates, forming large spherical Pick bodies. In contrast, progressive supranuclear palsy (PSP) is an example of a 4R tauopathy with the spherical ‘globose’ NFTs being found in degenerating neuronal structures [7]. Importantly, high resolution structural information of the purified aggregates from distinct diseases indicates the presence of disease-selective misfolds [8–10].
There are currently no disease-modifying treatments against neurodegenerative diseases. However, the fact that neurodegeneration is associated with disturbed protein homeostasis is well established [11, 12]. For this reason, the unfolded protein response (UPR), a protein quality control pathway within the endoplasmic reticulum (ER), is frequently suggested to play a role in neurodegenerative processes [13–16]. The UPR is classically induced as a response to protein misfolding occurring within the lumen of the ER. Three branches of an activated UPR can be distinguished and characterized by different signaling components: IRE1 (inositol requiring enzyme 1), PERK (protein kinase R-like endoplasmic reticulum kinase), and ATF6 (activating transcription factor 6) [17, 18]. Activation of UPR through any of these three arms upregulates the protein-folding capacity and re-establishes protein homeostasis. However prolonged UPR activation leads to cellular death [12]. UPR induction has been described for different neurodegenerative diseases, including tauopathies such as AD and PiD [13, 14, 19]. Therefore, the idea of targeting UPR as a possible treatment for tau-related neurodegenerative diseases has emerged [16, 20]. However, this concept has been called into question due to the fact that tau is a cytosolic protein that does not form aggregates in the ER compartment and thus, it is unclear how tau misfolding would induce a classical ER dependent UPR activation [12].
UPR induction has been investigated in transgenic mouse models of tauopathy with opposing results reported [16, 20, 21]. We have previously used in vivo and in vitro pre-clinical models of tauopathy and found no indication of UPR activation in response to misfolded tau across the time course of these models [22]. Since these models recapitulate only select aspects of the human pathology, we investigated whether human tauopathies evidence an activation of the UPR. Here, we analyzed cortical tissue from human AD patients, as AD is the most prevalent tau-related dementia. However, since AD is not solely associated with tau pathology, we also investigated cortical tissue derived from patients diagnosed with primary tauopathies: PiD and PSP. We thus chose a 3R (PiD), a 4R (PSP), and a mixed 3R/4R (AD) tauopathy to investigate whether we could find evidence for a UPR activation in these distinct diseases. We performed PCR and western blot experiments using reagents that readily detect the UPR in perturbed human cell lines. We measured the mRNA and protein level of several markers involved in the UPR branches including read-outs that signal activation of any of the three activation routes outlined above. In all three different diseases related to tau pathology we did not find an association of late stage tau pathology with UPR activation. This study utilizing human samples is consistent with a growing number of studies that do not report UPR in experimental models of chronic neurodegeneration [21, 22]. Interestingly, we readily observe UPR activation across all cohorts investigated, independently of tauopathy diagnosis, suggesting it is a common feature within the aged brain.
MATERIALS AND METHODS
Materials
The primary antibodies used in this study were: anti-BiP (RRID: AB_2119845, Cell Signaling, #3177, 1 : 500 dilution), anti-CHOP (RRID:AB_2089254, Cell Signaling, #2895, 1 : 1000 dilution), anti-p-eIF2α (RRID:AB_2096481, Cell Signaling, #3398, 1 : 1000 dilution), anti-eIF2α (RRID: AB_836874, Cell Signaling, #2103, 1 : 1000 dilution), anti-tau (RRID:AB_10013724, DAKO, #A0024, 1 : 1000 dilution), anti-GAPDH (RRID:AB_2107448, Abcam, #ab8245, 1 : 5000 dilution), anti–actin (Sigma-Aldrich Cat# A4700, RRID:AB_476730), PHF-1 (detecting p-Ser396/p-Ser404, RRID:AB_2315150, generous gift from Prof. Peter Davies, 1 : 5000 dilution, [23]), AT8 (detecting p-Ser202/p-Thr205, RRID:AB_223647, #MN1020, ThermoScientific).
Secondary antibodies were conjugated to IRDyes (LI-COR Biosciences) and used at 1 : 10000 dilution.
The oligonucleotide primers used in the qPCR and PCR reactions were obtained from Eurofins Genomics. The sequences of the primers for each gene are shown in Table 1.
Table 1
Sequences of the primers used for the PCR experiments
| Gene | Primers | Amplicon length [bp] |
| GAPDH | Forward: 5-TTCCAATATGATTCCACCCATG-3 | 92 |
| Reverse: 5-AGCATCGCCCCACTTGATTT-3 | ||
| XBP-1 | Forward: 5-GCTCAGACTGCCAGAGATCG-3 | 377 (unspliced) |
| Reverse: 5-GTCCAGAATGCCCAACAGGAT-3 | 351 (spliced) |
bp, base pair.
Cases
AD brain tissue was sourced from the South West Dementia Brain Bank comprising 20 AD cases and 20 controls (nAD). The inferior parietal lobule, as an area of the cerebral cortex typically affected by AD pathology [24], was investigated for all cases (Table 2). Eleven PiD and 11 controls (nPiD) as well as 10 PSP and 10 controls (nPSP) were provided by the London Neurodegenerative Diseases Brain Bank, the South West Dementia Brain Bank and the Oxford Brain Bank with the frontal cortex investigated for the FTD and control cases (Table 3 for nPiD and PiD cases and Table 4 for nPSP and PSP cases). Cases with any other significant brain pathologies such as stroke, tumor, or traumatic brain injury were excluded from the study. Controls with no history of neurological or psychiatric disease or symptoms of cognitive impairment were matched with age, gender, and postmortem delay as closely as possible. To minimize the time in formalin, which has an effect on the quality of the immunostaining, the selection was performed on the availability of formalin fixed paraffin embedded tissue, and thus on blocks processed at the time of the original postmortem examination. Fresh frozen tissue with a pH > 5.5 was selected to ensure RNA integrity [25, 26]. Brain tissue adhering to this criterion was homogenized and used as a source of control and disease associated mRNA and protein.
Table 2
Demographic, clinical, and postmortem characteristics of nAD and AD groups
| Cohorts | nAD | AD |
| n = 20 | n = 20 | |
| Gender | 13F:7M | 11F:9M |
| Age of Death (y, mean±SD) | 85±1.3 | 80±1.3 |
| Age of AD onset (y, mean±SD) | N/A | 70±1.4 |
| Duration of AD (y, mean±SD) | N/A | 10±1.0 |
| Braak stage | 0–II: 19 | 0–II: 0 |
| III–IV: 1 | III–IV: 2 | |
| V–VI: 0 | V–VI: 18 | |
| APOE genotype | ɛ4/–: 2 | ɛ4/–: 3 |
| ɛ4/ɛ4 : 1 | ɛ4/ɛ4 : 3 | |
| Postmortem delay (h, mean±SD) | 43.3±5.6 | 42.9±6.1 |
N/A, non-applicable.
Table 3
Demographic, clinical, and postmortem characteristics of nPiD and PiD groups
| Cohorts | nPiD | PiD |
| n = 11 | n = 11 | |
| Gender | 4F:7M | 3F:8M |
| Age of Death (y, mean±SD) | 74±2 | 72±2 |
| Postmortem delay (h, mean±SD) | 44±5 | 40±6 |
Table 4
Demographic, clinical, and postmortem characteristics of nPSP and PSP groups
| Cohorts | nPSP | PSP |
| n = 10 | n = 10 | |
| Gender | 6F:4M | 5F:5M |
| Age of Death (y, mean±SD) | 77±2 | 75±2 |
| Postmortem delay (h, mean±SD) | 39±6 | 37±5 |
Ethics approval
Ethical approval was provided by the South West Dementia Brain Bank (REC approval 08/H0106/28 + 5, the London Neurodegenerative Diseases Brain Bank (REC approval 08/H0704/128), and the Oxford Brain bank (REC approval 51/SC/0639). This was a non-registered postmortem study.
Immunohistochemistry
Immunohistochemistry against phosphorylated (p)-tau protein was performed on 6μm paraffin-embedded sections using the clone AT8 (RRID:AB_223647, #MN1020, ThermoScientific). Sections were deparaffined, rehydrated, and incubated in a solution of 3%H2O2 in methanol to block the endogenous peroxidase. The saturation step was performed before incubation with primary antibody overnight at 4°C. Biotinylated secondary antibody goat anti-mouse from Vector Laboratories (RRID:AB_2336171, Peterborough, UK) was applied to the sections the next day followed by development of immunohistochemical reactivity using the avidin–biotin–peroxidase complex method (RRID:AB_2336819, Vectastain Elite, Vector Laboratories) with 3,3′-diaminobenzidine as chromogen and 0.05%hydrogen peroxide as substrate (RRID:AB_2336382, Vector Laboratories). All sections were counterstained with hematoxylin, then dehydrated and mounted in Pertex (Histolab Products AB). Staining was performed in several batches with each batch containing disease and control cases to ensure comparability of immunolabeling. All experiments included a negative control slide incubated in buffer with no primary antibody.
Image quantification
Quantification was performed by observers blinded to the experimental group and identity of the cases. The slides were scanned at a magnification of x20 in an automated slides scanner microscope Olympus VS110 (Olympus America Inc.) and visualized with Olympus VS-Desktop software to allow extraction of 40 regions of interest (ROIs) in the grey matter. The ROIs were obtained in a zigzag sequence to ensure sampling of all six cortical layers as previously published [27, 28]. Quantitative image analysis was carried out with ImageJ (version 1.52p, Wayne Rasband, NIH, USA) using an automated macro to obtain an area fraction expressed as protein load (%). The mean value was calculated for each case.
Tissue homogenization
The brain samples were homogenized in 5 volumes (w/v) of sterile PBS containing cOmplete Mini EDTA-free Protease Inhibitor Cocktail tablets (Roche, #4693159001), sodium fluoride (10 mM, Fisher Scientific, #10528070) and sodium orthovanadate (2 mM, Sigma, #S6508). The samples were homogenized using Kontes pellet pestle motor and plastic pellet pestles. The homogenized samples were then used for RNA or protein extraction [29].
RNA extraction
RNA was isolated from 100μl of homogenate using the Trizol method. The RNA was purified using RNeasy kit (Qiagen, #74104). RNA amount and quality was analyzed using NanoDrop spectrophotometer (Thermo Fisher Scientific). The RNA exhibited an absorbance maximum at 260 nm (A260) and the ratio of A260/A280 was ∼2. The extracted RNA was treated with Precision DNase (Primer Design, #DNASE-50) according to manufacturer’s instructions. 200 ng of RNA was reverse transcribed using Precision nanoScript 2 reverse transcription kit (Primer Design, #RT-NanoScript2) according to manufacturer’s instructions.
XBP-1 splicing
RedTaq ReadyMix PCR Reaction Mix (Sigma Aldrich, #R2523), 1μl of cDNA (obtained as described above) and primers (0.2μM) detecting both, spliced and unspliced, forms of XBP-1 were used for end point PCR. The specificity of the primers was verified using a positive control, cDNA from HEK cells treated with tunicamycin (Supplementary Figure 1A). The samples were kept on ice before being heated at 94°C for 2 min. Subsequently, the samples were subjected to 40 cycles of denaturation at 94°C for 40 s, annealing at 60°C for 30 s, extension at 72°C for 1 min using GeneAmp PCR System 9700 (Applied Biosystems). A final extension was performed at 72°C for 10 min. The amplicons of this high cycle number PCR reaction were separated on 2.5%agarose gel. The no template control that did not contain cDNA was run alongside the samples and failed to show XBP-1 amplification. It shows the specificity of the amplification. The details of the primers used for the detection of spliced XBP1, and GAPDH as control, can be found in Table 1.
Western blotting and analysis
Proteins from PBS-homogenized samples were extracted with the equal volume of 2x extraction buffer containing HEPES-NaOH (40 mM, pH 7.4, Fisher Scientific, #10081113), NaCl (250 mM, Sigma Aldrich, #S7653), SDS (4%), cOmplete Mini EDTA-free Protease Inhibitor Cocktail tablets (Roche, #4693159001), sodium fluoride (10 mM, Fisher Scientific, #10528070), and sodium orthovanadate (2 mM, Sigma, #S6508). After extraction, protein concentration was measured using Bio-Rad DC protein assay kit (#5000112) according to manufacturer’s instructions.
The samples were mixed to give a final concentration of 2μg/μl with 5x sample buffer containing Tris-HCl (312.5 mM, pH 6.8), SDS (10%), glycerol (50%), dithiothreitol (25 mM), and bromophenol blue dye (0.005%).
These samples were boiled for 10 min at 95°C, briefly spun before loading to 12%acrylamide gel. Tauopathy cases were always run on the same gel as the relative age-matched controls. After loading, the samples were separated by SDS-PAGE and transferred to nitrocellulose membrane. The membranes were blocked in the blocking solution (2.5%BSA, TBS with 0.1%Tween) for 1 h and then incubated at 4°C overnight with the primary antibody diluted in the blocking solution. The membrane was then incubated with the secondary antibody at room temperature for 1 h. Immunoreactivity was revealed using an Odyssey Infrared Imaging System (LI-COR Biosciences). The Image Studio Scanner software was used to capture the image and Image Studio Lite software was used to quantify the intensities of the bands, using the area above and below the band for background subtraction. Cases were analyzed across multiple blots. For this they were split to ensure equal numbers of control and diseased cases to be resolved on individual gels before transfer to membranes that were processed in parallel. Measurement of GAPDH allowed for normalization to individual sample loading as well as comparison of matched membranes. Exposures that showed minimal difference in GAPDH intensity between membranes were used for quantification. The ability of the antibodies to detect UPR markers induction was verified using positive control, protein extracted from tunicamycin-treated HEK cells (Supplementary Figure 1B–D). Only antibodies that were capable of detecting increased immunoreactivity of positive control were used in this study.
Statistical analysis
The normality of distribution of the data was determined using the Shapiro-Wilk test. Data that passed the normality test and had equivalent standard deviations were compared using a T-test for parametric data, otherwise the Mann-Whitney U-test for non-parametric data was used. One-sided tests were used when comparing the level of p-tau and total tau between disease and control cases based on the prediction that p-tau is increased and tau inclusions accumulate in tauopathy cases. Total tau levels were further compared using JASP statistics software to perform a Bayesian independent samples t-test [30]. For the UPR markers, two-sided tests were assumed. Correlations between the different markers were analyzed by either Pearson’s (parametric) or Spearman’s (non-parametric) test. Fisher’s exact test was used for comparison between disease and control cases to assess the presence of XBP-1 splicing. No test for outliers was performed. All analyses were performed with SPSS software (version 25, IBM) or GraphPad Prism. p values less than 0.05 for intergroup comparisons and 0.01 for correlations were considered statistically significant. Graphs were prepared with GraphPad Prism software (version 8, La Jolla, CA).
RESULTS
Tau phosphorylation in neurodegeneration
Tauopathies are characterized by the increased phosphorylation and accumulation of hyperphosphorylated tau. We used immunohistochemistry to investigate the presence of tau phosphorylation in our samples. This analysis confirmed the presence of tau pathology in the AD, PiD, and PSP cases, using the commonly utilized AT8 antibody that recognizes the disease associated increase in pSer202/pThr205 of tau. In AD, dystrophic neurites, neuropil threads and NFTs were observed in the disease sections but were absent in the non-demented age matched controls (Supplementary Figure 2A). For PiD, this AT8 p-tau was localized in neurons, labelling Pick bodies, and neuropil (Supplementary Figure 2B). In the PSP cases, the pathology clearly presented NFTs in the cortex (Supplementary Figure 2C). Representative stains that highlight these features that were selectively found in the AD, PiD, and PSP disease cohorts, together with the corresponding quantitation, are shown in Supplementary Figure 2. In parallel, we homogenized and extracted mRNA and proteins from the brains of the listed cases (Methods section). To benchmark the cases investigated, we performed western blot with the PHF1 antibody directed against the tau phospho-epitopes Ser396/Ser404. As expected, the AD, PiD, and PSP cases showed increased tau phosphorylation when compared to the control cases (Fig. 1). The increase in tau phosphorylation in AD cases was accompanied by an increase in total tau when compared to age-matched non-demented controls in face of equivalent GAPDH signal (Fig. 1A). In contrast, total tau levels in PiD cases were similar to those in control cases, despite showing an 80-fold increase of p-tau level compared to controls (Fig. 1B). We did not find evidence for an increase in total tau level in PSP cases despite the significantly increased p-tau compared to control cases (Fig. 1C).
Fig. 1
Relative levels of phospho-tau in the brain samples from distinct tauopathy cohorts. Brain homogenates from age-matched controls and (A) AD, (B) PiD, and (C) PSP brains were probed for p-tau, total tau and GAPDH. The PHF1 and total tau immunoreactivity is shown alongside the corresponding GAPDH. Immunoreactivity was expressed as ratios of PHF1/total tau, PHF1/GAPDH and total tau/GAPDH. The normalized data were analyzed using a one-tailed unpaired t-test (total tau/ GAPDH) or Mann-Whitney test (PHF1/ total tau, PHF1/ GAPDH). Shown is the mean, error bars are SEM. ****p≤0.0001; ***p≤0.001; **p≤0.01, ns- not significant. p-tau/GAPDH: AD: p < 0.0001 (U = 11), PiD: p = 0.0012 (U = 16), PSP: p = 0.0045 (U = 16); p-tau/total tau: AD: p < 0.0001 (U = 16), PiD: p = 0.0004 (U = 12), PSP: p = 0.001 (U = 11). Total tau/ GAPDH: AD: (p = 0.0002, t = 3.811, BF +0 = 69.957); PiD: (p = 0.1027, t = 1.309, BF +0 = 0.165); PSP: (p = 0.286, t = 0.5759, BF +0 = 0.356). Number of cases: ND = 20, AD = 20, nPiD = 11, PiD = 11, nPSP = 10, PSP = 10. Each lane corresponds to one individual case. Colored symbols in (A) correspond to individuals with LBD co-morbidity (red), APOE 4.4 genotype (blue), and CVD co-morbidity (magenta).
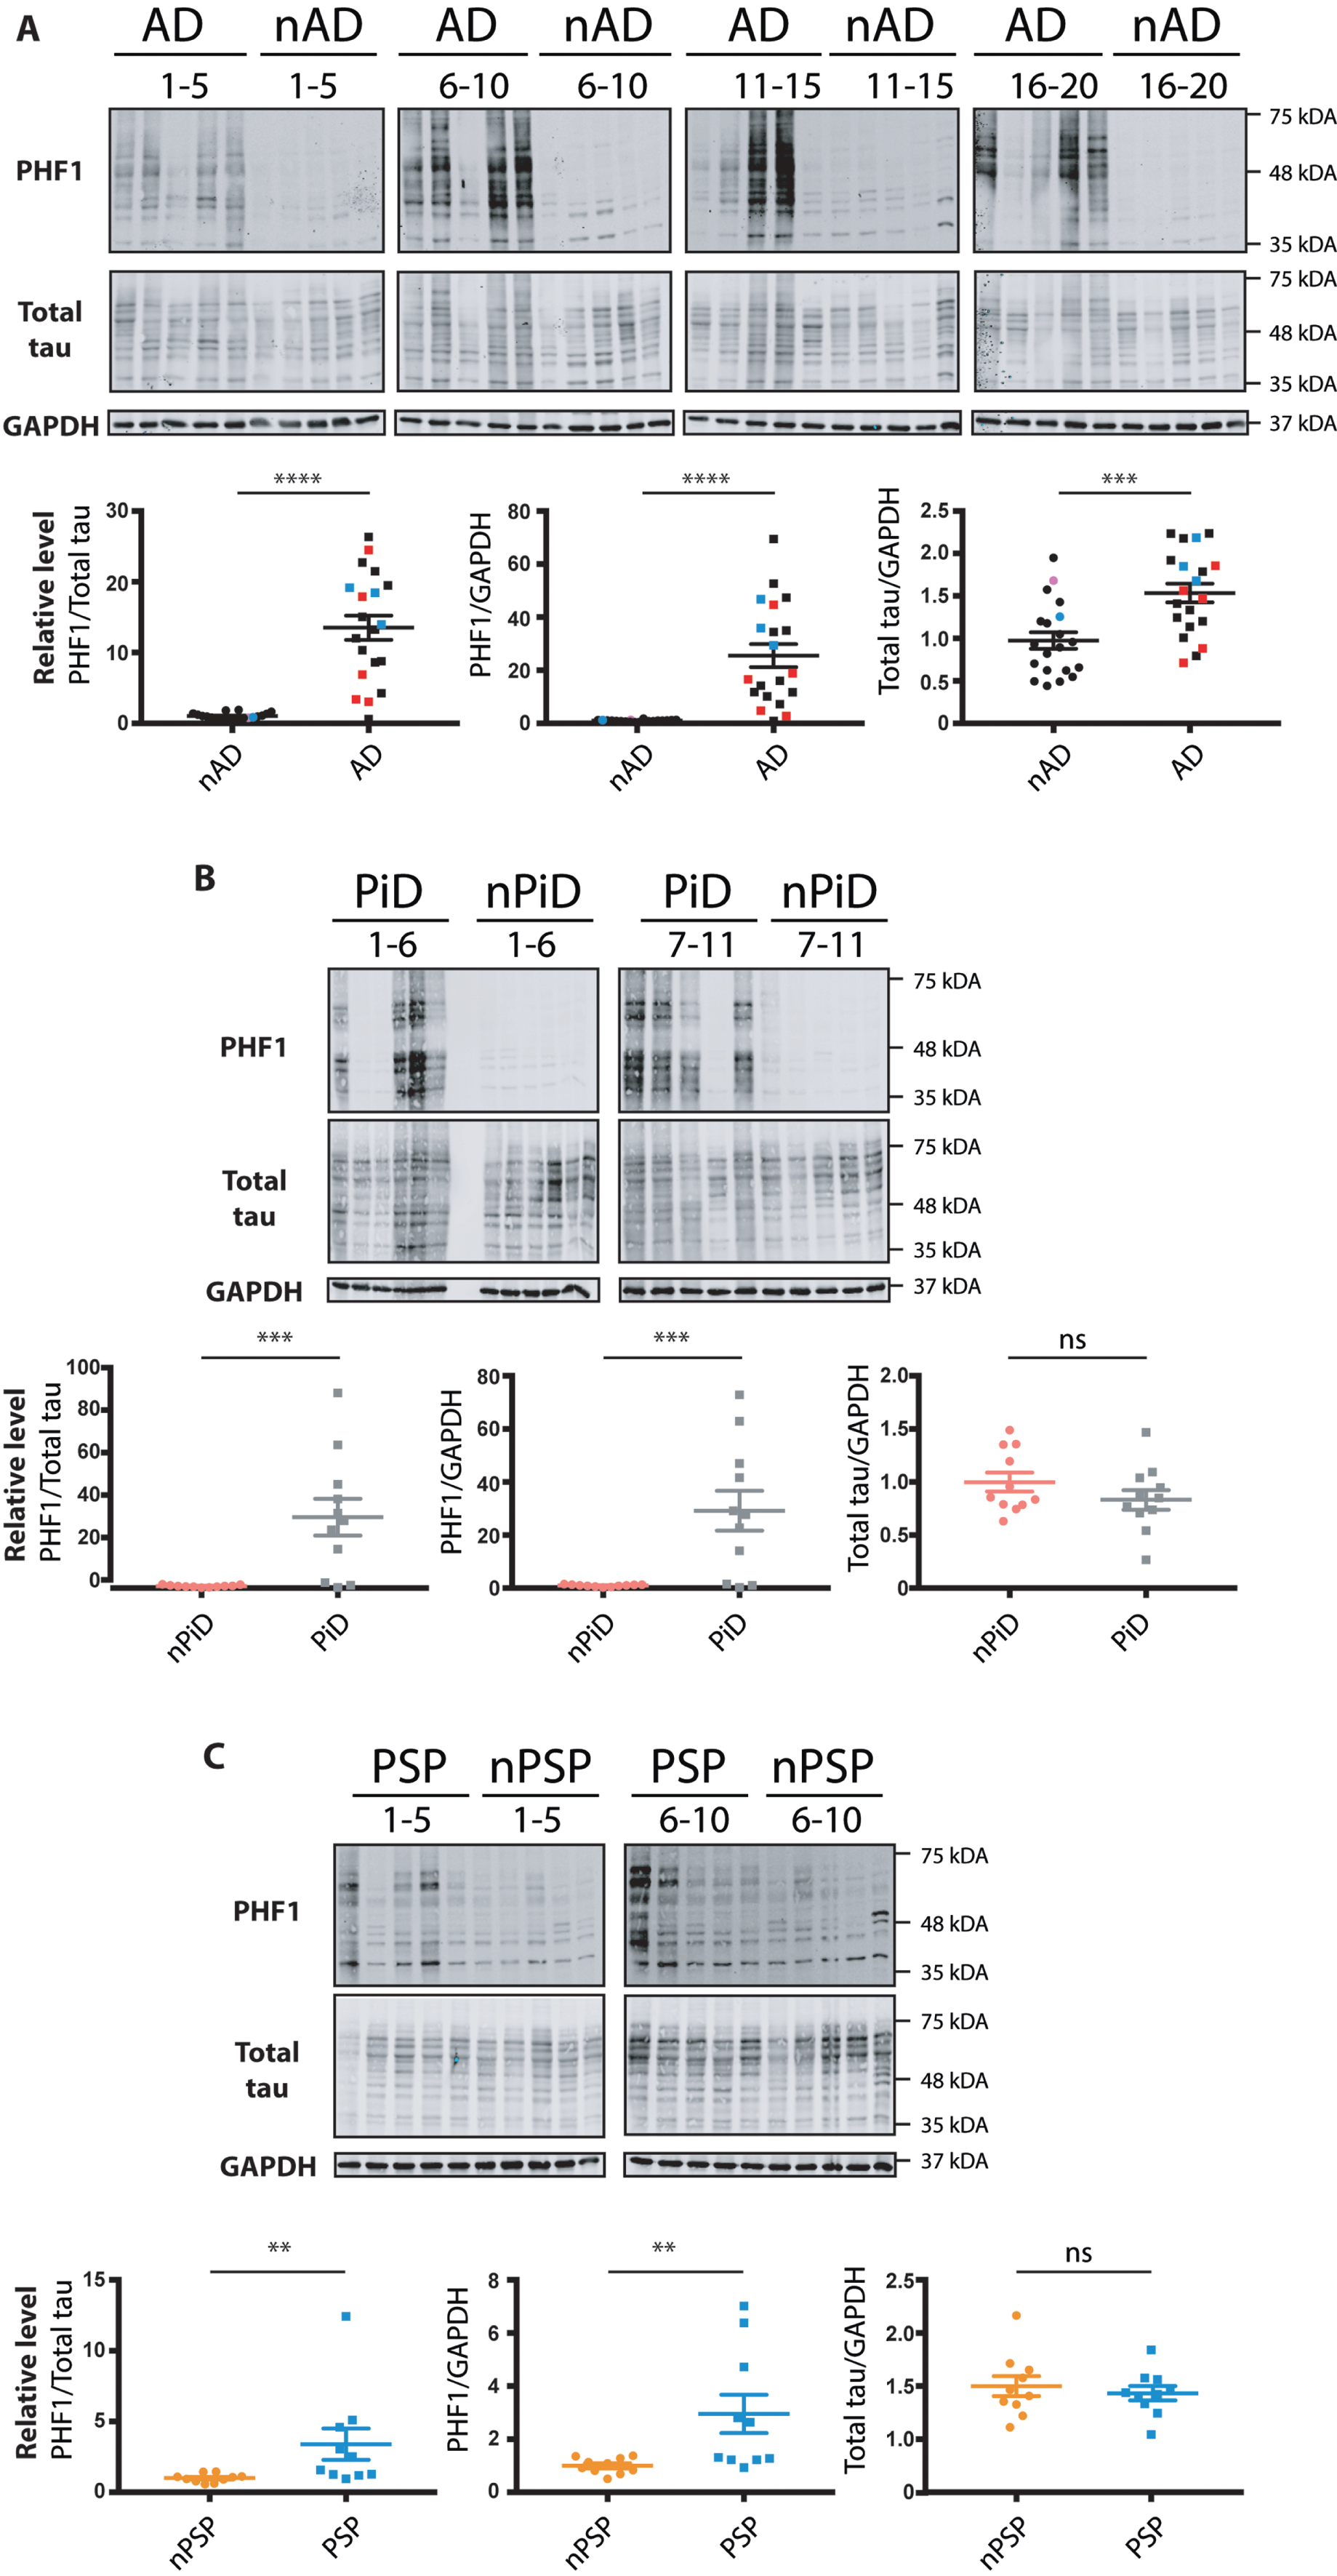
Interestingly, the phosphorylation level in the cases within the diseased groups (AD, PiD, and PSP) was heterogenous showing up to an 80-fold variation in p-tau between the highest and lowest levels of PHF-1 immunoreactivity detected by Western blotting. In contrast, the relative levels of total tau showed a much more constrained variability of immunoreactivity.
Finally, this side-by-side comparison of homogenates allowed us to score the relative levels of p-tau in the investigated tauopathies. Although increased p-tau was detected for all the diseases, the degree of tau phosphorylation differed amongst the tauopathies, with PSP cases having the lowest fold increase in comparison to non-demented cohort (Fig. 1C). The data confirm the increased phosphorylation of tau in the brains of patients affected with dementia. In addition, the results highlight the variability of p-tau level that can be observed within the diseased groups. The data thus can be used to analyze whether the expression of UPR markers correlates with p-tau levels.
XBP-1 splicing in tauopathy
One of the commonly used and sensitive markers of UPR activation is splicing of XBP-1 mRNA. This arises from the activation of the endoribonuclease IRE1, leading to the removal of an intron from mRNA. This generates an active transcription factor that induces expression of genes involved in ER homeostasis [31]. We have previously shown that chemical perturbation of cultured rodent neurons with tunicamycin triggers a UPR that is readily detected by primers designed to pick up XBP-1 splicing [22]. We designed human primers that span the spliced intron and enable detection of both the unspliced mRNA and the shorter spliced form that is an indicator of an active and ongoing UPR. These primers were first verified on the mRNA extracted from tunicamycin-treated HEK293 cells. This identified that they detect both the unspliced and spliced forms of XBP-1 and the UPR activated splicing is selectively found in the mRNA extracted from the tunicamycin treated cells (Supplementary Figure 1A).
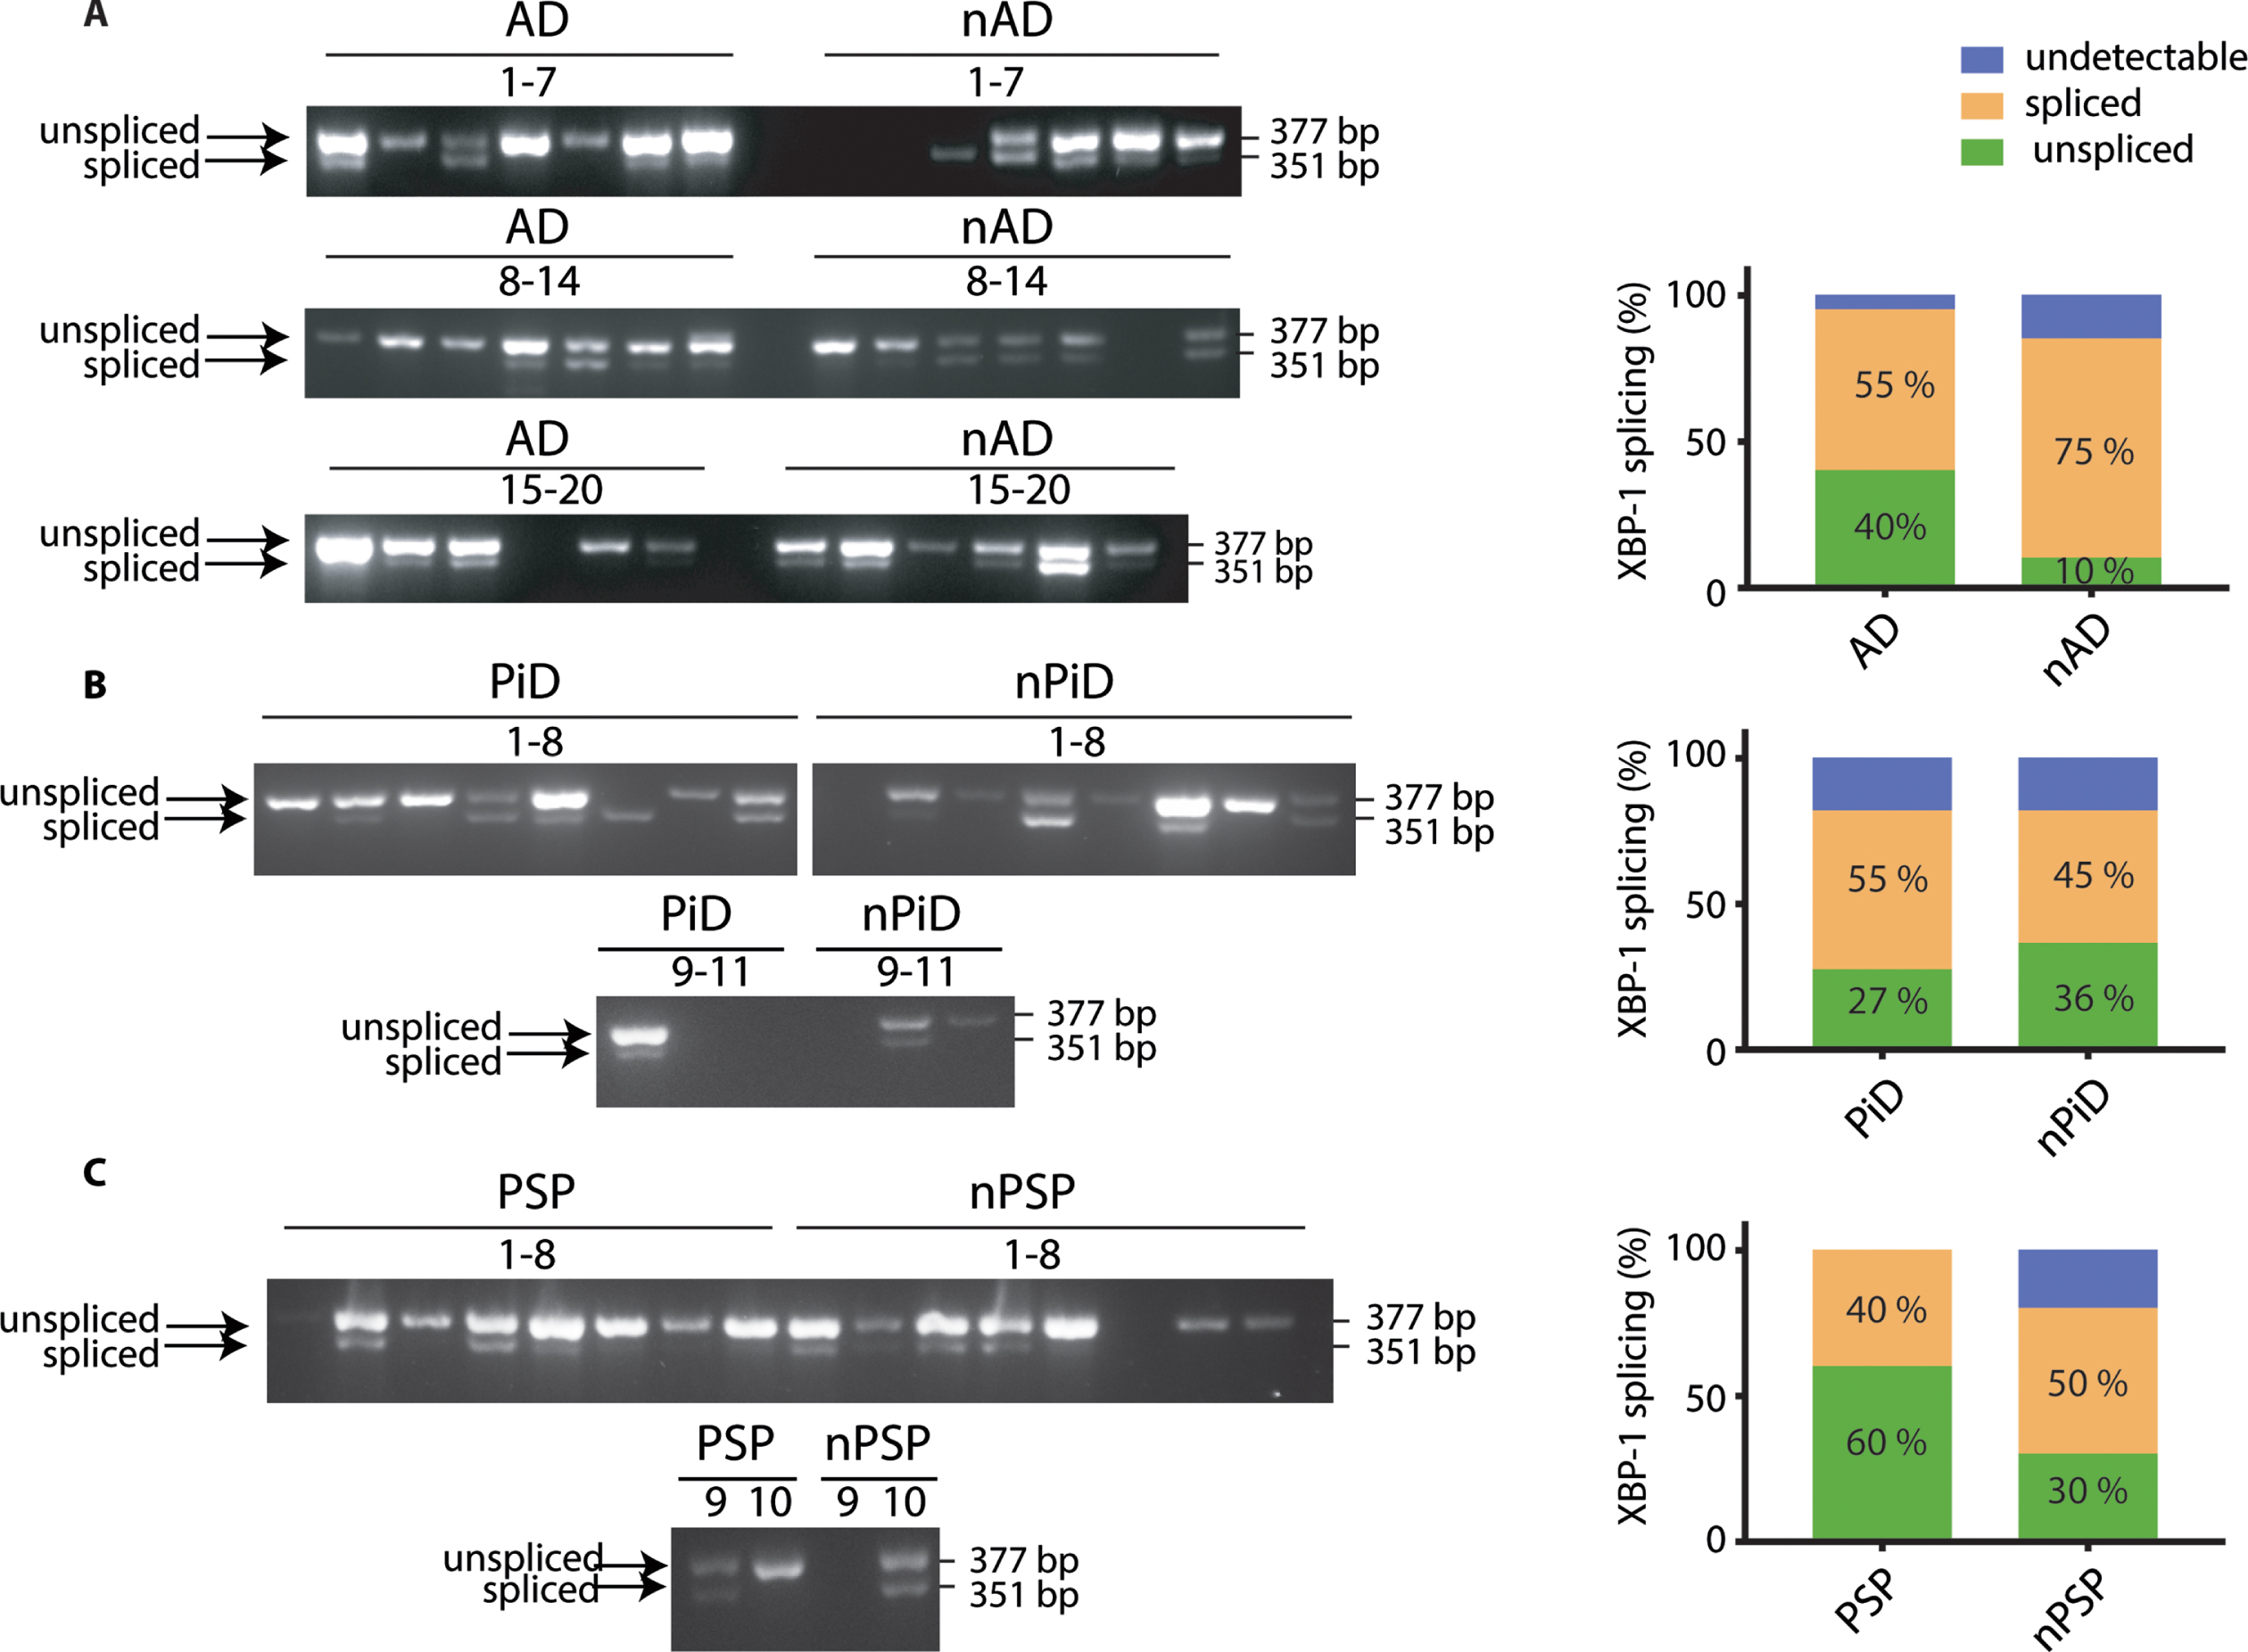
The primers amplified the products of expected sizes in cDNA from human brain samples (377 bp for the unspliced and 351 bp for the spliced transcript). We then used the distribution of the spliced and unspliced amplicons to probe if XBP-1 splicing was selectively occurring in the investigated tauopathies when compared to the respective controls (Fig. 2). We observed that splicing occurs independently of the presence of the disease diagnosis. In AD cases, 40%of the samples were found to be positive for the splicing compared to 75%in controls. There was no significant difference between both groups (Fig. 2A). In PiD, 55%of the cases presented the XBP-1 splicing but this was not statistically different from the control cases (Fig. 2B). Similarly, in PSP, 40%of the cases were positive for XBP-1 splicing with no significant difference when compared to respective control cases (Fig. 2C). For each group, some cases had undetectable level of XBP-1 despite readily amplifying the housekeeping gene, GAPDH. There was no association between the XBP-1 splicing and the level of p-tau (data not shown). Altogether, the data suggest that XBP-1 splicing occurs to comparable levels in both control and disease cohorts. The distribution of samples that detect a splicing event shows that XBP-1 is a widely observed event in the ageing brain based on its presence in the non-demented control samples (Supplementary Figure 3).
Fig. 2
XBP-1 splicing in tauopathies and age-matched control brains. cDNA from brain samples from (A) AD, (B) PiD, and (C) PSP together with respective non-demented controls were subjected to PCR with primers designed to amplify the unspliced and spliced variants of XBP-1. The products were resolved on a 2.5%agarose gel. The PCR products were classified as undetectable, spliced, or unspliced, and the distinct PCR outcomes are expressed as percentage of total samples and analyzed using Fisher’s exact test for (A) AD (p = 0.1560), (B) PiD (p = 0.9999), and (C) PSP samples (p = 0.6372). Number of cases: ND = 20, AD = 20, nPiD = 11, PiD = 11, nPSP = 10, PSP = 10. Each lane corresponds to one individual case.
p-eIF2α level in tauopathy
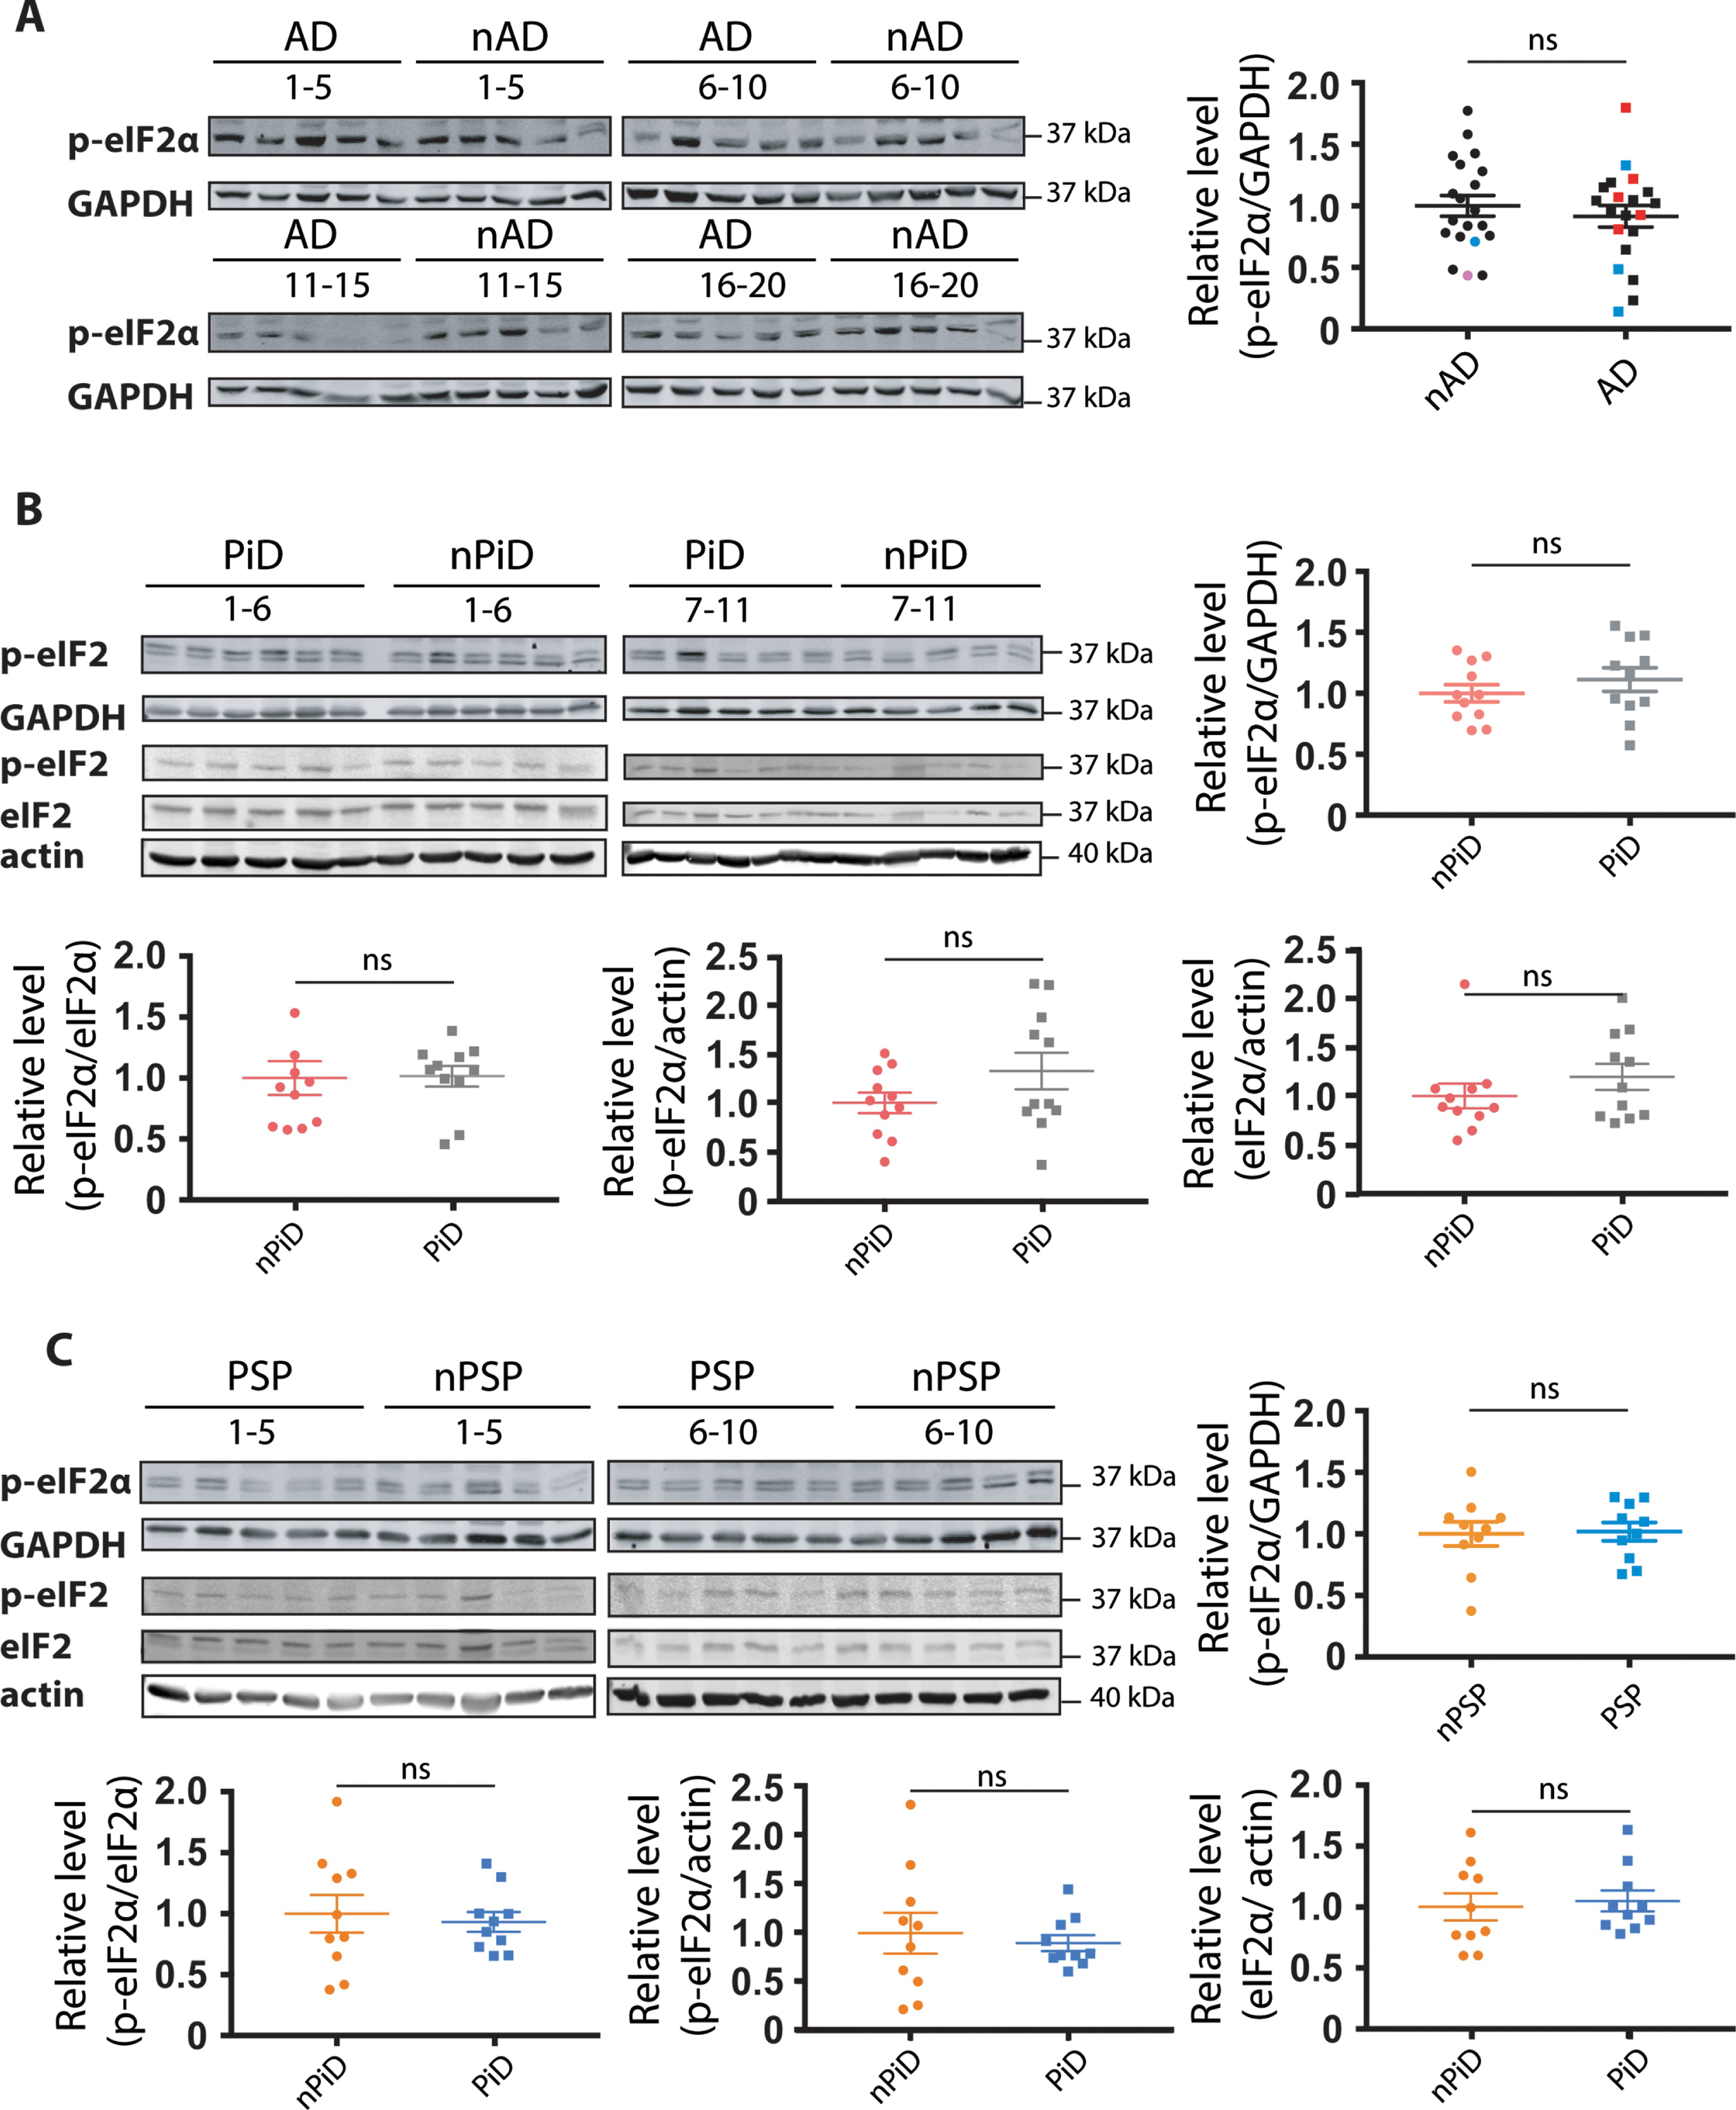
The PERK arm of the UPR has emerged as a candidate stress response in AD and other tauopathies [14, 32]. Here we used the phosphorylation of eIF2α that can occur upon PERK activation as a surrogate for the activation of the PERK branch of the UPR. Importantly, in the preclinical studies an increase in phosphorylation of eIF2α has been discussed as mediating UPR in face of no XBP-1 signaling. An antibody capable of detecting a tunicamycin-induced eIF2α phosphorylation in human cells by western blot (Supplementary Figure 1B) was used to probe whether PERK arm of UPR was activated in humans. Single or double bands of the correct size of 38 kDa were detected for all the samples investigated. In tauopathies, no increase in p-eIF2α levels was detected relative to their respective controls (Fig. 3), irrespectively of whether phosphorylation was normalized to GAPDH (Fig. 3A–C), total eIF2α (Fig. 3B, C) or actin (Fig. 3B, C). Further, we did not detect a difference in eIF2α levels between PiD cases, PSP cases and their respective controls (Fig. 3B, C). The absence of increased p-eIF2α selective to the diseased cases argues against a disease-associated engagement of the PERK arm of the UPR.
Fig. 3
Detection of eIF2α phosphorylation in tauopathies and age-matched controls. p-eIF2α and GAPDH immunoreactivity for (A) AD, (B) PiD, and (C) PSP together with relative age-matched non-demented controls. Quantification of p-eIF2α immunoreactivity from individual samples was normalized to the immunoreactivity of a loading control, GAPDH. Data were analyzed using a two-tailed unpaired t-test revealing no significant differences (p = 0.4892, t = 0.6983; p = 0.3604, t = 0.9362; p = 0.8813, t = 0.1514 for AD, PiD, and PSP, respectively). (B, C) p-eIF2α, eIF2α, and actin immunoreactivity for (B) PiD and (C) PSP. Quantification revealed no significant difference when normalizing p-eIF2α over eIF2α (p = 0.3653, U = 46; p = 0.5288, U = 41 for PiD, PSP), p-eIF2α over actin (p = 0.8977, U = 58; p = 0.5607, t = 0.5927 for PiD, PSP) or eIF2α over actin (p = 0.6522, U = 53 p = 0.9705, U = 49 for PiD, PSP). Shown are means, error bars show SEM. ns, not significant. Number of cases: ND = 20, AD = 20, nPiD = 11, PiD = 11, nPSP = 10, PSP = 10. Each lane corresponds to one individual case. Colored symbols in (A) correspond to individuals with LBD co-morbidity (red), APOE 4.4 genotype (blue), and CVD co-morbidity (magenta).
Expression levels of the common sensor of the UPR- BiP
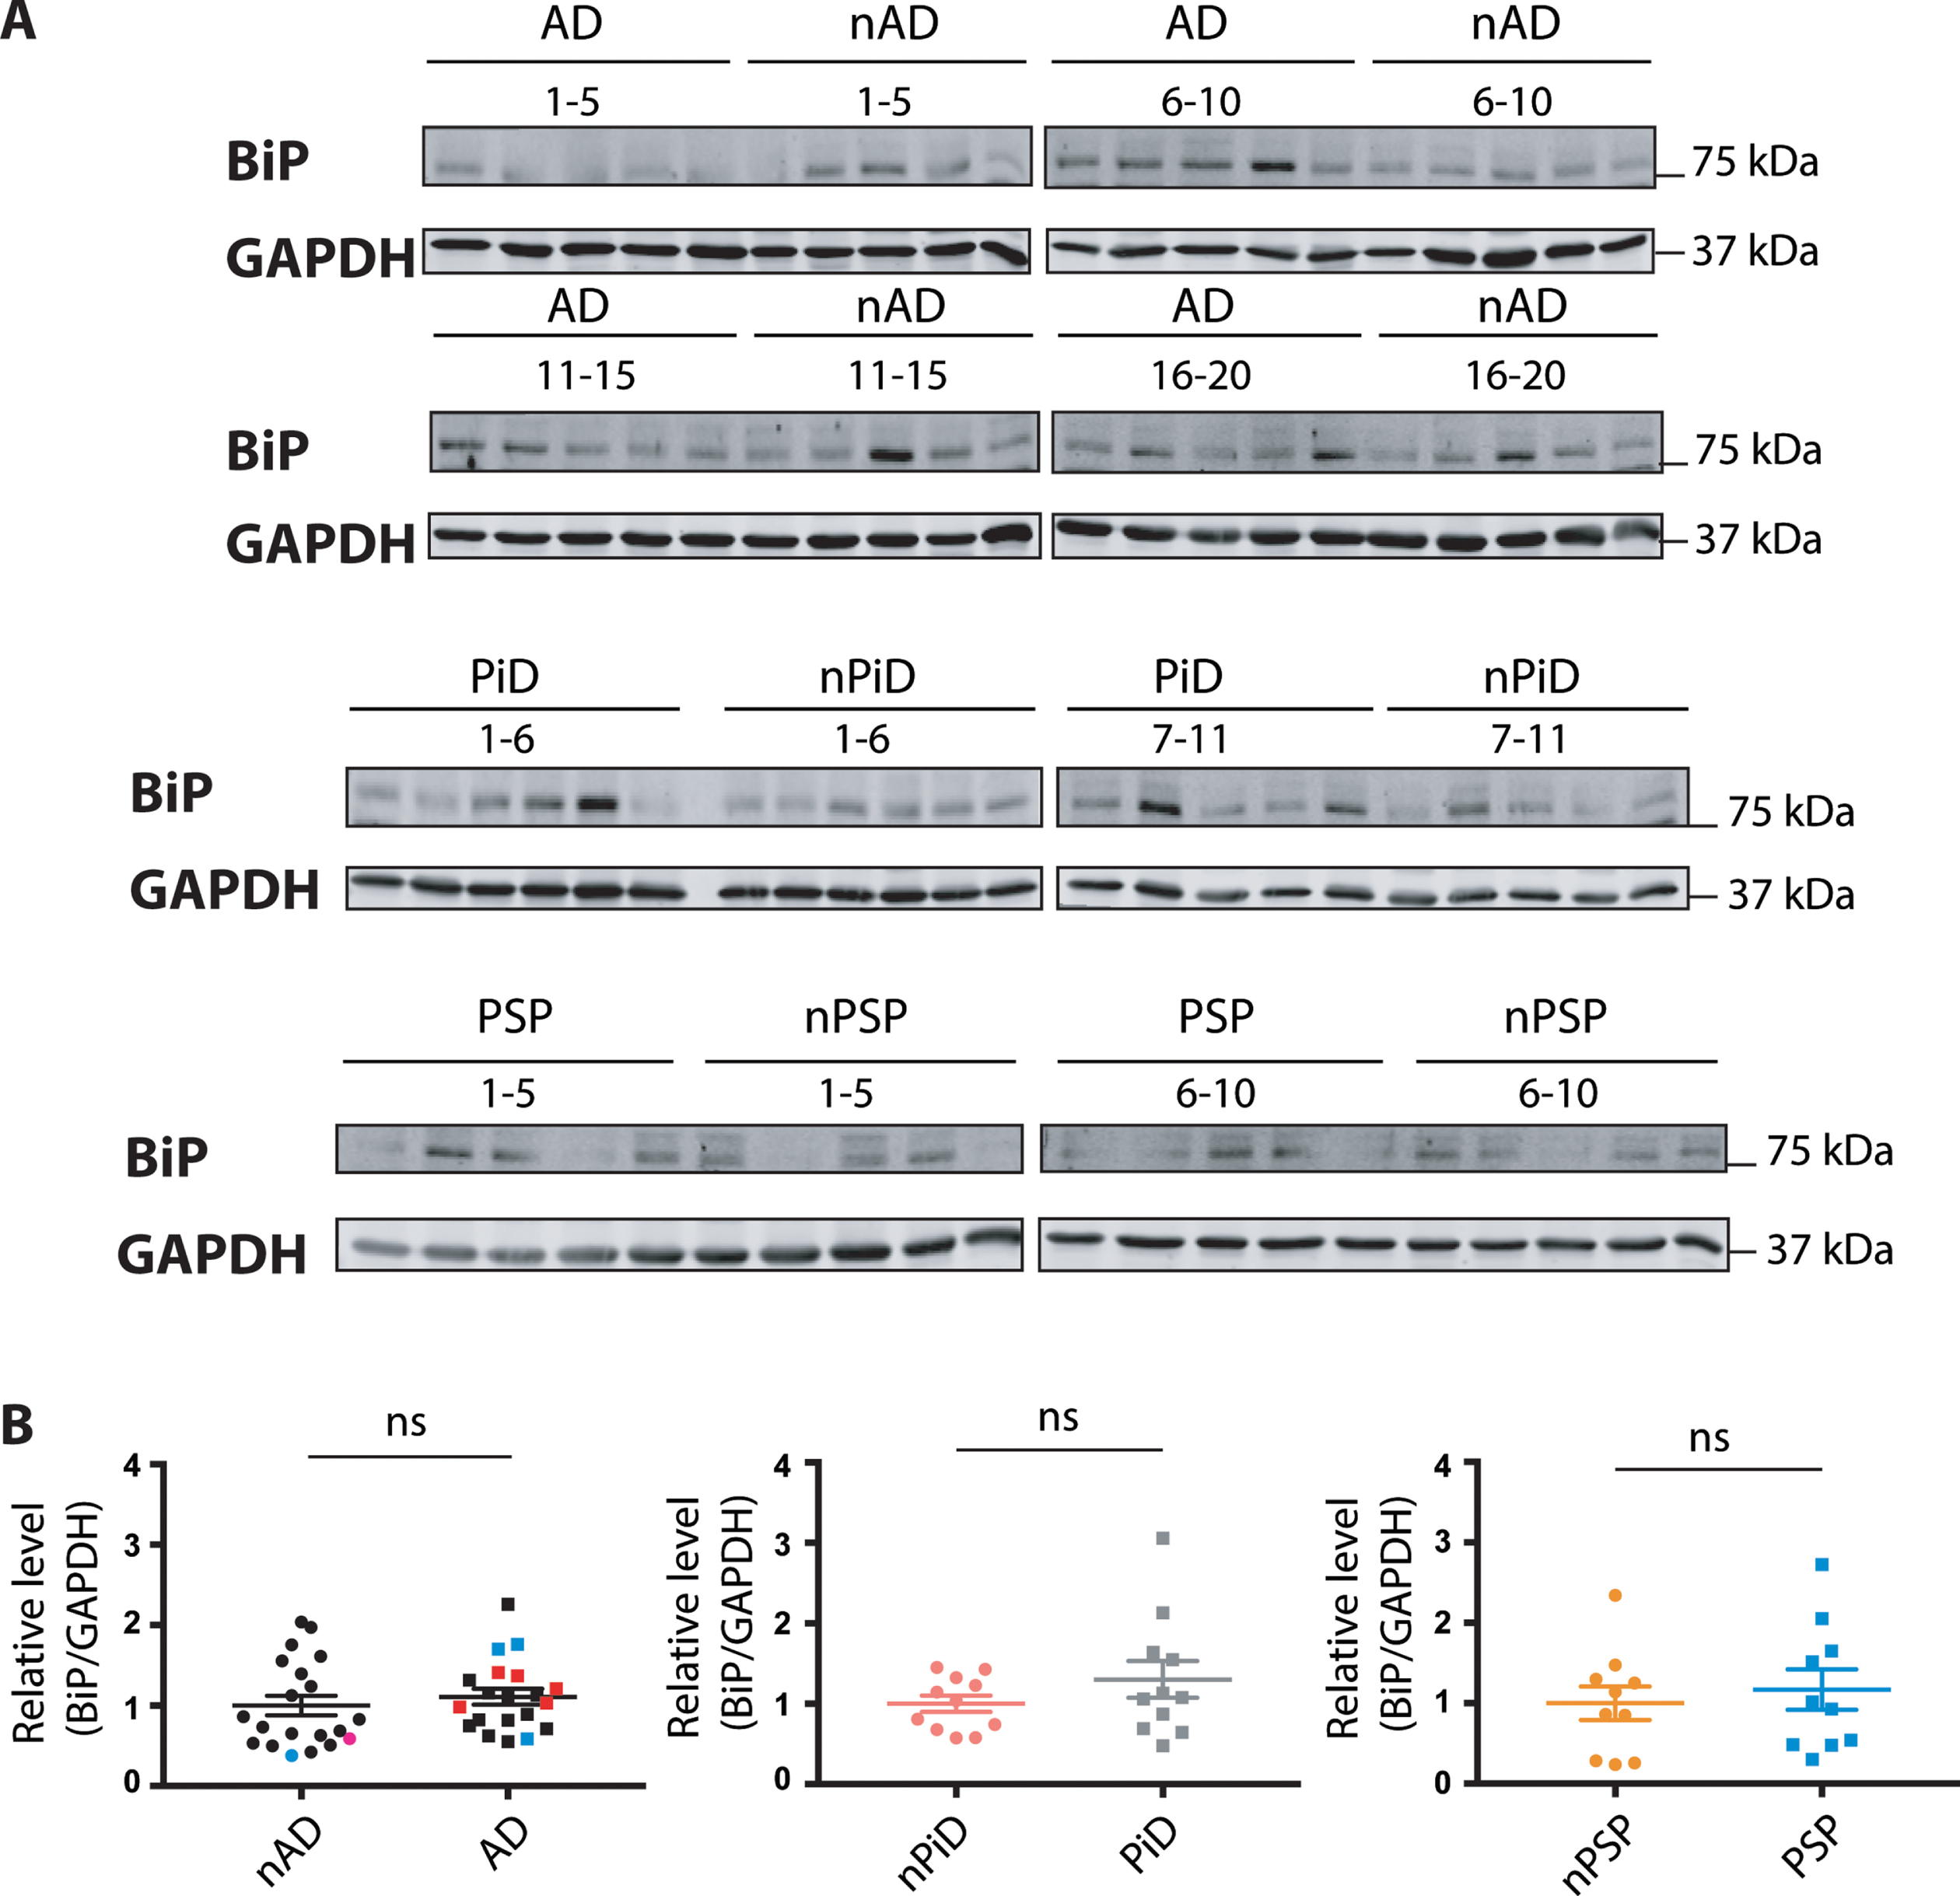
The ER chaperone BiP is a pivotal sensor of the UPR and the level of BiP expression is increased upon UPR activation. In contrast to the selective markers described above, p-eIF2α and XBP-1, BiP is implicated in all three branches of the UPR. The investigation of BiP expression was performed using previously tested reagents (Supplementary Figure 1C). The expression of BiP protein was not increased in the disease versus control cases (Fig. 4), suggesting that the UPR is not activated in the tauopathies.
Fig. 4
BiP protein expression in tauopathies and age-matched non-demented controls. A) BiP and GAPDH immunoreactivity for AD, PiD, and PSP together with relative age-matched non-demented controls. B) Quantification of BiP immunoreactivity from individual samples was normalized to the immunoreactivity of a loading control, GAPDH. Data were analyzed using a Mann-Whitney test (AD, PiD) or two-tailed unpaired t-test (PSP) revealing no significant differences (p = 0.2888 and U = 160, p = 0.4779 and U = 49, p = 0.6099 and t = 0.5193 for AD, PiD disease and PSP, respectively). Shown are means, error bars are SEM. ns, not significant. Number of cases: ND = 20, AD = 20, nPiD = 11, PiD = 11, nPSP = 10, PSP = 10. Each lane corresponds to one individual case. Colored symbols for nAD, AD cases correspond to individuals with LBD co-morbidity (red), APOE 4.4 genotype (blue), and CVD co-morbidity (magenta).
CHOP expression in tauopathies
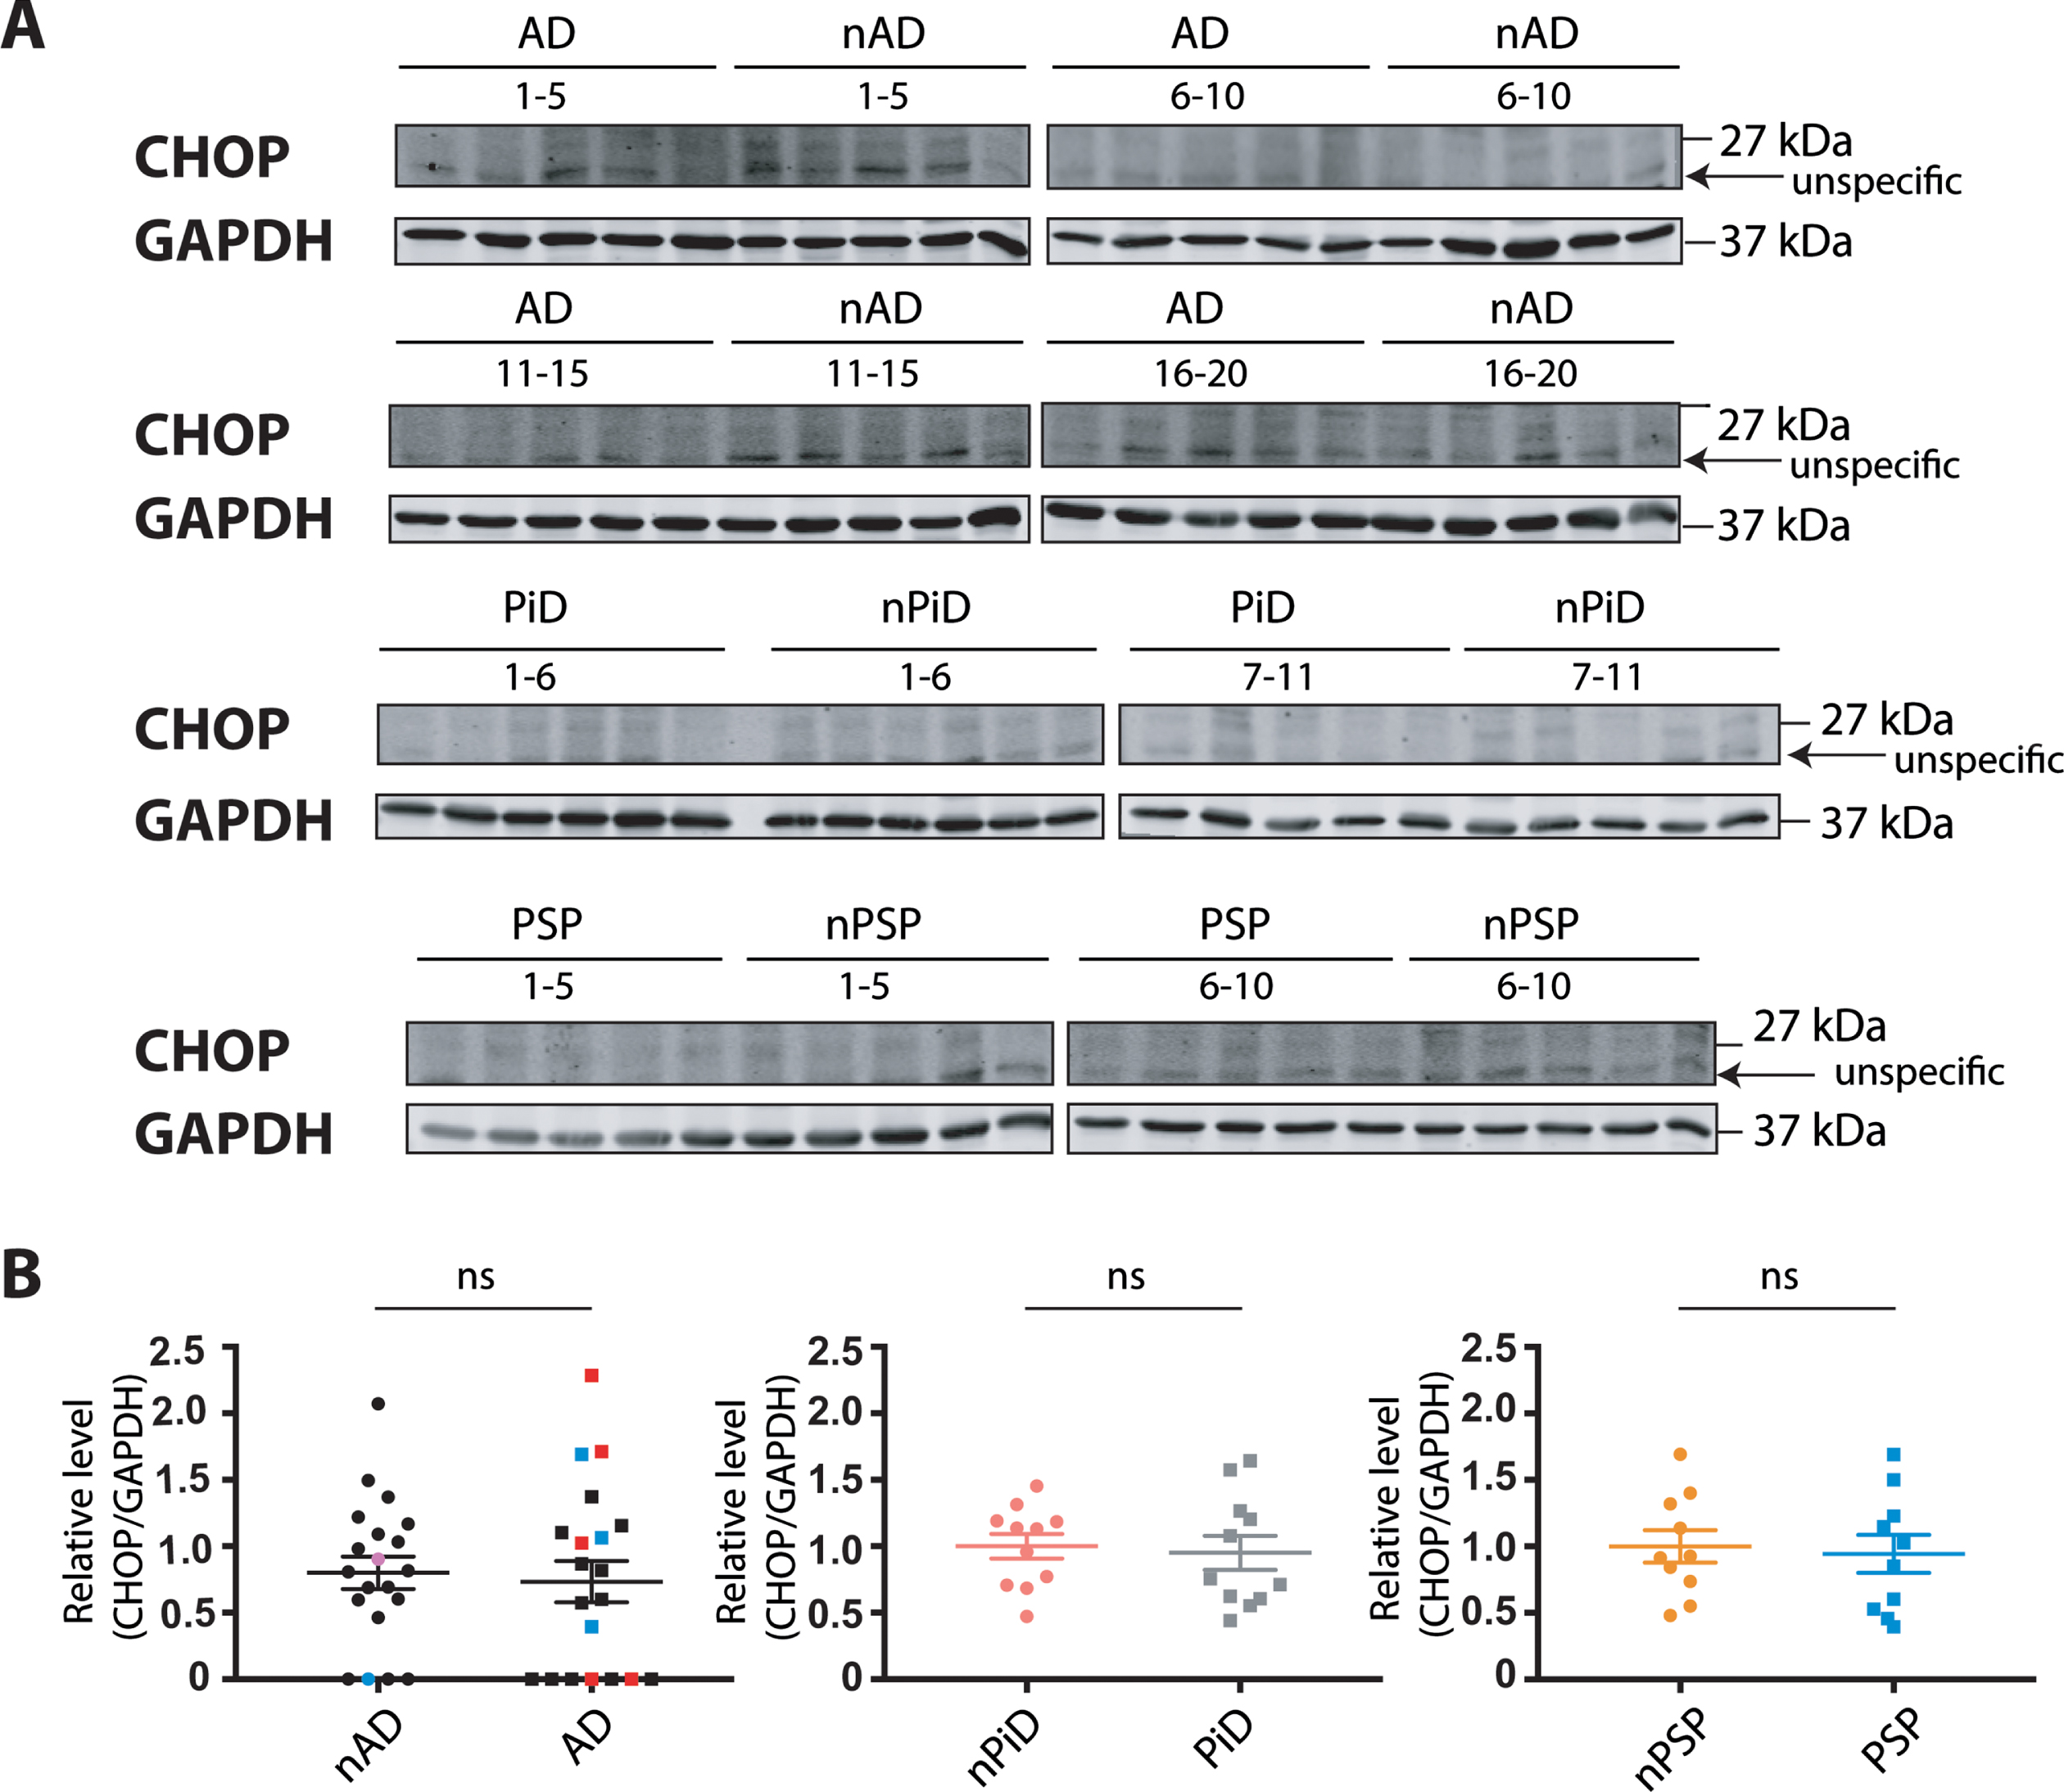
Finally, CHOP, another sensitive marker that is robustly induced by each of the three branches of the UPR, was investigated. Similar to BiP, protein level was determined using previously tested reagents that detected an induced UPR in tunicamycin-treated human cells (Supplementary Figure 1D). The antibody raised against CHOP protein showed the clear induction of a protein of expected size in the tunicamycin-treated cells. However, we noted a confounding co-migration of non-specific bands next to the protein of interest that were enhanced in the untreated cells. To quantify the relative CHOP expression in the brain samples, the immunoreactivity that migrates at the same size of the induced protein in HEK293 cells was used.
No difference in the CHOP protein expression was observed between disease and control cases (Fig. 5). These findings suggest that this downstream target of the UPR branches is not induced in the diseased cohorts, further supporting the notion that UPR is not activated in the investigated tauopathies.
Fig. 5
CHOP protein expression in tauopathies and age-matched non-demented controls. A) CHOP and GAPDH immunoreactivity for AD, PiD, and PSP together with relative age-matched non-demented controls. B) Quantification of CHOP immunoreactivity from individual samples was normalized to the immunoreactivity of a loading control, GAPDH. Data were analyzed using Mann-Whitney test (AD) or two-tailed unpaired t-test (PiD and PSP) revealing no significant differences (p = 0.6749 and U = 184, p = 0.7539 and t = 0.3178, p = 0.7649 and t = 0.3036 for AD, PiD, and PSP, respectively). Shown are means, error bars are SEM. ns, not significant. Number of cases: ND = 20, AD = 20, nPiD = 11, PiD = 11, nPSP = 10, PSP = 10. Each lane corresponds to one individual case. Colored symbols for nAD, AD cases correspond to individuals with LBD co-morbidity (red), APOE 4.4 genotype (blue), and CVD co-morbidity (magenta).
Correlations of p-tau with the UPR markers
Given the heterogenous levels of p-tau within the disease groups, we explored whether the p-tau load correlated with the expression of UPR markers within the different groups (disease and controls) of the different tauopathies (AD, PiD, and PSP). No significant association was detected between the p-tau markers AT8 and PHF1 with the UPR markers p-elF2α, BIP and CHOP in any of the control or disease groups (Tables 5–7). This again supports the suggestion that late stage human tauopathies are not associated with an activated UPR.
Table 5
Correlations for nAD and AD samples
| PHF1 | AT8 | p-eIF2α | BiP protein | CHOP protein | ||
| PHF1 | nAD | rs = 0.237 | rp = –0.284 | rs = 0.152 | rp = –0.190 | |
| AD | rs = 0.400 | rp = –0.022 | rp = 0.043 | rs = 0.459 | ||
| AT8 | nAD | rs = 0.237 | rs = –0.155 | rs = 0.144 | rs = –0.206 | |
| AD | rs = 0.400 | rs = 0.059 | rs = 0.123 | rs = 0.482 |
rp, Pearson’s correlation; rs, Spearman’s correlation. p values less than 0.01 were considered statistically significant.
Table 6
Correlations for nPiD and PiD samples
| PHF1 | AT8 | p-eIF2α | BiP protein | CHOP protein | ||
| PHF1 | nPiD | rs = 0.000 | rp = 0.299 | rp = –0.228 | rp = –0.037 | |
| PiD | rs = 0.327 | rp = –0.373 | rp = 0.685 | rp = 0.396 | ||
| AT8 | nPiD | rs = 0.000 | rs = –0.518 | rs = –0.445 | rs = –0.036 | |
| PiD | rs = 0.327 | rs = –0.464 | rs = –0.136 | rs = –0.236 |
rp, Pearson’s correlation; rs, Spearman’s correlation. p values less than 0.01 were considered statistically significant.
Table 7
Correlations for nPSP and PSP samples
| PHF1 | AT8 | p-eIF2α | BiP protein | CHOP protein | ||
| PHF1 | nPSP | rs = –0.300 | rs = –0.079 | rs = 0.115 | rs = 0.006 | |
| PSP | rs = 0.745 | rp = –0.327 | rp = –0.399 | rp = 0.047 | ||
| AT8 | nPSP | rs = –0.300 | rs = 0.000 | rs = –0.583 | rs = –0.467 | |
| PSP | rs = 0.745 | rs = –0.212 | rs = –0.200 | rs = 0.176 |
rp, Pearson’s correlation; rs, Spearman’s correlation. p values less than 0.01 were considered statistically significant.
DISCUSSION
The potential role of the unfolded protein response in neurodegeneration has been highlighted in experimental models and human samples from neurodegenerative diseases that present with disturbed proteostasis. This view has been extended to AD and other tauopathies [13, 14, 16]. However, the role of the UPR in neurodegeneration remains puzzling due to the fact that many of the accumulating proteins, including tau, are not resident to the ER and do not deposit therein [12]. The UPR involvement in tau-related pathology was previously questioned and investigated, and of note, no indication of UPR activation was observed in a transgenic mouse model of tauopathy. No changes in the XBP-1 splicing or the level of p-eIF2α, BiP, or CHOP was observed between tauP301S-expressing mice and wild type animals [21]. In our recent study, we confirmed the absence of UPR activation in the rTg4510 mouse model expressing tauP301L and we further expanded the UPR investigation to an in vitro model of tauopathy [22].
Here, we investigated the activation of UPR in the human tauopathies. We measured the expression level of several UPR markers involved in all three branches of the response: XBP-1 splicing, phosphorylation of eIF2α and the expression of BiP and CHOP. Using reliable reagents, we found no changes in these markers between late stage disease and control cases, nor did we find a correlation between the relative expression of these UPR-associated protein changes with parallel measured biochemical or histological p-tau load. Our findings do not indicate UPR involvement at the late stage of three distinct diseases characterized by cytosolic tau deposition: AD, PiD and PSP.
Recently, several studies have highlighted the importance of the ER response in neurodegeneration, mainly focusing on immunohistochemical investigation of UPR branches. In AD, p-PERK immunoreactivity was observed in the hippocampus and occasionally in the temporal cortex whereas no staining was reported in the control cases [33]. In a later study, neuropathological criteria staged the increased p-PERK in the hippocampus of AD cases to an early stage of associated tau pathology [14]. In contrast, a recent study investigating the temporal cortex of AD cases showed an increase in p-PERK with AD progression, without a concomitant increase in p-eIF2α or p-IRE1α [34]. Other work in PiD and PSP found that p-PERK and p-IRE1 immunohistochemical staining was highlighted in p-tau positive neurons relative to controls. Similar to the observations from AD brain, the presence of UPR markers was associated with early tau pathology [13]. These histochemical studies are powerful in that they enable a resolution at single cell level, allowing to pinpoint responses specific to subpopulations of cells. However, as we note in our study, the ability to discern disease-selective responses is challenging, and others have described that PERK is activated in over 70%of control cases [35]. Interestingly, in such studies the increase of UPR markers in the control cohorts correlated to the age of the individual and PHF1 immunolabeling [35]. The conflicting results between the studies mentioned above and data reported in our study could be explained by differences in the disease stage of the investigated cohorts. They also raise the important issue of confound age-related expression of a strong UPR in aged control cohorts that do not show disease.
XBP-1 splicing, part of the IRE1α arm, is a sensitive indicator of UPR activation. It has been previously shown that in the in vivo and in vitro models of tauopathy, the splicing event does not occur [16, 19]. Interestingly, in the current study splicing is readily detected in human samples, but this is independent of the disease status. This activation of UPR in diseased and control cohorts is similar to the findings previously made in investigation of AD and age-matched controls showing an indiscriminate activation of UPR [33]. This reinforces the notion that tau pathology does not activate the UPR, but that the UPR-linked splicing event of XBP-1 is a consequence of other non-dementia associated events. When investigating human samples, different factors that could affect stress pathways should be taken into account. These include the manner of death, medicines taken by the individual and any concomitant diseases that all could have an effect on the observations [36].
Our study failed to evidence a disease-associated activation of UPR using the reagents we verified had requisite specificity. Interestingly, increased level of PERK and p-PERK independent of any change in p-eIF2α was reported by others when investigating PSP with histological methods (investigation of the frontal cortex in Braak stage IV or higher cases). These observations regarding lack of the increased eIF2α phosphorylation are consistent with our findings [32]. Importantly, in our study the intensity of the p-eIF2α signal did not correlate with pH or post mortem interval of the samples investigated (data not shown), suggesting these variables did not mask an effect [37]. We were unable to resolve specific p-PERK immunoreactivity using available reagents.
UPR activation can be assessed using the sensor BiP, which is also a downstream response of the activated UPR. There are conflicting reports regarding BiP expression in human tauopathies. BiP protein in the brain lysate from the temporal cortex and hippocampus of AD has been reported to increase [33]. However, this contrasts a study that measured BiP in the cortical homogenates from control, familial and sporadic AD cases [38]. Interestingly, a distinct study reported a decrease in the level of BiP in the temporal cortex of sporadic AD cases compared to controls. BiP expression was also reduced in AD cases associated with early onset genetic mutations [39]. These differences may be due to the size of the cohorts examined, the regions, and/or a consequence of distinct reagents that were used. Our study has the power to resolve differences, using a large cohort relative to the smaller groups used in the aforementioned studies.
Analyzing the expression level of proteins involved in all three arms of the UPR, as well as UPR-associated phosphorylation and splicing events, we found no indication of an activated response in three distinct tauopathies. Our analysis relied on biochemical readouts of homogenized samples that readily detected UPR activation within the human brain. Interestingly, we observed a high heterogeneity of tau phosphorylation level between the brain samples from patients affected with tauopathies. The accumulation of p-tau load acts as a surrogate for disease progression [40]. Thus, the high variability in p-tau level allowed us to determine whether there is any association between the level of UPR markers and p-tau load. We did not find any correlation between the level of p-tau and any of the UPR markers analyzed, suggesting that this response is not dependent on tau accumulation. Thus we failed to detect an associated UPR across a wide range of biochemical and histologically defined levels of brain tauopathy.
In conclusion, we observe that the accumulation of p-tau does not drive the activation of the UPR within the cerebral cortex at the late stage of disease, questioning the proposed targeting of this response as a treatment for tau-related neurodegeneration [16, 20]. Of note, UPR activation signatures are readily detected in post-mortem brains, independently of tau status.
ACKNOWLEDGMENTS
Brain tissue was provided by the London Neurodegenerative Diseases Brain Bank (LNDBB), the South West Dementia Brain Bank (SWDBB), and the Oxford Brain Bank (OBB). All Brain banks are supported by the Medical Research Council (MRC)-UK and the Brains for Dementia Research programme, jointly funded by Alzheimer’s Research UK and Alzheimer’s Society. SWDBB is also supported by BRACE (Bristol Research into Alzheimer’s and Care of the Elderly) and OBB by the NIHR Oxford Biomedical Research Centre.
FUNDING
This work was funded by the Alzheimer’s Society with support from the Healthcare Management Trust (A.P.P. and K. L. W.) and The Gerald Kerkut Charitable Trust (A.P.P. and L.S.).
CONFLICT OF INTEREST
The authors have no conflict of interest to report.
SUPPLEMENTARY MATERIAL
[1] The supplementary material is available in the electronic version of this article: https://dx.doi.org/10.3233/ADR-210050.
REFERENCES
[1] | Lane CA , Hardy J , Schott JM ((2018) ) Alzheimer’s disease. Eur J Neurol 25: , 59–70. |
[2] | Irwin DJ ((2016) ) Tauopathies as clinicopathological entities. Parkinsonism Relat Disord 22: , 29–33. |
[3] | Neuropathology Group. Medical Research Council Cognitive Function and Aging Study ((2001) ) Pathological correlates of late-onset dementia in a multicentre, community-based population in England and Wales. Lancet 357: , 169–175. |
[4] | Herrup K ((2015) ) The case for rejecting the amyloid cascade hypothesis. Nat Neurosci 18: , 794–799. |
[5] | Kametani F , Hasegawa M ((2018) ) Reconsideration of amyloid hypothesis and tau hypothesis in Alzheimer’s disease. Front Neurosci 12: , 25. |
[6] | Forrest SL , Kril JJ , Halliday GM ((2019) ) Cellular and regional vulnerability in frontotemporal tauopathies. Acta Neuropathol 138: , 705–727. |
[7] | Mackenzie IRA , Neumann M ((2016) ) Molecular neuropathology of frontotemporal dementia: insights into disease mechanisms from postmortem studies. J Neurochem 138: , 54–70. |
[8] | Fitzpatrick AWP , Falcon B , He S , Murzin AG , Murshudov G , Garringer HJ , Crowther RA , Ghetti BF , Goedert M , Scheres SHW ((2017) ) Cryo-EM structures of taufilaments from Alzheimer’s disease. Nature 547: , 185–190. |
[9] | Falcon B , Zhang W , Murzin AG , Murshudov G , Garringer HJ , Vidal R , Crowther RA , Ghetti B , Scheres SHW , Goedert M ((2018) ) Structures of filaments from Pick’s disease reveal a novel tau protein fold. Nature 561: , 137–140. |
[10] | ShiY, ZhangW, YangY, et al. ((2021) ) Structure-based classification of tauopathies. Nature 598: , 359–363. https://doi.org/10.1038/s41586-021-03911-7 |
[11] | Tenreiro S , Eckermann K , Outeiro TF ((2014) ) Protein phosphorylation in neurodegeneration: Friend or foe? Front Mol Neurosci 7: , 42. |
[12] | Bertolotti A ((2018) ) Importance of the subcellular location of protein deposits in neurodegenerative diseases. Curr Opin Neurobiol 51: , 127–133. |
[13] | Nijholt DAT , van Haastert ES , Rozemuller AJM , Scheper W , Hoozemans JJM ((2012) ) The unfolded protein response is associated with early tau pathology in the hippocampus of tauopathies. J Pathol 226: , 693–702. |
[14] | Hoozemans JJM , Van Haastert ES , Nijholt DAT , Rozemuller AJM , Eikelenboom P , Scheper W ((2009) ) The unfolded protein response is activated in pretangle neurons in Alzheimer’s disease hippocampus. Am J Pathol 174: , 1241–1251. |
[15] | Moreno JA , Halliday M , Molloy C , Radford H , Verity N , Axten JM , Ortori CA , Willis AE , Fischer PM , Barrett DA , Mallucci GR ((2013) ) Oral treatment targeting the unfolded protein response prevents neurodegeneration and clinical disease in prion-infected mice. Sci Transl Med 5: , 206ra138. |
[16] | Radford H , Moreno JA , Verity N , Halliday M , Mallucci GR ((2015) ) PERK inhibition prevents tau-mediated neurodegeneration in a mouse model of frontotemporal dementia. Acta Neuropathol 130: , 633–642. |
[17] | Walter P , Ron D ((2011) ) The unfolded protein response: from stress pathway to homeostatic regulation. Science 334: , 1081–1086. |
[18] | Cao SS , Kaufman RJ ((2012) ) Unfolded protein response. Curr Biol 22: , R622–R626. |
[19] | Chang RCC , Wong AKY , Ng H-K , Hugon J ((2002) ) Phosphorylation of eukaryotic initiation factor-2alpha (eIF2alpha) is associated with neuronal degeneration in Alzheimer’s disease. Neuroreport 13: , 2429–2432. |
[20] | Halliday M , Radford H , Zents KAM , Molloy C , Moreno JA , Verity NC , Smith E , Ortori CA , Barrett DA , Bushell M , Mallucci GR ((2017) ) Repurposed drugs targeting eIF2 a -P-mediated translational repression prevent neurodegeneration in mice. Brain 140: , 1768–1783. |
[21] | Hashimoto S , Ishii A , Kamano N , Watamura N , Saito T , Ohshima T , Yokosuka M , Saido TC ((2018) ) Endoplasmic reticulum stress responses in mouse models of Alzheimer’s disease: Overexpression paradigm versus knockin paradigm. J Biol Chem 293: , 3118–3125. |
[22] | Pitera AP , Asuni AA , O’Connor V , Deinhardt K ((2019) ) Pathogenic tau does not drive activation of the unfolded protein response. J Biol Chem 294: , 9679–9688. |
[23] | Jicha GA , Bowser R , Kazam IG , Davies P ((1997) ) Alz-50 and MC-1, a new monoclonal antibody raised to paired helical filaments, recognize conformational epitopes on recombinant tau. J Neurosci Res 48: , 128–132. |
[24] | Mirra SS , Heyman A , McKeel D , Sumi SM , Crain BJ , Brownlee LM , Vogel FS , Hughes JP , Belle van G , Berg L ((1991) ) The Consortiumto Establish a Registry for Alzheimer’sDisease (CERAD) Part II. Standardization of the neuropathologicassessment of Alzheimer’s disease. Neurology 41: , 479–479. |
[25] | Barton AJL , Pearson RCA , Najlerahim A , Harrison PJ ((1993) ) Pre-andpostmortem influences on brain RNA. J Neurochem 61: , 1–11. |
[26] | Preece P , Cairns NJ ((2003) ) Quantifying mRNA in post-mortem human brain: Influence of gender, age at death, postmortem interval, brain pH, agonal state and inter-lobe mRNA variance. Mol Brain Res 118: , 60–71. |
[27] | Minett T , Classey J , Matthews FE , Fahrenhold M , Taga M , Brayne C , Ince PG , Nicoll JAR , Boche D ((2016) ) Microglial immunophenotype in dementia with Alzheimer’s pathology. J Neuroinflammation 13: , 1–10. |
[28] | Zotova E , Bharambe V , Cheaveau M , Morgan W , Holmes C , Harris S , Neal JW , Love S , Nicoll JAR , Boche D ((2013) ) Inflammatory components in human Alzheimer’s disease and after active amyloid-β42 immunization. Brain 136: , 2677–2696. |
[29] | Asuni AA , Gray B , Bailey J , Skipp P , Perry VH , O’Connor V ((2014) ) Analysis of the hippocampal proteome in ME7 prion disease reveals a predominant astrocytic signature and highlights the brain-restricted production of clusterin in chronic neurodegeneration. J Biol Chem 289: , 4532–4545. |
[30] | Keysers C , Gazzola V , Wagenmakers E-J ((2020) ) Using Bayes factor hypothesis testing in neuroscience to establish evidence of absence. Nat Neurosci 23: , 788–799. |
[31] | Oslowski CM , Urano F ((2011) ) Measuring ER stress and the unfolded protein response using mammalian tissue culture system. Methods Enzymol 490: , 71–92. |
[32] | Bruch J , Xu H , Rösler TW , De Andrade A , Kuhn P , Lichtenthaler SF , Arzberger T , Winklhofer KF , Müller U , Höglinger GU ((2017) ) PERK activation mitigates tau pathology in vitro and in vivo. EMBO Mol Med 9: , 371–384. |
[33] | Hoozemans JJM , Veerhuis R , Van Haastert ES , Rozemuller JM , Baas F , Eikelenboom P , Scheper W ((2005) ) The unfolded protein response is activated in Alzheimer’s disease. Acta Neuropathol 110: , 165–172. |
[34] | Buchanan H , Mackay M , Palmer K , Tothová K , Katsur M , Platt B , Koss DJ ((2020) ) Synaptic loss, ER stress and neuro-inflammation emerge late in the lateral temporal cortex and associate with progressive tau pathology in Alzheimer’s disease. Mol Neurobiol 57: , 3258–3272. |
[35] | Stutzbach LD , Xie SX , Naj AC , Albin R , Gilman S , Lee VMY , Trojanowski JQ , Devlin B , Schellenberg GD ((2013) ) The unfolded protein response is activated in disease-affected brain regions in progressive supranuclear palsy and Alzheimer’s disease. Acta Neuropathol Commun 1: , 31. |
[36] | Mccullumsmith RE , Hammond JH , Shan D , Meador-Woodruff JH ((2014) ) Postmortem brain: An underutilized substrate for studying severe mental illness. Neuropsychopharmacology 39: , 65–87. |
[37] | Trinh MA , Kaphzan H , Wek RC , Pierre P , Cavener DR , Klann E ((2012) ) Brain-specific disruption of the eIF2α kinase PERK decreases ATF4 expression and impairs behavioral flexibility. Cell Rep 1: , 676–688. |
[38] | Sato N , Urano F , Yoon Leem J , Kim SH , Li M , Donoviel D , Bernstein A , Lee AS , Ron D , Veselits ML , Sisodia SS , Thinakaran G ((2000) ) Upregulation of BiP and CHOP by the unfolded-protein response independent of presenilin expression. Nat Cell Biol 2: , 863–870. |
[39] | Katayama T , Imaizumi K , Sato N , Miyoshi K , Kudo T , Hitomi J , Morihara T , Yoneda T , Gomi F , Mori Y , Nakano Y , Takeda J , Tsuda T , Itoyama Y , Murayama O , Takashima a , St George-Hyslop P , Takeda M , Tohyama M ((1999) ) Presenilin-1mutations downregulate the signalling pathway of theunfolded-protein response. Nat Cell Biol 1: , 479–485. |
[40] | Alafuzoff I , Arzberger T , Al-Sarraj S , Bodi I , Bogdanovic N , Braak H , Bugiani O , Del-Tredici K , Ferrer I , Gelpi E , Giaccone G , Graeber MB , Ince P , Kamphorst W , King A , Korkolopoulou P , Kovács GG , Larionov S , Meyronet D , Monoranu C , Parchi P , Patsouris E , Roggendorf W , Seilhean D , Tagliavini F , Stadelmann C , Streichenberger N , Thal DR , Wharton SB , Kretzschmar H ((2008) ) Staging of neurofibrillary pathology in Alzheimer’s disease:A study of the BrainNet Europe consortium.. Brain Pathol 18: , 484–496. |


