
Functional Brain Connectivity Patterns Associated with Visual Hallucinations in Dementia with Lewy Bodies
Abstract
Background:
The presence of recurrent, complex visual hallucinations (VH) is among the core clinical features of dementia with Lewy bodies (DLB). It has been proposed that VH arise from a disrupted organization of functional brain networks. However, studies are still limited, especially investigating the resting-state functional brain features underpinning VH in patients with dementia.
Objective:
The aim of the present pilot study was to investigate whether there were any alterations in functional connectivity associated with VH in DLB.
Methods:
Seed-based analyses and independent component analysis (ICA) of resting-state fMRI scans were carried out to explore differences in functional connectivity between DLB patients with and without VH.
Results:
Seed-based analyses reported decreased connectivity of the lateral geniculate nucleus, the superior parietal lobule and the putamen with the medial frontal gyrus in DLB patients with VH. Visual areas showed a pattern of both decreased and increased functional connectivity. ICA revealed between-group differences in the default mode network (DMN).
Conclusion:
Functional connectivity analyses suggest dysfunctional top-down and bottom-up processes and DMN-related alterations in DLB patients with VH. This impairment might foster the generation of false visual images that are misinterpreted, ultimately resulting in VH.
INTRODUCTION
The presence of recurrent, complex visual hallucinations (VH) is among the core clinical features for a clinical diagnosis of dementia with Lewy bodies (DLB) [1]. Different models have been proposed to understand the mechanisms underlying VH. Collerton et al. [2] suggested that recurrent, complex VH result from the combination of impaired top-down (attention) and bottom-up (visual perception) processes. Similarly, another recent model highlights the importance of dysfunctional attentional mechanisms in the development of VH [3]. Accordingly, neuropsychological studies have shown deficits in visual perception [4–7] and visual attention [8–10] in DLB and Parkinson’s disease (PD) patients with VH.
Even though it has been proposed that VH generate from a disrupted organization of functional brain networks [3, 11], there is still insufficient evidence fully corroborating this hypothesis. Resting-state functional MRI studies of VH have been carried out mainly in Parkinson’s disease (PD), and less in DLB [12]. Franciotti et al. [13] focused on the role of the default mode network (DMN) in explaining the occurrence of VH in PD. They tested the hypothesis proposed by previous theoretical articles based on the intrusion of self-referential images into misperceptions due to a dysfunctional DMN [14–16]. Independent component analysis (ICA) revealed increased connectivity in VH patients compared with those without between the superior frontal sulcus bilaterally and parietal regions, and also between contralateral parietal regions. Consistently, in another study, Yao et al. [17] reported increased activity in hallucinating PD patients within the DMN, specifically in fronto-parietal regions. In both studies, patients with and without VH had reduced functional connectivity when compared with control participants [13, 17], suggesting that increased functional connectivity found in patients with VH, compared with those without, may reflect dysfunctional compensatory mechanisms fostering the development of these symptoms. Another recent seed-based resting-state fMRI study of minor hallucinations in PD showed increased connectivity between the posterior cingulate, a central hub of the DMN, and temporal and parietal areas [18]. In another study, Yao et al. [19] investigated the connectivity of the hippocampus, showing increased functional connectivity with fronto-parietal areas, and decreased functional connectivity with occipito-temporal regions.
Generally, the most consistent finding is represented by increased functional connectivity of DMN-related regions in hallucinating patients with PD compared to those without VH, especially with frontal and parietal areas. However, due to the limited number of investigations available, the overall picture of what dysfunction in brain functional connectivity underpins or fosters VH in Lewy body disease is not clear, especially in patients with dementia. The aim of the present pilot study was to explore brain functional connectivity in DLB patients with VH in comparison with non-hallucinating patients. We undertook seed-based analyses to investigate the functional connectivity of regions of interest (ROIs) consistent with the hypothesis of an involvement of fronto-parietal regions, underlying attention deficits, and occipital/occipito-temporal areas, leading to impaired visual perception [9]. Then, we performed ICA to identify intrinsic resting-state functional brain networks, hypothesizing an involvement of the DMN.
MATERIALS AND METHODS
Sample
The present pilot study consisted of a sub-sample of DLB patients previously included in a structural MRI study [9]. From the original DLB sample (n = 28), resting-state fMRI scans were excluded for 5 patients (4 with VH and 1 without) due to poor quality of the acquisitions, specifically susceptibility artefacts observed in the frontal lobe, and incomplete field of view. Resting-state analyses for this study involved 23 clinically diagnosed patients with DLB, 7 with VH and 16 without VH. This study was approved by the Ethics Committee of Padua Hospital, Italy (reference number: 0056791, 12.10.2016). Clinical diagnosis of DLB was based on the consensus criteria proposed by the DLB consortium [20]. A diagnosis of Alzheimer’s disease was excluded based on the National Institute of Aging criteria [21]. Patients were included if they presented mild to moderate cognitive decline, as assessed using a Mini-Mental State Examination (MMSE) test score of 18 or above. None of the patients presented severe cerebrovascular disease, assessed by brain CT or MRI scan, history of psychiatric disorders, and severe eye pathology impairing visual acuity (cataract, glaucoma, macular degeneration). Visual acuity and visual field were normal (or corrected to normal for visual acuity) in all patients.
All patients underwent a comprehensive clinical assessment including the administration of the Unified Parkinson’s Disease Rating Scale motor score sub-section III (UPDRS-III) [22], the Mayo Fluctuations Questionnaire [23], and the Mayo Sleep Questionnaire [24]. The Neuropsychiatric Inventory (NPI) [25] questionnaire sub-section for hallucinations was used to assess the presence, severity and frequency of VH. Only patients with recurrent, complex VH were included in the study, as determined by a qualitative examination of the hallucinatory experiences reported by the patients. The neuropsychological assessment battery included the following tests: digit cancellation test [26] and Trail Making Test part A (TMT-A) [27] for visual attention; Visual and Object Space Perception (VOSP) battery [27, 28] for visuo-perceptive/visuo-spatial abilities; Rey-Osterrieth Complex Figure (ROCF) [29] for visuoconstruction; letter fluency [27] for executive functioning; prose memory test [30] for verbal long-term memory; clock drawing test [31] for visuospatial and executive abilities; digit span forward and backward [27, 32] for short-term and working memory.
MRI acquisition, pre-processing, and analyses
Three dimensional T1-weighted structural scans were acquired with a 1.5 Tesla Philips Achieva MRI scanner. The sequence used was a Turbo Field Echo and acquisition was sagittal. The following acquisition parameters were applied: repetition time = 7.4 ms, echo delay time =3.4 ms, field of view: 220 mm for DLB and 230 for PD, flip angle: 8°, 160 slices, voxel dimension 1.04×1.04×0.66 mm, gap 0.6 mm. T1-weighted images were segmented to obtain total gray matter, white matter, and cerebrospinal fluid volumes, determined using the MATLAB ‘get_totals’ script (http://www0.cs.ucl.ac.uk/staff/g.ridgway/vbm/get_totals.m) from each image in native space. Total intracranial volume (TIV) was calculated for each patient by summing gray matter, white matter, and cerebrospinal fluid total volumes.
Echo planar T2*-weighted MRI images were acquired on a 1.5 Tesla Philips Achieva MRI scanner using the following parameters: repetition time =2.02 s, echo delay time = 50 ms, acquisition time =2.1 s, flip angle: 90°, voxel dimension: 1.80×1.80×6.00 mm, field of view: 220 mm. Images were acquired in a single run including 250 volumes, with interleaved slice acquisition (21 axial slices per volume).
Seed-based analyses were undertaken to explore the functional connectivity of regions of interest (ROIs) based on the hypothesis of an involvement of attention and perception-related mechanisms in the development of VH. The following ROIs were selected: left and right pulvinar, lateral geniculate body, caudate nucleus, putamen, frontal eye field (BA 8), superior parietal lobule (BA 7), primary visual cortex (BA 17), secondary visual cortex (BA 18), visual associative cortex (BA 19), inferior temporal area (BA 20), occipitotemporal area (BA 37). All seeds are displayed in a supplementary material file (Supplementary Figure 1). These areas were chosen since they are involved in attention and visuoperceptive abilities. In particular, the frontal eye field, the superior parietal lobule, the pulvinar and the striatum (putamen and caudate nucleus) were chosen for their role in goal-directed visual attention [33–36]. The formation of objects visual representation, on the other hand, relies on ventral visual pathways, including primary and associative visual cortices, occipito-temporal cortices, and inferior temporal areas [37, 38]. The lateral geniculate body was chosen as a control nucleus of the thalamus, the hippocampus as a control region involved in cognitive processing, and the primary motor cortex as a control region not involved in high cognitive functioning. Pre-processing and statistical analyses were performed using the CONN toolbox [39]. Sequences were slice-timed, realigned, coregistered to their respective anatomical image, normalized to the MNI space, and smoothed with a 6 mm3 full-width at half-maximum Gaussian kernel. An outlier-detection step was also carried out to tag volumes showing displacement above the 97th percentile. A number of denoising methods were thus applied: outlier censoring via the ‘scrubbing’ approach, regressing out the first five principal components of WM and CSF signal (aCompCor [40]), and regressing out a total of 24 motion parameters. Acquisitions were also band-pass filtered (0.01 –0.1 Hz). Individual maps of functional connectivity were calculated for each seed.
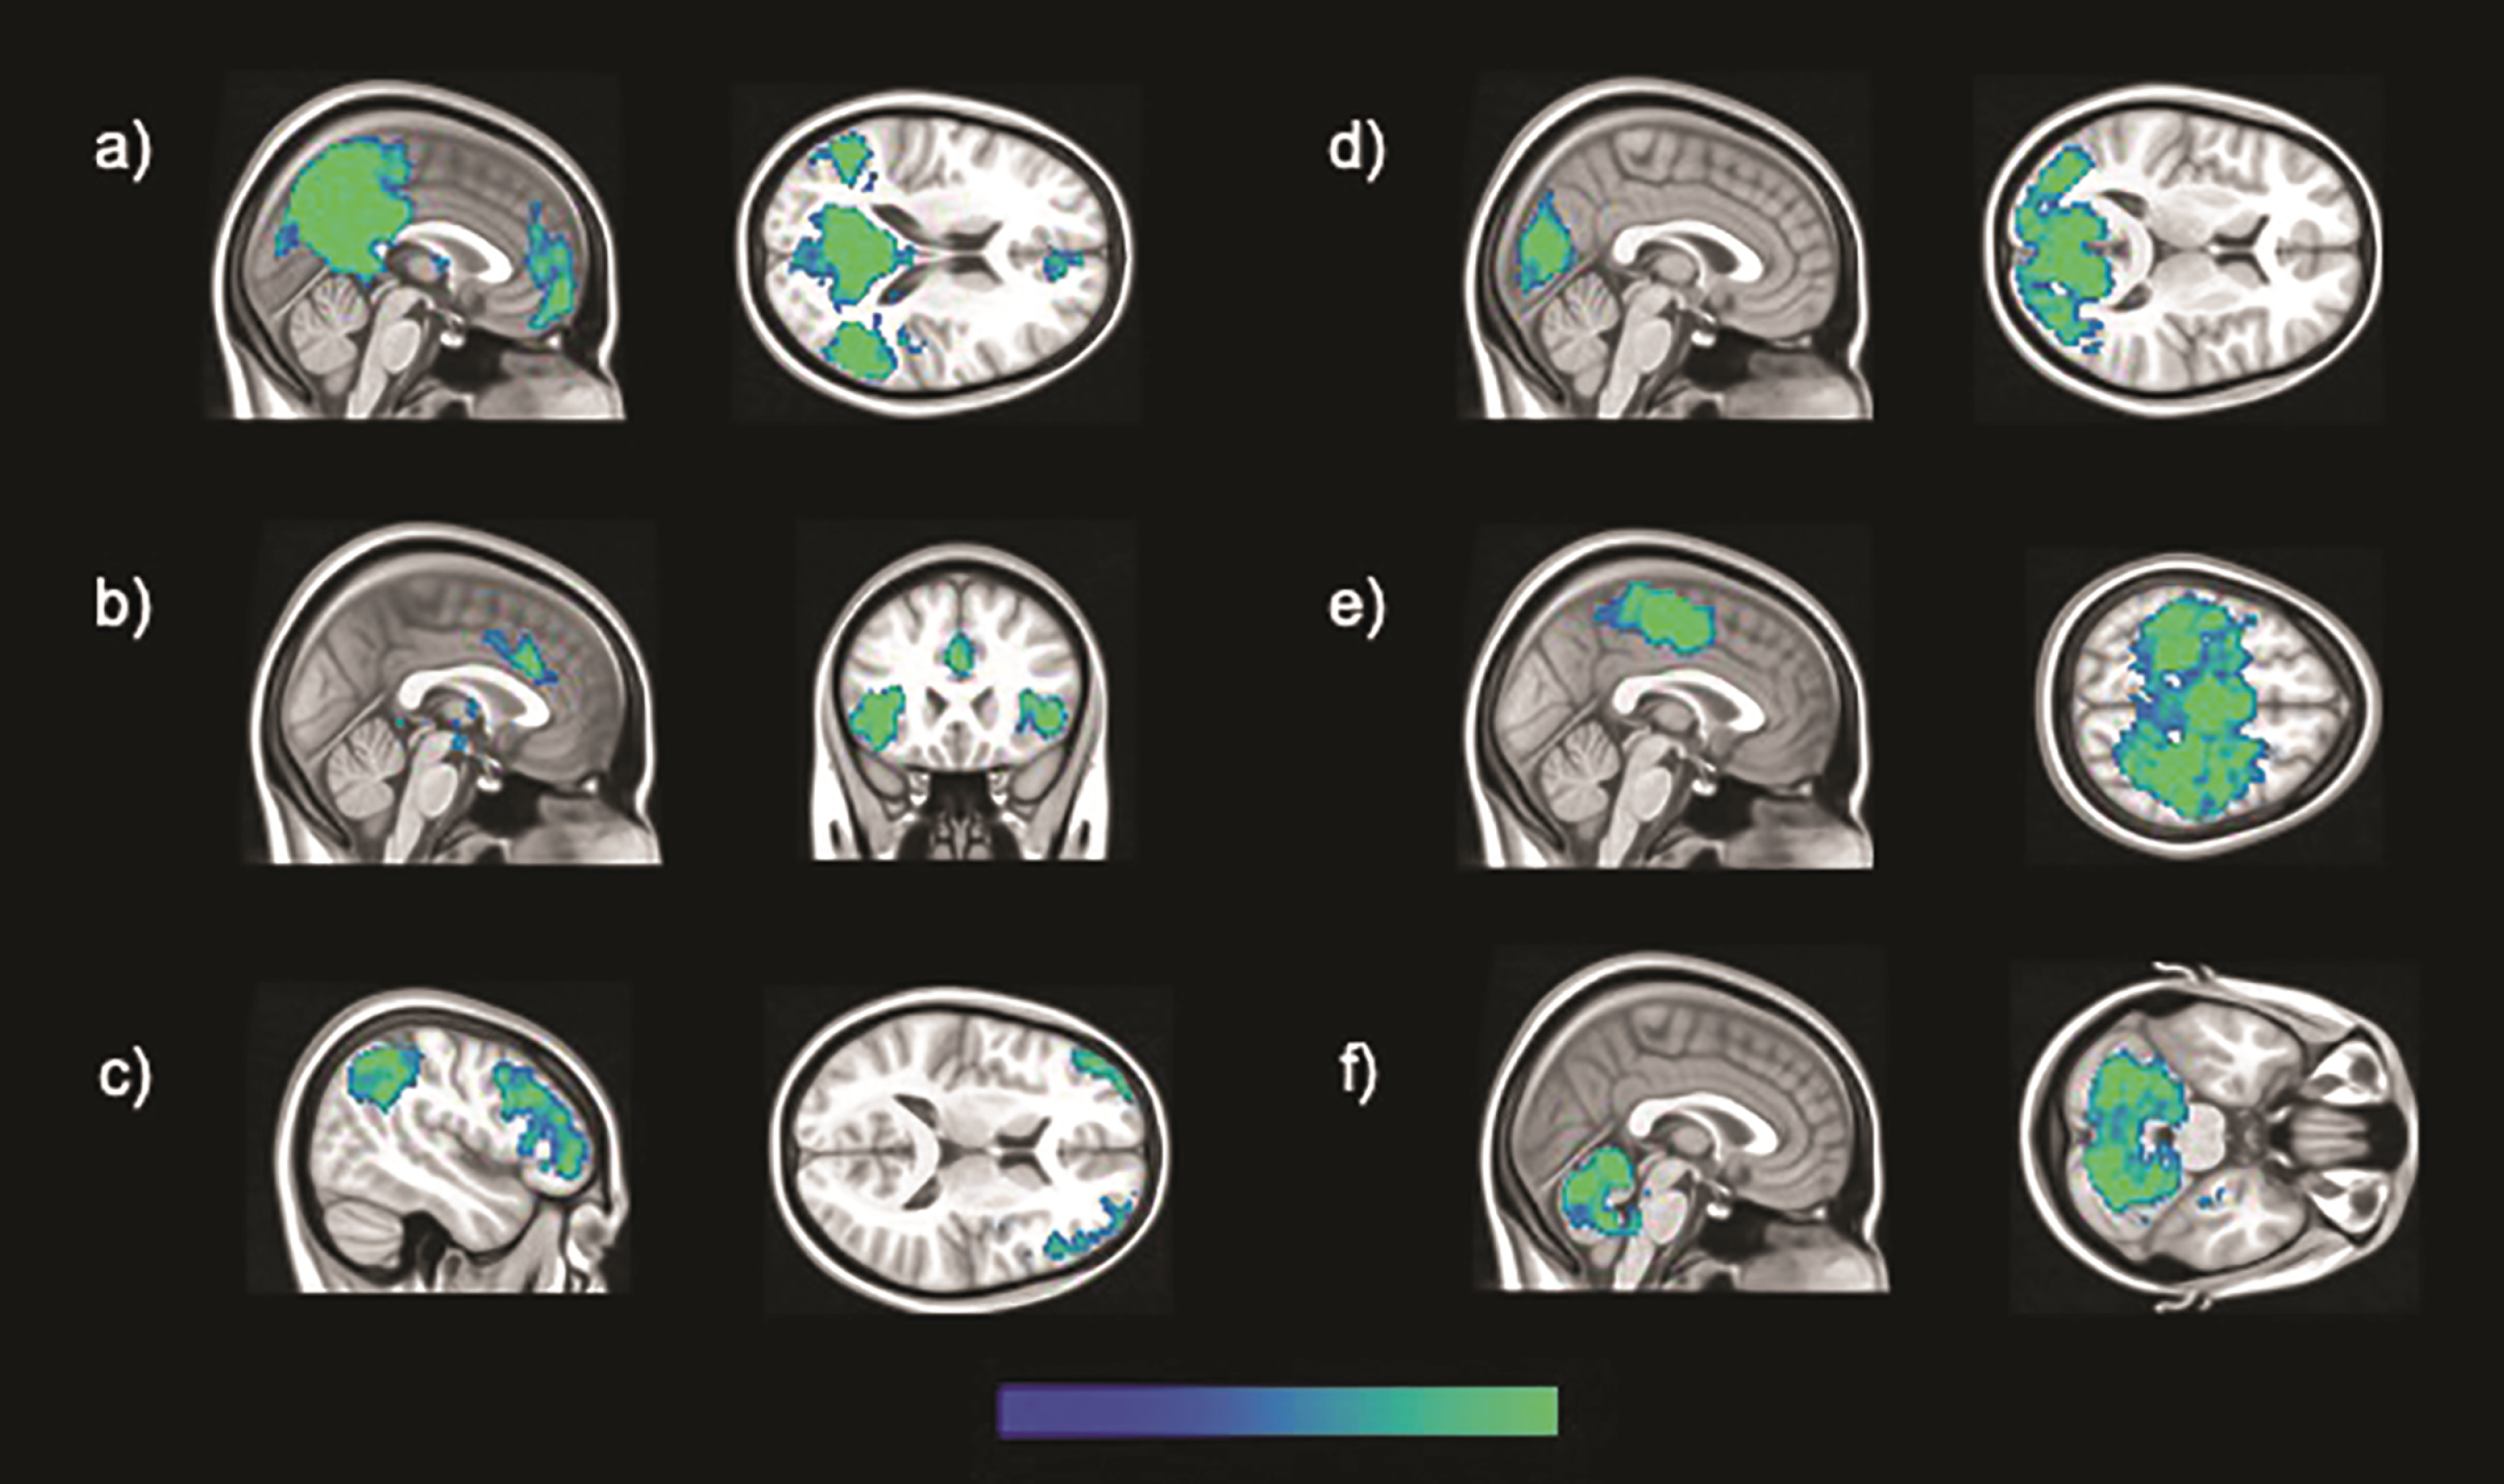
Fig. 1
The six brain large-scale brain functional networks investigated in this study, specifically: a) DMN, b) salience, c) fronto-parietal, d) occipital, e) sensory-motor, and f) cerebellar networks.
Large-scale functional networks of brain regions were identified by means of ICA. Pre-processing and statistical analyses were undertaken using SPM 12 running on MATLAB R2014a (v8.3). The pre-processing routine described above was relaunched prior to ICA, and further diagnostics were carried out. Linear and rotational parameters of head motion were estimated for each subject, plotted and inspected to identify potentially excessive head motion (exceeding 1.5 mm and 3° for linear and rotational movement, respectively) [41]. No acquisition was found in breach of these limits and no participant was thus excluded at this stage. Framewise and absolute displacement were also calculated in order to characterize volume-to-volume motion and check whether there were between-group differences in these aspects of motion parameters. Framewise displacement refers to the movement of the head from one volume to the next [42]. It was calculated as the sum of the absolute values of the difference of realignment estimates for each volume compared to the previous one. Absolute displacement refers to the movement of the head from the original position, which was calculated for each volume for both rotation and translation. Translation was calculated as the sum of the absolute values of the X, Y, and Z estimates, while rotation was the sum of the absolute values in pitch, yaw, and roll for each volume [42]. Finally, the REST toolbox (http://www.restfmri.net) was used to apply a band-pass temporal filter, and, compared to seed-based analyses, low and high-pass filters were set to define an analogous yet slightly larger bandwidth (0.008 –0.1 Hz). A group ICA was performed with the GIFT toolbox (v1.3i; mialab.mrn.org/software/gift), allowing the identification of brain networks. This technique also allows for the separation of signal and noise-based components, including those resulting from in-scanner motion [43]. The Infomax algorithm was used and the number of components set at 20 following published recommendations [44]. Following visual inspection of all estimated components, and agreement between two independent raters, six functional brain networks of interest were identified, specifically the salience, occipital, sensory-motor, cerebellar, DMN and fronto-parietal networks. All networks are displayed in Fig. 1. Three-dimensional maps of z scores for each network were extracted for each participant, and used for inferential models, aiming at investigating between-group differences, controlling for TIV and age. An uncorrected threshold of p < 0.001 was set to display significant results. Only peaks surviving a cluster-level threshold of p < 0.05 Family-Wise Error corrected for multiple comparisons are reported in the results section.
Montreal Neurological Institute (MNI) coordinates were converted into Talairach coordinates using GingerALE, v2.3.6 (http://www.brainmap.org/ale/). Then, the Talairach Client, v2.4.3 (http://www.talairach.org/client.html) was used to determine brain region labels for each significant cluster. In case of uncertain identification of coordinates labels, some peaks and sub-peaks were further checked manually on the 1988 Talairach atlas [45].
RESULTS
Demographic, clinical, and neuropsychological features are reported in Tables 1 and 2. Briefly, patients with and without VH did not differ for any demographic, clinical or neuropsychological characteristics, except for the NPI total score (p = 0.01) and the presence of rapid eye movement sleep behavior disorder, which was marginally significant (p = 0.05). There were no significant differences between patients with and without VH in framewise displacement (p = 0.46), absolute displacement translation (p = 0.46) and rotation (p = 0.29).
Table 1
Demographic and clinical characteristics of DLB patients with and without VH. Mean and SD values are reported for each variable unless otherwise specified
| Characteristic | DLB VH | DLB NVH | p |
| (n = 7) | (n = 16) | ||
| Demographics | |||
| Age | 75.29 (5.09) | 73.50 (6.65) | 0.54† |
| Gender M:F | 2 : 5 | 9 : 7 | 0.37‡ |
| Years of education | 6.00 (3.11) | 8.19 (5.00) | 0.39§ |
| Clinical features | |||
| Disease duration (y) | 2.57 (1.40) | 2.13 (1.31) | 0.42§ |
| MMSE | 22.71 (3.20) | 24.81 (3.53) | 0.19† |
| UPDRS III | 5.57 (11.80) | 4.75 (6.07) | 0.46§ |
| RBD¶ | 100% | 44% | 0.05‡ |
| Cognitive fluctuation | 57% | 88% | 0.14‡ |
| NPI total score | 17.71 (9.39) | 5.50 (3.83) | 0.01§ |
| NPI total score minus NPI hallucinations | 12.71 (10.52) | 5.50 (3.83) | 0.15§ |
DLB, dementia with Lewy bodies; F, female; M, male; MMSE, Mini-Mental State Examination; NPI, neuropsychiatric inventory; NVH, no VH; RBD, REM sleep behavior disorder; SD, standard deviation; UPDRS, Unified Parkinson’s Disease Rating Scale; VH, visual hallucinations. †Independent-sample t-test; ‡Fisher’s Exact Test; §Independent-sample Mann-Whitney U test; ¶Missing data for a VH patient.
Table 2
Differences in neuropsychological tests between DLB patients with and without VH
| Test | DLB VH | DLB NVH | p value | ||||
| n | Mean (SD) | Median (IQR) | n | Mean (SD) | Median (IQR) | ||
| Digit cancellation | 6 | 27.33 (6.65) | 26.50 (13.0) | 15 | 34.20 (9.92) | 36.0 (15.0) | 0.14 † |
| TMT-A (s) | 6 | 166.8 (74.3) | 139.50 (148) | 13 | 128.0 (74.10) | 101.0 (65.0) | 0.13 ‡ |
| Digit span: | |||||||
| Forward | 6 | 4.17 (0.98) | 4.0 (0.75) | 15 | 4.80 (1.08) | 5.00 (2.0) | 0.24 ‡ |
| Backward | 6 | 2.33 (0.52) | 2.0 (1.0) | 15 | 2.87 (1.19) | 3.00 (2.0) | 0.21 ‡ |
| Prose memory: | |||||||
| Immediate | 7 | 6.29 (2.21) | 6.0 (4.0) | 16 | 6.94 (3.91) | 6.00 (3.0) | 0.97 ‡ |
| Delayed | 7 | 6.71 (3.95) | 7.0 (3.0) | 16 | 7.50 (4.87) | 7.00 (6.0) | 0.77 ‡ |
| Letter fluency | 6 | 17.17 (12.0) | 11.5 (18.5) | 13 | 16.62 (11.92) | 11.00 (21.5) | 0.70 ‡ |
| Clock drawing | 6 | 5.17 (2.86) | 4.0 (4.25) | 16 | 4.66 (3.52) | 5.75 (6.38) | 0.76 † |
| ROCF Copy | 6 | 12.75 (15.2) | 7.25 (28.5) | 13 | 20.19 (11.14) | 22.0 (19.75) | 0.32 ‡ |
| ROCF Delayed | 6 | 2.58 (3.69) | 1.50 (4.63) | 13 | 7.27 (5.52) | 7.00 (9.75) | 0.09 ‡ |
| VOSP: | |||||||
| Screening test | 7 | 18.29 (2.63) | 20.0 (5.0) | 15 | 19.33 (0.72) | 19.00 (1.0) | 0.95 ‡ |
| Incomplete letters | 7 | 8.57 (6.48) | 8.0 (11.0) | 15 | 12.20 (7.54) | 15.00 (13.0) | 0.30 ‡ |
| Silhouettes | 7 | 8.29 (6.24) | 9.0 (11.0) | 15 | 12.33 (3.87) | 13.00 (6.0) | 0.08 † |
| Object decision | 7 | 7.29 (5.71) | 9.00 (12.00) | 14 | 11.14 (3.96) | 12.00 (6.25) | 0.09 † |
| Progressive silhouettes | 7 | 8.29 (6.50) | 8.00 (14.00) | 14 | 11.36 (3.88) | 11.00 (3.50) | 0.19 † |
| Dot counting | 7 | 9.43 (0.79) | 10.00 (1.00) | 15 | 9.40 (1.55) | 10.00 (1.00) | 0.58 ‡ |
| Position discrimination | 7 | 15.43 (7.04) | 19.00 (4.00) | 15 | 17.27 (3.73) | 19.00 (8.00) | 0.41 ‡ |
| Number location | 7 | 6.14 (4.67) | 7.00 (8.00) | 15 | 6.07 (2.55) | 7.00 (4.00) | 0.97 † |
| Cube analysis | 7 | 4.57 (3.10) | 5.00 (5.00) | 15 | 5.53 (3.29) | 5.00 (6.00) | 0.52 † |
DLB: dementia with Lewy bodies; IQR: interquartile range; NVH: no VH; s: seconds; SD: standard deviation; TMT-A: Trail Making Test A; ROCF: Rey-Osterrieth Complex Figure; VH: visual hallucinations; VOSP: Visual and Object Space Perception battery. † Independent-sample t-test, ‡ Mann-Whitney U test.
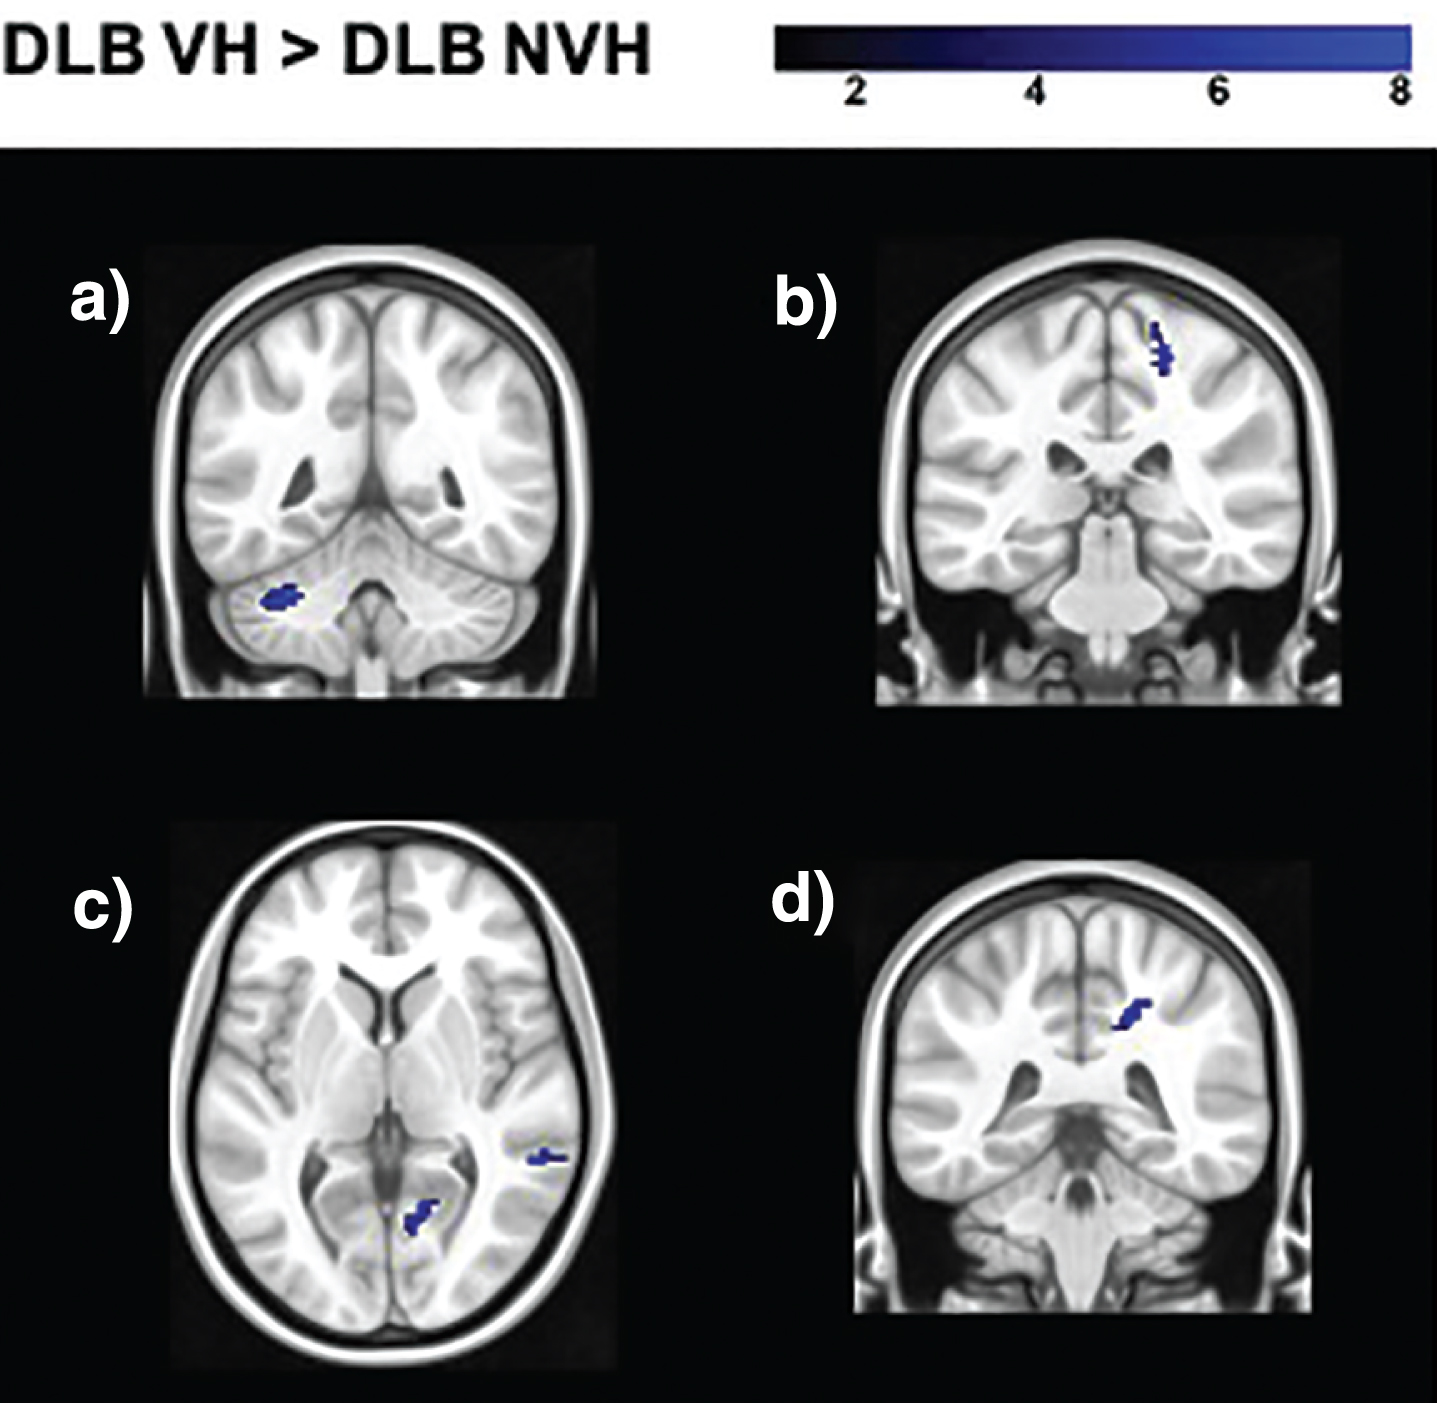
Seed based analyses yielded regions of significantly decreased and increased functional connectivity in DLB VH patients as opposed to patients without hallucinations (Table 3, Figs. 2 and 3). In particular, the seeds located in the left geniculate nucleus, left superior parietal lobule, and right putamen showed decreased functional connectivity with the medial frontal gyrus bilaterally. The left primary visual cortex presented regions of decreased connectivity with the cerebellum, while the right primary visual cortex had significantly lower connectivity with temporo-parietal regions. Increased functional connectivity was found between the right lateral geniculate nucleus and temporo-parietal regions, between the right secondary visual cortex and the postcentral and precentral gyri, between the right superior parietal lobule and the cerebellum, and between the right putamen and the cingulate gyrus.
Table 3
Regions of decreased and increased functional connectivity in DLB patients with VH compared to those without resulted from seed-based and independent component analyses (cluster-level threshold of p < 0.05 FWE corrected for multiple comparisons with TIV and age as covariates of no interest)
| Structure | Side | Cluster size | MNI coordinates | T score | Z score | p | ||
| Seed-based analyses: Decreased connectivity | ||||||||
| Left lateral geniculate nucleus seed: | ||||||||
| Medial frontal gyrus (BA 10) | R | 34 | 2 | 48 | –8 | 5.03 | 0.009 | |
| Medial frontal gyrus (BA 11) | L | –2 | 42 | –10 | 4.23 | |||
| Left primary visual cortex (BA 17) seed: | ||||||||
| Cerebellum: Culmen | L | 45 | –32 | –50 | –32 | 4.85 | 0.009 | |
| Right primary visual cortex (BA 17) seed: | ||||||||
| Posterior cingulate (BA 31) | L | 57 | –28 | –64 | 18 | 4.98 | 0.002 | |
| Middle temporal gyrus (BA 39) | L | –28 | –60 | 20 | 4.72 | |||
| Cingulate gyrus (BA 31) | L | –24 | –50 | 22 | 4.45 | |||
| Superior temporal gyrus (BA 39) | L | –30 | –56 | 22 | 4.12 | |||
| Postcentral gyrus (BA 2) | L | 37 | –42 | –36 | 62 | 4.68 | 0.017 | |
| Left superior parietal lobule (BA 7) seed: | ||||||||
| Medial frontal gyrus (BA 9) | R | 40 | 2 | 52 | 28 | 4.83 | 0.014 | |
| Medial frontal gyrus (BA 9) | L | –2 | 44 | 28 | 4.07 | |||
| Right putamen seed: | ||||||||
| Medial frontal gyrus (BA 10) | L | 47 | –8 | 58 | 4 | 4.96 | 0.004 | |
| Seed-based analyses: Increased connectivity | ||||||||
| Right lateral geniculate nucleus seed: | ||||||||
| Posterior cingulate (BA 30) | R | 81 | 14 | –60 | 6 | 5.22 | < 0.001 | |
| Posterior cingulate (BA 30) | R | 10 | –58 | 8 | 5.00 | |||
| Lingual gyrus (BA 18) | R | 10 | –68 | 2 | 4.11 | |||
| Superior temporal gyrus (BA 22) | R | 27 | 56 | –44 | 4 | 5.12 | 0.027 | |
| Superior temporal gyrus (BA 22) | R | 64 | –42 | 6 | 4.46 | |||
| Right secondary visual cortex (BA 18) seed: | ||||||||
| Postcentral gyrus (BA 3) | R | 46 | 22 | –32 | 54 | 4.63 | 0.007 | |
| Precentral gyrus (BA 4) | R | 20 | –32 | 60 | 4.54 | |||
| Paracentral gyrus (BA 5) | R | 20 | –38 | 52 | 4.08 | |||
| Postcentral gyrus (BA 3) | R | 28 | –28 | 42 | 3.89 | |||
| Precentral gyrus (BA 4) | R | 18 | –32 | 68 | 3.88 | |||
| Right superior parietal lobule (BA 7) seed: | ||||||||
| Cerebellum: Culmen | L | 124 | –30 | –46 | –32 | 5.05 | < 0.001 | |
| Cerebellum: Culmen | L | –38 | –52 | –36 | 4.76 | |||
| Right putamen seed: | ||||||||
| Cingulate gyrus (BA 31) | R | 53 | 18 | –40 | 38 | 5.07 | 0.002 | |
| Independent component analysis: Decreased connectivity | ||||||||
| Default mode network: | ||||||||
| Insula (BA 13) | L | 180 | –30 | 6 | 20 | 7.34 | 5.00 | < 0.001 |
| Independent component analysis: Increased connectivity | ||||||||
| Default mode network: | ||||||||
| Inferior parietal lobule (BA 40) | L | 136 | –54 | –46 | 44 | 5.74 | 4.32 | 0.003 |
| Inferior parietal lobule (BA 40) | L | –48 | –54 | 48 | 5.35 | 4.13 | ||
| Supramarginal gyrus (BA 40) | L | –54 | –56 | 42 | 5.14 | 4.02 | ||
BA, Brodmann area; DLB: dementia with Lewy bodies; DMN, default mode network; FWE, family-wise error; L, left; NVH, no VH; R, right; TIV, total intracranial volume; VH, visual hallucination.
Fig. 2
Regions of decreased functional connectivity in DLB patients with VH compared to those without obtained in the analyses of the following seeds: a) right putamen; b) left superior parietal lobule (BA 7); c) left lateral geniculate nucleus; d) right primary visual cortex (BA 17); e) right primary visual cortex (BA 17); f) left primary visual cortex (BA 17). The color bar indicates the z scores with the cluster-level threshold of p < 0.05 Family-Wise Error corrected for multiple comparisons with total intracranial volume and age as covariates of no interest.
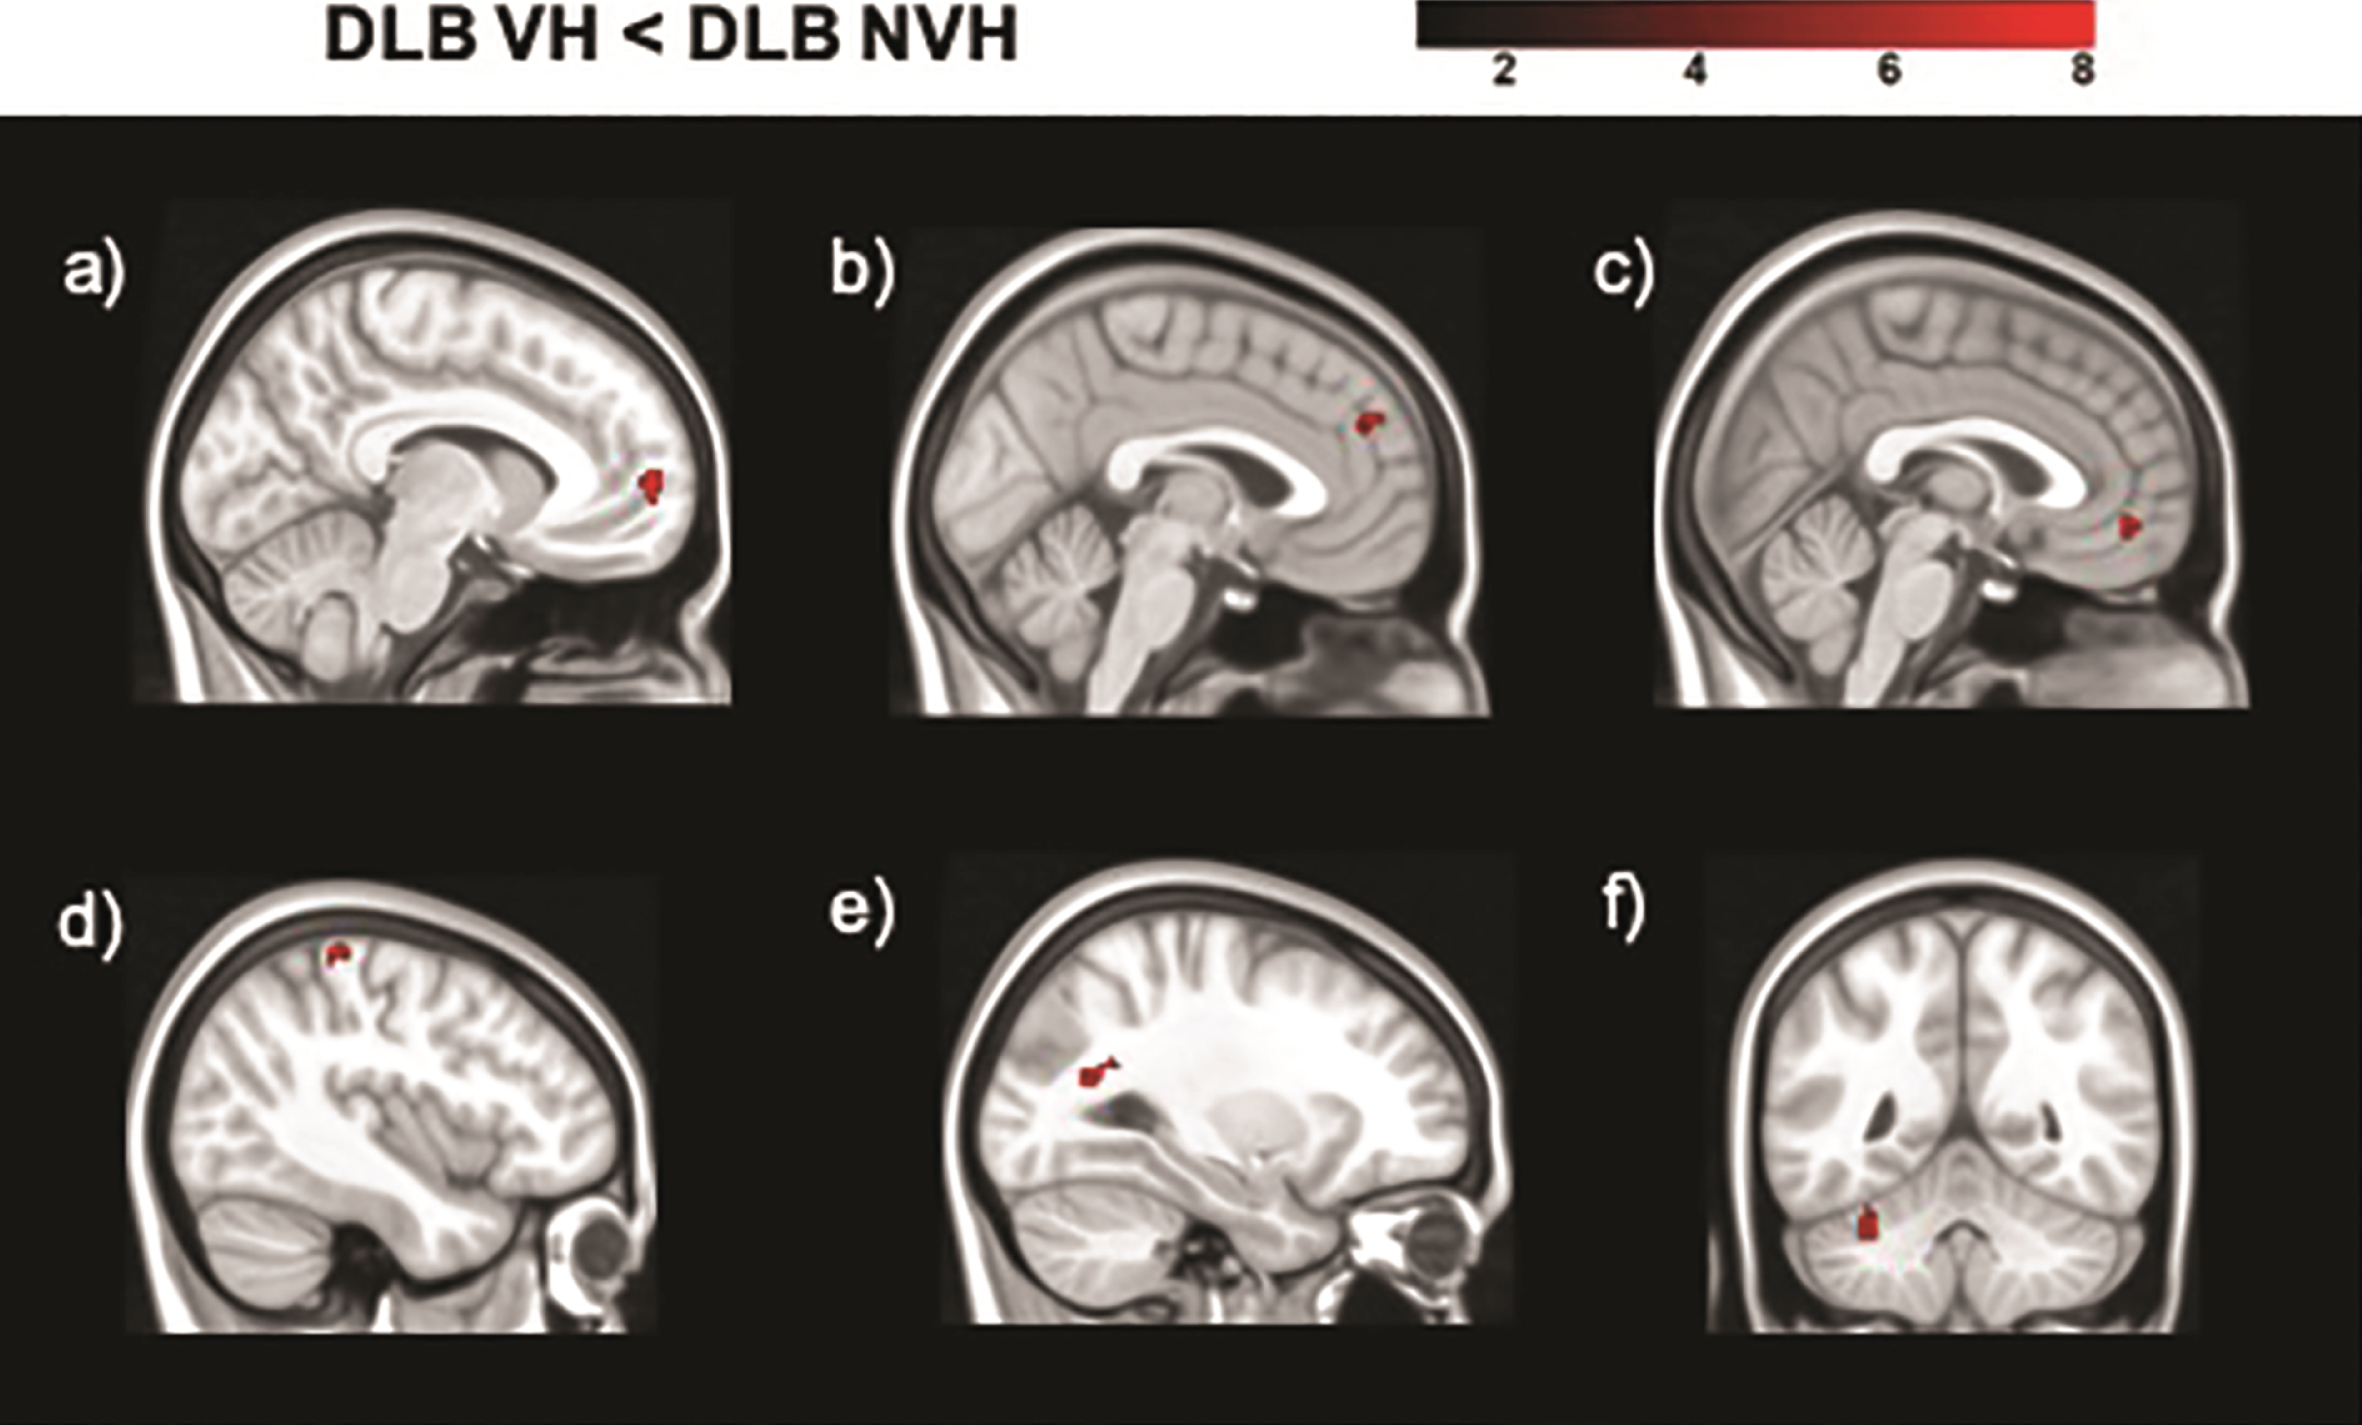
Fig. 3
Regions of increased functional connectivity in DLB patients with VH compared to those without obtained in the analyses of the following seeds: a) right superior parietal lobule (BA 7); b) right secondary visual cortex (BA 18); c) right lateral geniculate nucleus; d) right putamen. The color bar indicates the z scores with the cluster-level threshold of p < 0.05 Family-Wise Error corrected for multiple comparisons with total intracranial volume and age as covariates of no interest.
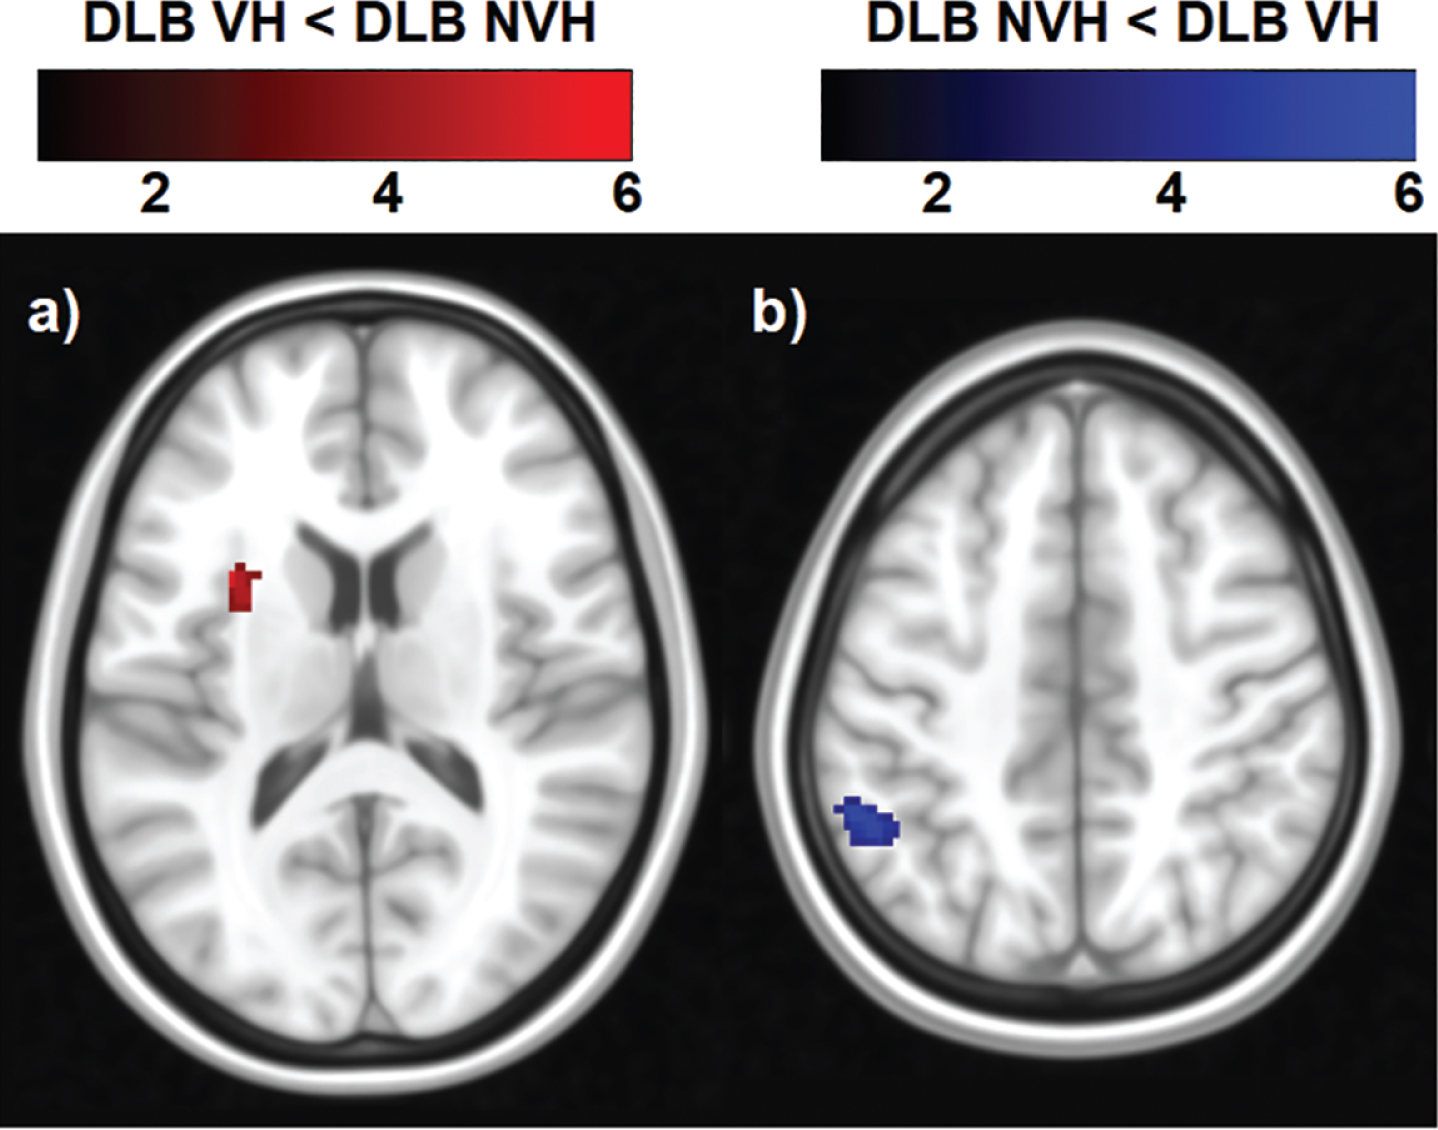
From the 20 components estimated by the ICA, six large-scale functional brain networks were identified, namely the salience, occipital, sensory-motor, cerebellar, DMN and fronto-parietal networks (Fig. 1). Only the statistical analysis on the DMN yielded regions of significant decreased and increased functional connectivity (Table 3 and Fig. 4). The DMN was identified as showing synchronous BOLD signal in the following regions: posterior cingulate, inferior parietal lobule, lateral temporal and medial prefrontal cortices [46]. Patients with VH showed a cluster of decreased functional connectivity with the DMN, which was located in the left insula. Increased functional connectivity was found with parietal regions, namely the left inferior parietal lobule and supramarginal gyrus (Table 3 and Fig. 4).
Fig. 4
Regions of decreased and increased functional connectivity within the DMN in DLB patients with VH compared with those without. The color bar indicates the z scores with a cluster-level threshold of p < 0.05 Family-Wise Error corrected for multiple comparisons with total intracranial volume and age as covariates of no interest.
DISCUSSION
The present pilot study provides evidence of both increased and decreased functional connectivity in DLB patients with VH. The lateral geniculate nucleus, the superior parietal lobule and the putamen all showed decreased connectivity with the medial frontal gyrus bilaterally. The top-down control of spatial attention has been shown to rely on a large-scale network, including three primary cortical hubs located in the parietal, frontal and cingulate cortices [34]. These regions are directly interconnected with each other, and indirectly through subcortical hubs in the striatum and the thalamus [34]. Reduced gray matter volume has been found in DLB patients with VH [9, 47], and altered frontal and parietal metabolism/perfusion has been reported [48]. Furthermore, high density of Lewy body pathology has been shown in frontal and anterior cingulate areas in patients with VH, and alterations of the cholinergic receptors within the anterior cingulate have been related to VH in DLB [49, 50]. Cholinergic dysfunction has been proposed to foster the development of VH [51], and its treatment has been shown to ameliorate this symptom, as well as attention deficits [52]. Alterations in the functional connectivity of medial frontal areas might be related to the more severe attention deficits found in DLB and PD patients with VH [8–10], which might constitute a vulnerability to the symptomatology. Collerton et al. [2] proposed an involvement of visual processing impairment, in addition to attention deficits. Occipital and occipito-temporal hypometabolism/perfusion has been repeatedly found in DLB and PD with VH, suggesting a contribution of ventral visual pathways [48]. In the present study, however, visual areas showed a pattern of both decreased and increased functional connectivity. Future studies are needed to understand the significance of this bidirectional pattern of functional connectivity, and the role of such alterations in the genesis and persistence of VH in this disease.
ICA revealed differences between hallucinating and non-hallucinating patients only in the DMN. Specifically, higher functional connectivity was detected in hallucinating patients with the right inferior parietal lobule, while it was lower with the left insula. The inferior parietal lobule is a core region of the DMN [46]. Shine et al. [3] proposed that VH may be the result of disrupted engagement of attention networks, specifically overactivity of the DMN and the ventral attention network (VAN), and inappropriate engagement of the dorsal attention network (DAN). Therefore, overactivity of the DMN might reflect excessive self-referential internal processing, that may form the basis for the emergence of false images [3]. Within this framework, VH might generate from dysfunctional top-down control mechanisms of medial frontal areas over visual areas that might foster the generation of false images arising from an increased activity of the DMN. This speculative interpretation, however, demands further investigation to shed light on the mechanisms behind the pattern of functional connectivity associated with VH in DLB. The insula, on the other hand, is a central hub of the VAN, which has been proposed to coordinate the activity of the DMN and of the goal-directed DAN network [3]. The lower functional connectivity between the DMN and the insula detected in the present study appears to be in contrast with previous findings showing higher connectivity of the VAN associated with visual misperceptions in patients with hallucinations [12]. In this context, the role of the VAN in the development of VH and the direction of its impaired functional connectivity in relation to other attention networks require further investigation.
The main limitation of the present study is represented by the small sample size. Although the findings survived a Family-Wise Error corrected cluster-level p < 0.05, larger samples are needed to corroborate the hypotheses put forward by the present investigation. Thus, the results should be interpreted with caution, and can only be considered as a reference pilot study for future investigations. Another limitation is related to the use of the NPI to assess the presence, severity and frequency of VH. Although the NPI has been used by most studies in the literature, it is not sufficiently specific to detect VH-related phenomenological features, which might be helpful in clarifying the mechanisms involved [12].
VH are severe and disabling symptoms frequently observed in DLB. They have a deleterious impact on the overall quality of life of patients and lead to significantly higher caregiver distress [15, 53]. However, there is currently no effective targeted treatment for these symptoms, problem that is worsened further by the lack of evidence-based interventions [53, 54]. In this context, a better understanding of the functional brain features underlying this symptomatology may aid the detection of symptom-specific biomarkers, which may be helpful in the development of new treatment targets. In the present study, functional connectivity analyses suggest dysfunctional top-down and bottom-up processes and DMN-related alterations in DLB patients with VH. This impairment might foster the generation of false visual images that are misinterpreted, ultimately resulting in VH.
ACKNOWLEDGMENTS
This is a summary of independent research carried out at the NIHR Sheffield Biomedical Research Centre (Translational Neuroscience). The views expressed are those of the author(s) and not necessarily those of the NHS, the NIHR or the Department of Health.
This research did not receive any specific grant from funding agencies in the public, commercial, or not-for-profit sectors. SP was partially funded by a Faculty of Medicine, Dentistry and Health, University of Sheffield, UK matched funding studentship.
CONFLICT OF INTEREST
The authors have no conflict of interest to report.
SUPPLEMENTARY MATERIAL
[1] The supplementary material is available in the electronic version of this article: https://dx.doi.org/10.3233/ADR-200288.
REFERENCES
[1] | McKeith IG , Boeve BF , Dickson DW , Halliday G , Taylor JP , Weintraub D , Aarsland D , Galvin J , Attems J , Ballard CG , Bayston A , Beach TG , Blanc F , Bohnen N , Bonanni L , Bras J , Brundin P , Burn D , Chen-Plotkin A , Duda JE , El-Agnaf O , Feldman H , Ferman TJ , Ffytche D , Fujishiro H , Galasko D , Goldman JG , Gomperts SN , Graff-Radford NR , Honig LS , Iranzo A , Kantarci K , Kaufer D , Kukull W , Lee VMY , Leverenz JB , Lewis S , Lippa C , Lunde A , Masellis M , Masliah E , McLean P , Mollenhauer B , Montine TJ , Moreno E , Mori E , Murray M , O’Brien JT , Orimo S , Postuma RB , Ramaswamy S , Ross OA , Salmon DP , Singleton A , Taylor A , Thomas A , Tiraboschi P , Toledo JB , Trojanowski JQ , Tsuang D , Walker Z , Yamada M , Kosaka K ((2017) ) Diagnosis and management of dementia with Lewy bodies: Fourth consensus report of the DLB Consortium. Neurology 89: , 88–100. |
[2] | Collerton D , Perry E , McKeith I ((2005) ) Why people see things that are not there: A novel Perception and Attention Deficit model for recurrent complex visual hallucinations. Behav Brain Sci 28: , 737–757. |
[3] | Shine JM , Halliday GM , Naismith SL , Lewis SJ ((2011) ) Visual misperceptions and hallucinations in Parkinson’s disease: Dysfunction of attentional control networks? Mov Disord 26: , 2154–2159. |
[4] | Koerts J , Borg MA , Meppelink AM , Leenders KL , van Beilen M , van Laar T ((2010) ) Attentional and perceptual impairments in Parkinson’s disease with visual hallucinations. Parkinsonism Relat Disord 16: , 270–274. |
[5] | Ramirez-Ruiz B , Junque C , Marti MJ , Valldeoriola F , Tolosa E ((2006) ) Neuropsychological deficits in Parkinson’s disease patients with visual hallucinations. Mov Disord 21: , 1483–1487. |
[6] | Ramirez-Ruiz B , Junque C , Marti M-J , Valldeoriola F , Tolosa E ((2007) ) Cognitive changes in Parkinson’s disease patients with visual hallucinations. Dement Geriatr Cogn Disord 23: , 281–288. |
[7] | Mori E , Shimomura T , Fujimori M , Hirono N , Imamura T , Hashimoto M , Tanimukai S , Kazui H , Hanihara T ((2000) ) Visuoperceptual impairment in dementia with Lewy bodies. Arch Neurol 57: , 489. |
[8] | Manganelli F , Vitale C , Santangelo G , Pisciotta C , Iodice R , Cozzolino A , Dubbioso R , Picillo M , Barone P , Santoro L ((2009) ) Functional involvement of central cholinergic circuits and visual hallucinations in Parkinson’s disease. Brain 132: , 2350–5. |
[9] | Pezzoli S , Cagnin A , Antonini A , Venneri A ((2019) ) Frontal and subcortical contribution to visual hallucinations in dementia with Lewy bodies and Parkinson’s disease. Postgrad Med 131: , 509–522. |
[10] | Hepp DH , da Hora CC , Koene T , Uitdehaag BM , van den Heuvel OA , Klein M , van de Berg WD , Berendse HW , Foncke EM ((2013) ) Cognitive correlates of visual hallucinations in non-demented Parkinson’s disease patients. Parkinsonism Relat Disord 19: , 795–799. |
[11] | Shine JM , Halliday GM , Gilat M , Matar E , Bolitho SJ , Carlos M , Naismith SL , Lewis SJ ((2014) ) The role of dysfunctional attentional control networks in visual misperceptions in Parkinson’s disease. Hum Brain Mapp 35: , 2206–2219. |
[12] | Pezzoli S , Cagnin A , Bandmann O , Venneri A ((2017) ) Structural and functional neuroimaging of visual hallucinations in Lewy body disease: A systematic literature review. Brain Sci 7: , 84. |
[13] | Franciotti R , Delli Pizzi S , Perfetti B , Tartaro A , Bonanni L , Thomas A , Weis L , Biundo R , Antonini A , Onofrj M ((2015) ) Default mode network links to visual hallucinations: A comparison between Parkinson’s disease and multiple system atrophy. Mov Disord 30: , 1237–1247. |
[14] | Muller AJ , Shine JM , Halliday GM , Lewis SJ ((2014) ) Visual hallucinations in Parkinson’s disease: Theoretical models. Mov Disord 29: , 1591–1598. |
[15] | Onofrj M , Taylor JP , Monaco D , Franciotti R , Anzellotti F , Bonanni L , Onofrj V , Thomas A ((2013) ) Visual hallucinations in PD and Lewy body dementias: Old and new hypotheses. Behav Neurol 27: , 479–93. |
[16] | Shine JM , O’Callaghan C , Halliday GM , Lewis SJ ((2014) ) Tricks of the mind: Visual hallucinations as disorders of attention. Prog Neurobiol 116: , 58–65. |
[17] | Yao N , Shek-Kwan Chang R , Cheung C , Pang S , Lau KK , Suckling J , Rowe JB , Yu K , Ka-Fung Mak H , Chua SE , Ho SL , McAlonan GM ((2014) ) The default mode network is disrupted in Parkinson’s disease with visual hallucinations. Hum Brain Mapp 35: , 5658–5666. |
[18] | Bejr-Kasem H , Pagonabarraga J , Martinez-Horta S , Sampedro F , Marin-Lahoz J , Horta-Barba A , Aracil-Bolanos I , Perez-Perez J , Angeles Boti M , Campolongo A , Izquierdo C , Pascual-Sedano B , Gomez-Anson B , Kulisevsky J ((2019) ) Disruption of the default mode network and its intrinsic functional connectivity underlies minor hallucinations in Parkinson’s disease. Mov Disord 34: , 78–86. |
[19] | Yao N , Cheung C , Pang S , Shek-kwan Chang R , Lau KK , Suckling J , Yu K , Ka-Fung Mak H , Chua SE , Ho SL , McAlonan GM ((2016) ) Multimodal MRI of the hippocampus in Parkinson’s disease with visual hallucinations. Brain Struct Funct 221: , 287–300. |
[20] | McKeith IG , Dickson DW , Lowe J , Emre M , O’Brien JT , Feldman H , Cummings J , Duda JE , Lippa C , Perry EK , Aarsland D , Arai H , Ballard CG , Boeve B , Burn DJ , Costa D , Del Ser T , Dubois B , Galasko D , Gauthier S , Goetz CG , Gomez-Tortosa E , Halliday G , Hansen LA , Hardy J , Iwatsubo T , Kalaria RN , Kaufer D , Kenny RA , Korczyn A , Kosaka K , Lee VM , Lees A , Litvan I , Londos E , Lopez OL , Minoshima S , Mizuno Y , Molina JA , Mukaetova-Ladinska EB , Pasquier F , Perry RH , Schulz JB , Trojanowski JQ , Yamada M ((2005) ) Diagnosis and management of dementia with Lewy bodies: Third report of the DLB Consortium. Neurology 65: , 1863–1872. |
[21] | McKhann GM , Knopman DS , Chertkow H , Hyman BT , Jack C. R. J , Kawas CH , Klunk WE , Koroshetz WJ , Manly JJ , Mayeux R , Mohs RC , Morris JC , Rossor MN , Scheltens P , Carrillo MC , Thies B , Weintraub S , Phelps CH ((2011) ) The diagnosis of dementia due to Alzheimer’s disease: Recommendations from the National Institute on Aging-Alzheimer’s Association workgroups on diagnostic guidelines for Alzheimer’s disease. Alzheimers Dement 7: , 263–269. |
[22] | Fahn S , Elton RL ((1987) ) Members of the Unified Parkinson’s Disease Rating Scale Development Committee: Unified Parkinson’s disease rating scale. In Recent Developments in Parkinson’s Disease, Fahn S, Marsden CD, Calne DB, Goldstein M, eds. McMillan Healthcare Information, New York, pp. 153-164. |
[23] | Ferman TJ , Smith GE , Boeve BF , Ivnik RJ , Petersen RC , Knopman D , Graff-Radford N , Parisi J , Dickson DW ((2004) ) DLB fluctuations: Specific features that reliably differentiate DLB from AD and normal aging. Neurology 62: , 181–187. |
[24] | Boeve BF , Molano JR , Ferman TJ , Smith GE , Lin SC , Bieniek K , Haidar W , Tippmann-Peikert M , Knopman DS , Graff-Radford NR , Lucas JA , Petersen RC , Silber MH ((2011) ) Validation of the Mayo Sleep Questionnaire to screen for REM sleep behavior disorder in an aging and dementia cohort. Sleep Med 12: , 445–453. |
[25] | Cummings JL ((1997) ) The Neuropsychiatric Inventory: Assessing psychopathology in dementia patients.S. Neurology 48: , 10–6. |
[26] | Spinnler H , Tognoni G ((1987) ) Standardizzazione e taratura italiana di test neuropsicologici. Ital J Neurol Sci 6: , 5–120. |
[27] | Lezak M , Howieson D , Bigler E , Tranel D ((2012) ) Neuropsychological Assessment, Oxford University Press, New York. |
[28] | Warrington EK , James M ((1991) ) The Visual Object and Space Perception Battery, Thames Valley Test Company, Bury St Edmunds. |
[29] | Caffarra P , Vezzadini G , Dieci F , Zonato F , Venneri A ((2002) ) Rey-Osterrieth complex figure: Normative values in an Italian population sample. Neurol Sci 22: , 443–447. |
[30] | Novelli G , Papagno C , Capitani E , Laiacona M , Cappa SF , Vallar G ((1986) ) Tre test clinici di memoria verbale a lungo termine. Taratura su soggetti normali. Arch Psicol Neurol Psichiatr 47: , 278–296. |
[31] | Mondini S , Mapelli D , Vestri A , Bisiacchi PS ((2003) ) Esame Neuropsicologico Breve. Una batteria di test per lo screening neuropsicologico, Raffaello Cortina Editore, Milano. |
[32] | Orsini A , Grossi D , Capitani E , Laiacona M , Papagno C , Vallar G ((1987) ) Verbal and spatial immediate memory span: Normative data from 1355 adults and 1112 children. Ital J Neurol Sci 8: , 539–548. |
[33] | Gazzaley A , Nobre AC ((2012) ) Top-down modulation: Bridging selective attention and working memory. Trends Cogn Sci 16: , 129–135. |
[34] | Nobre AC , Mesulam MM ((2014) ) Large-scale networks for attentional biases. In The Oxford Handbook of Attention, Nobre AC , Kastner S , eds. Oxford University Press, pp. 105–151. |
[35] | Asplund CL , Todd JJ , Snyder AP , Marois R ((2010) ) A central role for the lateral prefrontal cortex in goal-directed and stimulus-driven attention.. Nat Neurosci 13: , 507–512. |
[36] | Squire RF , Noudoost B , Schafer RJ , Moore T ((2013) ) Prefrontal contributions to visual selective attention. Annu Rev Neurosci 36: , 451–466. |
[37] | Kravitz DJ , Saleem KS , Baker CI , Ungerleider LG , Mishkin M ((2013) ) The ventral visual pathway: An expanded neural framework for the processing of object quality. Trends Cogn Sci 17: , 26–49. |
[38] | DiCarlo JJ , Zoccolan D , Rust NC ((2012) ) How does the brain solve visual object recognition? Neuron 73: , 415–434. |
[39] | Whitfield-Gabrieli S , Nieto-Castanon A ((2012) ) Conn: A functional connectivity toolbox for correlated and anticorrelated brain networks. Brain Connect 2: , 125–141. |
[40] | Muschelli J , Nebel MB , Caffo BS , Barber AD , Pekar JJ , Mostofsky SH ((2014) ) Reduction of motion-related artifacts in resting state fMRI using aCompCor.. Neuroimage 96: , 22–35. |
[41] | de Flores R , Mutlu J , Bejanin A , Gonneaud J , Landeau B , Tomadesso C , Mézenge F , de La Sayette V , Eustache F , Chételat G ((2017) ) Intrinsic connectivity of hippocampal subfields in normal elderly and mild cognitive impairment patients. Hum Brain Mapp 38: , 4922–4932. |
[42] | Power JD , Mitra A , Laumann TO , Snyder AZ , Schlaggar BL , Petersen SE ((2014) ) Methods to detect, characterize, and remove motion artifact in resting state fMRI. Neuroimage 84: , 320–341. |
[43] | Fox MD , Raichle ME ((2007) ) Spontaneous fluctuations in brain activity observed with functional magnetic resonance imaging. Nat Rev Neurosci 8: , 700–711. |
[44] | Kalcher K , Huf W , Boubela RN , Filzmoser P , Pezawas L , Biswal B , Kasper S , Moser E , Windischberger C ((2012) ) Fully exploratory network independent component analysis of the 1000 functional connectomes database. Front Hum Neurosci 6: , 301. |
[45] | Talairach J , Tournoux P ((1988) ) Co-planar Stereotaxic Atlas of the Human Brain, Georg Thieme Verlag Stuttgart, New York. |
[46] | Buckner RL , Andrews-Hanna JR , Schacter DL ((2008) ) The brain’s default network: Anatomy, function, and relevance to disease. Ann N Y Acad Sci 1124: , 1–38. |
[47] | Sanchez-Castaneda C , Rene R , Ramirez-Ruiz B , Campdelacreu J , Gascon J , Falcon C , Calopa M , Jauma S , Juncadella M , Junque C ((2010) ) Frontal and associative visual areas related to visual hallucinations in dementia with Lewy bodies and Parkinson’s disease with dementia. Mov Disord 25: , 615–622. |
[48] | Pezzoli S , Venneri A ((2021) ) Neuroimaging findings in patients with hallucinations: Evidence from neurodegenerative and psychiatric conditions. In PET and SPECT in Psychiatry, Springer International Publishing, Cham, pp. 555-587. |
[49] | Gallagher DA , Parkkinen L , O’Sullivan SS , Spratt A , Shah A , Davey CC , Bremner FD , Revesz T , Williams DR , Lees AJ , Schrag A ((2011) ) Testing an aetiological model of visual hallucinations in Parkinson’s disease. Brain 134: , 3299–3309. |
[50] | Teaktong T , Piggott MA , McKeith IG , Perry RH , Ballard CG , Perry EK ((2005) ) Muscarinic M2 and M4 receptors in anterior cingulate cortex: Relation to neuropsychiatric symptoms in dementia with Lewy bodies. Behav Brain Res 161: , 299–305. |
[51] | Diederich NJ , Goetz CG , Stebbins GT ((2005) ) Repeated visual hallucinations in Parkinson’s disease as disturbed external/internal perceptions: Focused review and a new integrative model. Mov Disord 20: , 130–140. |
[52] | Burghaus L , Eggers C , Timmermann L , Fink GR , Diederich NJ ((2012) ) Hallucinations in neurodegenerative diseases. CNS Neurosci Ther 18: , 149–159. |
[53] | Swann P , O’Brien JT ((2019) ) Management of visual hallucinations in dementia and Parkinson’s disease. Int Psychogeriatr 31: , 815–836. |
[54] | Wilson R , Collerton D , Freeston M , Christodoulides T , Dudley R ((2016) ) Is seeing believing? The process of change during cognitive-behavioural therapy for distressing visual hallucinations. Clin Psychol Psychother 23: , 285–297. |


