
Age-Related Chronic Diseases and Alzheimer’s Disease in Texas: A Hispanic Focused Study
Abstract
The emergence of age-related chronic diseases within the United States has led to the direct increase of Alzheimer’s disease (AD) as well as other neurological diseases which ultimately contribute to the development of dementia within the general population. To be specific, age-related chronic diseases such as cardiovascular disease, high cholesterol, diabetes, and kidney disease contribute greatly to the advancement and rapid progression of dementia. Furthermore, unmodifiable risk factors such as advancing age and genetics as well as modifiable risk factors such as socioeconomic status, educational attainment, exercise, and diet further contribute to the development of dementia. Current statistics and research show that minority populations such as Hispanic Americans in the United States face the greatest burden of dementia due to the increase in the prevalence of overall population age, predisposing genetics, age-related chronic diseases, low socioeconomic status, as well as poor lifestyle choices and habits. Additionally, Hispanic Americans living within Texas and the rural areas of West Texas face the added challenge of finding appropriate healthcare services. This article will focus upon the research associated with AD as well as the prevalence of AD within the Hispanic American population of Texas and rural West Texas. Furthermore, this article will also discuss the prevalence of age-related chronic diseases, unmodifiable risk factors, and modifiable risk factors which lead to the progression and development of AD within the Hispanic American population of the United States, Texas, and rural West Texas.
INTRODUCTION
Age-related chronic diseases are the major contributing factors for Alzheimer’s disease (AD) in the United States and elsewhere. AD is generally characterized by significant impairment to an individual’s memory and attention, as well as communication and reasoning skills.
Furthermore, racial disparities with regards to the development of age-related chronic diseases as well as various risk factors shows that the future burden of AD lies upon individuals of specific racial backgrounds such as Hispanic or Latino Americans.
In fact, current projections predict that Hispanic Americans will face the largest increase in burden with regards to AD due to their rapid population growth within the United States [1]. To be specific, the state of Texas has seen a steady increase in the population growth of Hispanic Americans; especially the counties of West Texas. As of 2018, Hispanics or Latinos comprise 40.2%of the total Texas population [2]. The purpose of this article is to determine the molecular links between age-related chronic diseases/risk factors and cognitive decline within the Hispanic American population of Texas.
Chronic diseases causing dementia
Although several diseases and conditions can cause dementia, AD is the leading cause of dementia accounting for between 60%to 80%of cases worldwide [3]. Additionally, other common causes of dementia are Lewy body disease, cerebrovascular disease, fronto-temporal lobar degeneration, Parkinson’s disease, hippocampal sclerosis, and traumatic brain injury, as well as dementia caused by mixed pathologies [3].
Symptoms of Alzheimer’s disease
The normal aging process can often start as early as the age of 30 causing a decline in the density of bones, loss of strength within muscles, loss of elasticity within skin, hardening of blood vessels and arteries, as well as changes in vision such as far-sightedness [4]. Furthermore, individuals naturally experience a decline in memory and overall cognitive ability as they age causing a drop-in processing speeds as well as finding difficulties in multitasking [4]. However, memory loss and cognitive decline causing significant disruptions within daily life cannot be classified as part of the normal aging process.
Diseases such as AD often begin to develop over 20 years earlier than when symptoms such as dementia are first seen [3]. As the brain gradually changes in such an abnormal manner within aging patients, noticeable symptoms such as memory loss, confusion, and communication issues begin to appear. Patients exhibit typical signs of AD as they are unable to complete daily tasks without assistance such as tying their shoes, forgetting recent events, having difficulty in naming close family relatives, asking repeating questions, often getting lost, and often misplacing common household items such as car keys [4].
Risk factors/age-related chronic diseases causing Alzheimer’s disease
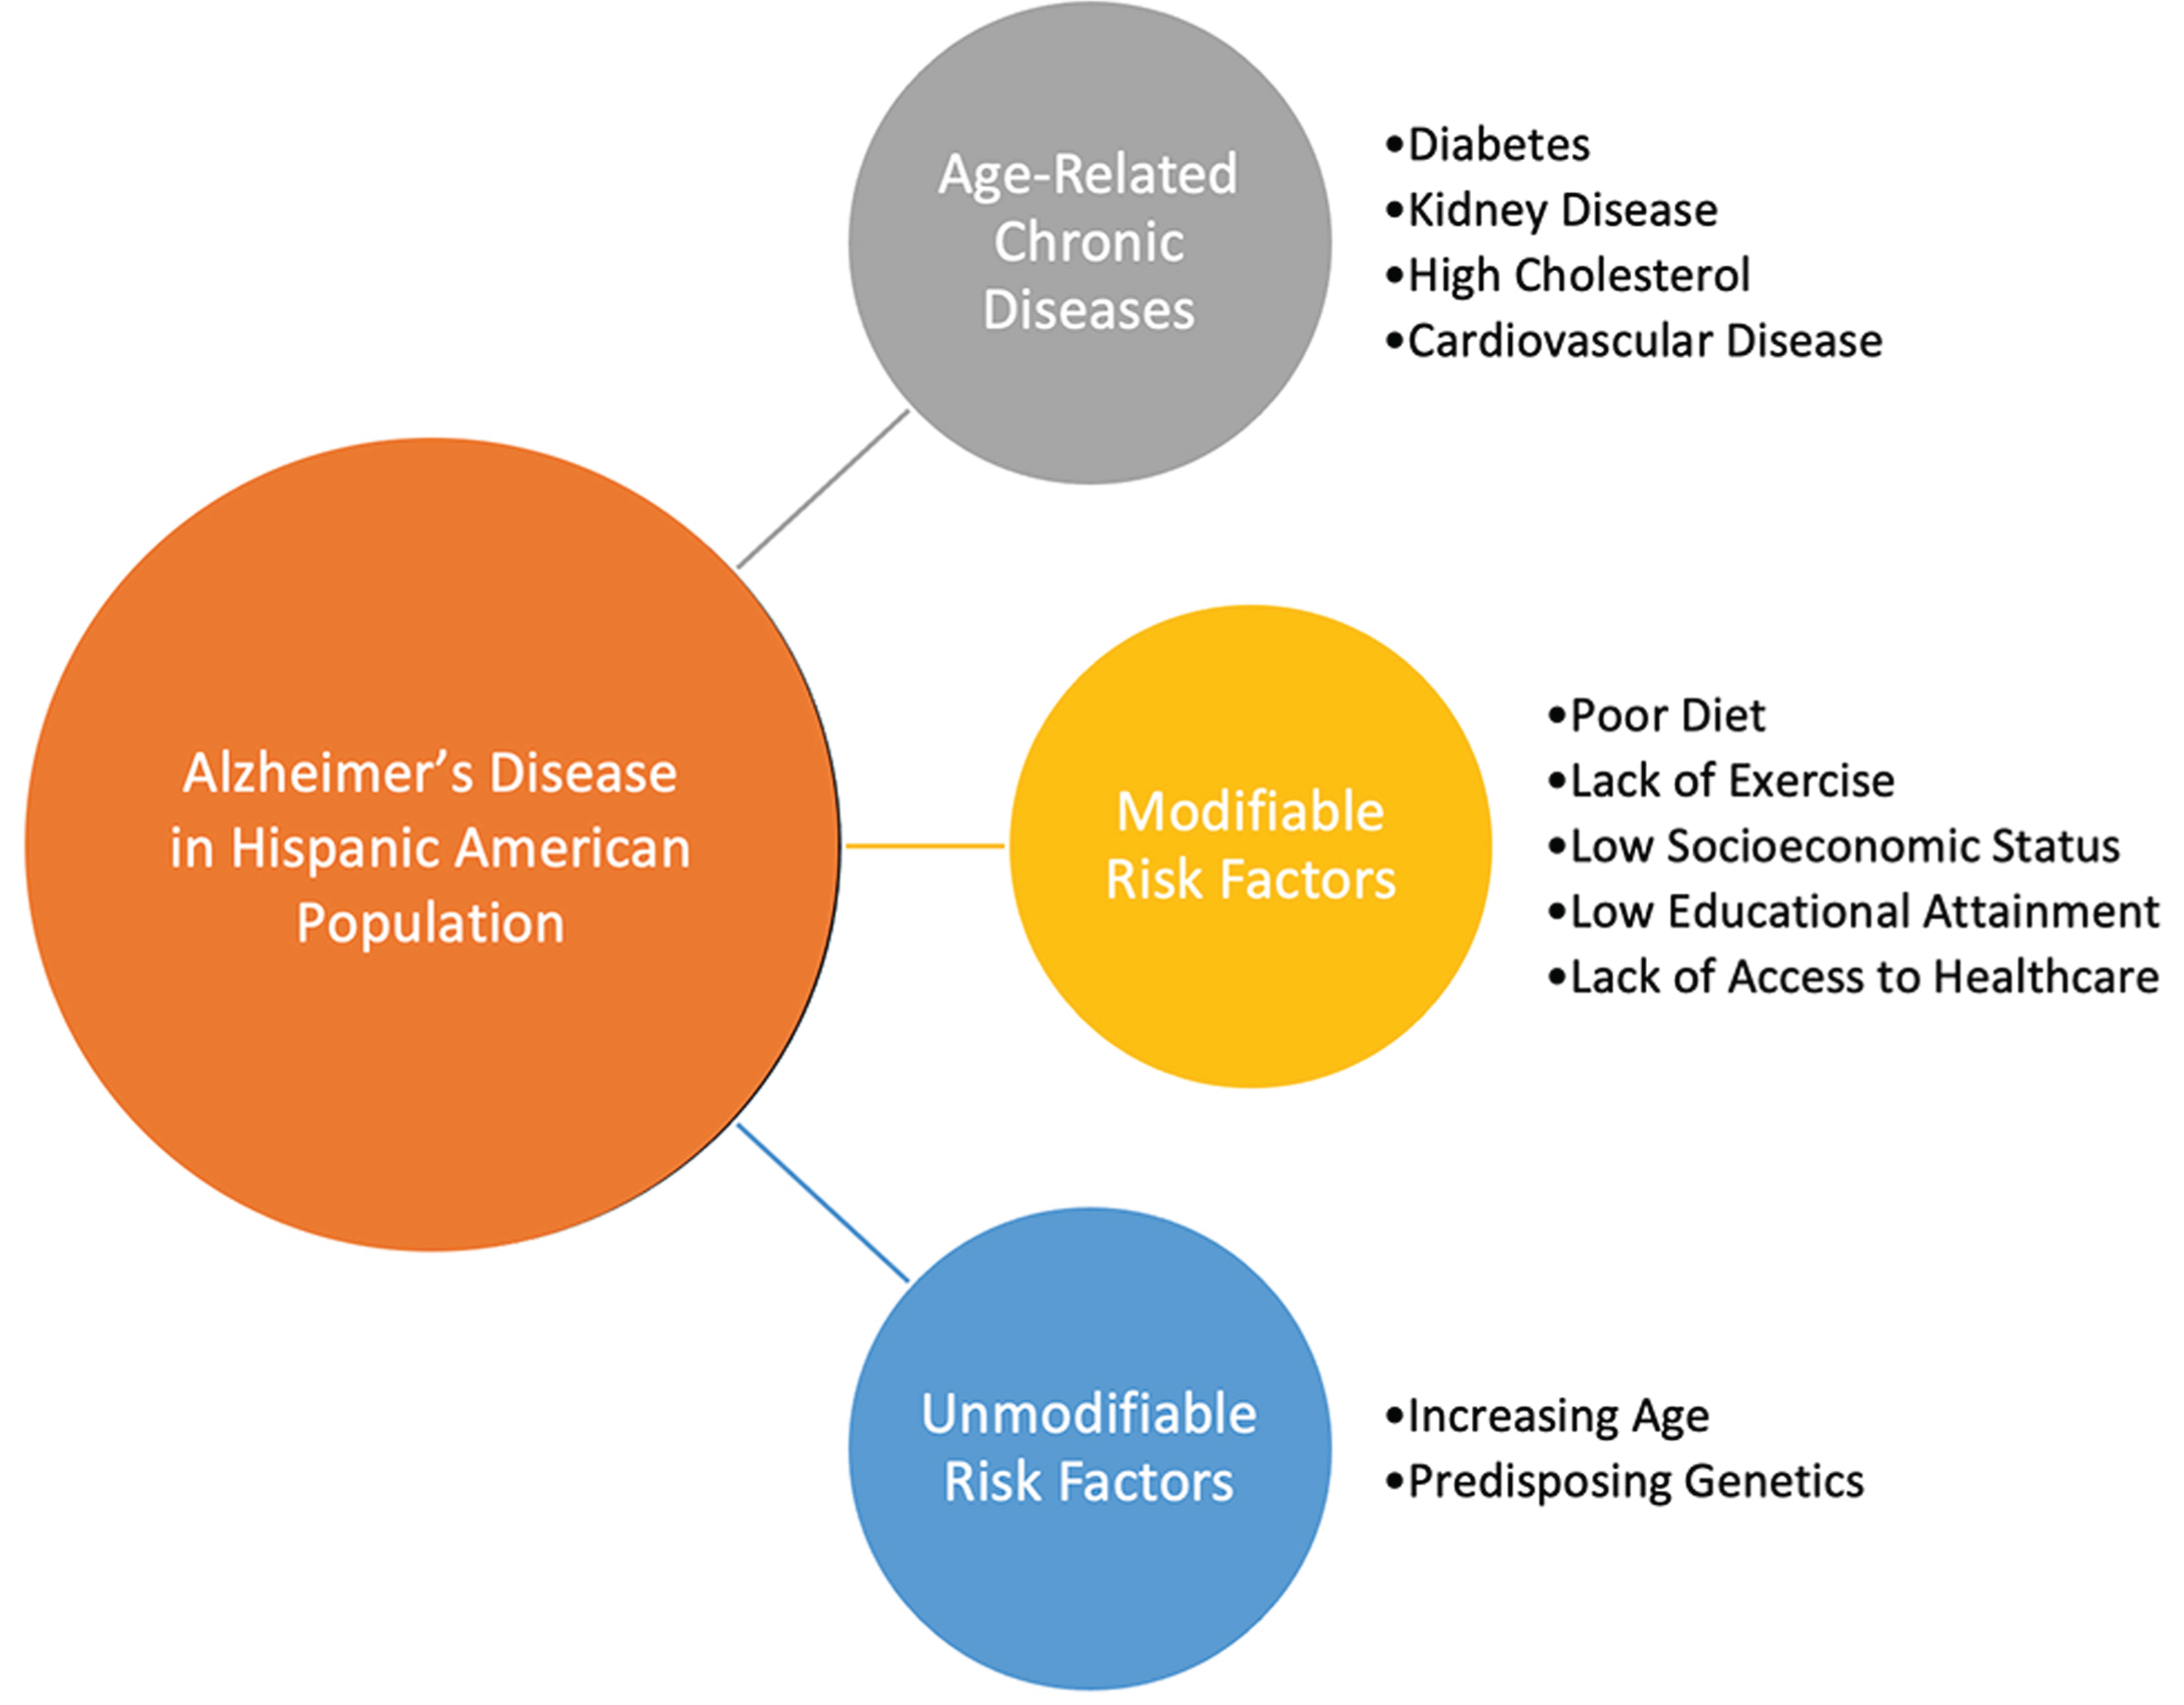
Unmodifiable risk factors with regards to the development of AD include age, genetics, family history, and disorders such as Huntington’s disease, Down’s syndrome, Creutzfeldt-Jakob disease, Gerstmann-Sträussler-Scheinker syndrome, and fatal familial insomnia [5].
Modifiable risk factors contributing to the development of AD include socioeconomic status, educa-tional attainment, exercise, and diet [5].
Age-related chronic diseases contributing to the advancement and rapid progression of AD include high cholesterol, diabetes, cardiovascular disease, kidney disease, and cognitive impairment due to brain injury [5, 6].
With regards to unmodifiable risk factors, modifiable risk factors, and age-related chronic diseases, advancing age is the most prominent and greatest risk factor in the development of AD.
Prevalence of Alzheimer’s disease in the United States
According to the 2020 Alzheimer’s Disease Facts and Figures report, data from the Chicago Health and Aging Project (CHAP) showed that approximately 5.8 million Americans age 65 and older were diagnosed with AD dementia in 2020 [3]. Furthermore, this number is projected to increase within the United States to reach 7.1 million Americans by the year 2025 and 13.8 million Americans by the year 2050 given that no significant medical developments occur with regards to curing or delaying the progression of AD [3].
Due to differences in pre-existing medical conditions, social behaviors, and socioeconomic status, minority populations such as Hispanic Americans face a higher risk of AD dementia and other dementias when compared to the non-Hispanic white population [3].
Various socioeconomic characteristics such as lower income level as well as poor education and quality of life with regards to racial minorities such as Hispanics can increase the risk of developing age-related chronic diseases causing AD [3]. Furthermore, health conditions such as diabetes, high cholesterol, atherosclerosis, cardiovascular disease, and kidney disease are more prevalent in racial minority groups leading to an increased risk in developing AD [3]. A low socioeconomic status in turn contributes to the increase in the prevalence of such health conditions thereby further increasing the risk of AD in racial minority groups.
This article specifically focuses on the prevalence of AD within the Hispanic population of Texas. Therefore, this article will further explore the historical development, physical landscape, economics, and migration patterns of Texas from 1800 onwards. Thereafter, the current demographics of the Texas population will be further analyzed.
HISTORY OF TEXAS (1800-PRESENT DAY)
The purchase of the Louisiana Territory from France in 1803 allowed the United States to gain ac-cess to land far out west where the Rio Grande River ends in modern-day New Mexico and Colorado [7]. Furthermore, by 1819, the United States agreed that the Sabine River; which partially forms the border between modern-day Louisiana and Texas, would form the eastern border of the Louisiana Territory [7]. This acquisition of land drove American colonization closer to Spanish held territory which included the majority of modern-day Texas and spanned westward to the Pacific Ocean in the year 1819 [8].
Mexico’s independence from Spain in 1821 brought upon a wave of American settlers who quickly received grants from the newly formed Mexican government to colonize the lands of Texas [7]. By 1832, the Anglo or European-descended American population rose to 20,000 [7]. In 1835, unrest between the Anglo settlers and the Mexican government led to the Texas Revolution and in April of 1836, the Republic of Texas was born as an independent nation [7]. Nine years later in 1845, the Republic of Texas was annexed as the State of Texas in the United States of America [7]. The annexation of Texas brought upon the Mexican-American War in 1846 which ultimately resulted in Mexico relinquishing its territorial claims in Texas as well as the modern-day states of New Mexico, Arizona, Nevada, Utah, California, and western Colorado [7].
During the American Civil War (1861–1865), Texas became a state under the Confederate States of America [7]. However, after the conclusion of the Civil War and readmission into the Union, there was a surge in the population and development of the Texas economy [7]. The plains of West Texas became the new home to the cattle industry while farming spread swiftly through the central areas of Texas [7]. Furthermore, the developments made in manufacturing and technology during the Civil War as well as the construction of massive railroads throughout the state bolstered the Texas economy [7]. However, the single greatest discovery of oil in 1901 opened up the state to prosperity for the next century [7].
PHYSICAL LANDSCAPE OF TEXAS
Texas is the largest state in terms of size within the contiguous United States and the second largest state in the entire nation only ranking behind Alaska [9]. Texas is located within the south-central portion of the United States and shares a vast southwest border with Mexico alongside the Rio Grande River [9]. Furthermore, its southeast border is formed by Gulf of Mexico [9].
Texas has a total surface area of 268,531 square miles which is divided into a total of 254 counties [10]. As depicted in Fig. 1, Texas is generally split up into four major physical regions: 1) the Gulf Coastal Plains lying in the east and southeast, 2) the Interior Lowlands lying central and north, 3) the Great Plains lying north, central, and west, and 4) the Basin and Range Province lying far west [11]. These major regions are further divided into smaller regions based upon climate and geography [11].
Fig. 1
Major Physical Regions and Sub-Regions of Texas. Map Created by the Texas State Historical Association [12].
![Major Physical Regions and Sub-Regions of Texas. Map Created by the Texas State Historical Association [12].](https://ip.ios.semcs.net:443/media/adr/2021/5-1/adr-5-1-adr200277/adr-5-adr200277-g001.jpg)
ECONOMY/INDUSTRY OF TEXAS
After the conclusion of the American Civil War in 1865, the economy of Texas began to flourish. Furthermore, in the late nineteenth century, the Texas economy reached new heights and became a dominate source of revenue for the United States.
Agriculture/manufacturing
Agriculture quickly became the mainstay of the Texas economy. The vast and fertile lands of Texas attracted settlements of farmers and ranchers from across the United States.
To put this growth into perspective, the 174,184 farms and ranches totaling 12,650,314 acres in 1880 increased to 352,190 farms and ranches totaling 19,576,076 acres [13]. The rise of farms directly led to the dramatic increase in the production of cotton with only 805,284 bales being produced in 1880 to 2,506,212 bales in 1900 [13]. Furthermore, the cultivation of corn surged from 29,065,172 bushels in 1880 to 109,970,350 bushels in 1900 [13].
The ranching industry experienced similar success and prosperity alongside the farming industry in Texas during the late nineteenth century. Between 1875 and 1885, Texas ranchers drove over 3,000,000 cattle north to Kansas [13]. Furthermore, major ran-chers began to raise large herds in the plains of Texas. In a mere 10 years, the count of 4,894,698 cattle and 3,651,633 sheep in 1880 skyrocketed to 8,543,635 cattle and 4,264,187 sheep in 1890 [13].
The establishment of significant railroad networks furthered the development of commercial farming and ranching [13]. A state land grant totaling over 30 million acres allowed for the 1,650 miles of railroad tracks in 1875 to grow to 9,867 miles by the year 1900 [13].
Furthermore, the improvements in transportation through railroads directly led to an increase within the business and manufacturing sector. The manufacturing industry grew from 12,000 employees producing a net value of $20 million worth of products in 1880 to 48,000 employees producing a net value of $119 million worth of products in 1990 [13].
Oil/natural gas
The development of the agriculture and manufacturing sector during the post-Civil War era brought Texas to new economic prosperity throughout the late nineteenth century.
However, it was the single discovery of oil made exactly on January 10, 1901 which allowed for Texas to rise as an economic superpower within the United States for the next century and beyond [14]. On January 10, 1901, under the supervision of a mining engineer named Captain Anthony Francis Lucas, the Lucas No. 1 well erupted into a great gusher at Spindletop located near Beaumont, Texas [14, 15]. The great gusher spewed oil for 9 days straight producing thousands of barrels of oil [14]. With this incident, the very first discovery of salt dome oil was made in the world [14]. This directly led to an intense period of exploration and drilling in Texas that would last for the next century [14].
The Texas economy quickly shifted gears and began to reap the rewards of its newly discovered natural resources. Oil production in Texas jumped from 836,039 barrels in 1900 to 4,393,658 barrels in 1901 [14]. Furthermore, the Spindletop oil field alone produced 17,421,000 barrels of oil in 1902 [14].
The early twentieth century saw petroleum and natural gas quickly replacing agriculture as the primary industry of Texas [14]. The discovery at Spindletop quickly led to the exploration and establishment of several major oil fields which spread across the length and breadth of the state [14, 16]. The continued production of oil and natural gas would lead Texas into the twenty-first century as an economic powerhouse within the United States.
DEMOGRAPHICS OF TEXAS
Current population
As of July 2018, Texas is the second highest populated state with a total population of 28,628,666 ranking right behind the state of California [2]. The projected population growth for the state of Texas is rather constant and is estimated to be approximately 29,472,300 in the year 2020 [10]. Non-Hispanic whites and Hispanic or Latino Americans account for 41.7%and 40.2%of the total population of Texas respectively as seen in Table 1 [2].
Table 1
Most recent data available. Population information from The United States Census Bureau, 2018 data [2]
| Population Breakdown by Race/Ethnicity for Texas (2018) | ||
| Race/Ethnicity | Population Percentage | Population Count |
| White alone (Not Hispanic or Latino) | 41.7% | 11,946,303 |
| Hispanic or Latino | 40.2% | 11,511,365 |
| Black or African American alone | 13.1% | 3,740,469 |
| Asian alone | 5.3% | 1,507,786 |
| Two or More Races | 2.1% | 608,914 |
| American Indian and Alaska Native alone | 1.0% | 289,959 |
Furthermore, according to the Texas Demographic Center, Hispanic or Latino Americans are projected to overtake non-Hispanic whites as the majority population group in the state of Texas by the year 2022 [17].
Urban versus rural population
Even though Texas is ranked second with regards to size and surface area, it ranks twenty-sixth in the nation with regards to population density with a mere 113 people per square mile [10, 18]. To put this into perspective, states in the northeast such as New Jersey, Rhode Island, Massachusetts, and Connecticut all have population densities which are greater than 725 people per square mile [18].
Furthermore, there is also a stark divide in population density within the state itself. Although the 180 counties of West Texas account for over 50%of the surface area, they only hold 11%of the Texas population [10]. Due to the growth of suburbs as well as strong economic and job opportunities, the population growth of Texas is continuing the “rural flight” trend [10]. As seen in Fig. 2, the population density is heavily concentrated in the counties located on the eastern side of the state [10]. To put this into perspective, the three largest cities in Texas (Houston, Dallas, and San Antonio) each have a population over 1,300,000 and are located in East Texas [10]. Additionally, according to a 2014 study, 5 of the 15 fastest growing cities in United States are in Texas and they are all located in East Texas [10].
Fig. 2
Texas Population Density by County Per Square Kilometer. Map Created by worldpopulationreview.com [10].
![Texas Population Density by County Per Square Kilometer. Map Created by worldpopulationreview.com [10].](https://ip.ios.semcs.net:443/media/adr/2021/5-1/adr-5-1-adr200277/adr-5-adr200277-g002.jpg)
Income/socioeconomic status
With regards to income and socioeconomic status, the statistics for Texas are below the United States national average. In 2018, the median household income in the United States was $60,293 while the per capita income was $32,621 [19]. The numbers for Texas in 2018 fell closely below the national average with the median household income being $59,570 and the per capita income being $30,143 [19].
A greater difference, however, was noted in the poverty level. The United States poverty percentage in 2018 was 11.8%while Texas registered a significantly higher poverty percentage of 14.9%[20]. As shown in Table 2, Hispanic or Latino Americans followed by African Americans carried the greatest burden of poverty in Texas [20]. According to the data, over 1 in 5 Hispanic Americans lived in poverty within the state of Texas in 2018 [20]. This is in stark contrast to other groups such as non-Hispanic white Americans who accounted for over 40%of the total population of Texas but still had a relatively low poverty percentage level [20]. With Hispanic Americans set to become the majority population group within Texas by the year 2022, the groups poverty percentage level is also projected to increase thereby further increasing the poverty gap between Hispanic Americans and other race/ethnic groups.
Table 2
Most recent data available. Poverty information from The United States Census Bureau, 2018 ACS 1-Year Estimates data [20]. Education information from The United States Census Bureau, 2018 ACS 1-Year Estimates data [21]
| Poverty Level and Educational Attainment by Race/Ethnicity for Texas (2018) | ||
| Race/Ethnicity | Percent Individuals Below Poverty Level | Percent Individuals Holding Bachelor’s Degree or Higher |
| White alone (Not Hispanic or Latino) | 8.5% | 39.3% |
| Hispanic or Latino | 20.9% | 15.2% |
| Black or African American alone | 19.6% | 25.0% |
| Asian alone | 10.8% | 59.9% |
| Two or More Races | 13.7% | 33.9% |
| American Indian and Alaska Native alone | 15.6% | 22.1% |
Education
As with income and poverty level, a similar pattern is seen with regards to education when Texas is compared to the United States national average. Between 2014 to 2018, the percentage of individuals aged 25 years and older who held a bachelor’s degree or higher in the United States was 31.5%while Texas fell below the national average at 29.3%[21].
As shown in Table 2, similar patterns were noted where Hispanic or Latino Americans registered for the lowest level of educational attainment when directly compared to other groups in Texas [21]. Although they accounted for over 40%of the total population of Texas in 2018, a mere 15.2%of His-panic or Latino Americans held a bachelor’s degree or higher [2, 21].
From the demographic data presented, it is clear that Hispanic or Latino Americans are dispropor-tionately disadvantaged with regards to income/socioeconomic status and educational attainment. Furthermore, both disadvantages can further feed into each other to create a vicious cycle where the argument can be made that low income/socioeconomic status leads to a lower educational attainment and vice versa.
In order to better understand how these demograp-hic factors contribute to age-related chronic diseases and cognitive decline within the Hispanic American population of Texas, the highly underserved region of rural West Texas must be further explored.
RURAL WEST TEXAS
Rural West Texas is composed of approximately 180 counties which relatively accounts for 131,000 square miles of surface area [22]. Furthermore, this area has a population of approximately 2.7 million individuals who are highly underserved with regards to healthcare services [22].
Although rural West Texas accounts for nearly 50%of the total surface area of Texas, it is only home to roughly 11%of the total Texas population [22]. Due to the extremely low population density throughout this region, it is quite difficult for the healthcare industry to thrive within such a rural environment [22].
Hispanic American population
As shown in Fig. 3, it can be clearly noted that Hispanic Americans are the majority population within the counties of rural West Texas [23]. Given that they are the majority group, Hispanic Americans therefore face the greatest burden of age-related chronic diseases and cognitive decline within this region [23]. Furthermore, as shown in Fig. 4, the percentage of uninsured Hispanic Americans is high within a vast majority of the counties across the entire state of Texas [24]. Although the percentage of Hispanic Americans who are uninsured in rural West Texas is lower than the counties of East Texas, the uninsured rate is still quite high and further contributes to the development of age-related chronic diseases and cognitive decline as these individuals are often unable to afford the healthcare services that they need.
Fig. 3
Percentage Hispanic Population by Texas Counties. Map Created by the Texas Demographic Center [23].
![Percentage Hispanic Population by Texas Counties. Map Created by the Texas Demographic Center [23].](https://ip.ios.semcs.net:443/media/adr/2021/5-1/adr-5-1-adr200277/adr-5-adr200277-g003.jpg)
Fig. 4
Percentage Hispanic Population Uninsured by Texas Counties. Map Created by the Texas Demographic Center [24].
![Percentage Hispanic Population Uninsured by Texas Counties. Map Created by the Texas Demographic Center [24].](https://ip.ios.semcs.net:443/media/adr/2021/5-1/adr-5-1-adr200277/adr-5-adr200277-g004.jpg)
GENETICS OF ALZHEIMER’S DISEASE
Previous studies and research have indicated that apolipoprotein E (APOE) ɛ4 allele inheritance carries the strongest association with the development of AD than any other genetic risk factor that has been identified [25]. Studies have indicated that in the general population, APOE ɛ4 allele inheritance increases one’s risk of developing AD by twofold [25].
Nevertheless, with regards to the Hispanic population, recent developments have indicated that the increased risk of AD associated with the inheritance of the APOE ɛ4 allele is inconsistent [26]. Several studies have suggested that APOE ɛ4 allele inheritance is strongly associated with the development of AD within the Hispanic population [25, 26]. On the other hand, studies have also indicated that the number of APOE ɛ4 allele copies inherited is not associated with the development of AD within the Hispanic population [25, 26]. The reason as to why a clear association has not been made between APOE ɛ4 allele inheritance and the development of AD within the Hispanic population is not understood [25]. However, the contrast in results from various studies could be due to various factors such as recruitment bias, sample size, population stratification, differences in environmental and cultural factors as well as differences in age distribution [25, 26].
Although the association between APOE ɛ4 allele inheritance and the development of AD within the Hispanic population is unclear, specific mutations have been identified with regards to familial cases of AD [25]. Mutations within genes such as presenilin-1, presenilin-2, amyloid precursor protein, bridging integrator 1, ephrin type-A receptor 1, progranulin, microtubule-associated protein tau, and mitochondrial cytochrome c-oxidase gene II have been strongly linked to familial cases of AD within the Hispanic population [25]. Therefore, these predisposing genetic factors ultimately indicate a higher risk of AD within the Hispanic community [25].
PREVALENCE OF AGE-RELATED CHRONIC DISEASES CAUSING ALZHEIMER’S DISEASE
With regards to concrete data, no specific research exists on the prevalence of age-related chronic diseases within the Hispanic American population of Texas and rural West Texas. However, research regarding such chronic illnesses within the Hispanic American population has been conducted on a larger scale which takes the entire United States into consideration. As stated earlier, these chronic diseases play an important role as they ultimately contribute to the advancement and rapid progression of AD.
According to the most recent report released by the American Heart Association, approximately 49.0%of Hispanic males and 42.6%of Hispanic females had cardiovascular disease between 2013 and 2016 [27]. As a result, cardiovascular disease was the leading cause of death within the Hispanic American population in the United States [27].
With regards to cholesterol, the American Heart Association reported that 39.9%of Hispanic males and 38.9%of Hispanic females had total cholesterol levels of 200 mg/dL or higher [27]. Furthermore, 13.0%of Hispanic males and 10.1%of Hispanic females had total cholesterol levels of 240 mg/dL or higher [27]. The normal or healthy level of total cholesterol for both males and females are between the range of 125 mg/dL to 200 mg/dL [28]. It was also noted that the percentage of adults voluntarily getting screened for high cholesterol between 2015–2020 was lower for Hispanic adults than non-Hispanic white, African American, and Asian adults [27].
Moving on to Hispanics and kidney disease, the National Kidney Foundation reported that Hispanics are at a greater risk for kidney disease and kidney failure than any other groups [29]. To be specific, Hispanics are one-and-a-half times more likely to have kidney failure than other groups [29]. The leading cause of kidney disease is diabetes and Hispanics are twice as likely to get diagnosed with diabetes than non-Hispanic whites [29]. Furthermore, over 1 in 4 Hispanics over the age of 45 are diagnosed with diabetes [29]. Nevertheless, the American Heart Association reported that Hispanics were less likely to meet HbA1c goals compared to non-Hispanic whites [27].
MODIFIABLE RISK FACTORS CONTRIBUTING TO AGE-RELATED CHRONIC DISEASES
Although there are several age-related chronic diseases which plague Hispanic Americans at a higher rate, various modifiable risk factors such as exercise and diet play a critical role in the development of such age-related chronic diseases. Once again, no specific research regarding such modifiable risk factors exists on the Hispanic American population of Texas and rural West Texas. However, data collected on the Hispanic American youth and adult population of the United States revealed interesting patterns.
National data revealed that Hispanics regularly do not meet the recommendations for physical activity. Furthermore, the data revealed that such a lack of physical activity often begins from a young age and this poor habit is often carried into adulthood. In 2017, the American Heart Association reported that only 33.3%of Hispanic boys and 18.1%of Hispanic girls in grades 9 to 12 were active for at least 60 minutes a day on all 7 days of the week [27]. Additionally, with regards to adults over the age of 18, only 48.7%of Hispanic males and 41.0%of Hispanic females met aerobic guidelines set by the U.S. Department of Health and Human Services in 2017 [27].
With regards to diet, similar patterns were seen where poor dietary habits were often developed from a young age. The CDC Youth Risk Behavior Survey revealed that Hispanic youths had lower vegetable, fruit, milk, and water consumption on a daily basis [30]. Furthermore, the CDC reported that Hispanic students ate or drank approximately 47 more low-nutrient calories per day than their peers [30]. The combination of lower socioeconomic status, lower income, as well as poor education leads to Hispanic Americans having more access than non-Hispanic whites to unhealthy foods and drinks [30].
The combination of poor diet and lack of physical activity, as well as various demographic factors directly leads to Hispanic Americans having one of the highest rates of overweight and obesity within the United States [27, 30]. According to the CDC, approximately 38.0%of Hispanic children are overweight or obese [30]. Furthermore, the American Heart Association revealed that 80.8%of Hispanic males and 77.8%of Hispanic females are either overweight or obese [27]. Such alarming rates of overweight and obesity directly places Hispanic Americans at a higher risk of developing age-related chronic diseases which ultimately leads to the development of AD.
COMPARISON OF ALZHEIMER’S DISEASE IN TEXAS TO THE GENERAL UNITED STATES POPULATION AND OTHER INDIVIDUAL STATES
As mentioned earlier, it is estimated that AD affects approximately 5.8 million Americans of all ages in the United States as of 2020 with over 122,000 deaths being directly attributed to AD [3]. Furthermore, 10%of individuals age 65 and older in the United States suffered from AD in 2020 [3]. To be specific however, Hispanic Americans accounted for approximately 628,000 AD cases out of the 5.8 million total AD cases in 2020 [3].
On the other hand, the general Texas population accounted for approximately 400,000 total AD cases in 2020 and 9,763 AD deaths [3]. The state of Texas ranked fourth in the number of AD cases in 2020 behind California (690,000 cases), Florida (580,000 cases), and New York (410,000 cases) [3]. However, the state of Texas ranked second in the number of AD deaths behind California (16,627 deaths) [3]. Although the states of Florida and New York recorded a greater number of AD cases in 2020, they reported a significantly lower number of AD deaths at 6,725 and 3,755 deaths respectively [3]. The disparities in these findings are not fully understood at this time. Furthermore, general data which breaks down the yearly number of AD cases and AD deaths by race/ethnicity per state is not readily available. Hence it is unknown at this time as to how many AD cases and AD deaths were attributed to the Hispanic American population in Texas during 2020.
Despite the fact that Hispanic Americans make up one of the largest ethnic groups in the United States and Texas, the amount of research conducted on AD within this population is very little.
PREVALENCE AND FUTURE OUTLOOK OF ALZHEIMER’S DISEASE IN THE HISPANIC POPULATION
The combined results of recent statistical data and research regarding AD further reveals the disadvantages that Hispanic Americans face within the United States. This data can then be utilized to project the burden of AD that the Hispanic population of Texas and rural West Texas will face in the future as no specific data regarding AD exists for these specific regions as of now.
As mentioned earlier, aging is the greatest risk factor for the development of AD. The CDC reports that by the year 2060, the number of Hispanic Americans age 65 and above is expected to quadruple [31]. Additionally, the Pew Research Center reports that the Hispanic population has grown faster in the southern region of the United States than any other region since 2010 [32]. In Texas specifically, it is projected that Hispanic Americans will become the majority population group as early as the year 2022 [17]. The cumulative effects of an increasing Hispanic population as well as an increasing elderly Hispanic population within the United States means that a greater proportion of Hispanic Americans will face AD in the future years to come. As seen in Fig. 5, it is estimated that by the year 2060, the number of Hispanic Americans with AD will increase approximately nine-fold reaching up to 3.5 million [25, 33].
Fig. 5
Projection of Hispanic Americans with Alzheimer’s Disease Through 2060 by Age Category (In Millions). Chart Created by UsAgainstAlzheimer’s [33].
![Projection of Hispanic Americans with Alzheimer’s Disease Through 2060 by Age Category (In Millions). Chart Created by UsAgainstAlzheimer’s [33].](https://ip.ios.semcs.net:443/media/adr/2021/5-1/adr-5-1-adr200277/adr-5-adr200277-g005.jpg)
Generally speaking, studies show that elderly Hispanics are one-and-a-half times more likely to have AD than elderly non-Hispanic whites [3]. Data collected from Medicare beneficiaries revealed that 12.2%of Hispanics age 65 and older live with AD compared to 10.3%of non-Hispanic white individuals age 65 and older living with AD within the United States [3]. In the state of Texas, approximately 400,000 individuals age 65 and older were diagnosed with AD in 2020 and this number is projected to increase by 22.5%in 2025 reaching up to 490,000 individuals with Hispanic Americans facing the greatest burden [3].
With an increasing population age, predisposing genetics, higher rates of age-related chronic diseases, poor social behaviors and habits, and the combination of low socioeconomic status and education; minority populations such as Hispanic Americans face a higher risk of AD than any other racial/ethnic groups. As shown in Fig. 6, Hispanic Americans are at a disadvantage from multiple angles and these various factors build upon each other to have a cumulative effect ultimately placing the enormous burden of AD upon the Hispanic American community. Hence the implementation of culturally appropriate strategies which focus upon the importance of preventing the development of modifiable risk factors and age-related chronic diseases can be crucial to reducing the increased risk that the Hispanic community faces with regards to the development of AD.
Fig. 6
Summary of the Disadvantages Faced by Hispanic Americans in Overcoming the Burden of Alzheimer’s Disease.
CONCLUSIONS
The prevalence of AD and related neurological diseases is increasing within the United States and Texas due to the detrimental effects of various age-related chronic diseases, demographic factors, as well as poor lifestyle choices. This issue is quite predominant within the Hispanic population of Texas and rural West Texas to be specific. The combining effects of increasing population age, predisposing genetics, age-related chronic diseases (cardiovascular disease, high cholesterol, kidney disease, and diabetes), low socioeconomic status, low income, low educational attainment, poor lifestyle choices, as well as limited access to healthcare resources places the Hispanic American community at an extremely high risk to the future development of AD and related neurological diseases.
Although it is difficult to provide a solution to certain factors such as socioeconomic status and income; steps can be taken to provide education to the population regarding lifestyle changes that can be made in order to significantly reduce the risk of developing age-related chronic diseases which lead to the future development of AD. Furthermore, a sincere effort spearheaded by the Texas government as well as major hospital systems throughout the state should be made in order to provide equitable and adequate healthcare resources to the counties of rural West Texas.
These challenges can be addressed by 1) developing community outreach centers within rural West Texas which inform Hispanic Americans about the molecular links between age-related chronic diseases and AD and encourage them to make healthy lifestyle choices, 2) developing and implementing educational curriculums for high school, collegiate, and graduate institutions which focus upon teaching the biology of age-related chronic diseases and how they contribute to the development of AD, 3) investing in the construction of research facilities in rural West Texas which focus upon AD as well as methods to delay the onset or progression of AD in the elderly, 4) creating a statewide database which keeps accurate data and tracks the residents of Texas who are diagnosed with AD or are at risk for the development of AD, and 5) allocating state and private-based funding for the construction of hospitals, clinics, as well as other healthcare facilities within rural West Texas.
CONFLICT OF INTEREST
The authors have no conflict of interest to report.
ACKNOWLEDGMENTS
The research and relevant findings presented in this article was supported by the National Institutes of Health (NIH) grants AG042178, AG047812, NS105473, AG060767, AG069333 and AG066347.
REFERENCES
[1] | Centers for Disease Control and Prevention, U.S. burden of Alzheimer’s disease, related dementias to double by 2060, https://www.cdc.gov/media/releases/2018/p0920-alzheimers-burden-double-2060.html, Last updated September 20, 2018, Accessed on July 10, 2020. |
[2] | The United States Census Bureau, State Population by Characteristics: 2010-2019, https://www.census.gov/data/tables/time-series/demo/popest/2010s-state-detail.html, Last updated June 22, 2020, Accessed on July 10, 2020. |
[3] | Alzheimer’s Association ((2020) ) 2020 Alzheimer’s disease facts and figures. Alzheimers Dement 15: , 5–25. |
[4] | Centers for Disease Control and Prevention, The Truth About Aging and Dementia, https://www.cdc.gov/aging/publications/features/dementia-not-normal-aging.html, Last updated August 17, 2020, Accessed on August 20, 2020. |
[5] | Stanford Health Care (SHC) - Stanford Medical Center, Dementia Risk Factors, https://stanfordhealthcare.org/medical-conditions/brain-and-nerves/dementia/risk-factors.html, Last updated September 11, 2017, Accessed on July 10, 2020. |
[6] | Alzheimer’s Disease and Dementia, Causes and Risk Factors for Alzheimer’s Disease. https://www.alz.org/alzheimers-dementia/what-is-alzheimers/causes-and-risk-factors, Accessed on July 10, 2020. |
[7] | Wooster RA , Reddick DC , McNamee GL (2020), Encyclopædia Britannica, Texas, https://www.britannica.com/place/Texas-state/History, Last updated July 16, 2020, Accessed on August 10, 2020. |
[8] | Parkes HB , Griffin EC , Meyer MC , Bernstein MD , Cline HF , Palerm A , Willey GR (2020), Encyclopædia Britannica, Mexico, https://www.britannica.com/place/Mexico/Expansion-of-Spanish-rule, Last updated October 02, 2020. Accessed on October 07, 2020. |
[9] | Wooster RA , Reddick DC , McNamee GL (2020), Encyclopædia Britannica, Texas, https://www.britannica.com/place/Texas-state, Last updated July 16, 2020, Accessed on August 10, 2020. |
[10] | Texas Population 2020 (Demographics, Maps, Graphs), Texas Population 2020, https://worldpopulationreview.com/states/texas-population, Accessed on August 10, 2020. |
[11] | Butler DR (2019), Texas Almanac, Physical Regions of Texas, https://texasalmanac.com/topics/environment/physical-regions-texas, Last updated October 4, 2019, Accessed on August 10, 2020. |
[12] | Texas Almanac, https://texasalmanac.com/sites/default/files/images/maps/PhysicalReg.pdf, Accessed on August 10, 2020. |
[13] | Barr A , Texas State Historical Association Handbook of Texas, Late Nineteenth-Century Texas, https://tshaonline.org/handbook/online/articles/npl01, Accessed on September 13, 2020. |
[14] | Texas Almanac, History of Oil Discoveries in Texas, https://texasalmanac.com/topics/business/history-oil-discoveries-texas, Accessed on September 13, 2020. |
[15] | Ramos MG (2017), Texas Almanac, Oil and Texas, A Cultural History, https://texasalmanac.com/topics/business/oil-and-texas-cultural-history, Last updated November 29, 2017, Accessed on September 19, 2020. |
[16] | Texas boom, Eno Petroleum Corporation, https://ontrack-media.net/gateway/ss7/g_ss7m5l2s4.html, Accessed on January 17, 2021. |
[17] | Texas Demographic Center, Texas Population Projections 2010 to 2050, https://demographics.texas.gov/Resources/publications/2019/20190128_PopProjectionsBrief.pdf, Accessed on September 19, 2020. |
[18] | World Population Review, United States by Density 2020, https://worldpopulationreview.com/state-rankings/state-densities, Accessed on September 21, 2020. |
[19] | United States Census Bureau, U.S. Census Bureau Quick-Facts: United States; Texas, https://www.census.gov/quickfacts/fact/table/US,TX/EDU685218, Accessed on September 21, 2020. |
[20] | United States Census Bureau, Poverty Status in the Past 12 Months, https://data.census.gov/cedsci/table?tid=ACSST1Y2018.S1701&g=0400000US48&hidePreview=true&moe=false, Accessed on September 21, 2020. |
[21] | United States Census Bureau, Educational Attainment, https://data.census.gov/cedsci/table?tid=ACSST1Y2018.S1501&g=0400000US48&hidePreview=true&moe=false, Accessed on September 21, 2020. |
[22] | Reddy PH ((2019) ) Lifestyle and risk factors of dementia in rural West Texas. J Alzheimers Dis 72: , S1–S10. |
[23] | Texas Demographic Center, Demographic Characteristics, Trends, and Projections for Texas and the Rio GrandeValley, https://demographics.texas.gov/Resources/Presentations/OSD/2019/2019_02_22_UTRGVLegislativeInterns.pdf, Accessed on September 21, 2020. |
[24] | Texas Demographic Center, The Increasing Hispanic Population in Texas: Health Care and Access to Care Issues, https://demographics.texas.gov/Resources/Presentations/OSD/2016/2016_10_06_TheInauguralHispanicTransplantSymposium.pdf, Accessed on September 21, 2020. |
[25] | Vega IE , Cabrera LY , Wygant CM , Velez-Ortiz D , Counts SE (2017) Alzheimer’s disease in the Latino community:Intersection of genetics and social determinants of health. J Alzheimers Dis 58: , 979–992. |
[26] | Reitz C , Mayeux R ((2014) ) Genetics of Alzheimer’s disease in Caribbean Hispanic and African American populations. Biol Psychiatry 75: , 534–541. |
[27] | Virani SS , Alonso A , Benjamin EJ , Bittencourt MS , Callaway CW , Carson AP , Chamberlain AM , Chang AR , Cheng S , Delling FN , Djousse L , Elkind MSV , Ferguson JF , Fornage M , Kissela BM , Knutson KL , Kwan TW , Lackland DT , Lichtman JH , Longenecker CT , Loop MS , Lutsey PL , Martin SS , Stokes A , Tirschwell DL , VanWagner LB , Tsao CW , Matsushita K , Moran AE , Mussolino ME , Rosamond WD , Roth GA , Sampson UKA , Satou GM , Schroeder EB , Shah SH , Shay CM , Spartano NL , on behalf of the American Heart Association Council on Epidemiology and Prevention Statistics Committee and Stroke Statistics Subcommittee. Heart disease and stroke statistics—2020 update:Areport fromthe American Heart Association, https://www.heart.org/-/media/files/about-us/statistics/hispanics-ucm_505483.pdf?la=en, Circulation. 2020;141: e1–e458. doi: 10.1161/CIR.0000000000000757 |
[28] | MedlinePlus, Cholesterol Levels: What You Need to Know, https://medlineplus.gov/cholesterollevelswhatyouneedtoknow.html, Last updated October 02, 2020, Accessed on October 07, 2020. |
[29] | National Kidney Foundation, Hispanics and Kidney Disease, https://www.kidney.org/atoz/content/hispanics-kd, Last updated August 31, 2020, Accessed on October 07, 2020. |
[30] | Cantu-Pawlik S (2018), Salud America, CDC: Latino Kids Have Worse Diets than Their Peers, https://salud-america.org/cdc-report-latino-youth-have-worse-diets-than-their-peers/, Last updated October 17, 2018, Accessed on October 07, 2020. |
[31] | National Institute on Aging, Studies explore Alzheimer’s risk factors, biomarkers in Latinos, https://www.nia.nih.gov/news/studies-explore-alzheimers-risk-factors-biomarkers-latinos, Last updated December 12, 2018, Accessed on November 01, 2019. |
[32] | Pew Research Center, U.S. Hispanic population surpassed 60 million in 2019, but growth has slowed, https://www.pewresearch.org/fact-tank/2020/07/07/u-s-hispanic-population-surpassed-60-million-in-2019-but-growth-has-slowed/, Last updated July 7, 2020, Accessed on November 01, 2020. |
[33] | Wu S , Vega WA , Resendez J , Jin Latinos H and Alzheimer’s disease: New numbers behind the crisis. [Accessed December 3, 2016]; Projection of the costs for US Latinos living with Alzheimer’s disease through 2060.http://www.usagainstalzheimers.org/sites/default/files/Latinos-and-AD_USC_UsA2-Impact-Report.pdf. |


