
Obesity and Brain Vulnerability in Normal and Abnormal Aging: A Multimodal MRI Study
Abstract
Background:
How the relationship between obesity and MRI-defined neural properties varies across distinct stages of cognitive impairment due to Alzheimer’s disease is unclear.
Objective:
We used multimodal neuroimaging to clarify this relationship.
Methods:
Scans were acquired from 47 patients clinically diagnosed with mild Alzheimer’s disease dementia, 68 patients with mild cognitive impairment, and 57 cognitively healthy individuals. Voxel-wise associations were run between maps of gray matter volume, white matter integrity, and cerebral blood flow, and global/visceral obesity.
Results:
Negative associations were found in cognitively healthy individuals between obesity and white matter integrity and cerebral blood flow of temporo-parietal regions. In mild cognitive impairment, negative associations emerged in frontal, temporal, and brainstem regions. In mild dementia, a positive association was found between obesity and gray matter volume around the right temporoparietal junction.
Conclusion:
Obesity might contribute toward neural tissue vulnerability in cognitively healthy individuals and mild cognitive impairment, while a healthy weight in mild Alzheimer’s disease dementia could help preserve brain structure in the presence of age and disease-related weight loss.
INTRODUCTION
Obesity significantly increases vascular risk and has been identified as a risk factor for Alzheimer’s disease (AD) [1]. The potential involvement of vascular factors in AD etiology has received increased scrutiny [2]. A recent meta-analysis on 1.3 million individuals showed that higher body mass index (BMI) is associated with increased dementia risk when measured earlier than 20 years before diagnosis [3]. Earlier evidence had also suggested that risk is greater for midlife obesity than old age obesity [4]. This could be due to the pathological cascade of obesity-mediated mechanisms that can induce neuroinflammation, blood-brain barrier breakdown, production of reactive oxygen species, and microglial activation [5]. These mechanisms can promote the build-up of AD pathology while simultaneously accelerating neuronal damage. Overall, the available evidence suggests common neurodegenerative pathways between the two conditions [5]. However, meta-analytical evidence also shows that higher BMI is associated with lower dementia risk when measured later than 10 years before diagnosis [3]. Body fat-mediated mechanisms may modify, therefore, AD risk across disease stages differently.
Although obesity has an overall negative effect on neural health, cerebral constituents have a variable susceptibility to AD and obesity. Patients in the early stages of AD typically present with reduced cerebral blood flow (CBF) in the posteromedial parietal areas, reduced white matter integrity (WMI) and neuronal loss in mediotemporal areas, extending to other brain regions with disease progression [6]. In contrast, obesity seems to affect frontal brain regions among older individuals, i.e., > 65 years of age, while temporal areas are more vulnerable to obesity-related damage in midlife, i.e., > 40 years of age [7, 8]. Since both AD and obesity can significantly alter cerebral constituents, that an interaction between these pathologies can exacerbate the above effects is not surprising, with higher age playing a catalytic role [1]. Although the prevalence of both obesity and AD rates have risen in the past decades, few studies have explored the association between brain structure, perfusion and obesity in patients across the clinical spectrum of AD, and the evidence is largely restricted to brain volume [9, 10]. It is, therefore, a clinical priority to examine the link between obesity, a prevalent but modifiable risk factor [1, 11], and brain properties.
Research has shown conflicting evidence surrounding the effects of obesity on the brain across various stages of life and disease [1, 3]. Given the uncertainty, a characterization of the neural phenotype associated with obesity that can be stratified using cognitive status would be extremely valuable in the management of patient body-fat composition to reduce damage to the brain, in clinical settings. The present study investigated the relationship between structural and perfusion brain parameters and indices of obesity across three diagnostic groups: patients with mild AD dementia (ADD), patients with mild cognitive impairment (MCI), and cognitively healthy individuals (CH). By analyzing multimodal brain images containing information about grey matter volume (GMV), WMI, and CBF, a holistic approach was used to examine the interplay between obesity and cognitive staging in the cognitively healthy to AD dementia continuum.
MATERIALS AND METHODS
Participants
Datasets from 172 participants recruited as part of the VPH-DARE@IT EU-funded project coordinated by the University of Sheffield, Department of Neuroscience http://www.vph-dare.eu/ were included in this study. Experimental procedures complied with the declaration of Helsinki and written informed consent was obtained from all participants. Ethical approval was obtained from the Yorkshire and Humber Regional Ethics Committee, Ref No: 12/YH/0474 for the participants from the Sheffield (UK) cohort and from the ethics committee of the Northern Savonia Hospital District for the participants from Kuopio (Finland). The participants were divided into patients with a clinical diagnosis of ADD (n = 47)1, patients with a diagnosis of MCI (n = 68) and CH (n = 57), following established clinical diagnostic procedures. Specifically, diagnoses of ADD or MCI due to AD were reached based on clinical criteria [12, 13]. Diagnoses were formulated following a consensus among a senior neurologist, a senior clinical neuropsychologist and a neuroradiologist. In addition, MCI patients also had clinical follow ups at regular intervals for at least 4 years to confirm their diagnosis. Cerebrospinal fluid biomarkers were available for a proportion of the sample (14 ADD and 20 MCI).
The presence of MRI abnormalities, any major medical condition or any etiological entity that could account for the presence of cognitive impairment were exclusion criteria (see [14] for a comprehensive list). All demographic characteristics, including specific details on age ranges and averages, are listed in Table 1.
Table 1
Demographic characteristics and cognitive profiles of the three diagnostic groups
| Variable | ADD (n = 47) | MCI (n = 68) | CH (n = 57) | Statistic |
| Demographic variables | ||||
| Parametric tests$ | mean (SD) | mean (SD) | mean (SD) | F |
| Age (y) | 68.09 (9.88) | 68.56 (9.45) | 66.51 (11.11) | 0.67 |
| Education%x (y) | 10.91 (3.26) | 11.78 (3.74) | 14.44 (3.29) | 15.22 |
| WC (cm) | 92.11 (10.95) | 96.08 (14.39) | 96.32 (13.33) | 1.69 |
| GMV&%x (ml) | 569.30 (77.26) | 605.37 (74.34) | 636.19 (70.40) | 11.52*** |
| CSF&x (ml) | 525.83 (153.46) | 465.92 (130.73) | 412.66 (134.89) | 6.68** |
| TIV (ml) | 1491.17 (163.41) | 1454.14 (143.54) | 1495.70 (173.28) | 1.24 |
| Non-Parametric tests+ | median (IQR) | median (IQR) | median (IQR) | H |
| MMSE&%x | 21 (17 –25) | 26 (25 –28) | 28 (27 –29) | 69.11*** |
| BMIx (kg/m2) | 24.82 (22.86 –28.37) | 26.76 (23.40 –26.76) | 27.54 (24.94 –31.01) | 7.87* |
| WMV (ml) | 416.04 (369.51 –416.04) | 407.54 (370.71 –446.86) | 430.34 (381.55 –469.56) | 4.08 |
| WMH volume (ml)%x | 3.53 (1.83 –7.79) | 6.64 (0.64 –7.86) | 3.02 (0.22 –3.55) | 11.44** |
| Chi square tests# | n | n | n | χ2 |
| Males/Females | 29/18 | 31/37 | 26/31 | 3.54 |
| APOE genotype: ɛ2ɛ2/ɛ2ɛ3/ɛ3ɛ3/ɛ4ɛ2/ɛ4ɛ3/ɛ4ɛ4 | 0/6/13/0/16/11 | 0/3/28/5/28/4 | 0/7/38/2/9/1 | 36.96*** |
| APOE ɛ4 non-carriers/ɛ4 carriers | 19/27 | 31/37 | 45/12 | 19.15*** |
| Centre (UK/Finland) | 24/23 | 29/39 | 38/19 | 7.27* |
| Neuropsychological measures | ||||
| Parametric tests$ | mean (SD) | mean (SD) | mean (SD) | F |
| Category Fluency&%x | 12.63 (6.50) | 17.85 (5.54) | 21.54 (5.28) | 30.83*** |
| Non- Parametric tests+ | M (IQR) | M (IQR) | M (IQR) | H |
| Prose Memory-Immediate recall&%x | 6 (2.25 –9) | 10 (8 –13) | 17 (14 –19) | 84.41*** |
| Prose Memory-Delayed recall&%x | 4 (2 –8) | 11 (6 –14) | 18 (16 –20) | 96.54*** |
| Similarities%x | 13.5 (8 –21) | 17 (12 –23) | 25 (21.5 –27.5) | 45.37*** |
| Letter Fluency&%x | 22 (13 –32) | 28.5 (20 –44) | 45 (32.5 –55) | 45.01*** |
| Digit Span-Forward | 6 (5 –8) | 6 (5 –8) | 7 (5 –8) | 0.72 |
| Digit Span-Backward%x | 4 (3 –5) | 5 (3.75 –6) | 5 (4 –6) | 19.08*** |
| Boston Naming Test%x | 12 (10–14) | 13 (12 –14) | 15 (14 –15) | 47.32*** |
| Stroop task-error%x | 2.5 (0 –14.5) | 0.50 (0 –2) | 0 (0 –0) | 29.47*** |
*Comparison is significant at 0.05 level (two tailed); **Comparison is significant at 0.01 level (two tailed); ***Comparison is significant at 0.001 level (two tailed); Normality of data was tested using the Shapiro-Wilk Test of Normality. F, F-statistic; H, H-statistic; IQR, Interquartile range; SD, standard deviation; χ2, Chi-square statistic; $A one-way ANOVA was run for data that were normally distributed. The F-statistic is reported. +Non-parametric Kruskal-Wallis H tests were run for data that were not normally distributed. The H statistic is reported. &Significant difference between ADD and MCI; %Significant difference between MCI and CH; xSignificant difference between CH and ADD; ADD, Alzheimer’s disease dementia; MCI, mild cognitive impairment; CH, cognitively healthy; BMI, body mass index; WC, waist circumference; GMV, gray matter volume; MMSE, Mini-Mental State Examination.
Indices of obesity
Anthropometric measurements were obtained to calculate obesity indices. Quetelet’s index was used to calculate BMI (kg/m2) as an index of global obesity. Waist circumference in centimeters (WC) was used as an index of abdominal obesity [15, 16].
MRI acquisition and preprocessing
The imaging protocol included a T1-weighted and a T2-weighted anatomical image, a diffusion-weighted image for the analysis of WMI and a pseudo-continuous arterial spin labelling (pCASL) sequence for the modelling of blood flow. All images were acquired using a Philips Ingenia 3T scanner. T1-weighted images were acquired with the following specifications: voxel size 0.94×0.94×1.00 mm3, matrix size 256×256 mm2, repetition time 8.2 ms, echo time 3.84 ms, flip angle 8° field of view 240×240×170 mm. T2-weighted images features were as follows: voxel size 0.532×0.532×4.000 mm3, matrix size 432×432 mm2, repetition time 3000 ms, echo time 80 ms, flip angle 8° field of view 230×140×35 mm. Diffusion-weighted images followed instead these technical parameters: 32 directions, voxel size 2.5 mm3 isotropic, matrix size 96×94 mm2, repetition time 3 s, echo time 98 ms, flip angle 90°, field of view 240×120×240 mm. Finally, pCASL imaging acquisition consisted of two consecutive sequences: an M0 estimation tag, followed by a pseudo-continuous ASL sequence: voxel size 3×3×8 mm3 with inter-slice 1 mm gap, matrix size 80×80 mm2, repetition time 4 s, echo time 14 s, flip angle 40° field of view 240×135×240 mm, number of label/control pairs 73, labelling gap 20 s, labelling duration 1.65 s, post-labelling delay time 1.525 s.
Gray matter volume
T1-weighted scans were preprocessed and analyzed using voxel-based morphometry within the Statistical Parametric Mapping (SPM) 12 software (The Wellcome Centre for Human Neuroimaging, London, UK) running in MATLAB (Mathworks Inc., Natick, MA, USA). A tissue-class probabilistic segmentation was initially run to separate gray matter (GM), white matter (WM), and cerebrospinal fluid for each scan within its native space, according to the most updated version of the standard voxel-based morphometry procedures [17]. GM maps were then registered and normalized to the standard template for “European” brains and were then smoothed with an 8 mm full-width at half-maximum Gaussian kernel.
White matter integrity
Fractional anisotropy (FA) of diffusion-weighted images was selected as the WMI index. FA provides information about the motional anisotropy of water molecules and is the most widely used measure of WMI [18, 19]. Each image was preprocessed using the Functional Magnetic Resonance Imaging of the Brain (FMRIB) Software Library v5.0.8 (FSL, http://www.fmrib.ox.ac.uk/fsl). The FSL Diffusion Toolbox was used to correct for eddy currents and motion artifacts. A fractional-intensity threshold of 0.5 was applied to the resultant image in order to strip the skull and generate a binary mask using the Brain Extraction Tool. This mask was fitted with the diffusion-tensor model at each voxel to calculate FA maps. Tract-based spatial statistics [20] was then applied, where FA maps were initially eroded to eliminate outliers. The most representative FA map was then identified and used as a reference for non-linear registration. Subsequent to the affine alignment to the standard Montreal Neurological Institute (MNI) space, an average of the FA maps was computed. The resultant ‘average’ FA map was then skeletonized and each FA image was projected onto the skeleton.
Cerebral blood flow
pCASL sequences were acquired to obtain maps of CBF. pCASL images are usually obtained by applying multiple radiofrequency pulses to reduce the duration of application of the pulse in a continuous arterial-spin-labelling sequence, successfully combining the advantages of continuous and pulsed arterial-spin-labelling sequences [21]. The current acquisition included a pCASL image and an M0 estimation image, which contain the information about the CBF quantification and calibration, respectively. The M0 and pCASL images were used to generate CBF maps in Nordic Ice (https://www.nordicneurolab.com/en/HelpAll/nordicICE). The maps were sequentially co-registered with the T2-weighted and then the T1-weighted images to maximize inter-tissue demarcation and to increase the accuracy of the anatomical correspondence of the CBF signal. Images were then modified to increase the signal from the brain parenchyma and to reduce the contribution to the signal from the cerebrospinal fluid. Therefore, only voxels with CBF values enclosing more than 50%of GM and WM were included in the analysis. Next, a partial volume correction (PVC) was performed under the assumption that the perfusion of WM accounts for 40%of the perfusion of GM [22], as illustrated below for voxel “i”.
The resultant partial volume corrected images were then normalized using the standard template for “European” brains in SPM 12 and smoothed using a 10×10×12 full-width at half-maximum Gaussian kernel.
Statistical analysis
Multiple regression models were run using GMV, WMI, and CBF maps to examine the associations between these brain parameters and obesity. For all three diagnostic groups, independent models were run using the indices of obesity (BMI and WC) as predictors, controlling for the confounding effects of age, the Mini-Mental State Examination (MMSE) score as an index of clinical severity, total intracranial volume as an index of brain reserve [23], recruitment centre and sex. The MMSE was not included in the analysis of cognitively healthy participants given its limited numerical variability, i.e., a variance of just 2.6 (Table 1). All analyses were carried out voxel-by-voxel and statistical thresholds were applied. Voxel-based-morphometry models were thresholded at a cluster-forming threshold of p < 0.001. The analysis of skeletonized FA maps was run using the FMRIB Software Library (v5.0.8) using the ‘randomise’ command and implementing 5000 permutations via a threshold-free cluster enhancement. Finally, given the smaller size of the acquisition matrix for CBF maps, a more lenient cluster-forming threshold of p < 0.01 was used for these analyses. For all inferential models, only results surviving a family-wise error-corrected value of p < 0.05 at the cluster level were considered significant.
To contextualize the pattern of findings in relation to clinical profiles, we extracted the average signal from clusters showing significant results and correlated it with scores on neuropsychological tests. All results surviving at p < 0.01 were considered as significant. The neuropsychological tests measured lexical abilities (Boston Naming test), semantic memory (Category Fluency test), executive function (Letter Fluency test, Digit Span test - backwards, Stroop Error Interference test), long-term memory (Prose Memory test - immediate and delayed recall), short-term memory (Digit Span test- forward), and verbal reasoning (the Similarities subtest of the Wechsler Adult Intelligence Scale) [14, 24].
RESULTS
There were no significant group differences in age, total intracranial volume, and WC. Cognitively healthy participants ranked the highest when it came to measurements of years of education, MMSE, BMI, and GMV, while MCI and ADD patients ranked lower than the cognitively healthy participants, in that order (Table 1). With respect to cognitive profiles, all groups had significant differences between their scores with ADD patients scoring the lowest, cognitively healthy participants performing the highest and MCI patients having an intermediate performance (Table 1), with the exception of the Digit Span test –forward.
Body mass index
In ADD patients, there was a positive association between BMI and GMV in right posterolateral areas, particularly around the temporoparietal junction. This cluster spanned across the junction and a large proportion of the occipital lobe that tapered down anteriorly toward the hippocampus (Table 2). No significant associations were found between BMI and measures of WMI. Although the results from the CBF analysis did not reach significance, the trend of association observed in these analyses overlapped with the areas exhibiting BMI-related positive associations with GMV.
Table 2
Regions showing associations between obesity and GMV across the three diagnostic groups
| Voxels (Cluster extent) | Cluster level pFWE | Brain region | Side | Z-score | MNI coordinates | ||
| x | y | z | |||||
| AD: Positive correlation | |||||||
| BMI | |||||||
| 16986 | <0.001 | Superior parietal lobule (BA 7) | R | 5.64 | 40 | –58 | 42 |
| Cuneus (BA 18) | R | 4.91 | 22 | –88 | 18 | ||
| Middle temporal gyrus (BA 39) | R | 4.76 | 57 | –44 | 6 | ||
| Superior temporal gyrus (BA 22) | R | 4.76 | 44 | –33 | 10 | ||
| 634 | 0.04 | Superior temporal gyrus (BA 39) | L | 3.89 | –46 | –61 | 22 |
| Superior temporal gyrus (BA 39) | L | 3.83 | –50 | –53 | 28 | ||
| WC | |||||||
| 13284 | <0.001 | Superior parietal lobule (BA 7) | R | 6.11 | 42 | –58 | 39 |
| Superior parietal lobule (BA 7) | L | 4.70 | –24 | –62 | 47 | ||
| Superior occipital gyrus (BA 19) | R | 4.39 | 38 | –73 | 22 | ||
| Superior temporal gyrus (BA 22) | R | 4.16 | 55 | –48 | 8 | ||
| 905 | 0.01 | Inferior frontal gyrus (BA 44) | R | 4.30 | 44 | 6 | 11 |
| Insula (BA 13) | R | 4.08 | 32 | –13 | 17 | ||
| 787 | 0.02 | Cerebellum: Posterior lobe | R | 4.05 | 28 | –52 | –40 |
| MCI: Negative correlation | |||||||
| BMI | |||||||
| 2618 | <0.001 | Middle occipital gyrus (BA 19) | R | 4.85 | 50 | –80 | –1 |
| 1318 | 0.001 | Cerebellum: Posterior lobe | R | 4.76 | 48 | –75 | –23 |
| 870 | 0.01 | Inferior frontal gyrus (BA 47) | L | 4.67 | –50 | 36 | –15 |
| 2545 | <0.001 | Inferior occipital gyrus (BA 19) | L | 4.42 | –39 | –91 | –6 |
| 639 | 0.04 | Inferior frontal gyrus (BA 47) | R | 4.32 | 50 | 26 | –15 |
| WC | |||||||
| 1178 | 0.002 | Inferior frontal gyrus (BA 47) | L | 5.29 | –48 | 32 | –16 |
| 4662 | <0.001 | Inferior occipital gyrus (BA 18) | R | 4.77 | 48 | –82 | –3 |
| Cerebellum: Posterior lobe | R | 4.71 | 40 | –74 | –40 | ||
| 615 | 0.04 | Cerebellum: Posterior lobe | L | 3.88 | –40 | –77 | –33 |
| 611 | 0.04 | Inferior frontal gyrus (BA 47) | R | 4.50 | 53 | 27 | –11 |
| 1872 | <0.001 | Inferior occipital gyrus (BA 18) | L | 4.49 | –38 | –91 | –8 |
| 1478 | 0.001 | Precentral gyrus (BA 6) | L | 4.24 | –57 | 4 | 20 |
| CH: Negative correlation | |||||||
| BMI | |||||||
| 1701 | <0.001 | Thalamus: Ventral anterior nucleus | L | 3.60 | –12 | –12 | 18 |
| 1029 | 0.001 | Posterior lobe of the cerebellum | R | 4.43 | 36 | –81 | –35 |
| 543 | 0.02 | Posterior lobe of the cerebellum | L | 4.27 | –36 | –81 | –38 |
| 1015 | 0.001 | Anterior cingulate gyrus (BA 24) | L | 4.36 | –3 | 16 | 21 |
| 631 | 0.01 | Inferior occipital gyrus (BA 18) | L | 4.34 | –38 | –91 | –9 |
| 1218 | <0.001 | Inferior frontal gyrus (BA 47) | R | 3.94 | 50 | 40 | –15 |
| 1386 | <0.001 | Insula | L | 4.19 | –36 | 14 | 1 |
| 879 | 0.002 | Inferior frontal gyrus (BA 47) | L | 3.92 | –46 | 44 | –16 |
| 793 | <0.001 | Inferior occipital gyrus (BA 18) | R | 3.89 | 39 | –91 | –6 |
| WC | |||||||
| 1506 | <0.001 | Inferior occipital gyrus (BA 19) | L | 4.40 | –36 | –92 | –9 |
| 1451 | <0.001 | Thalamus | L | 4.05 | –12 | –11 | 19 |
| 704 | 0.01 | Anterior cingulate gyrus (BA 24) | L | 4.48 | –2 | 17 | 19 |
| 821 | 0.003 | Insula (BA 13) | L | 4.28 | –42 | –10 | –5 |
ADD, Alzheimer’s disease dementia; BMI, body mass index; GMV, gray matter volume; CH, cognitively healthy; L, left; MCI, mild cognitive impairment; MNI, Montreal Neurological Institute; pFWE, Family-wise error corrected p value; R, Right; WC, waist circumference.
In the MCI patients, higher BMI was associated with lower GMV in the occipital and frontal lobes bilaterally, and the right cerebellum and with lower CBF in the brainstem, frontoparietal and medial temporal areas (Tables 2 and 3). Left frontal volumes showed a positive correlation with performance on the Letter Fluency test. No significant associations were found between BMI and measures of WMI.
Table 3
Regions showing a negative association between obesity and CBF across CH and MCI groups
| Voxels (Cluster extent) | Cluster level pFWE | Brain region | Side | Z-score | MNI coordinates | ||
| x | y | z | |||||
| MCI: Negative correlation | |||||||
| BMI | |||||||
| 4529 | <0.001 | Inferior fronto-occipital fasciculus | L | 3.77 | –28 | 39 | 11 |
| Middle frontal gyrus (BA 6) | L | 3.39 | –34 | 5 | 27 | ||
| Corticospinal tract | L | 3.67 | –22 | –23 | 45 | ||
| 2555 | 0.002 | Midbrain | L | 3.68 | –6 | –28 | –9 |
| Inferior longitudinal fasciculus/ Parahippocampal gyrus | L | 3.52 | –42 | –32 | –9 | ||
| 3266 | <0.001 | Superior longitudinal fasciculus | R | 3.42 | 22 | 0 | 42 |
| Precuneus (BA 39) | R | 3.32 | 28 | –65 | 29 | ||
| WC | |||||||
| 5626 | <0.001 | Hippocampus | R | 5.23 | 36 | –11 | –16 |
| Thalamus | R | 3.77 | 12 | –16 | –4 | ||
| Hippocampus | L | 3.52 | –28 | –22 | –11 | ||
| 10179 | <0.001 | Anterior cingulate gyrus (BA 32) | L | 4.64 | –20 | 31 | 28 |
| Corticospinal tracts | L | 4.44 | –22 | –23 | 47 | ||
| Middle frontal gyrus (BA 6) | R | 3.75 | 28 | –13 | 49 | ||
| Superior longitudinal fasciculus | R | 3.53 | 36 | –43 | 33 | ||
| CH: Negative correlation | |||||||
| BMI | |||||||
| 2365 | 0.01 | Superior longitudinal fasciculus | L | 3.23 | –26 | –14 | 36 |
| Parahippocampal gyrus (BA 36) | L | 2.83 | –24 | –47 | 2 | ||
| 2546 | 0.01 | Superior longitudinal fasciculus | R | 3.33 | 22 | –8 | 39 |
| Parahippocampal gyrus (BA 36) | R | 2.84 | 42 | –31 | –2 | ||
| WC | |||||||
| 1879 | 0.04 | Posterior lobe of the cerebellum | L | 4.55 | –10 | –54 | –39 |
| Posterior lobe of the cerebellum | R | 2.70 | 20 | –70 | –34 | ||
| 13608 | <0.001 | Superior longitudinal fasciculus | R | 3.73 | 32 | –47 | 30 |
| Superior longitudinal fasciculus | L | 3.72 | –28 | –51 | 30 | ||
| Superior longitudinal fasciculus | L | 3.56 | –42 | –33 | 0 | ||
| Superior longitudinal fasciculus | R | 3.43 | 42 | –39 | 6 | ||
BMI, body mass index; CBF, cerebral blood flow; CH, cognitively healthy; L, left; MCI, mild cognitive impairment; MNI, Montreal Neurological Institute; pFWE, Family-wise error corrected p value; R, right; WC, waist circumference.
In the cognitively healthy participants, GMV was negatively associated with BMI in inferior frontal, occipital, subcortical, and cerebellar regions, bilaterally (Table 2). Additionally, higher BMI was associated with lower FA in the superior longitudinal fasciculus, fronto-occipital tracts, optic radiations, middle cerebellar peduncle, cingulum, parahippocampal/hippocampal fibers and fornix (Table 4). BMI was also negatively associated with CBF in the bilateral fronto-occipital tracts and in the superior portions of the parahippocampal fibers (Table 3). Regional signal extracted from the three analyses revealed a positive correlation with performance on the Category Fluency test, Prose Memory (immediate and delayed recall) and the Similarities test.
Table 4
Regions showing a negative association between obesity and FA in CH
| Voxels (Cluster extent) | Cluster level pFWE | Brain region | Side | Z-score | MNI coordinates | ||
| x | y | z | |||||
| BMI | |||||||
| 54045 | 0.001 | Fornix | L | 7.75 | –28 | –27 | –4 |
| Fornix | L | 7.13 | –28 | –29 | –1 | ||
| Superior longitudinal fasciculus/ Inferior fronto-occipital fasciculus | L | 6.90 | –37 | 34 | 6 | ||
| Cingulum | R | 6.66 | 9 | –5 | 34 | ||
| Inferior fronto-occipital fasciculus | R | 6.62 | 26 | 29 | –10 | ||
| Superior longitudinal fasciculus | L | 6.62 | 36 | 14 | 18 | ||
| WC | |||||||
| 55438 | 0.001 | Anterior thalamic radiation | L | 7.49 | –28 | –30 | 0 |
| Inferior fronto-occipital fasciculus | R | 7.47 | 26 | 29 | –10 | ||
| Fornix | L | 7.05 | –29 | –26 | –3 | ||
| Cingulum | R | 6.92 | 9 | –5 | 34 | ||
| Inferior fronto-occipital fasciculus | L | 6.85 | –35 | –55 | 0 | ||
| Inferior fronto-occipital fasciculus | L | 6.80 | –37 | 34 | 6 | ||
BMI, body mass index; FA, fractional anisotropy; CH, cognitively healthy; L, left; MNI, Montreal Neurological Institute; pFWE, Family-wise error corrected p value; R, right; WC, waist circumference.
Waist circumference
In ADD patients, WC was positively associated with GMV in the areas around the temporoparietal junction and in the right cerebellar hemisphere. No significant associations were found between WC and measures of WMI. Similar to BMI, the pattern of association observed in the CBF analysis overlapped with the areas exhibiting WC-related positive associations with GMV (Table 2, Fig. 1).
In the MCI group, a negative association was found between WC and GMV in bilateral inferior frontal, occipital, and cerebellar regions (Table 2, Fig. 1). A positive association was found between the extracted GMV signal from these regions and performance on the Letter Fluency and Digit Span - forward tests. No significant associations were found between WC and measures of WMI. A negative association was found between WC and CBF in the bilateral hippocampi, parts of the brainstem and frontoparietal regions, concentrated more in the right hemisphere (Table 4, Fig. 1).
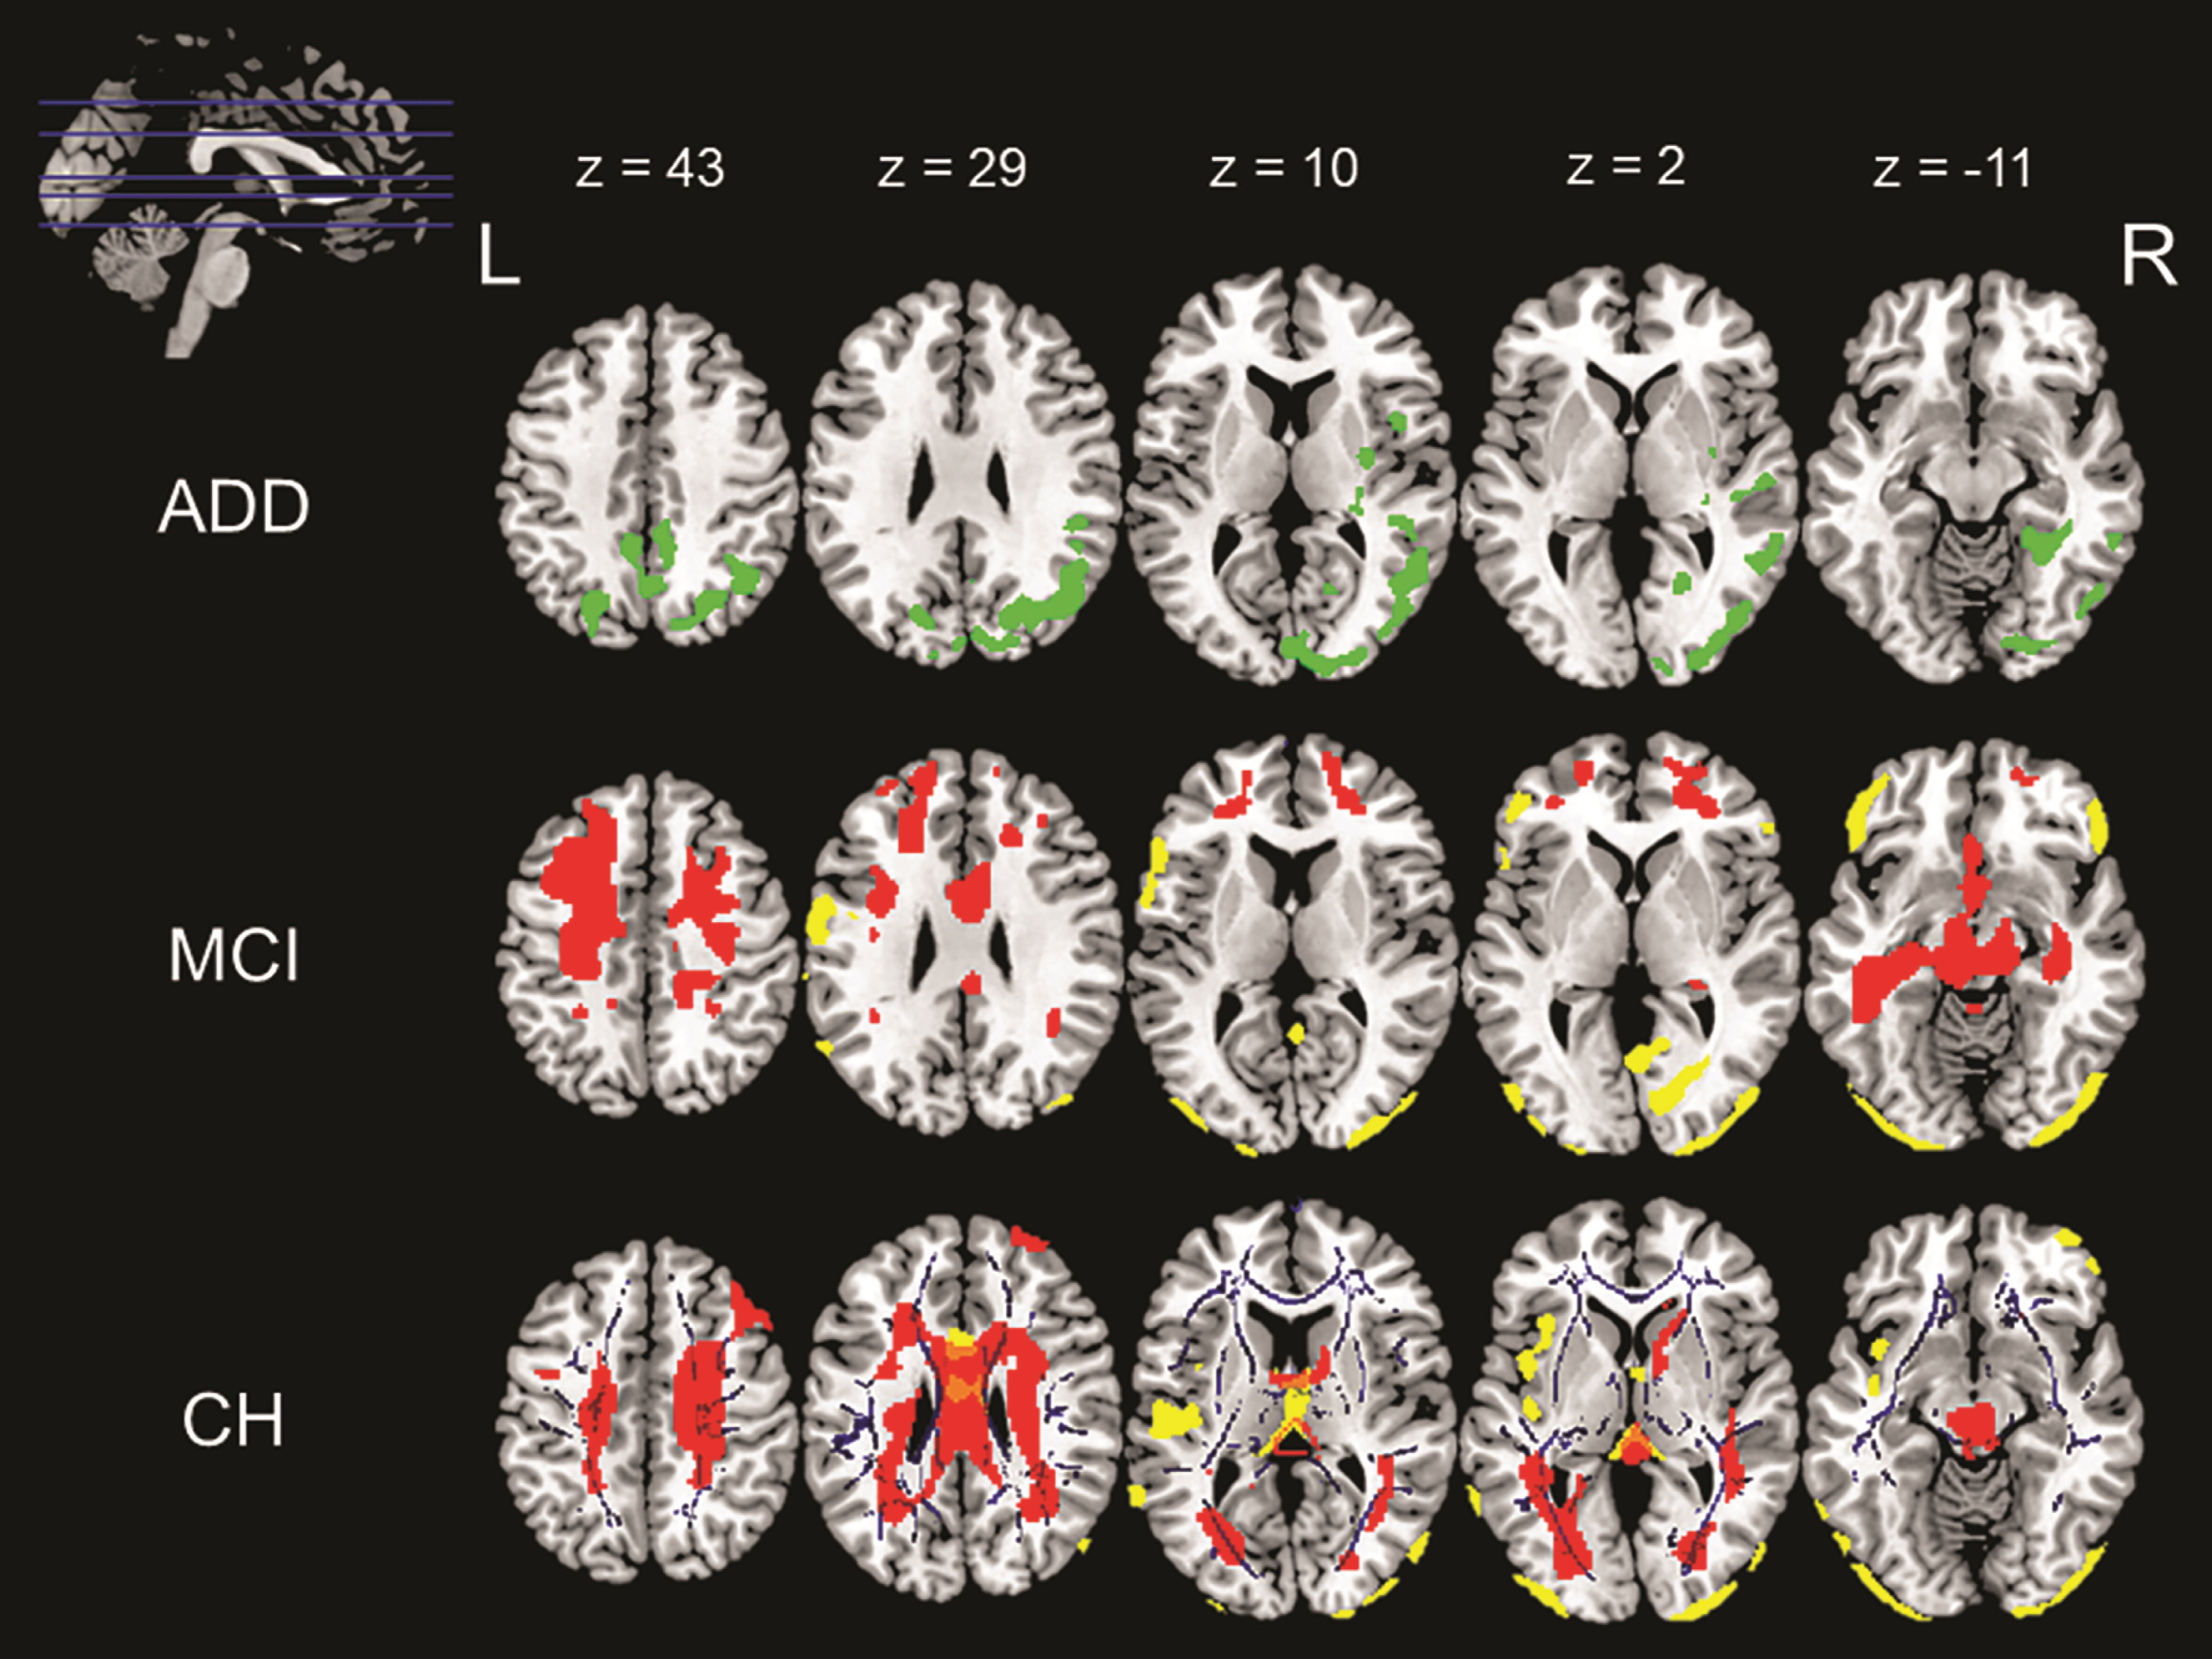
Fig. 1
Associations with waist circumference across the three diagnostic groups namely ADD, MCI, and CH. The above image shows various positive and negative correlations between different neuroimaging indices and waist circumference. The image in the top left corner shows the axial slices chosen in the image and the MNI coordinates for these slices are listed in the same row. The slices going from top to bottom have been arranged from left to right across the three rows of images. These MNI co-ordinates also correspond to the column that they represent. First row (ADD): The green overlay represents a positive correlation found between GMV and WC in ADD patients. Middle row (MCI): The yellow overlay represents a negative correlation between GMV and WC and the red overlay represents a negative correlation between CBF and WC in MCI patients. Last row (CH): The yellow overlay represents a negative correlation between GMV and WC, the red overlay represents a negative correlation between CBF and WC and the blue overlay represents a negative correlation between WMI and WC in CH.
In the cognitively healthy group, there was a negative correlation between GMV and WC in the bilateral occipital lobes, cerebellum and midline structures (Table 2, Fig. 1). Tracts showing a negative association between FA and WC included the inferior fronto-occipital fasciculus, cingulum, fornix, and anterior thalamic radiations (Table 4, Fig. 1). Cognitively healthy participants also showed a negative association between CBF and WC in the bilateral frontal lobes that extended backward toward the parietal lobe, joining at the midline and then extending inferiorly into the temporal lobes. This negative association was also observed in the cerebellum and parts of the brainstem (Table 3, Fig. 1). Positive correlations were found between regional neural signals and performance on the Category Fluency test, Prose Memory-immediate and delayed recall and the Similarities test.
DISCUSSION
In this study, evidence from multimodal neuroimaging suggests variable associations between indices of obesity and the brain across three diagnostic statuses. The three groups had substantial baseline differences in the distribution of their obesity indices. The distribution of the cognitively healthy group fell in part within the obese range; that of the MCI group fell in the overweight range, while the distribution of the ADD group was within the normal range. Group differences may be among the drivers of the associations found. These differences could be a factor of age and disease-related weight alterations, where the trends of body mass distributions seen in this study are consistent with the existing literature [3, 25]. The findings indicate that higher indices of obesity within the overweight and obese ranges are linked to reduced brain structure and CBF parameters in cognitively healthy participants and MCI patients. In contrast, higher indices of body mass within the normal range are linked to higher retention of GMV parameters in ADD patients. This trend could be linked to downstream mechanisms resulting from circulating hormones associated with body fat (including sex hormones), age-related changes in body fat accumulation and the interaction between AD and obesity [26–28].
Negative associations between GMV and obesity in the MCI and cognitively healthy groups were identified in frontal, occipital, cerebellar and deep brain regions, albeit the negative associations found in the MCI group were less extensive than those in the cognitively healthy group. This almost entirely replicated the results of a meta-analysis on GM and obesity [29]. The only discrepancy was in the occipital lobe, where a negative association was found between obesity and GMV in this region in cognitively healthy participants and MCI patients in our study, as opposed to a positive correlation [29]. The GM areas showing negative associations in the cognitively healthy group are connected by WM tracts that exhibit a negative association between WMI and indices of obesity [30]. Past literature has indicated that a loss of structural connectivity can lead to reductions in GM density [31]. If this inference in WMI were causal, WM disconnections could explain the negative associations found within the GM. Additionally, obesity has an element of metabolic dysfunction that fosters systemic inflammatory processes that, as evidence from other neurological conditions shows, are detrimental to both GM and WM [e.g. 32]. The mechanisms and directionality of the relationship between GM and WM damage still need additional study and clarification. A negative association between WMI and obesity in the corpus callosum, superior longitudinal fasciculus, inferior fronto-occipital fasciculus, fornix, and cingulum was found only in the cognitively healthy sample. This is in accordance with the previous literature [19, 33, 34]. The absence of a negative association between obesity indices and WMI in MCI patients might be due to lower obesity rates seen in this group, which could explain the more attenuated neural effects mediated by obesity compared to cognitively healthy participants.
These findings suggest that being on the higher end of the obesity spectrum may be detrimental to brain structure. Our findings also indicate that there might be a resilient effect of higher body-fat store within the normal weight range in advanced disease stages, as reflected by the positive correlation between GMV and normal body mass in ADD patients. A parallel pattern of association was also found in the analysis of CBF in the same regions (although it did not survive the predetermined threshold of significance), suggesting that a relative preservation of vascular function might be contributing to the associations found with GMV. Furthermore, the association could be attributed to the availability of sufficient resources to cope with neural damage as a result of retaining a healthy body mass in later disease stages. Therefore, in the presence of natural age and disease-related weight loss, having a healthy weight and better nutrition could help preserve brain structure [19, 35, 36], or even mitigate disease progression as suggested by nutrition interventional studies in mice [37, 38]. This could imply that interventions that aid ADD patients to maintain a healthy body weight could help alleviate some of the neural susceptibility caused by body-mass reductions clinically observed in later disease stages [25]. Our study is limited by its cross-sectional design, and we can only speculate about how body-fat composition can modulate disease onset. Since the ADD group fell within the normal weight range, we cannot draw inferences on the effects of being overweight or obese in the dementia stage. This is a limitation for most studies due to the pattern of weight loss usually seen in disease and aging. Future longitudinal studies can potentially offer complementary evidence.
Considerable variation across the three groups was found in the associations with CBF. In cognitively healthy participants, a negative association with CBF was mainly seen in WM regions, specifically in the fronto-occipital tracts, corpus callosum and the posterior ends of the cingulum, most of which also showed negative correlations with WMI. In MCI patients, the negative association with CBF was concentrated in the frontal lobe and extended to the brainstem, cerebellum, and medial temporal lobes. Of note, in the present study the MCI group showed more extensive negative associations with CBF in the left hemisphere, while loss of function among obese cognitively healthy participants seems to be more right lateralized [39]. This discrepancy might be due to the asymmetry of AD-related neurodegeneration, which is harsher in the left hemisphere [40]. The right-sided association in MCI might result from an interaction between AD and the right-sided susceptibility to obesity [41]. In addition, some regions displaying negative associations with obesity are in close proximity to cerebral watershed sites, making them particularly vulnerable to the effects of vascular pathology [42, 43]. The more inferior areas correspond to the system involved in reward behavior, which are often affected in obese individuals [44]. Of these, the mediotemporal lobes and certain brainstem nuclei are centrally affected in AD as well [45]. Therefore, down-regulation of neural parameters in MCI patients might manifest as an amalgamation of detriments resulting from the presence of AD pathology and being overweight. This may accelerate the progression rate toward ADD.
The negative associations with CBF that were found in the groups of cognitively healthy participants and MCI patients in the parietal lobe are particularly of note. This territory acts as a central hub that integrates several brain regions, making it a region with high metabolic demands and, as a consequence, particularly prone to damage [46–48]. Furthermore, the parietal lobe is supplied by the terminating branches of the posterior and middle cerebral arteries, making the medial parietal areas more vulnerable to hypoperfusion as terminating arterial branches are more susceptible to ischemic damage than major arteries [42, 43, 49]. Such a combination of factors confers a certain susceptibility to the parietal lobe to the effects of metabolic conditions such as obesity.
Past research has consistently indicated that medioparietal hypometabolism and hypoperfusion are among the earliest indicators of AD [6]. Disruptions in medioparietal function possibly reflecting a deficit of input from medial temporal areas often leads to a ‘disconnection’ between areas of the default mode network, a phenomenon commonly seen in AD, even in early disease stages [50]. In the present study, negatively correlated maps of CBF and WMI extended from temporal to medioparietal areas and even some anterior areas in cognitively healthy participants. This pattern partly resembled the map of ‘disconnection’ typically seen in AD. This convergence again points toward common pathophysiological pathways between AD and obesity. Additionally, the down-regulation of cerebral indices can reduce the amount of brain tissue available for compensatory mechanisms, thus accelerating progression from cognitively healthy to MCI, or even from MCI to ADD [51]. Therefore, this finding in the cognitively healthy sample could potentially offer an explanation for how obesity could promote pathophysiological cascades, fostering greater damage to cerebral constituents.
The areas exhibiting negative correlations with obesity among cognitively healthy participants, were associated with worse performance on tests of memory and reasoning. This indicates that damage to brain areas with high metabolic demands (e.g., the medioparietal lobe) could result in the manifestation of cognitive symptoms in the presence of metabolic disorders as those often associated with obesity. The fact that these areas of cognition are also affected early on in AD offers an explanation for how obesity may contribute toward AD risk [6]. Although a similar association was found between regional neural indices and obesity, correlations with test performance in the MCI group revealed disruptions in performance on tasks of executive functioning. This finding might reflect the presence of greater variability in scores in executive tasks at the MCI level, since the slope of decline in executive function is not as steep as the slope of decline in memory and reasoning tasks, allowing statistical effects to emerge. This might also reflect obesity-mediated effects, as loss of executive function has been established as a cognitive deficit associated with obesity [7].
In conclusion, our study found diminished CBF, structural, and cognitive measures associated with obesity in cognitively healthy participants that resemble neural changes typically induced by AD, while those in MCI patients resemble changes typically associated with obesity and AD. This could point toward susceptible pathways that are shared between AD and obesity and toward the initiation of a pathological cascade pushing the brain over the threshold for potential progression from cognitively healthy to MCI and from MCI to ADD [51]. However, this relationship may change in individuals in later disease stages, where having a higher body weight remaining within the normal range may contribute to preservation of brain structure in the presence of aging and disease related insults. It is noteworthy that these results were consistent across the two different anthropometric indices of obesity.
These findings are of central importance for the characterization and management of patients with AD or, more generally, patients referred to a neurological examination. Although obesity is mentioned among the risk factors for AD, its exact effects on the brain are still undetermined. These findings highlight multi-component mechanisms associated with obesity, involving diagnosis-dependent properties of GMV, WMI, and CBF. This evidence emphasizes the urgent need to introduce early interventions that advocate lifestyle assessment and remediation across the lifespan. It also highlights the importance of primary prevention strategies based on modulation of lifestyle factors such as obesity in midlife as an effective strategy to achieve a reduction of AD related dementia with advancing age [52].
CONFLICT OF INTEREST
HS reports consultation fees from ACImmune, and MERCK and Novo Nordisk not related to this work. AV has received consultation fees from MERCK and Biogen not related to this work. The other authors have no conflicts of interest to report.
ACKNOWLEDGMENTS
The authors thank Kevin Teh from the University of Sheffield for his methodological support to CBF images preprocessing. The authors also thank Simon Bell for his assistance with some of the participants’ clinical assessments. This is a summary of independent research carried out at the NIHR Sheffield Biomedical Research Centre (Translational Neuroscience). The views expressed are those of the authors and not necessarily those of the NHS, the NIHR or the Department of Health. The support of the NIHR Clinical Research Facility –Sheffield Teaching Hospital is also acknowledged.
This study was supported by the European Union Seventh Framework Programme (FP7/2007 –2013) under grant agreement no. 601055, VPH-DARE@IT to IDW, HS and AV). MDM and AV also acknowledge the support from Neurocare. MDD is supported by a Faculty of Medicine, Dentistry and Health PhD scholarship.
REFERENCES
[1] | Alford S , Patel D , Perakakis N , Mantzoros CS ((2018) ) Obesity as a risk factor for Alzheimer’s disease: Weighing the evidence. Obes Rev 19: , 269–280. |
[2] | Santos CY , Snyder PJ , Wu WC , Zhang M , Echeverria A , Alber J ((2017) ) Pathophysiologic relationship between Alzheimer’s disease, cerebrovascular disease, and cardiovascular risk: A review and synthesis. Alzheimers Dement (Amst) 7: , 69–87. |
[3] | Kivimäki M , Luukkonen R , Batty GD , Ferrie JE , Pentti J , Nyberg ST , Shipley MJ , Alfredsson L , Fransson EI , Goldberg M , Knutsson A , Koskenvuo M , Kuosma E , Nordin M , Suominen SB , Theorell T , Vuoksimaa E , Westerholm P , Westerlund H , Zins M , Kivipelto M , Vahtera J , Kaprio J , Singh-Manoux A , Jokela M ((2018) ) Body mass index and risk of dementia: Analysis of individual-level data from 1.3 million individuals. Alzheimers Dement 14: , 601–609. |
[4] | Pedditzi E , Peters R , Beckett N ((2016) ) The risk of overweight/obesity in mid-life and late life for the development of dementia: A systematic review and meta-analysis of longitudinal studies. Age Ageing 45: , 14–21. |
[5] | Pugazhenthi S , Qin L , Reddy PH ((2017) ) Common neurodegenerative pathways in obesity, diabetes, and Alzheimer’s disease. Biochim Biophys Acta Mol Basis Dis 1863: , 1037–1045. |
[6] | Ruan Q , D’Onofrio G , Sancarlo D , Bao Z , Greco A , Yu Z ((2016) ) Potential neuroimaging biomarkers of pathologic brain changes in mild cognitive impairment and Alzheimer’s disease: A systematic review. BMC Geriatr 16: , 104. |
[7] | Lowe CJ , Reichelt AC , Hall PA ((2019) ) The prefrontal cortex and obesity: A health neuroscience perspective. Trends Cogn Sci 23: , 349–361. |
[8] | Willette AA , Kapogiannis D ((2015) ) Does the brain shrink as the waist expands? Ageing Res Rev 20: , 86–97. |
[9] | Boyle CP , Raji CA , Erickson KI , Lopez OL , Becker JT , Gach HM , LongstrethWT Jr , Teverovskiy L , Kuller LH , Carmichael OT , Thompson PM ((2015) ) Physical activity, body mass index, and brain atrophy in Alzheimer’s disease. Neurobiol Aging 36: , S194–S202. |
[10] | Ho AJ , Raji CA , Becker JT , Lopez OL , Kuller LH , Hua X , Lee S , Hibar D , Dinov ID , Stein JL , Jack CR Jr , Weiner MW , Toga AW , Thompson PM , ((2010) ) Cardiovascular Health Study, for the Alzheimer’s Disease Neuroimaging Initiative Obesity is linked with lower brain volume in 700 AD and MCI patients. Neurobiol Aging 31: , 1326–1339. |
[11] | World Health Organization 2020 Obesity and over-weight fact sheet. https://www.who.int/news-room/fact-sheets/detail/obesity-and-overweight, Last updated April 1, 2020, Accessed on June 1, 2020. |
[12] | McKhann GM , Knopman DS , Chertkow H , Hyman BT , Jack CR Jr , Kawas CH , Klunk WE , Koroshetz WJ , Manly JJ , Mayeux R , Mohs RC , Morris JC , Rossor MN , Scheltens P , Carrillo MC , Thies B , Weintraub S , Phelps CH ((2011) ) The diagnosis of dementia due to Alzheimer’s disease: Recommendations from the National Institute on Aging-Alzheimer’s Association workgroups on diagnostic guidelines for Alzheimer’s disease. Alzheimers Dement 7: , 263–269. |
[13] | Albert MS , DeKosky ST , Dickson D , Dubois B , Feldman HH , Fox NC , Gamst A , Holtzman DM , Jagust WJ , Petersen RC , Snyder PJ , Carrillo MC , Thies B , Phelps CH ((2011) ) The diagnosis of mild cognitive impairment due to Alzheimer’s disease: Recommendations from the National Institute on Aging-Alzheimer’s Association workgroups on diagnostic guidelines for Alzheimer’s disease. Alzheimers Dement 7: , 270–279. |
[14] | Jones SA , De Marco M , Manca R , Bell SM , Blackburn DJ , Wilkinson ID , Soininen H , Venneri A ((2019) ) Altered frontal and insular functional connectivity as pivotal mechanisms for apathy in Alzheimer’s disease. Cortex 119: , 100–110. |
[15] | Hamer M , Batty GD ((2019) ) Association of body mass index and waist-to-hip ratio with brain structure: UK Biobank study. Neurology 92: , e594–e600. |
[16] | Janowitz D , Wittfeld K , Terock J , Freyberger HJ , Hegenscheid K , Völzke H , Habes M , Hosten N , Friedrich N , Nauck M , Domanska G , Grabe HJ ((2015) ) Association between waist circumference and gray matter volume in 2344 individuals from two adult community-based samples. Neuroimage 122: , 149–157. |
[17] | Ashburner J , Friston KJ ((2000) ) Voxel-based morphometry—the methods. Neuroimage 11: , 805–821. |
[18] | Assaf Y , Pasternak O ((2008) ) Diffusion tensor imaging (DTI)-based white matter mapping in brain research: A review. J Mol Neurosci 34: , 51–61. |
[19] | Kullmann S , Schweizer F , Veit R , Fritsche A , Preissl H ((2015) ) Compromised white matter integrity in obesity. Obes Rev 16: , 273–281. |
[20] | Smith SM , Jenkinson M , Johansen-Berg H , Rueckert D , Nichols TE , Mackay CE , Watkins KE , Ciccarelli O , Cader MZ , Matthews PM , Behrens TEJ ((2006) ) Tract-based spatial statistics: Voxelwise analysis of multi-subject diffusion data. Neuroimage 31: , 1487–1505. |
[21] | Silva AC , Kim SG ((1999) ) Pseudo-continuous arterial spin labeling technique for measuring CBF dynamics with high temporal resolution. Magn Reson Med 42: , 425–429. |
[22] | Kim SM , Kim MJ , Rhee HY , Ryu CW , Kim EJ , Petersen ET , Jahng GH ((2013) ) Regional cerebral perfusion in patients with Alzheimer’s disease and mild cognitive impairment: Effect of APOE epsilon4 allele. Neuroradiology 55: , 25–34. |
[23] | van Loenhoud AC , Groot C , Vogel JW , van der Flier WM , Ossenkoppele R ((2018) ) Is intracranial volume a suitable proxy for brain reserve? Alzheimers Res Ther 10: , 91. |
[24] | Welsh KA , Butters N , Mohs RC , Beekly D , Edland S , Fillenbaum G , Heyman A ((1994) ) The Consortium to Establish a Registry for Alzheimer’s disease (CERAD). Part V. a normative study of the neuropsychological battery. Neurology 44: , 609–614. |
[25] | Jimenez A , Pegueroles J , Carmona-Iragui M , Vilaplana E , Montal V , Alcolea D , Videla L , Illán-Gala I , Pané A , Casajoana A , Belbin O , Clarimón J , Moizé V , Vidal J , Lleó A , Fortea J , Blesa R , for the Alzheimer’s Disease Neuroimaging Initiative ((2017) ) Weight loss in the healthy elderly might be a non-cognitive sign of preclinical Alzheimer’s disease. Oncotarget 8: , 104706–104716. |
[26] | Arner P , Bernard S , Appelsved L , Fu KY , Andersson DP , Salehpour M , Thorell A , Rydén M , Spalding KL ((2019) ) Adipose lipid turnover and long-term changes in body weight. Nat Med 25: , 1385–1389. |
[27] | Doherty GH ((2011) ) Obesity and the ageing brain: Could leptin play a role in neurodegeneration? Curr Gerontol Geriatr Res 2011: ,708154. |
[28] | Profenno LA , Porsteinsson AP , Faraone SV ((2010) ) Meta-analysis of Alzheimer’s disease risk with obesity, diabetes, and related disorders. Biol Psychiatry 67: , 505–512. |
[29] | Herrmann MJ , Tesar AK , Beier J , Berg M , Warrings B ((2019) ) Grey matter alterations in obesity: A meta-analysis of whole-brain studies. Obes Rev 20: , 464–471. |
[30] | Wakana S , Jiang H , Nagae-Poetscher LM , van Zijl PCM , Mori S ((2004) ) Fiber tract–based atlas of human white matter anatomy. Radiology 230: , 77–87. |
[31] | Jacobs HI , Van Boxtel MPJ , Jolles J , Verhey FRJ , Uylings HBM ((2012) ) Parietal cortex matters in Alzheimer’s disease: An overview of structural, functional and metabolic findings. Neurosci Biobehav Rev 36: , 297–309. |
[32] | Calabrese M , Magliozzi R , Ciccarelli O , Geurts JJG , Reynolds R , Martin R ((2015) ) Exploring the origins of grey matter damage in multiple sclerosis. Nat Rev Neurosci 16: , 147–158. |
[33] | Kullmann S , Callaghan MF , Heni M , Weiskopf N , Scheffler K , Häring HU , Fritsche A , Veit R , Preissl H ((2016) ) Specific white matter tissue microstructure changes associated with obesity. Neuroimage 125: , 36–44. |
[34] | van Bloemendaal L , Ijzerman RG , Ten Kulve JS , Barkhof F , Diamant M , Veltman DJ , van Duinkerken E ((2016) ) Alterations in white matter volume and integrity in obesity and type 2 diabetes. Metab Brain Dis 31: , 621–629. |
[35] | Dahl AK , Löppönen M , Isoaho R , Berg S , Kivela SL ((2008) ) Overweight and obesity in old age are not associated with greater dementia risk. J Am Geriatr Soc 56: , 2261–2266. |
[36] | Luchsinger JA , Cheng D , Tang MX , Schupf N , Mayeux R ((2012) ) Central obesity in the elderly is related to late-onset Alzheimer disease. Alzheimer Dis Assoc Disord 26: , 101–105. |
[37] | Wahl D , Cogger VC , Solon-Biet SM , Waern RVR , Gokarn R , Pulpitel T , de Cabo R , Mattson MP , Raubenheimer D , Simpson SJ , Le Couteur DG ((2016) ) Nutritional strategies to optimise cognitive function in the aging brain. Ageing Res Rev 31: , 80–92. |
[38] | Van der Auwera I , Wera S , Van Leuven F , Henderson ST ((2005) ) A ketogenic diet reduces amyloid beta 40 and 42 in a mouse model of Alzheimer’s disease. Nutr Metab 2: , 28. |
[39] | Alonso-Alonso M , Pascual-Leone A ((2007) ) The right brain hypothesis for obesity. JAMA 297: , 1819–1822. |
[40] | Minkova L , Habich A , Peter J , Kaller CP , Eickhoff SB , Klöppel S ((2017) ) Gray matter asymmetries in aging and neurodegeneration: A review and meta-analysis. Hum Brain Mapp 38: , 5890–5904. |
[41] | Vainik U , Baker TE , Dadar M , Zeighami Y , Michaud A , Zhang Y , García Alanis JC , Misic B , Collins DL , Dagher A ((2018) ) Neurobehavioral correlates of obesity are largely heritable. Proc Natl Acad Sci U S A 115: , 9312–9317. |
[42] | Kapasi A , Leurgans SE , James BD , Boyle PA , Arvanitakis Z , Nag S , Bennett DA , Buchman AS , Schneider JA ((2018) ) Watershed microinfarct pathology and cognition in older persons. Neurobiol Aging 70: , 10–17. |
[43] | Suter OC , Sunthorn T , Kraftsik R , Straubel J , Darekar P , Khalili K , Miklossy J ((2002) ) Cerebral hypoperfusion generates cortical watershed microinfarcts in Alzheimer disease. Stroke 33: , 1986–1992. |
[44] | Russo SJ , Nestler EJ ((2013) ) The brain reward circuitry in mood disorders. Nat Rev Neurosci 14: , 609–625. |
[45] | Wierenga CE , Hays CC , Zlatar ZZ ((2014) ) Cerebral blood flow measured by arterial spin labeling MRI as a preclinical marker of Alzheimer’s disease. J Alzheimers Dis 42: , S411–S419. |
[46] | Jung J , Cloutman LL , Binney RJ , Lambon Ralph MA ((2017) ) The structural connectivity of higher order association cortices reflects human functional brain networks. Cortex 97: , 221–239. |
[47] | Sala-Llonch R , Bartrés-Faz D , Junqué C ((2015) ) Reorganization of brain networks in aging: A review of functional connectivity studies. Front Psychol 6: , 663. |
[48] | Bruner E , Jacobs HIJ ((2013) ) Alzheimer’s disease: The downside of a highly evolved parietal lobe? J Alzheimers Dis 35: , 227–240. |
[49] | Weis S , Sonnberger M , Dunzinger A , Voglmayr E , Aichholzer M , Kleiser R , Strasser P ((2019) ) Arterial supply of the brain. In: Imaging Brain Diseases, Weis S, Sonnberger M, Dunzinger A, Voglmayr E, Aichholzer M, Kleiser R, Strasser P, eds. Springer, pp. 191–209. |
[50] | Lacalle-Aurioles M , Navas-Sanchez FJ , Aleman-Gomez Y , Olazarán J , Guzmán-De-Villoria JA , Cruz-Orduña I , Mateos-Pérez JM , Desco M ((2016) ) The disconnection hypothesis in Alzheimer’s disease studied through multimodal magnetic resonance imaging: Structural, perfusion, and diffusion tensor imaging. J Alzheimers Dis 50: , 1051–1064. |
[51] | Neth BJ , Graff-Radford J , Mielke MM , Przybelski SA , Lesnick TG , Schwarz CG , Reid RI , Senjem ML , Lowe VJ , Machulda MM , Petersen RC , JackCR Jr , Knopman DS , Vemuri P ((2019) ) Relationship between risk factors and brain reserve in late middle age: Implications for cognitive aging. Front Aging Neurosci 11: , 355. |
[52] | Xu WL , Atti AR , Gatz M , Pedersen NL , Johansson B , Fratiglioni L ((2011) ) Midlife overweight and obesity increase late-life dementia risk: A population-based twin study. Neurology 76: , 1568–1574. |
Notes
1 This number was reduced to 45 in the WMI analysis due to two unavailable diffusion scans.

