
Diagnosis of Alzheimer’s Disease in Developed and Developing Countries: Systematic Review and Meta-Analysis of Diagnostic Test Accuracy
Abstract
Background:
The present systematic review and meta-analysis of diagnostic test accuracy summarizes the last three decades in advances on diagnosis of Alzheimer’s disease (AD) in developed and developing countries.
Objective:
To determine the accuracy of biomarkers in diagnostic tools in AD, for example, cerebrospinal fluid, positron emission tomography (PET), and magnetic resonance imaging (MRI), etc.
Methods:
The authors searched PubMed for published studies from 1990 to April 2020 on AD diagnostic biomarkers. 84 published studies were pooled and analyzed in this meta-analysis and diagnostic accuracy was compared by summary receiver operating characteristic statistics.
Results:
Overall, 84 studies met the criteria and were included in a meta-analysis. For EEG, the sensitivity ranged from 67 to 98%, with a median of 80%, 95% CI [75, 91], tau-PET diagnosis sensitivity ranged from 76 to 97%, with a median of 94%, 95% CI [76, 97]; and MRI sensitivity ranged from 41 to 99%, with a median of 84%, 95% CI [81, 87]. Our results showed that tau-PET diagnosis had higher performance as compared to other diagnostic methods in this meta-analysis.
Conclusion:
Our findings showed an important discrepancy in diagnostic data for AD between developed and developing countries, which can impact global prevalence estimation and management of AD. Also, our analysis found a better performance for the tau-PET diagnostic over other methods to diagnose AD patients, but the expense of tau-PET scan seems to be the limiting factor in the diagnosis of AD in developing countries such as those found in Asia, Africa, and Latin America.
INTRODUCTION
Alzheimer’s disease (AD) is chronic neurodegenerative disease and the most common cause of dementia. AD is characterized by disturbance of multiple brain functions, including memory, thinking, orientation, calculation, learning capacity, and judgement. The cognitive impairments are accompanied by deterioration in emotional control, social behavior, and motivation [1, 2].
AD is a global disease with differential impact on countries in the world. There are over 9.9 million new cases of dementia each year worldwide, implying one new case every 3.2 seconds [3]. AD is the sixth leading cause of death in the United States (US) [1, 4] and its numbers and proportions will increase rapidly in coming years, as the population of Americans at age 65 and older is projected to grow from 56 million in 2020 to 88 million by 2050 [5]. The risk factors for AD include age, race, and ethnicity and the prevalence of AD was higher in women (12.2%) as compared with men (8.6%) worldwide [3]. Racially, Asians and Pacific Islanders had the lowest prevalence rate of AD (8.4%), then American Indian and Alaska Natives (9.1%), non-Hispanic whites (10.3%), population with mixed races (11.5%), Hispanics (12.2%), and blacks (13.8%) (percentage includes both men and women) [6, 7].
Developing countries have a considerable contribution in the increase of new AD cases as currently 58% of people with dementia has been reported in low and middle income countries (per capita income), and by 2050 it is estimated to rise by 68%. One of the reasons could be that developing countries have the fastest elderly growing population which is suffering from dementia; for example, new AD cases in China, India, South Asia, Western Pacific, and Latin American countries have emerged [3]. Developing countries have fewer resources to address the mental health issues and lack funding agencies to develop research studies which are the major challenge that public health systems have to battle in the management of AD patients.
The new diagnostic technologies developed for AD are managed and accessible in developed countries; however, because of poor economic growth, developing countries have poor diagnostic tools and lack epidemiological, clinical studies on AD. These factors are the major problems in diagnosis and estimation of prevalence rates in low-income countries (per capita income) especially in Latin America, Asia, and Africa [8]. The budget allotted for epidemiological clinical studies for AD in developed nations is based on their economic growth, per capita income levels, which will impact on the development of global health policies, clinical and pre-clinical research studies, and the management of neurodegenerative diseases in these nations.
In contrast, the developed countries like the US and Canada have a stable economy and have established funding agencies and research organizations that provide funding for research and conducts epidemiological, clinical, and pre-clinical studies on mental health diseases like AD. It is estimated that AD is one of the most financially costly diseases and managed by federal government funding agencies in developed nations [9]. The total estimated worldwide cost of dementia was US$ 818 billion in 2015, which represents 1.09% of global GDP and by 2018, the global cost of dementia raises above US$ 1 trillion. Due to slow economic growth and financial instability in developing countries (e.g., Latin American, African, and Asian countries), management of AD is not well addressed by their governments [10].
AD prevalence increases in elderly individuals (range-70–85 years), who represent the greatest burden of the disease over 43% for blacks and 40% for Hispanics. The eight epidemiological studies were conducted in Latin America between 1997–2007, to analyze AD prevalence rates in six countries (Brazil, Chile, Cuba, Peru, Uruguay, and Venezuela). It was estimated that global prevalence of dementia was 7.1% of individuals over 65 years of age in Latin America. However, there is a significant variation in the estimation of prevalence rates among these studies; for example, one of the studies carried out in Brazil estimated the frequency of dementia was 2% and another study carried out in Venezuelan estimated 13%, which is significantly different from global prevalence of AD in Latin America [11]. These differences are often attributed to the different diagnostic criteria for dementia (e.g., Diagnostic and Statistical Manual of Mental Disorders (DSM-IV), Clinical Dementia Rating Scale, etc.) used for the types of sampling and assessment. Another study conducted in Latin America, the 10/66 Dementia Research Group protocol, estimates the prevalence of dementia in the population of 65 years, in Venezuela is 6.2%, Mexico is 7.3%, Dominican Republic is 9.8%, and 12.6% for Cuba [12] which had less difference in prevalence rates. Thus, the lack of same screening tests for diagnosis of AD and identical protocols for conducting the epidemiological studies contributes to significant variation in population studies in AD in developing countries.
The clinical diagnosis of AD is based on criteria established by the National Institute of Neurological and Communicative Disorders and Stroke and the Alzheimer’s Disease and Related Disorders Association (NINCDS-ADRDA) [13], although low diagnostic specificity has been related to other dementias [14]. Recent studies have suggested that AD begins decades before the onset of clinical symptoms of dementia through the accumulation of pathological hallmarks of the disease consisting of amyloid-β (Aβ) deposits and neurofibrillary tangles (NFTs)/tau proteins [15–17].
Biomarkers are defined as objective measures of a biological or a pathogenic process that can be used to evaluate disease risk or prognosis, to guide clinical diagnosis, or to monitor therapeutic interventions [18]. NFTs are the first neuropathological hallmarks to appear in AD but amyloid deposition in the brain seems to have a closer link to AD-related pathophysiology and may be a better disease marker though it has rapidly increasing prevalence with age on both positron emission tomography (PET) and neuropathology. For AD biomarker analysis, tau-PET and amyloid-PET analysis is more relevant for non-invasive diagnosis. Cerebrospinal fluid (CSF) analysis is based on quantitative analysis of proteins and is an invasive technique. Recently, AD diagnostic biomarkers were grouped into three categories: Aβ deposits, hyperphosphorylated tau aggregates, and neurodegeneration or neuronal injury [19]. Since CSF is in direct contact with the extracellular space of the brain and has many proteins secreted in it, it is considered to be an optimal source for the assessment of AD biomarkers profile [20]. While magnetic resonance imaging (MRI) and PET are considered as imaging biomarkers of neuronal injury [21]. In the past decades, electroencephalography (EEG) analyses, with spectral and non-linear measures, have provided new insights into the understanding of physiological dynamics, including the brain alterations due to AD. Nevertheless, the gold standard for AD [22] diagnosis continues to be the histological examination of brain tissue in postmortem biopsy [23].
The overall goal of this review is to understand and highlight the major gaps in epidemiological studies of AD in developed and developing countries. Also, we investigated the best diagnostic biomarkers for AD diagnosis which contributes to estimations of prevalence rates in developed and developing nations. We performed a systematic review of the medical literature for three decades (1990–2020) and results were analyzed by meta-analysis based on the diagnostic biomarkers employed in AD diagnosis in developed and developing countries. The diagnostic biomarkers analyzed were CSF, amyloid-PET, tau-PET, EEG, and MRI. In this study we have highlighted the lack of diagnostic biomarkers AD studies from developing countries which is due to poor diagnostic infrastructure (PET, MRI scanning machines) in medical and research organizations. This will help to identify the basic need to fund the research organization for the screening of AD patients in developing countries. Thus, we hope that our findings will motivate developed and developing countries to invest and fund research studies on innovative technologies and developing new biomarkers for AD, and, hence, improve the diagnosis and accuracy of prevalence of AD that will aid in management of patients with AD.
METHODS
Search strategy and eligibility criteria
The bibliographic extraction was performed from the National Center for Biotechnology Information (NCBI) databases. PubMed is a free resource database and comprises over 28 million bibliographic records for biomedical literature from MEDLINE, and other life science journals (https://www.ncbi.nlm.nih.gov/pubmed/). PubMed provides a uniform indexing of biomedical literature, the Medical Subject Headings (MeSH terms), which form a controlled vocabulary or specific set of terms that describe the topic of a paper in a consistent and uniform manner [24]. While author keywords are particularly useful, the choice of terms can vary from paper to paper and from author to author. For this, MeSH terms were employed in the string query to improve the accuracy of the search.
The search string was performed separately for each diagnostic biomarker as follows: “Alzheimer Disease” [MeSH Terms] AND “Sensitivity and Specificity” [MeSH Terms] AND “Cerebrospinal Fluid” [MeSH Terms] for CSF; “Alzheimer Disease” [MeSH Terms] AND “Sensitivity and Specificity” [MeSH Terms] AND “Positron-emission Tomography” [MeSH Terms] AND “Amyloid” [MeSH Terms] for Amyloid-PET; “Alzheimer Disease” [MeSH Terms] AND “Sensitivity and Specificity” [MeSH Terms] AND “Positron-emission Tomography” [MeSH Terms] AND “tau Proteins” [MeSH Terms] for tau-PET; “Alzheimer Disease” [MeSH Terms] AND “Sensitivity and Specificity” [MeSH Terms] AND “Magnetic Resonance Imaging” [MeSH Terms] for MRI; and “Alzheimer Disease” [MeSH Terms] AND “Sensitivity and Specificity” [MeSH Terms] AND “Electroencephalography” [MeSH Terms] for EEG. The co-occurrence network map of MeSH terms from the biomarkers datasets was created using the VOSviewer server (Version 1.6.15) [25].
The selection of the studies was performed in three steps. Firstly, duplicated articles, non-full English articles, reviews, and meta-analysis were excluded. Secondly, titles and abstracts of the selected studies through the search strategy were analyzed, and finally, full papers were retrieved for all potentially relevant studies and for those for which the title or abstract did not provide enough information to clearly decide whether or not it should be included. From the final set of included studies, data regarding geographical distribution, number studies conducted by country, and frequency of the diagnostic tools used was also extracted.
Data extraction and meta-analysis of diagnostic test accuracy
Since diagnostic accuracy of a test is generally measured by a pair of summary points, namely, sensitivity and specificity [26], information regarding sensitivity and specificity data were manually extracted from the selected studies. Also, data regarding the number of AD patients and healthy controls were retrieved. Studies with unclear or missing data regarding the AD and healthy control groups or data describing the sensitivity and specificity obtained in the studies were excluded from further analysis.
The data obtained from the selected studies was analyzed with R “mada” package (Version 0.5.9) [27] which is a tool for the meta-analysis of diagnostic accuracy. For this, the numbers of true positives (TP), false positives (FP), true negatives (TN), and false negatives (FN) were calculated and entered in to “mada”. The data from studies regarding each diagnostic biomarker were analyzed separately and the diagnostic performance was assessed by calculation of the sensitivity (Se) and specificity (Sp). Also, accuracy statistics like: the Positive Likelihood ratio (LR+), which is the ratio of the probability of a positive test result among those with disease to that of a positive test result among those without disease; the Negative Likelihood ratio (LR-), which is the ratio of the probability of a negative test result among those with disease to that of a negative test result among those without disease; and the Diagnostic Odds ratio (DOR), which is the ratio of the OR for a positive test result among persons with disease to that among persons without disease; and their 95% confidence interval (CI) were calculated.
The diagnostic accuracy of the biomarkers was compared by summary receiver operating characteristic (sROC) curve statistics. The R “mada” package reitsma model, estimates the sROC curve using the bivariate model by default [28]. The confidence level for all calculations was set to 95%.
RESULTS
Search strategy results
In this study, a workflow for a systematic review of literature and meta-analysis of diagnostic accuracy of biomarkers employed for AD in developed and developing countries is shown (Fig. 1). The bibliographic search was performed in the PubMed database and resulted in a total of 1,376 articles selected, whereas the number of studies selected for CSF, amyloid-PET, tau-PET, MRI, and EEG was 20, 147, 51, 1,017, and 141, respectively (Fig. 2). Regarding the distribution among the time frame of the selected studies, a 30 years span of time was covered (2020-1990), whereas no articles published in 2020 were found (Fig. 2). In this sense, MeSH terms provide a powerful tool to overcome variability in language and broaden or narrow results; however, a search using only MeSH terms cannot yield results that include newly published articles.
Fig. 1
Systematic review and meta-analysis workflow diagram.
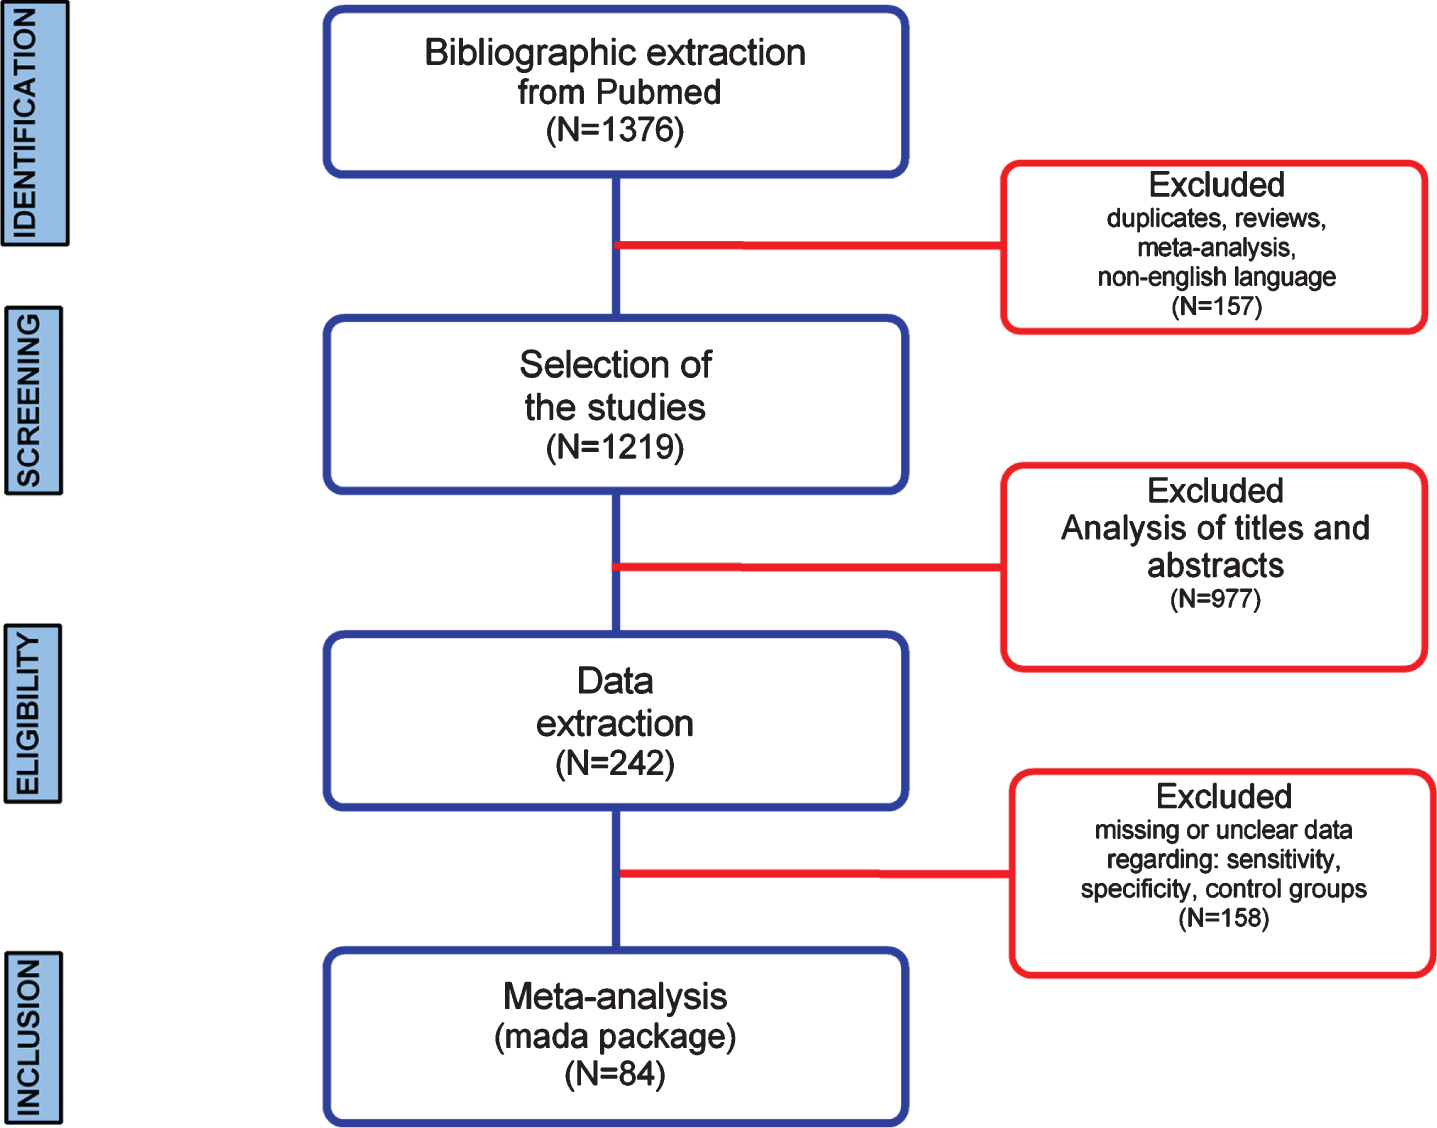
Fig. 2
Papers selected for the different biomarkers using MeSH terms in PubMed database (from 1990 to 2019). Distribution per year of all articles found in the search and bibliometric map created by VOSviewer based on MeSH terms co-occurrence for: A) CSF, B) amyloid-PET, C) tau-PET, D) MRI, and E) EEG biomarkers.
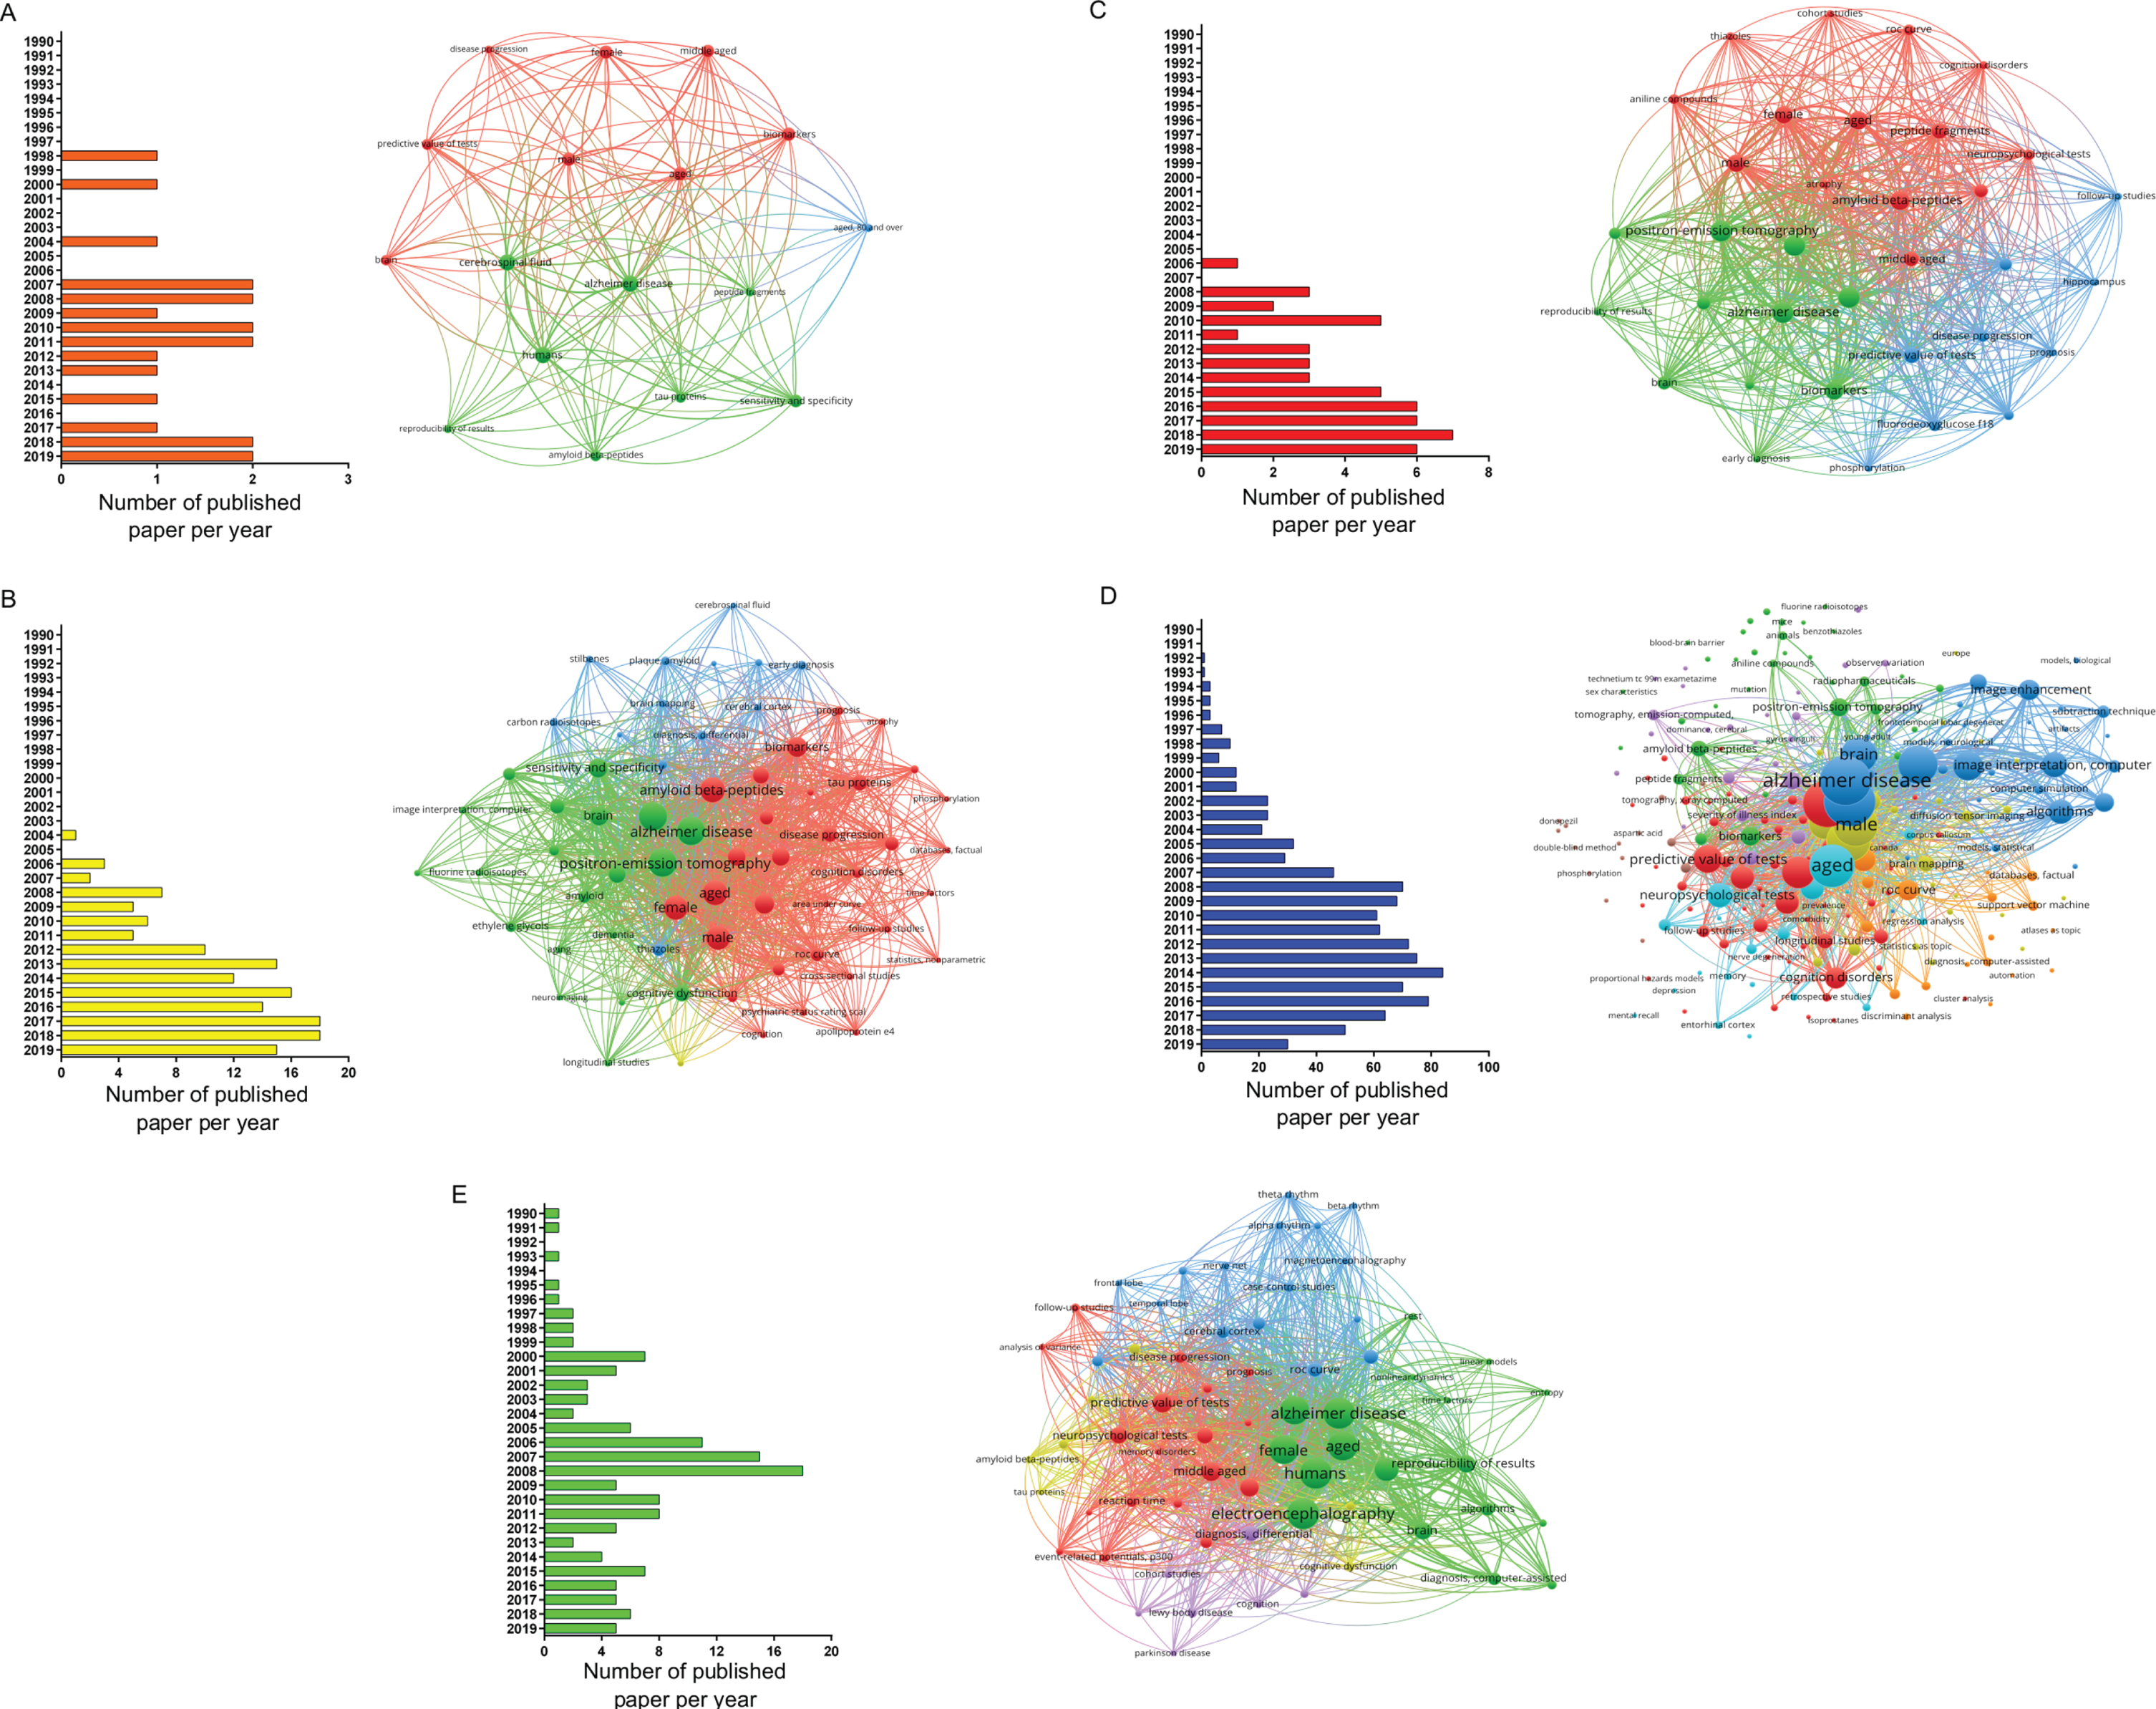
When conducting a co-occurrences analysis of MeSH keywords, by setting the minimum number of occurrences of a keyword to five, the number of keywords that meet the threshold were 17, 65, 34, 219, and 66 for CSF, amyloid-PET, tau-PET, MRI, and EEG, respectively. When examining each network in more detail, it was possible to notice, that terms, such as brain, aged, male, female, and predictive value of tests, were common denominators (Fig. 2).
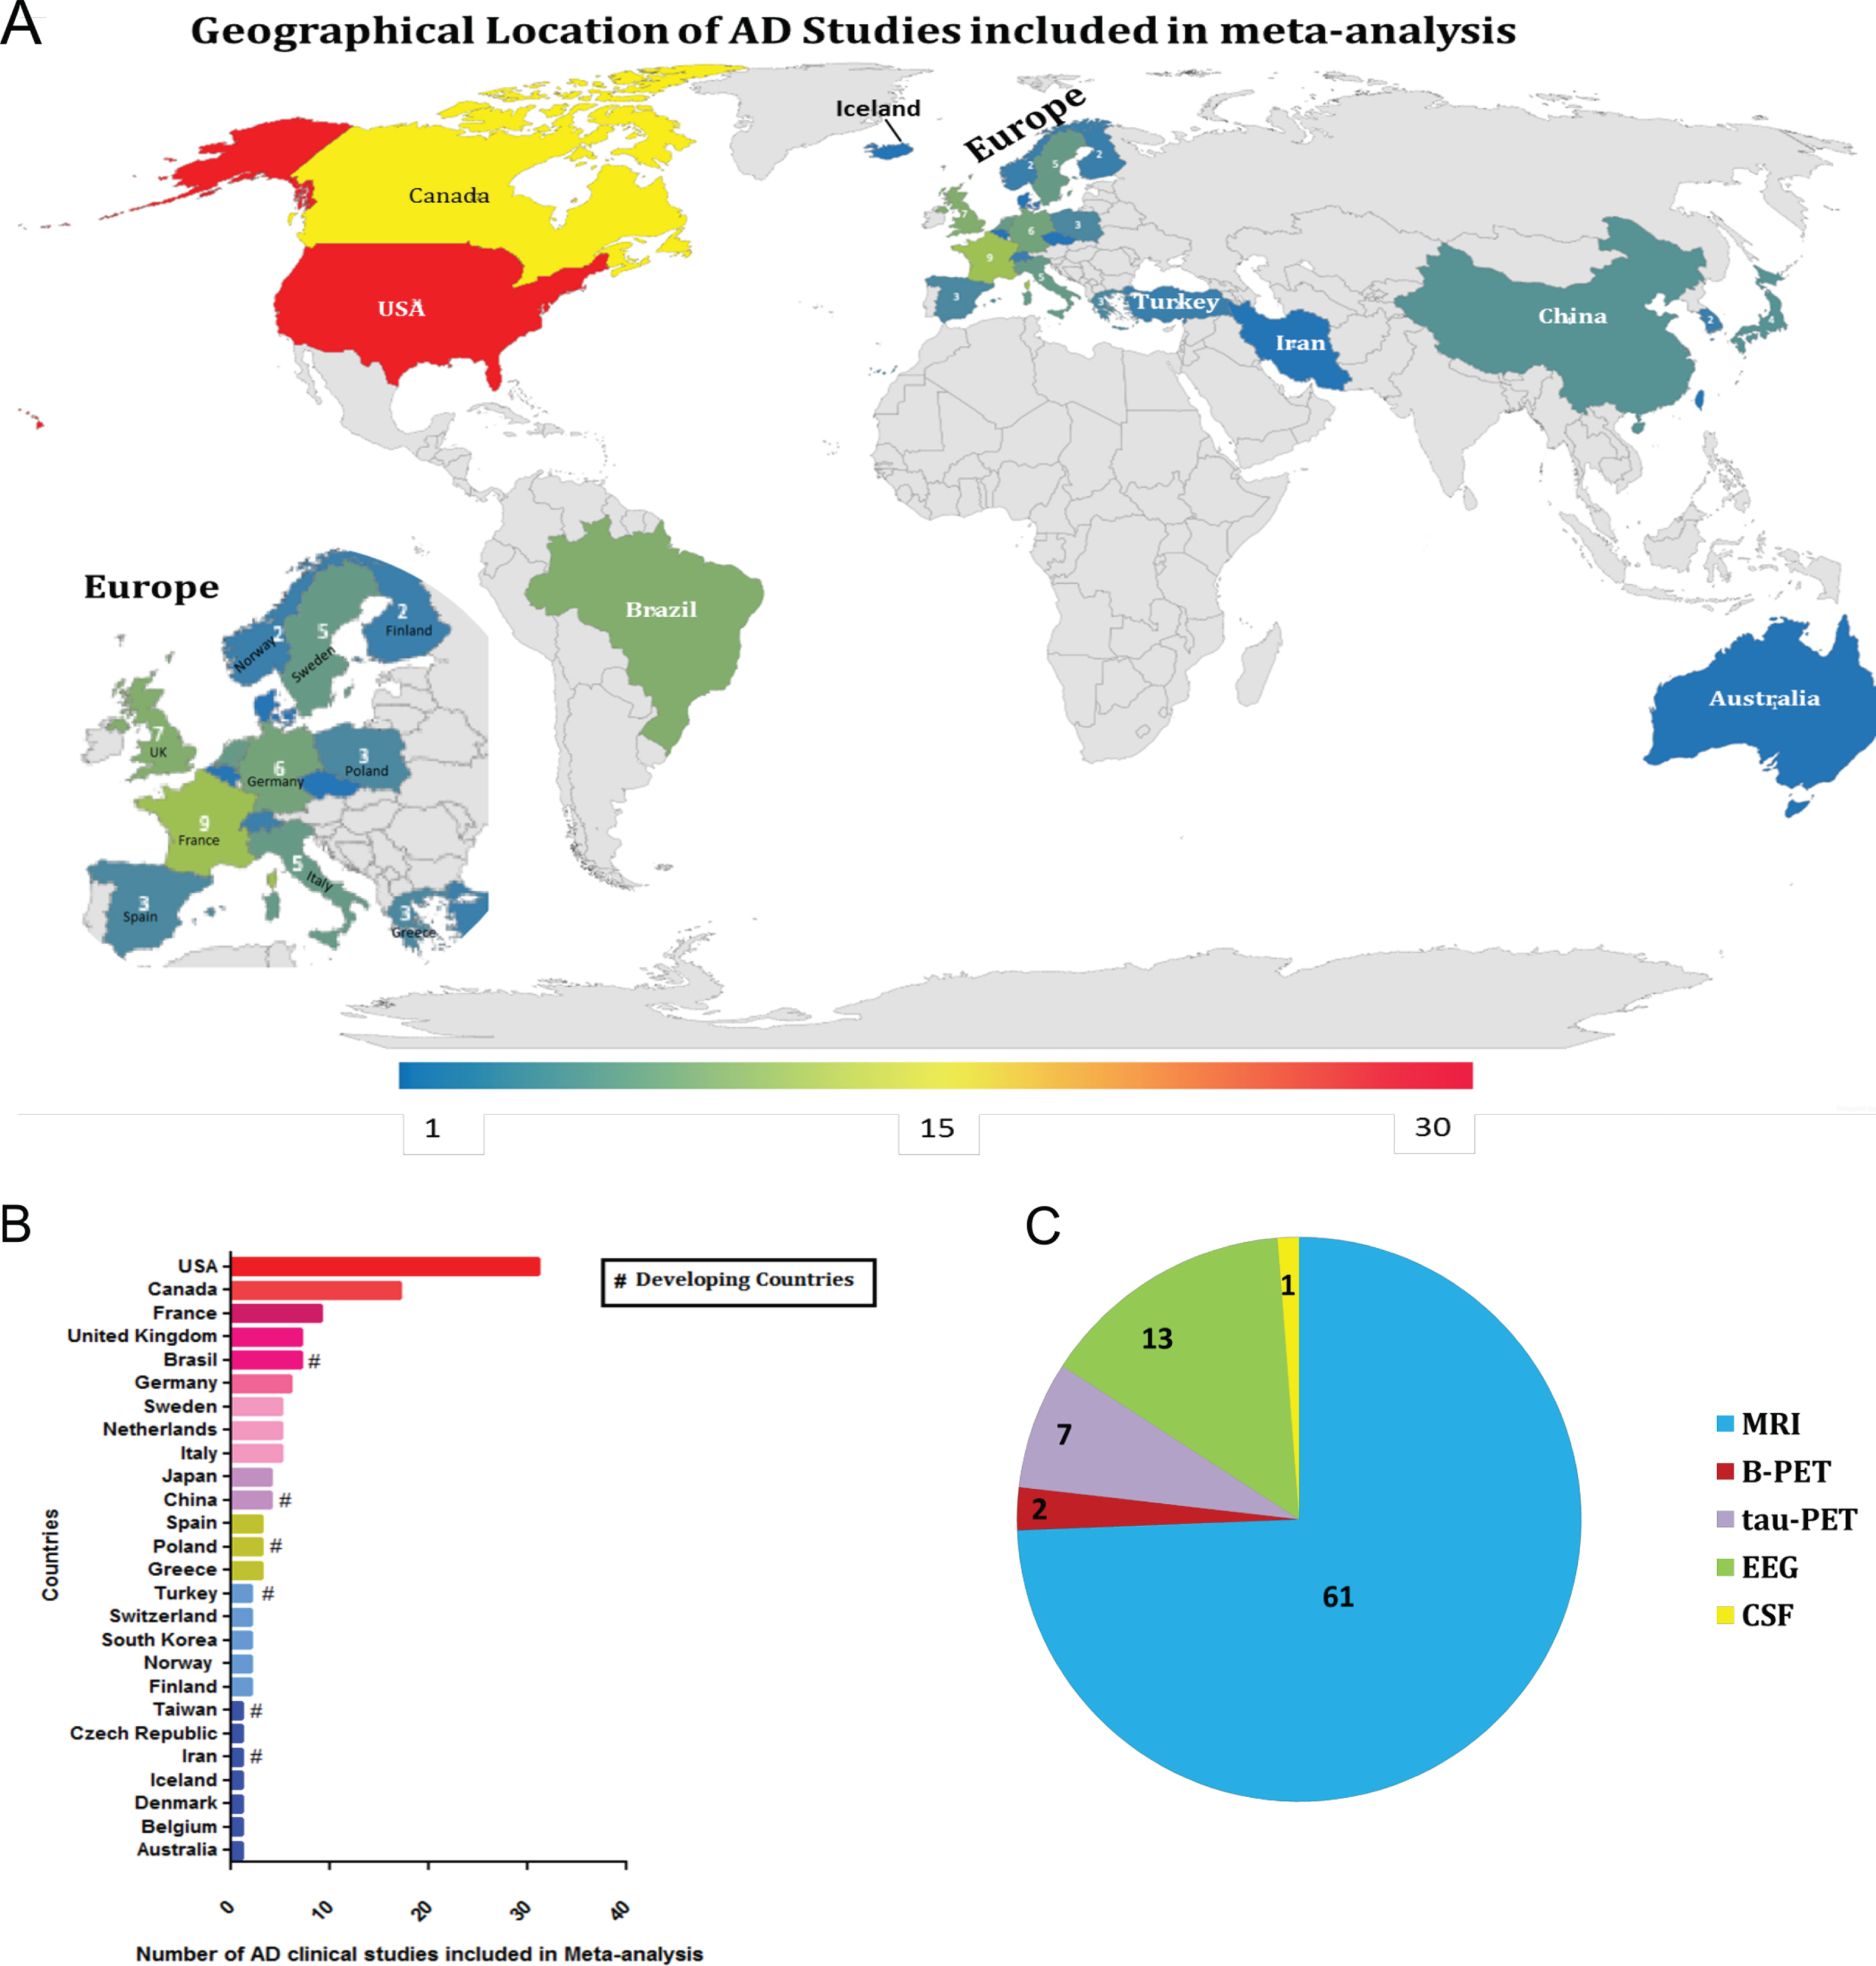
Furthermore, a three-step eligibility criteria were employed to analyze 1,376 studies, and 1,134 articles were excluded in this step. In the data extraction step, 158 articles were excluded. Thus 84 articles were selected for meta-analysis. Also, data regarding geographical features extracted from the 84 studies selected were analyzed (Fig. 3); among 25 countries in which the studies were performed, only six are considered developing countries (Fig. 2A, B); while in most of the studies, the biomarker studied was the MRI (Fig. 2C).
Fig. 3
Geographical location of Alzheimer’s disease studies. A) Demographic representation of AD clinical studies worldwide (lower-blue to higher-red numbers). B) The bar chart shows the number of AD studies conducted by different countries included in the meta-analysis. C) The pie chart shows the type of diagnostic tools used in the AD studies for meta-analysis.
Diagnostic biomarkers of Alzheimer's disease
CSF and amyloid-PET biomarkers
Surprisingly, one study regarding CSF for AD diagnostic biomarker was selected [29] and two studies for amyloid-PET was found to be eligible by standards applied in the workflow [30, 31]. Thereby no analysis has been performed regarding these two diagnostic biomarkers.
Electroencephalography
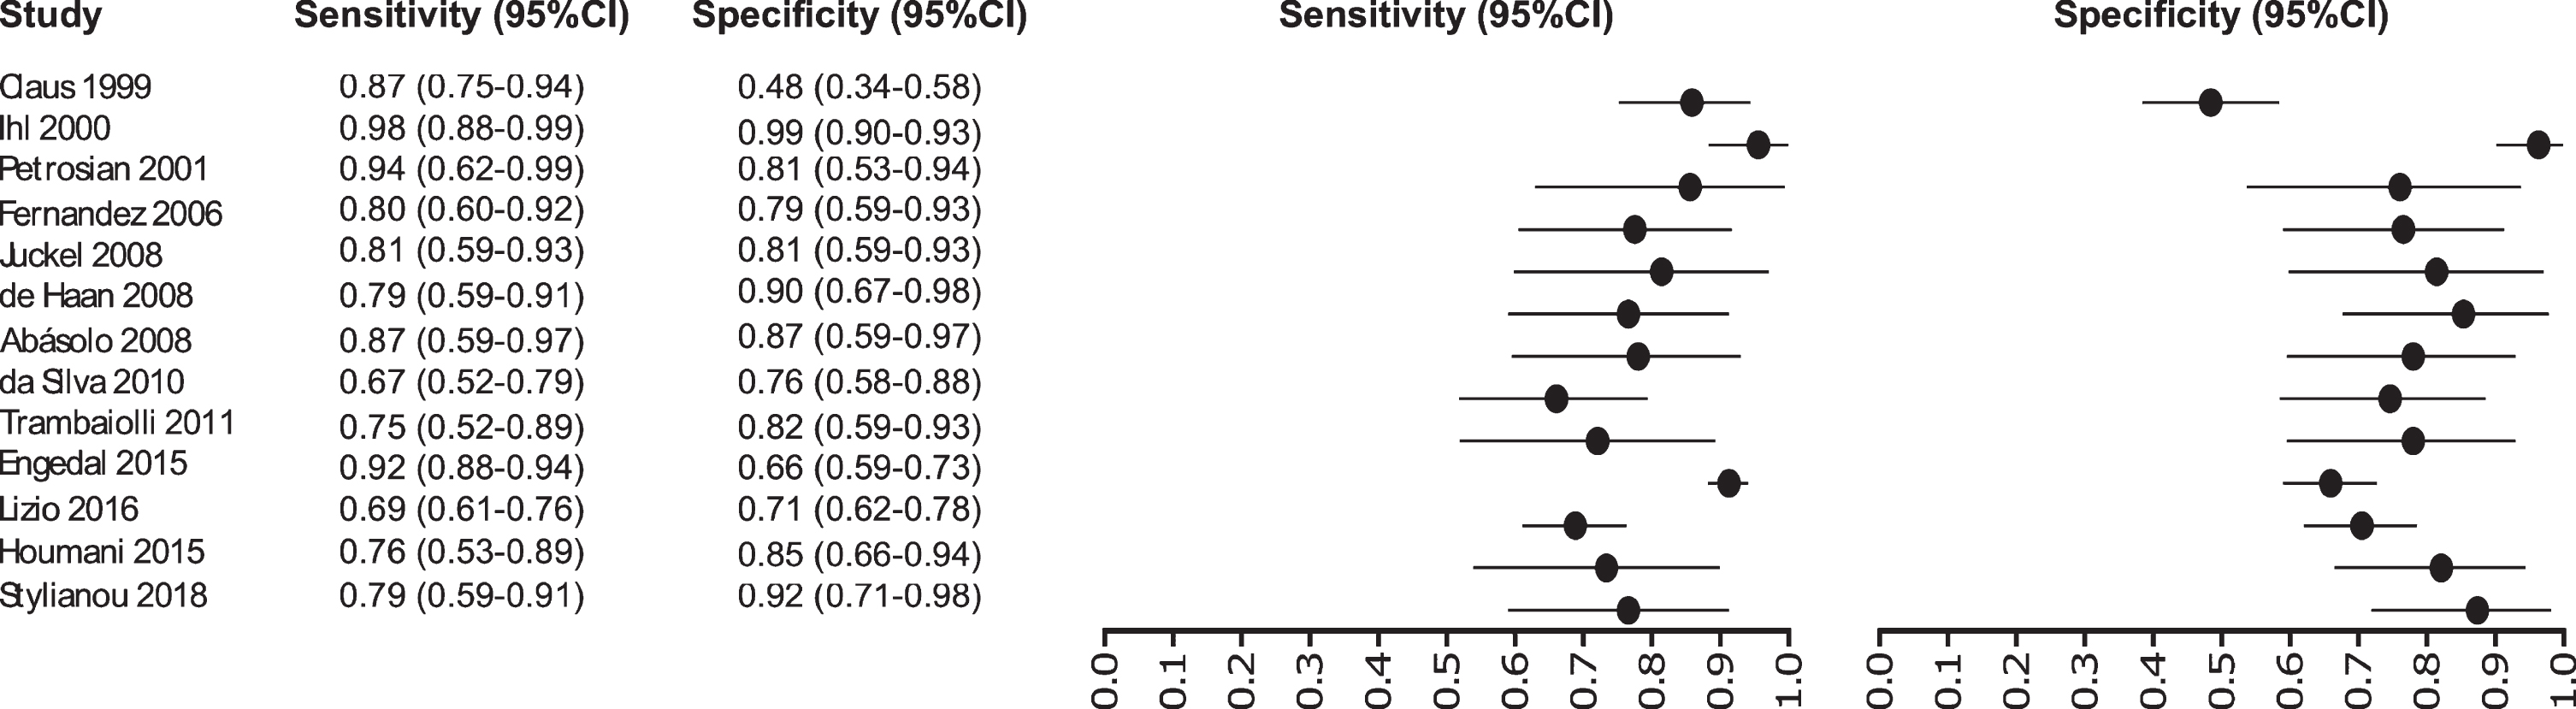
Thirteen studies were selected for EEG: [32–44] in which a total of 1,387 subjects were studied. The sensitivity was ranged from 98 to 67%, with a median of 80%, 95% CI (91, 75), while the test for equality of sensitivities presented a χ2 = 62.1255, df = 13, p-value = 2.18e-08. The specificity on the studies ranged from 98 to 48%, with a median of 94%, 95% CI (97, 76); the test for equality of specificities showed χ2 = 58.2504, df = 13, p-value = 1.08e-07. A negative correlation between sensitivities and false positive rates is shown r = –0.100, 95% CI (–0.599, 0.454). Also, the results regarding LR+{median 4.25, 95% CI (8.48, 2.71}, LR- {median 0.23, 95% CI (0.42, 0.12)}, and DOR {median 19.24, 95% CI (49.00, 6.73)} are shown. The diagnostics performance analyzed is summarized in Fig. 4 and Supplementary Table 1.
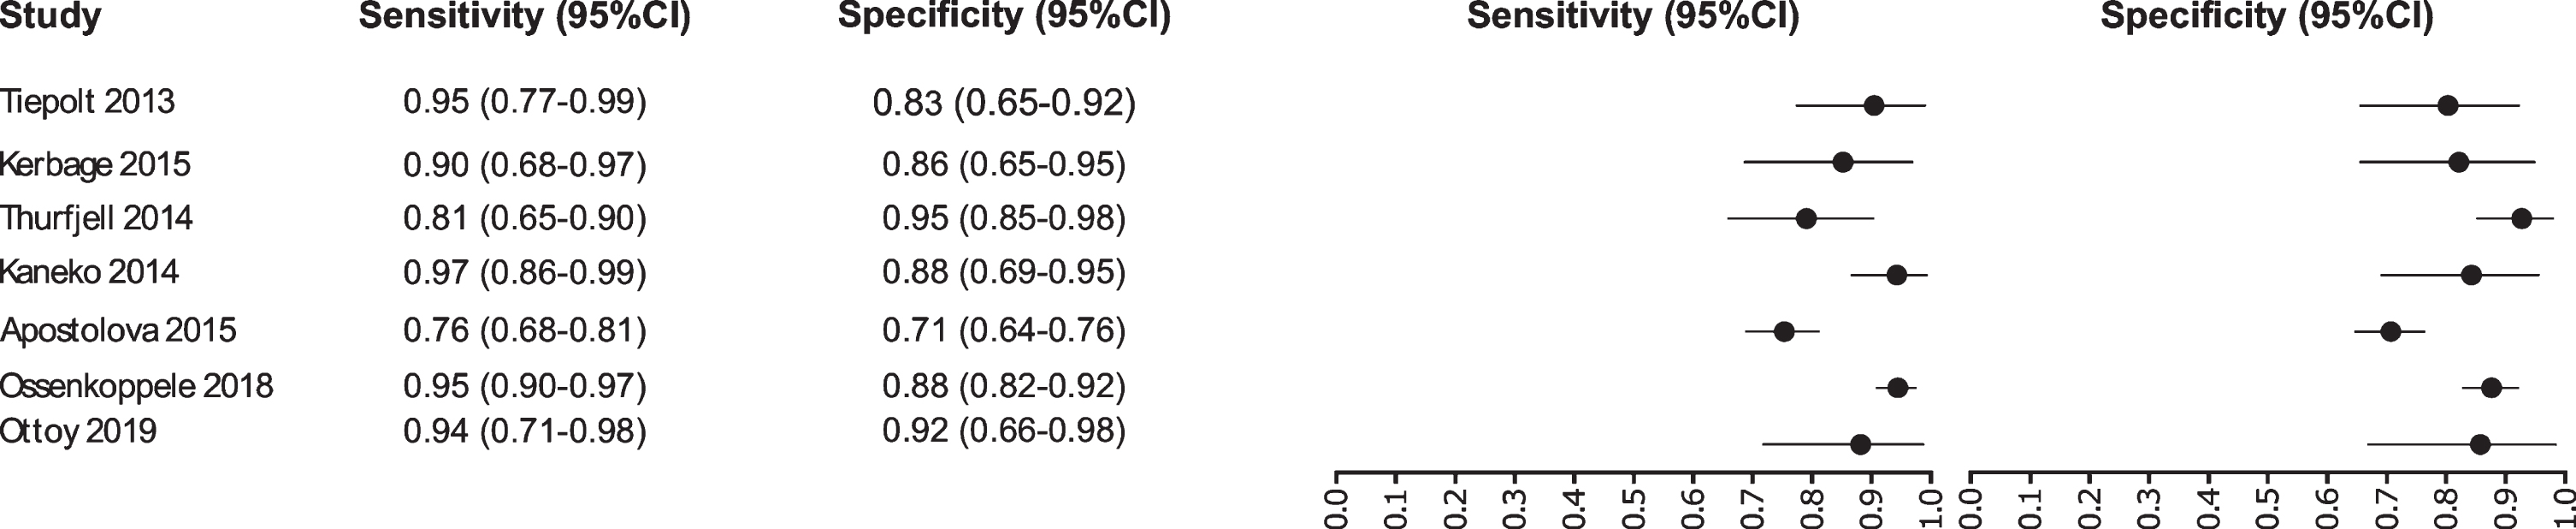
Fig. 4
Study data and paired forest plot of the sensitivity and specificity of tau-PET in Alzheimer’s disease diagnosis. Data from each study are summarized. Sensitivity and specificity are reported with a mean (95% confidence limits). Forest plot depicts the estimated sensitivity and specificity (black circles) and its 95% confidence limits (horizontal black line).
Tau-PET biomarker
Our analysis selected seven studies for the tau-PET biomarker: [45–51]. A total of 1,012 subjects were studied. The sensitivity was ranged from 97 to 76%, with a median of 94%, 95% CI (97, 76); while the test for equality of sensitivities showed: χ2 = 36.5719, df = 6, p-value = 2.13e-06. The specificity on the studies ranged from 95 to 71%, with a median of 88%, 95% CI (95, 71); while the test for equality of specificities presented χ2 = 29.7706, df = 6, p-value = 4.35e-05. The correlation between sensitivities and false positive rates was analyzed a negative result is shown r = –0.448, 95% CI (0.898, –0.460). Also, the results regarding LR+{median 7.79, 95% CI (14.87, 2.6)}, LR- {median 0.07, 95% CI (0.35, 0.03)}, and DOR {median 96, 95% CI (259, 7.53)} are shown. The diagnostic performances analyzed are summarized in Fig. 5 and Supplementary Table 2.
Fig. 5
Study data and paired forest plot of the sensitivity and specificity of EEG in Alzheimer’s disease diagnosis. Data from each study are summarized. Sensitivity and specificity are reported with a mean (95% confidence limits). Forest plot depicts the estimated sensitivity and specificity (black circles) and its 95% confidence limits (horizontal black line).
MRI biomarker
Initially our analysis identified 1,017 published studies that used MRI as a diagnostic biomarker. After the analysis, only 61 studies were selected [52–112]. A total of 8,072 subjects were studied. The sensitivity on the studies ranged from 99 to 41%, with a median of 84%, 95% CI (87, 81). The analysis of the test for equality of sensitivities showed: χ2 = 326.3558, df = 61, p-value = <2e-16. The specificity on the studies ranged from 99 to 59%, with a median of 84%, 95% CI (90, 80); while the test for equality of specificities: χ2 = 332.8035, df = 61, p-value = <2e-16. Also, a negative correlation between sensitivities and false positive rates is shown r = –0.096, 95% CI (–0.338, 0.158). Also, the results regarding LR+{median 5.29, 95% CI (7.78, 4.22)}, LR- {median 0.19, 95% CI (0.23, 0.14)}, and DOR {median 32.16, 95% CI (67.13, 22.41)} are shown. The diagnostic performance of the selected studies is summarized in Figs. 6–8 and Supplementary Table 3.
Fig. 6
Study data and paired forest plot of the sensitivity and specificity of MRI in Alzheimer’s disease diagnosis (from 1995 to 2010). Data from each study are summarized. Sensitivity and specificity are reported with a mean (95% confidence limits). Forest plot depicts the estimated sensitivity and specificity (black circles) and its 95% confidence limits (horizontal black line).
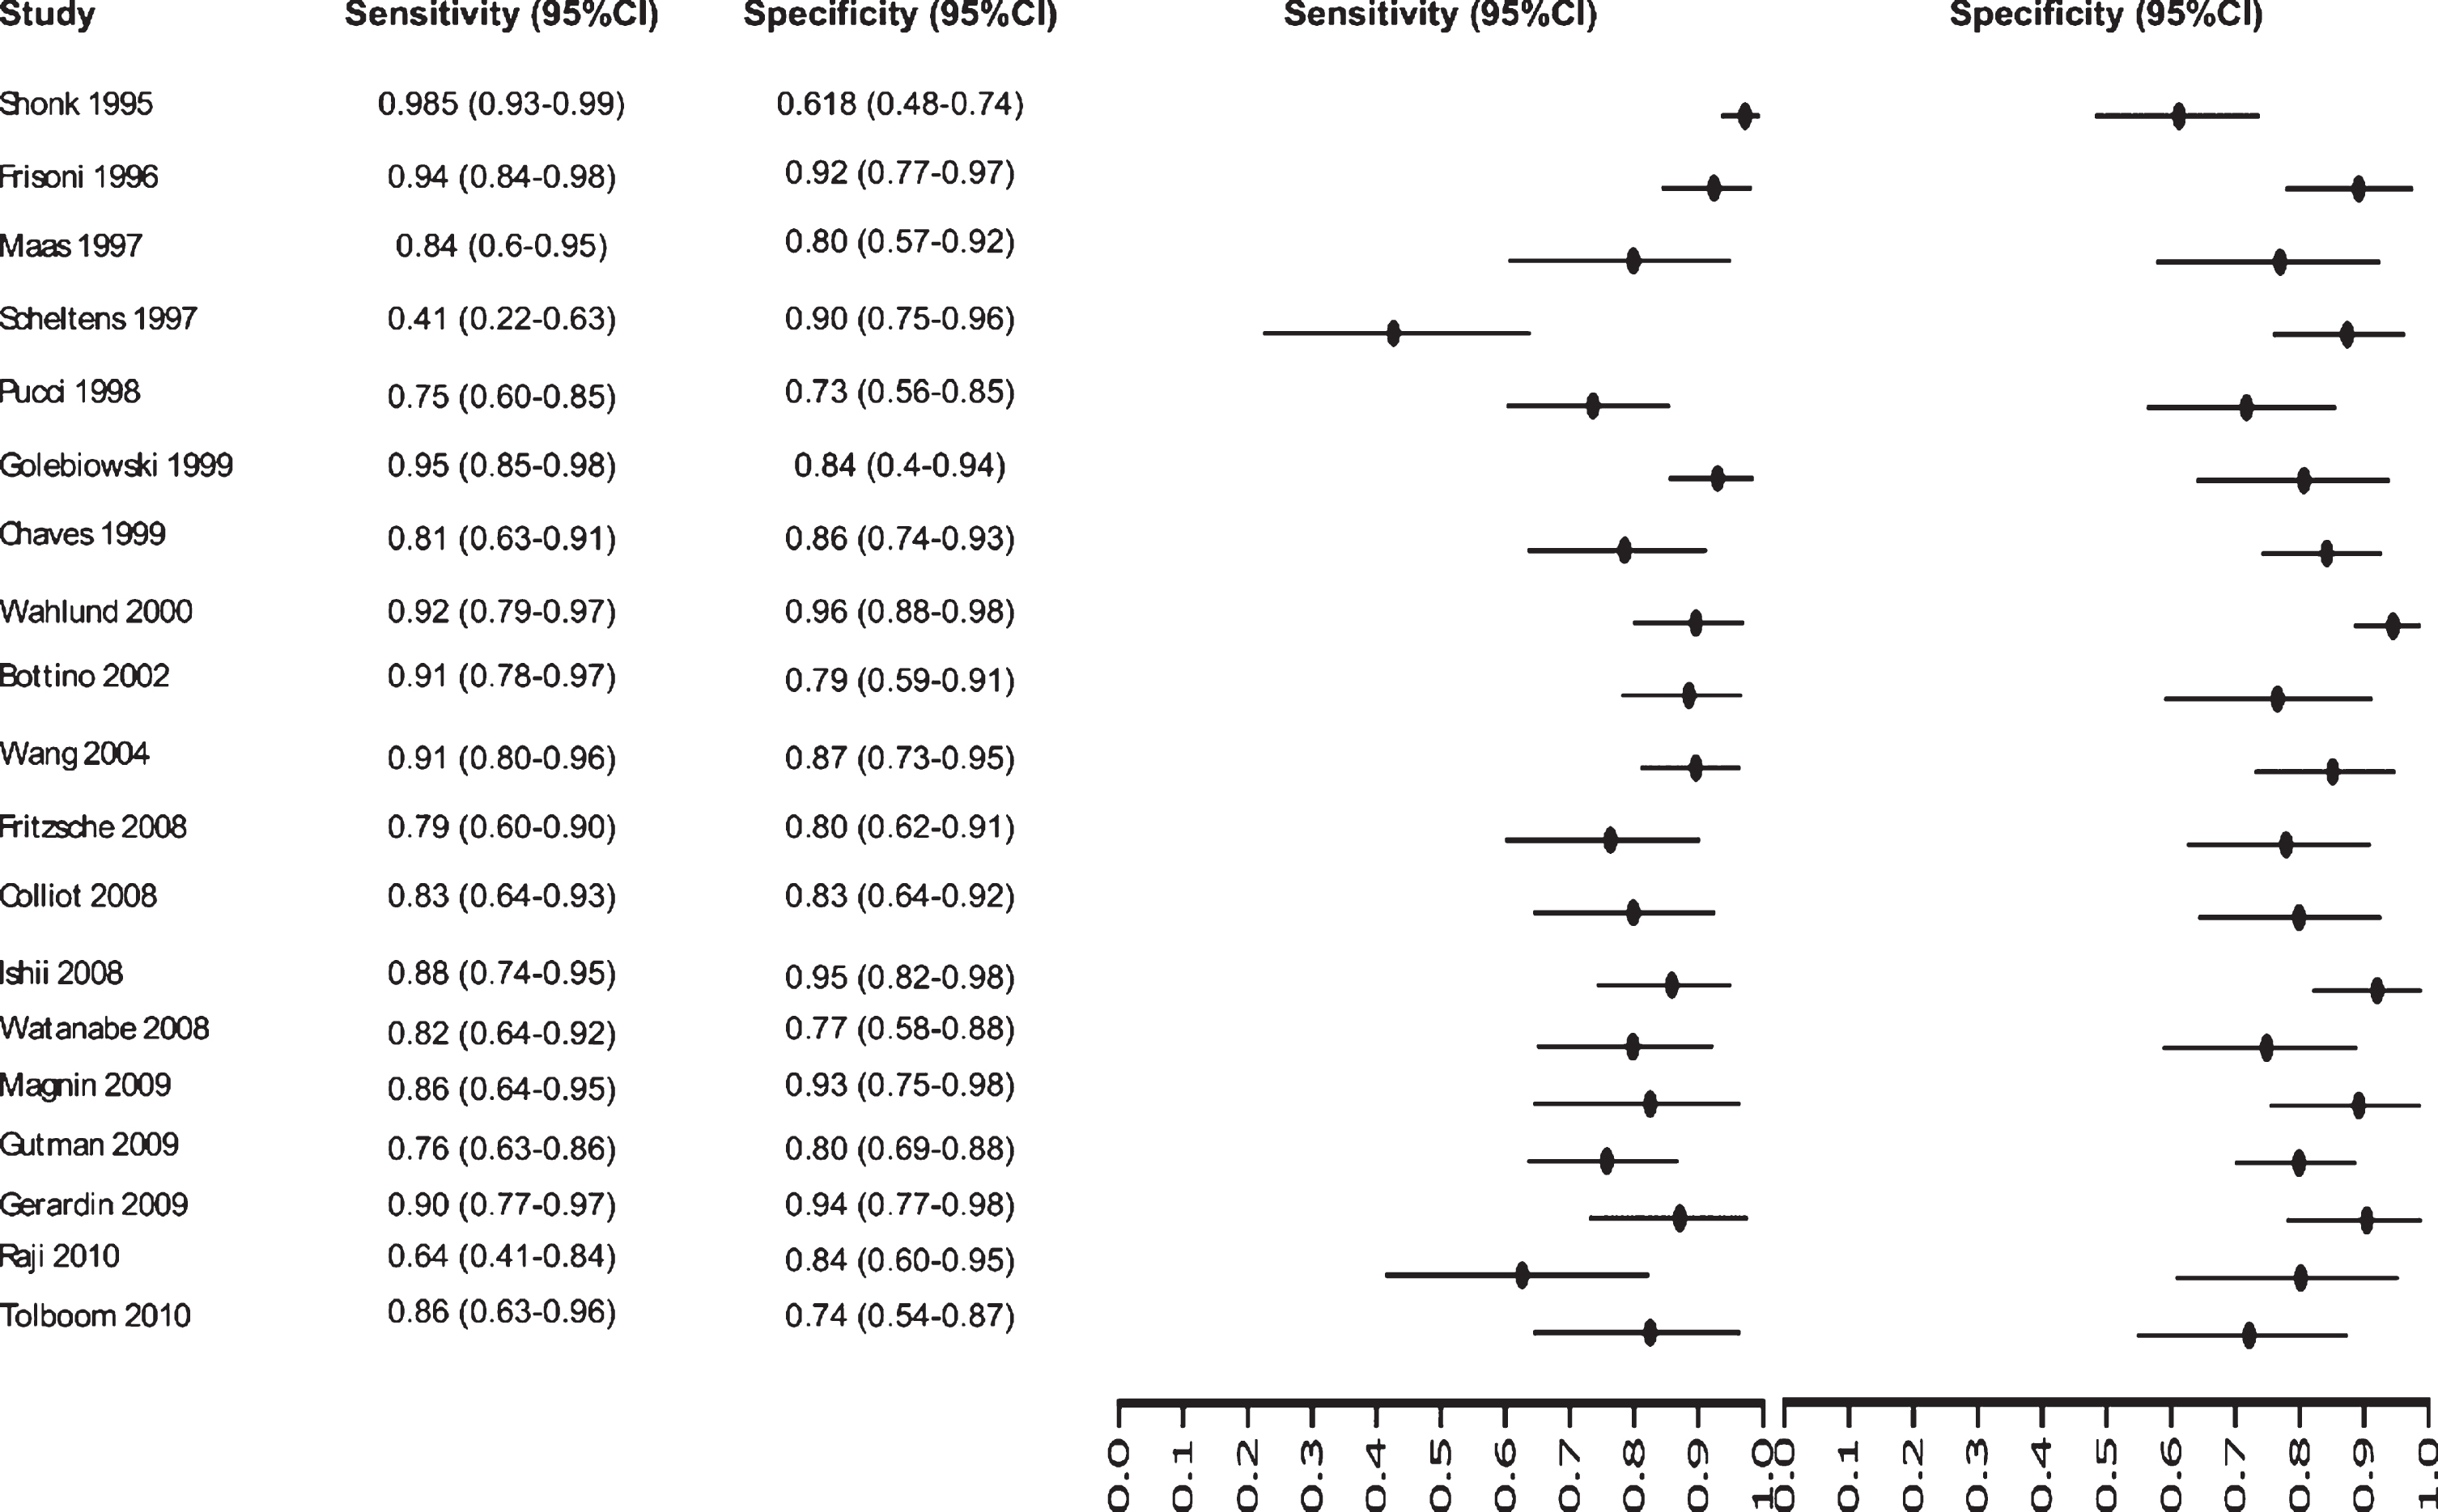
Fig. 7
Study data and paired forest plot of the sensitivity and specificity of MRI in Alzheimer’s disease diagnosis (from 2011 to 2016). Data from each study are summarized. Sensitivity and specificity are reported with a mean (95% confidence limits). Forest plot depicts the estimated sensitivity and specificity (black circles) and its 95% confidence limits (horizontal black line).
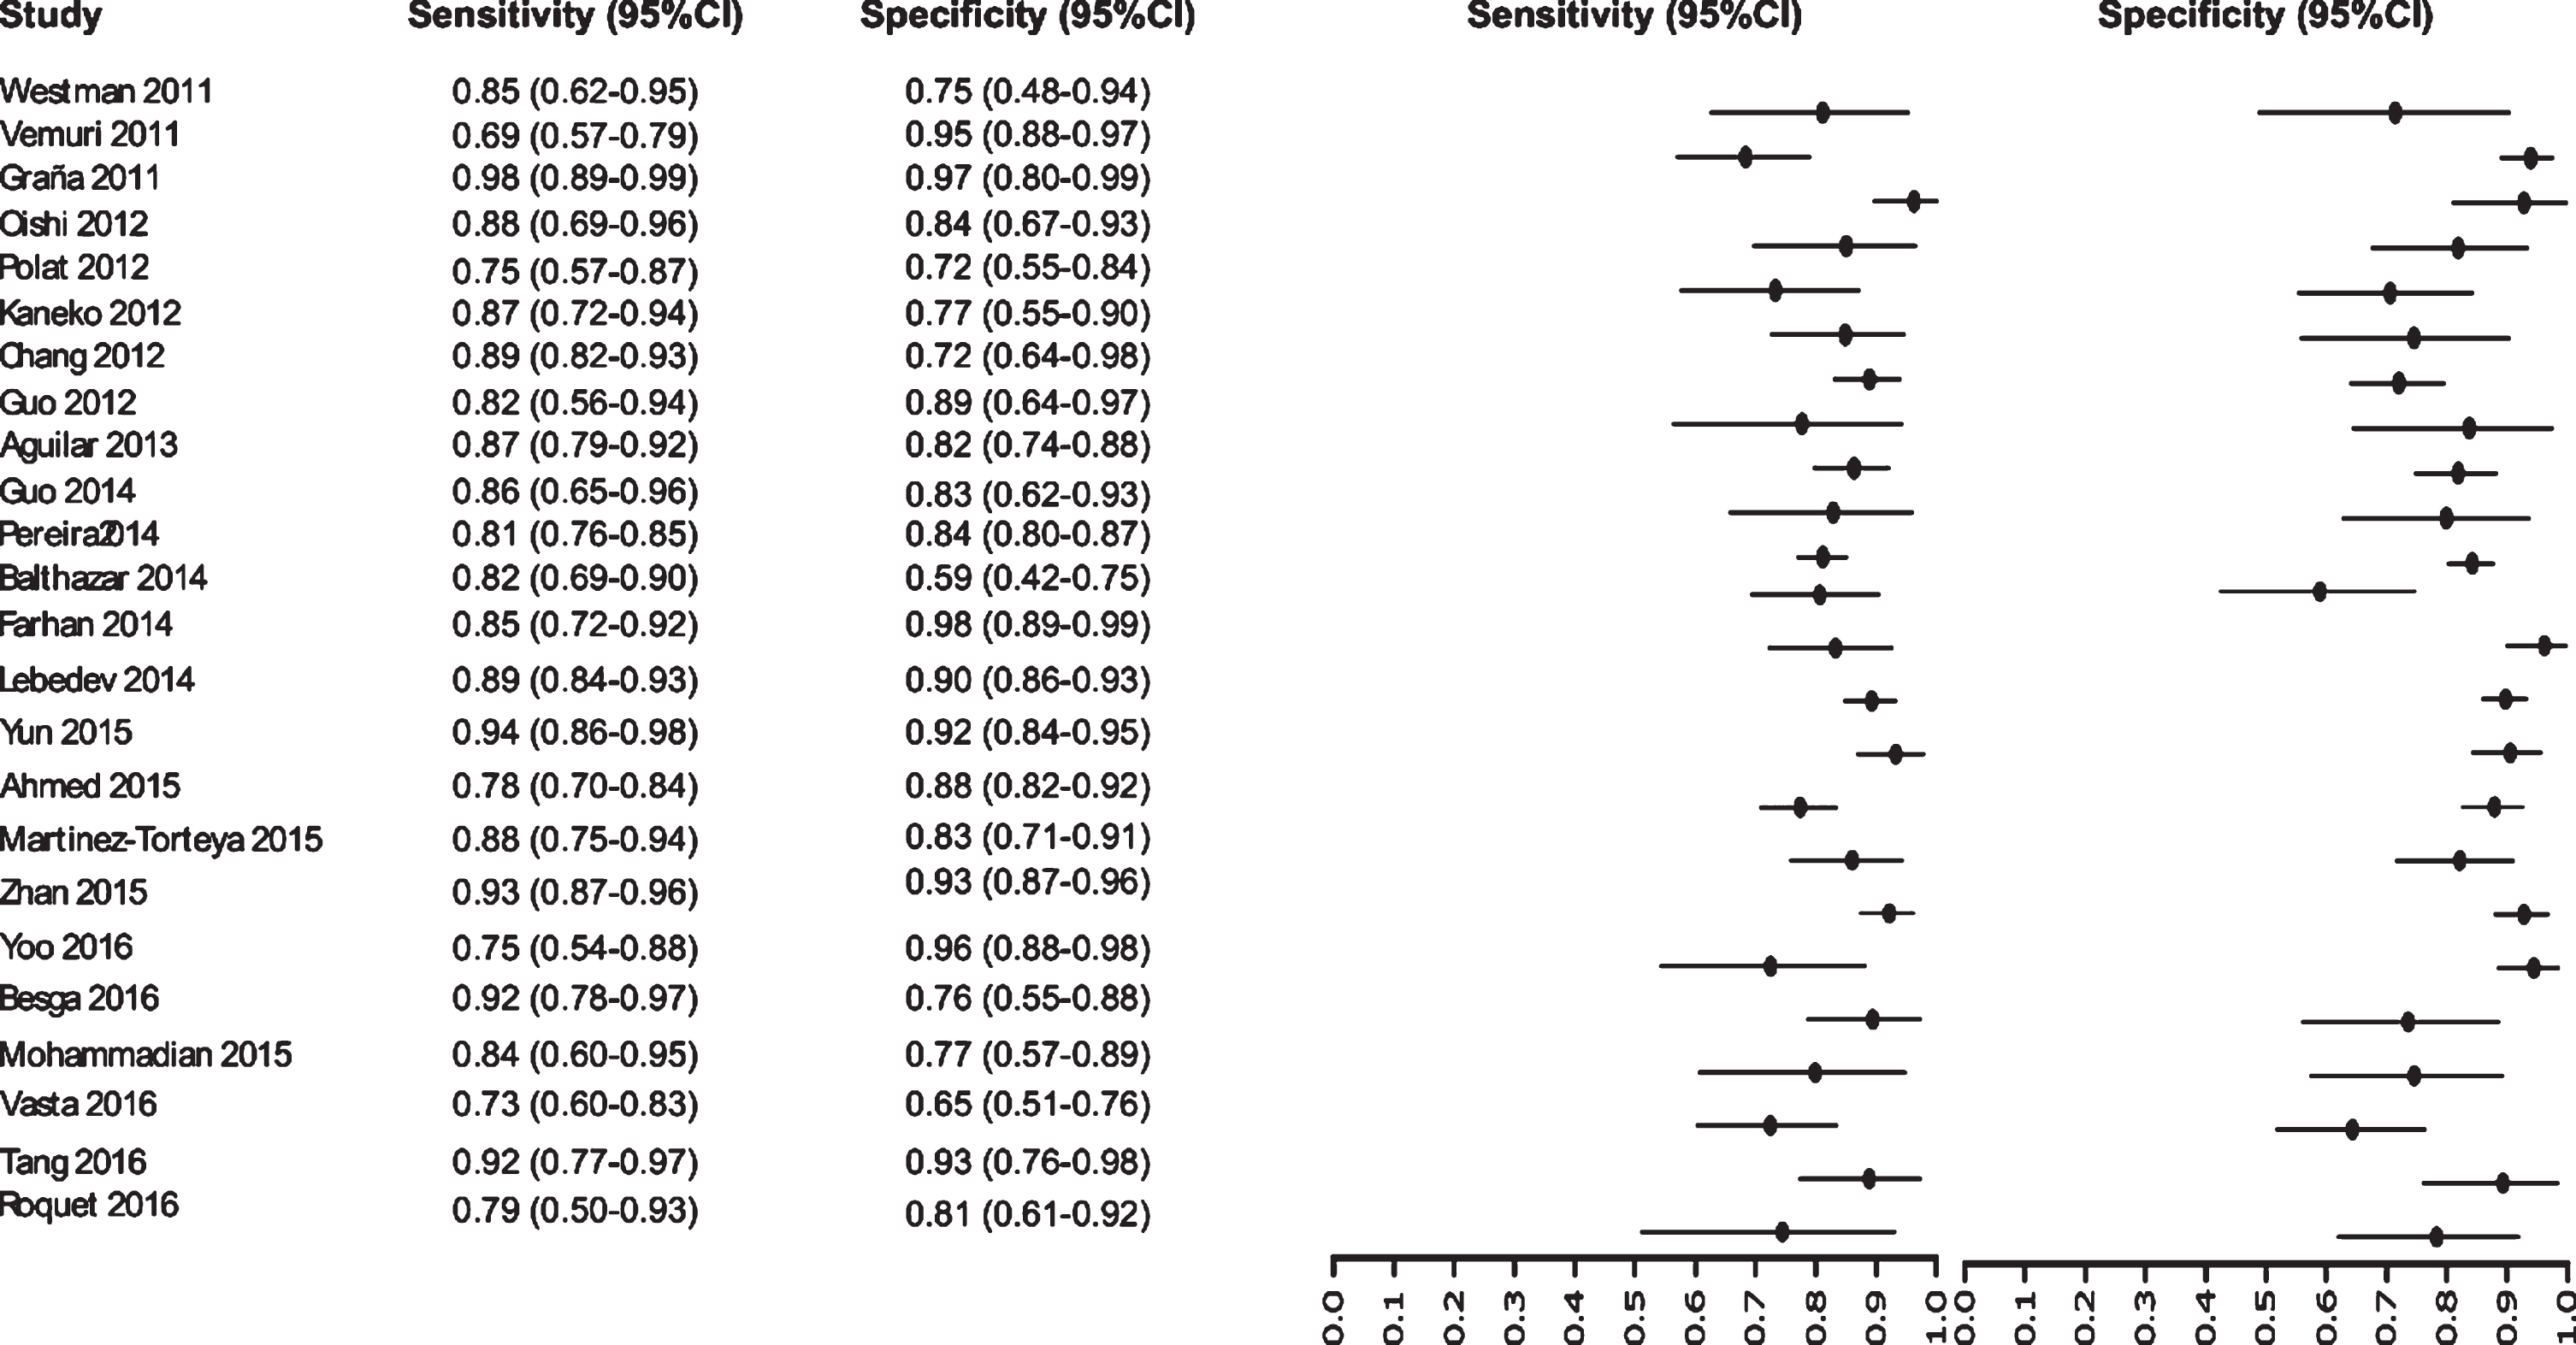
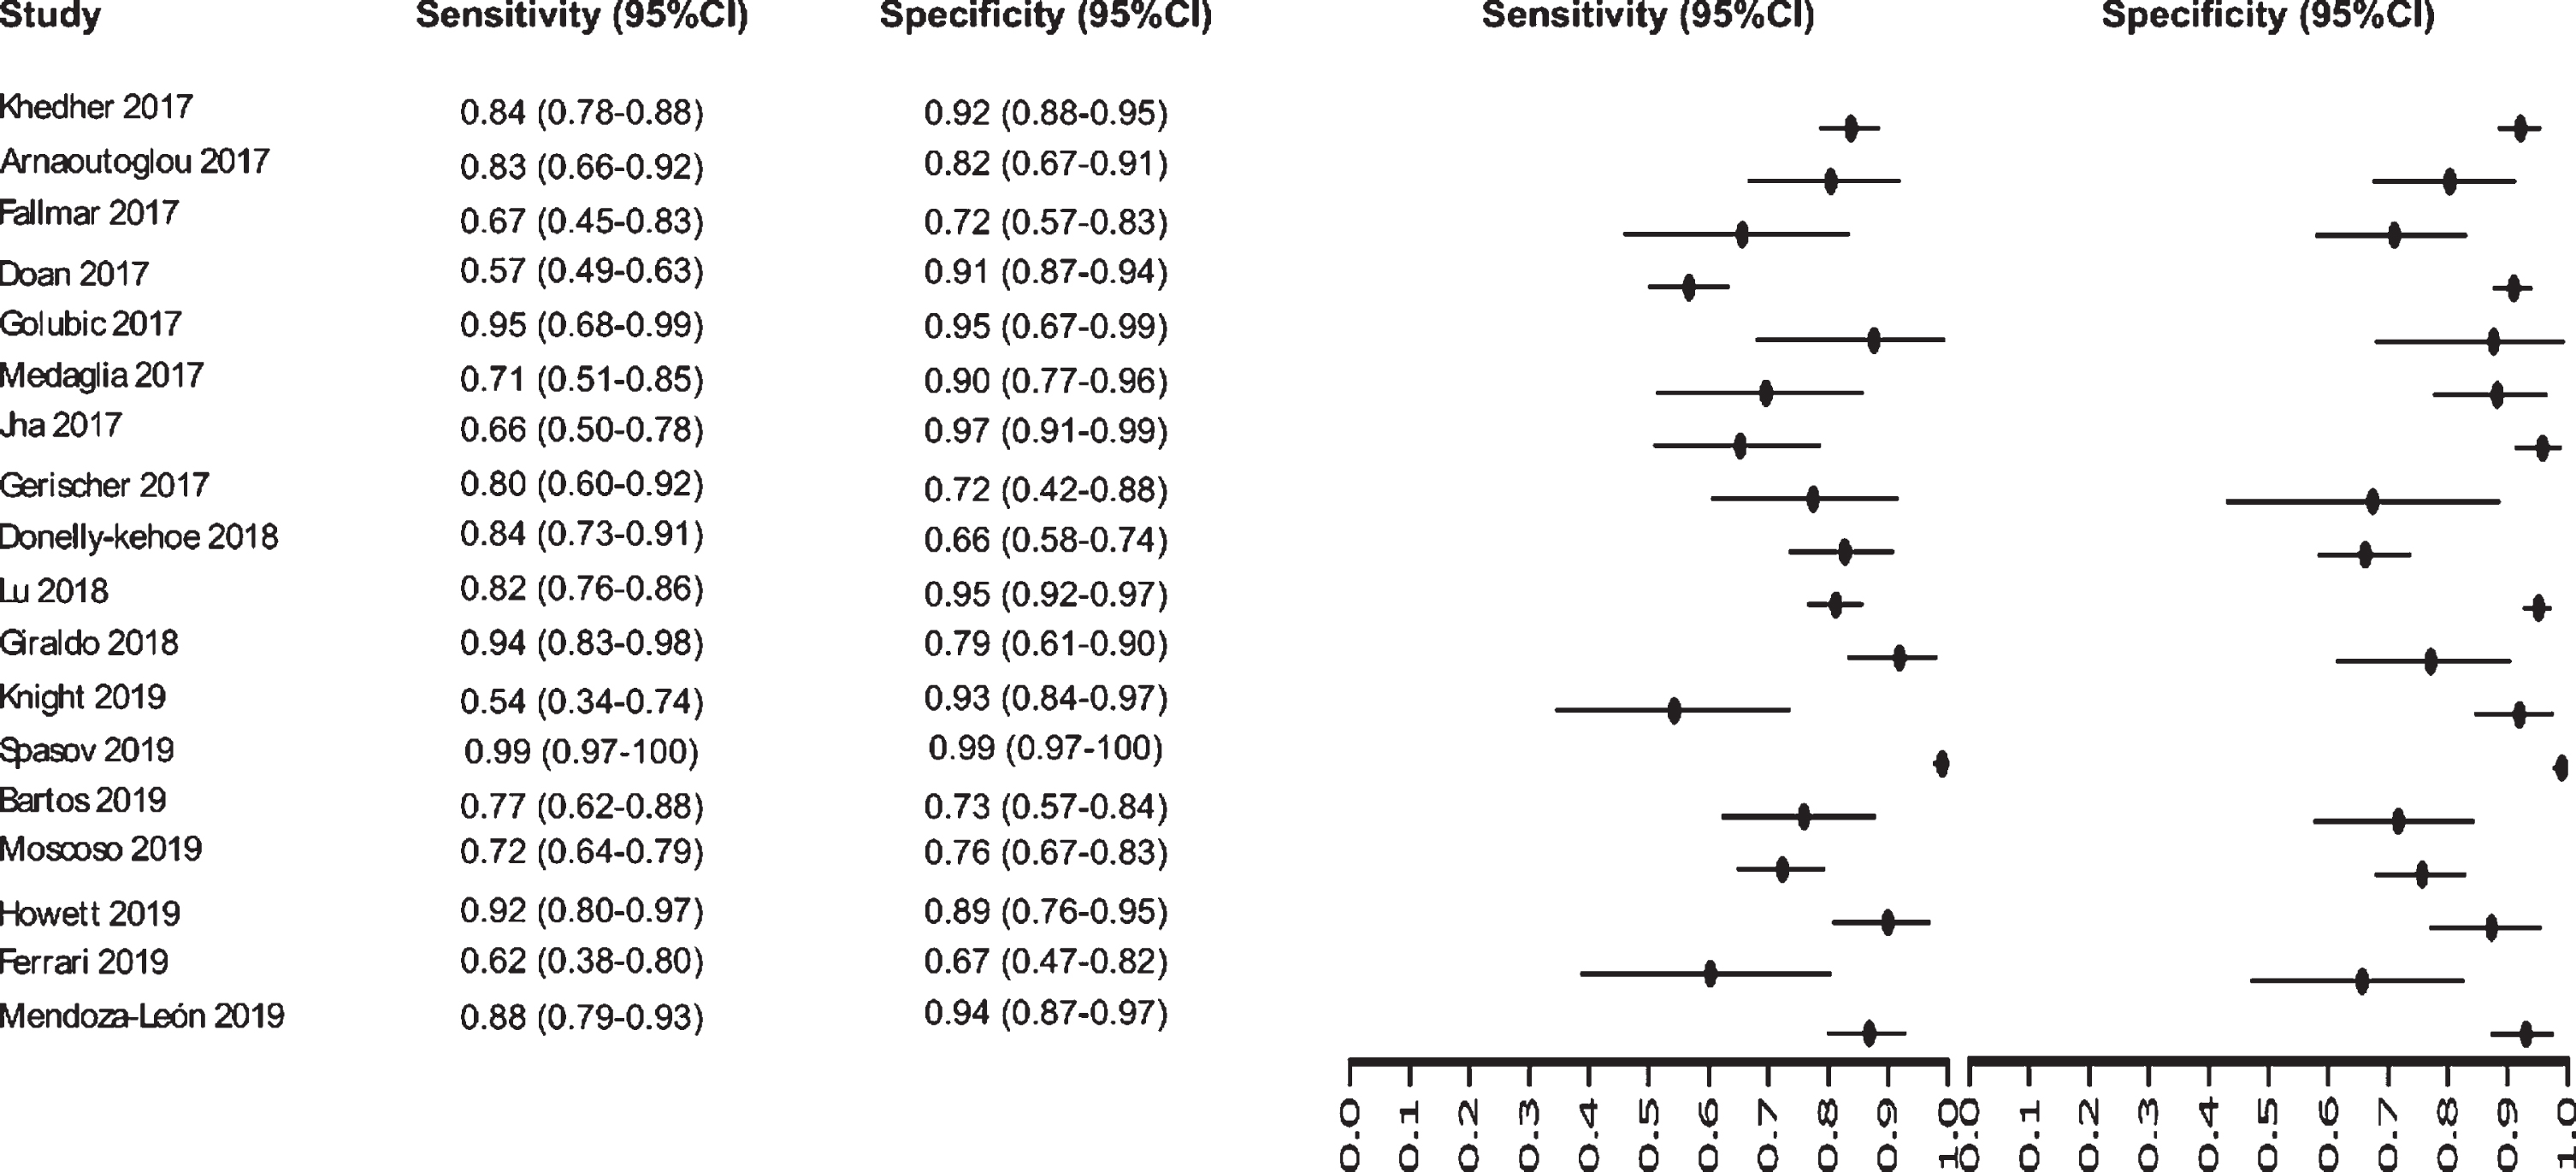
Fig. 8
Study data and paired forest plot of the sensitivity and specificity of MRI in Alzheimer’s disease diagnosis (from 2017 to 2019). Data from each study are summarized. Sensitivity and specificity are reported with a mean (95% confidence limits). Forest plot depicts the estimated sensitivity and specificity (black circles) and its 95% confidence limits (horizontal black line).
Summary ROC curves (sROC)
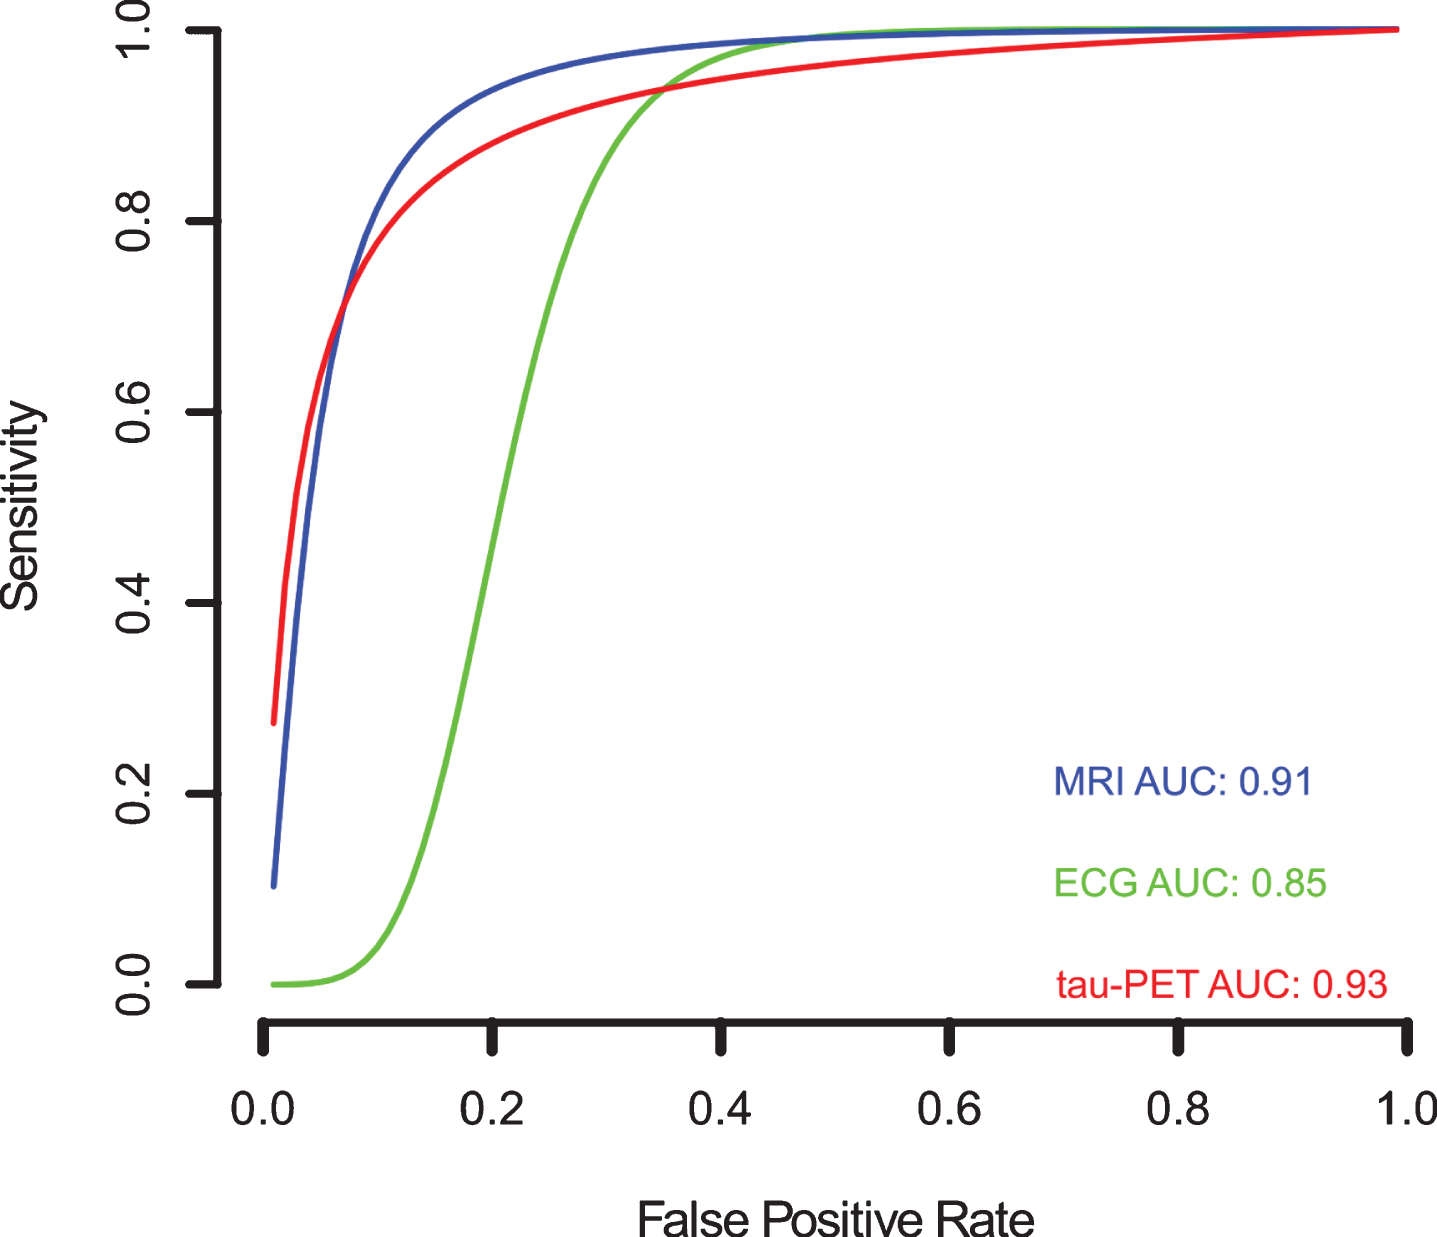
Since variation in the cut-off points of the tests, implicit or explicit variations in the studies, which can generate sensitivity and specificity differences, the sROC curve analysis was chosen to compare the data regarding EEG, tau-PET, and MRI biomarkers (Fig. 9). The calculated area under de curve (AUC) for EEG (AUC: 0.85), tau-PET (AUC: 0.93), and MRI (AUC: 0.91) suggests a better performance for the tau-PET diagnostic biomarker. Even when the AUC was calculated restricted to observed False Positive Rates (FPRs) and normalized, the data showed an AUC of 0.75, 0.87, and 0.82 for EEG, tau-PET and MRI, respectively, confirming tau-PET slightly better performance (Fig. 9).
Fig. 9
Meta-analysis of diagnostic test accuracy analysis. Summary receiver operating curve (sROC) plot of false positive rate and sensitivity. EEG studies are indicated by green crosses, while tau-PET studies are indicated by open red triangles, and MRI studies are indicated by open blue circles. Curved lines indicate the summary performance curves estimated by sROC statistics for each biomarker. For EEG in green (N = 13), for tau-PET in red (N = 07), and for MRI in red (N = 61).
DISCUSSION
Developing countries (e.g., Asian, African, and South American countries) face certain unique problems such as prevalent poverty, tropical diseases, infectious diseases, and poor infrastructure, which ensures that the population maintains dismal rates of adult literacy and conditions of general deprivation at-large. It has been estimated that Population-Attributable Risk (PAR; 19.1%, 95% confidence interval 12.3–25.6) has been reported highest in countries with low educational achievement and with poor physical. Developing nations have higher PAR due to low access to educational programs and developed countries have high PAR due to poor physical activity in their population. The PAR% is used to predict the impact of public health interventions on adverse outcomes, since it considers both the excess risk associated with the exposure and the proportion of the population that is exposed. Thus, with these socio-economically factors with physiologically complementary ultra-high PAR clusters, there are more chances that an AD epidemic could be unavoidable in the developing world in near future [113].
The diagnosis of AD is complicated by the fact that there is likely an apparent dynamic and overlapping “continuum” between AD and aging, which can be identified through biomarkers and neuropathological findings. The diagnostic biomarkers, described here, have been shown to be helpful in diagnosing AD; but some of these methods are very expensive (PET), some need personnel with high expertise to evaluate the findings (MRI), or are invasive (CSF). For these reasons, some of the diagnostic biomarkers are less assessable in poor or developing countries. Thus, harmonization of screening methods worldwide could help to define risks and to devise novel approaches for dementia prevention. In this sense, the need for diagnostic biomarkers that can be applied more widely is of high importance and extensive investigations have been done to discover plasma or serum biomarkers for AD; however, currently there are no valid biomarkers for AD diagnosis in blood [114, 115]. AD incidences are bound to increase in the developing world in contingent with the aging population. It has been shown that the data from developing countries suggest that age-adjusted AD prevalence estimates in 65-year-olds are high (≥5%) in certain Asian and Latin American countries, but consistently low (1–3%) in India and sub-Saharan Africa [113–116].
Regarding the results, CSF is considered a better source for biomarker discovery. Thereby, three CSF biomarkers, including Aβ42, total-tau (t-tau), and phosphorylated-tau (p-tau), have been found to have the highest diagnostic potential [117]. However, CSF is invasive and potentially painful for the patient since it is obtained via lumbar puncture [118–119]. Amyloid-PET has an emerging role in the diagnosis and management of patients with AD and its use is grounded on the fact that the hallmark of AD is the histological detection of Aβ at postmortem autopsy [120]. Nevertheless, it was surprising that the number of studies selected for the CSF and amyloid-PET biomarkers were 1 and 2, respectively; making it impossible to perform the analysis of the data (at least 5 studies needed to for analysis with p value < 0.05). In this sense, with regards to CSF results, one explanation could be the few numbers of studies selected. While, the single MeSH terms “Alzheimer Disease”, “Sensitivity and Specificity” and “Cerebrospinal Fluid”; accounted for 18,509, 575,930, and 91,803 studies, respectively, combined in a search, only 20 studies were found to be published in the last thirty years.
EEG has been demonstrated as a reliable diagnostic tool in AD research [121]. Potentiated with contemporary statistical methods seems to be a reliable method to classify the clinical cases of cognitive impairment, although when the comorbidity is high this classification is not so well effective [122]. EEG may therefore be a valuable add-on in dementia assessment, as an early marker of brain synaptic disturbances due to the AD molecular neuropathology [123]. MRI is an integral part of the clinical assessment of patients with suspected AD and can provide informative biomarkers even before clinical symptoms are apparent or irreversible neuronal damage has occurred [124]. MRI is included in the diagnostic criteria for the most prevalent non-Alzheimer dementias, reflecting its value in differential diagnosis [125]. The accumulation of pathological misfolded tau protein is a common feature to a collective of neurodegenerative disorders known as tauopathies, in which AD is the most common [126]. Tau imaging using positron emission tomography (tau-PET) studies have provided evidence that tau-PET is more closely related to neurodegeneration diagnostic biomarkers than to the presence of Aβ [127]. Tau-PET accumulation links to clinical phenotype and better co-localized to glucose hypometabolism compared to amyloid-PET [128] and appears to provide valuable information earlier in therapeutic trials of AD than MRI [129]. Taking this into consideration, our data suggest a slight difference between the tau-PET and MRI in the diagnoses of AD in comparison to healthy controls. Furthermore, NFT pathology is strongly associated with cognitive impairment; tau-related biomarkers may work best before NFTs are prevalent, and it may therefore be crucial to identify persons who may be at the cusp of exhibiting tauopathies [130]. Recently, a tau-PET imaging diagnostic method, with a high sensitivity and moderate to high in specificity, was able to identify the underlying presence of NFTs [131].
In this study we aimed to analyze the last three decades of clinical studies on biomarkers used for the diagnosis of AD. There are certain inherent flaws associated with systematic review and meta-analysis, such as the location and selection of studies, heterogeneity, loss of information on important outcomes, inappropriate subgroup analyses, conflict with new experimental data, and duplication of publication [132]. Despite these flaws there is an increase in the usage of the meta-analysis to enhance diagnostic test accuracy in clinical studies. In our review, the main problem we determined was the heterogeneity between studies from developed versus developing countries. The major factors were clinical settings, and the methods used to estimate the sensitivity and specificity values, in the evaluation of the AD patients [133, 134].
Our meta-analysis results have highlighted that among the 84 studies analyzed, only a few were conducted on AD patients from developing countries; for example, 7 studies were carried out in Brazil (Latin America), 4 in China, 3 in Poland, 2 in Turkey, and 1 in Iran and Taiwan each. In contrast, developed nations like the US had 31 studies, Canada had 17 studies, France had 9 studies, and the UK had 7 studies. These findings suggest that a proportionally small part of the data regarding AD diagnosis are reflected from developing nations, a fact that could hamper the global prevalence of AD. Furthermore, a recent study suggests that there are major gaps in geographical representation for many risk factors for AD and data from non-European and non-North American continents, which have not been reported. Additionally, evidence from Australia/Oceania or Africa was limited and that, except for diabetes, data were unavailable from Latin America/Caribbean [135]. As a consequence of lack of funding in research, cutting-edge technology is inaccessible, due to that only a handful of developing countries (e.g., Brazil from Latin America, India and China from Asia, and South Africa from Africa) publishes their work and managed to publish in high impact journals with valuable research publications [9, 10].
Given the socioeconomic and financial disparity in the developed (US, UK) versus developing countries (Latin America, Asian, and African countries), there is an urgent need to fund the studies for the growth in the burden of AD, particularly among minority populations, and culturally subtypes groups (having different food habits and lifestyles) should be of paramount importance. Therefore, by reducing poverty and improving the quality of education and lifestyle might contribute to achieving a better living in old age for the rapidly aging population of the developing world. Thus, a blood-based biomarker would enable a more rapid and inexpensive screening of potential participants, particularly for prevention trials for AD [136]. In this way, we suggest improving study design standards, to avoid poorness of reporting, analysis, and presentation of results; and we encourage developing countries scientist to perform studies with local subjects, studies comparing classic biomarkers and new diagnostic tools for the diagnosis of AD.
The impact of AD in developing countries deserves further epidemiological and implementation research to enable early detection, widespread adequate treatment, and caregiver support. Refining the policy agenda, increasing the health care policies and scientific grants will promote greater awareness and lead to better management of the disease.
CONFLICT OF INTEREST
The authors have no conflict of interest to report.
ACKNOWLEDGMENTS
This study was supported by the Consejo Nacional de Ciencia, Tecnología e Innovación y Tecnología (CONCYTEC) and the Fondo Nacional de Desarrollo Científico, Tecnológico y de Innovación Tecnológica de Peru (FONDECYT). Contract Nr. 24-2019. We would like to thank Dr. Máximo Rondon and Dra Karina Rosas and the Vicerrectorado de investigacion for providing substantial support to the Laboratory of Genomics and Neurovascular Diseases to carry out this work.
SUPPLEMENTARY MATERIAL
[1] The supplementary material is available in the electronic version of this article: https://dx.doi.org/10.3233/ADR-200263.
REFERENCES
[1] | Alzheimer’s Association ((2016) ) 2016 Alzheimer’s disease facts and figures, Alzheimers Dement 12: , 459–509. |
[2] | Etindele-Sosso FA , Raouafi S ((2016) ) Appropriate sleep duration and physical activity modulate cognitive improvement, J Sleep Disor Treat Care 5: , 4. |
[3] | Alzheimer’s Disease International (2019) World Alzheimer Report 2019: Attitudes to dementia. Alzheimer’s Disease International, London. |
[4] | Hebert LE , Weuve J , Scherr PA , Evans DA ((2013) ) Alzheimer disease in the United States (2010-2050) estimated using the 2010 census, Neurology 80: , 1778–1783. |
[5] | Brookmeyer R , Abdalla N , Kawas CH , Corrada MM ((2018) ) Forecasting the prevalence of preclinical and clinical Alzheimer’s disease in the United States, Alzheimers Dement 14: , 121–129. |
[6] | Matthews KA , Xu W , Gaglioti AH , Holt JB , Croft JB , Mack D , McGuire LC ((2019) ) Racial and ethnic estimates of Alzheimer’s disease and related dementias in the United States (2015-2060) in adults aged≥65 years, Alzheimers Dement 15: , 17–24. |
[7] | Hurd MD , Martorell P , Delavande A , Mullen KJ , Langa KM ((2013) ) Monetary costs of dementia in the United States, N Engl J Med 368: , 1326–1334. |
[8] | Etindele-Sosso FA , Nakamura O , Nakamura M ((2017) ) Epidemiology of Alzheimer’s disease: Comparison between Africa and South America, J Neurol Neurosci 8: , 204. |
[9] | Cummings JL , Atri A , Ballard C , Boneva N , Frölich L , Molinuevo JL , Raket LL , Tariot PN ((2018) ) Insights into globalization: Comparison of patient characteristics and disease progression among geographic regions in a multinational Alzheimer’s disease clinical program, Alzheimers Res Ther 10: , 116. |
[10] | Custodio N , Wheelock A , Thumala D , Slachevsky A ((2017) ) Dementia in Latin America: Epidemiological evidence and implications for public policy, Front Aging Neurosci 13: , 221. |
[11] | Nitrini R , Bottino CMC , Albala C , Custodio-Capuñay NS , Ketzoian C , Maestre GE , Ramos-Cerqueira AT , Caramelli P ((2009) ) Prevalence of dementia in Latin America: A collaborative study of population-based cohorts, Int Psychogeriatr 21: , 622–630. |
[12] | Rodríguez JJL , Ferri CP , Acosta D , Guerra M , Huang Y , Jacob KS , Krishnamoorthy ES , Salas A , Sosa AL , Acosta I , Dewey ME , Gaona C , Jotheeswaran AT , Li S , Rodriguez D , Rodriguez G , Kumar PS , Valhuerdi A , Prince M ; 10/66 Dementia Research Group ((2008) ) Prevalence of dementia in Latin America, India, and China: A population-based cross-sectional survey, Lancet 372: , 464–474. |
[13] | McKhann G , Drachman D , Folstein M , Katzman R , Price D , Stadlan EM ((1984) ) Clinical Diagnosis of Alzheimer’s Disease: Report of the NINCDS-ADRDA Work Group Under the Auspices of Department of Health and Human Services Task Force on Alzheimer’s Disease, Neurology 34: , 939–944. |
[14] | Dubois B , Feldman HH , Jacova C , DeKosky ST , Barberger-Gateau P , Cummings J , Delacourte A , Galasko D , Gauthier S , Jicha G , Meguro K , O’brien J , Pasquier F , Robert P , Rossor M , Salloway S , Stern Y , Visser PJ , Scheltens P ((2007) ) Research criteria for the diagnosis of Alzheimer’s disease: Revising the NINCDS-ADRDA criteria, Lancet Neurol 6: , 734–746. |
[15] | Rajan KB , Wilson RS , Weuve J , Barnes LL , Evans DA ((2015) ) Cognitive impairment 18 years before clinical diagnosis of Alzheimer disease dementia, Neurology 85: , 898–904. |
[16] | Barthélemy NR , Li Y , Joseph-Mathurin N , Gordon BA , Hassenstab J , Benzinger TLS , Buckles V , Fagan AM , Perrin RJ , Goate AM , Morris JC , Karch CM , Xiong C , Allegri R , Mendez PC , Berman SB , Ikeuchi T , Mori H , Shimada H , Shoji M , Suzuki K , Noble J , Farlow M , Chhatwal J , Graff-Radford NR , Salloway S , Schofield PR , Masters CL , Martins RN , O’Connor A , Fox NC , Levin J , Jucker M , Gabelle A , Lehmann S , Sato C , Bateman RJ , McDade E ; Dominantly Inherited Alzheimer Network ((2020) ) A soluble phosphorylated tau signature links tau, amyloid and the evolution of stages of dominantly inherited Alzheimer’s disease, Nat Med 26: , 398–407. |
[17] | Janelidze S , Mattsson N , Palmqvist S , Smith R , Beach TG , Serrano GE , Chai X , Proctor NK , Eichenlaub U , Zetterberg H , Blennow K , Reiman EM , Stomrud E , Dage JL , Hansson O ((2020) ) Plasma P-tau181 in Alzheimer’s disease: Relationship to other biomarkers, differential diagnosis, neuropathology and longitudinal progression to Alzheimer’s dementia, Nat Med 26: , 379–386. |
[18] | Blennow K ((2010) ) Biomarkers in Alzheimer’s disease drug development, Nat Med 16: , 1218–1222. |
[19] | Khoury R , Ghossoub E ((2019) ) Diagnostic biomarkers of Alzheimer’s disease: A state-of-the-art review, Biomark Neuropsychiatry 1: , 100005. |
[20] | Fagan AM ((2014) ) CSF biomarkers of Alzheimer’s disease: Impact on disease concept, diagnosis, and clinical trial design, Adv Geriatr 2014: , 1–14. |
[21] | Del Sole A , Malaspina S , Biasina AM ((2016) ) Magnetic resonance imaging and positron emission tomography in the diagnosis of neurodegenerative dementias, Funct Neurol 31: , 205–215. |
[22] | Maturana-Candelas A , Gómez C , Poza J , Pinto N , Hornero R ((2019) ) EEG characterization of the Alzheimer’s disease continuum by means of multiscale entropies, Entropy 21: , 1–15. |
[23] | Jack CR , Bennett DA , Blennow K , Carrillo MC , Dunn B , Haeberlein SB , Holtzman DM , Jagust W , Jessen F , Karlawish J , Liu E , Molinuevo JL , Montine T , Phelps C , Rankin KP , Rowe CC , Scheltens P , Siemers E , Snyder HM , Sperling R ((2018) ) NIA-AA Research Framework: Toward a biological definition of Alzheimer’s disease, Alzheimers Dement 14: , 535–562. |
[24] | Rogers FB ((1963) ) Medical subject headings, Bull Med Libr Assoc 51: , 114–116. |
[25] | van Eck NJ , Waltman L ((2010) ) Software survey: VOSviewer, a computer program for bibliometric mapping, Scientometrics 84: , 523–538. |
[26] | Kim KW , Lee JY , Choi SH , Huh J , Park SH ((2015) ) Systematic review and meta-analysis of studies evaluating diagnostic test accuracy: A practical review for clinical researchers-Part I. General guidance and tips, Korean J Radiol 16: , 1175–1187. |
[27] | Doebler P , Holling H ((2012) ) Meta-analysis of diagnostic accuracy with mada. |
[28] | Shim SR , Kim SJ , Lee J ((2019) ) Diagnostic test accuracy: Application and practice using R software, Epidemiol Health 41: , e2019007. |
[29] | Lewczuk P , Esselmann H , Otto M , Maler JM , Henkel AW , Henkel MK , Eikenberg O , Antz C , Krause WR , Reulbach U , Kornhuber J , Wiltfang J ((2004) ) Neurochemical diagnosis of Alzheimer’s dementia by CSF Abeta42, Abeta42/Abeta40 ratio and total tau, Neurobiol Aging 25: , 273–281. |
[30] | Ben Bouallègue F , Mariano-Goulart D , Payoux P ; Alzheimer’s Disease Neuroimaging Initiative (ADNI) ((2017) ) Comvon of CSF markers and semi-quantitative amyloid PET in Alzheimer’s disease diagnosis and in cognitive impairment prognosis using the ADNI-2 database, Alzheimers Res Ther 9: , 32. |
[31] | Landau SM , Harvey D , Madison CM , Reiman EM , Foster NL , Aisen PS , Petersen RC , Shaw LM , Trojanowski JQ , Jack CR Jr , Weiner MW , Jagust WJ ; Alzheimer’s Disease Neuroimaging Initiative ((2010) ) Comparing predictors of conversion and decline in mild cognitive impairment, Neurology 75: , 230–238. |
[32] | Engedal K , Snaedal J , Hoegh P , Jelic V , Bo Andersen B , Naik M , Wahlund LO , Oeksengaard AR ((2015) ) Quantitative EEG applying the statistical recognition pattern method: A useful tool in dementia diagnostic workup, Dement Geriatr Cogn Disord 40: , 1–12. |
[33] | Lizio R , Del Percio C , Marzano N , Soricelli A , Yener GG , Basa̧r E , Mundi C , De Rosa S , Triggiani AI , Ferri R , Arnaldi D , Nobili FM , Cordone S , Lopez S , Carducci F , Santi G , Gesualdo L , Rossini PM , Cavedo E , Mauri M , Frisoni GB , Babiloni C ((2015) ) Neurophysiological assessment of Alzheimer’s disease individuals by a single electroencephalographic marker, J Alzheimers Dis 49: , 159–177. |
[34] | Houmani N , Dreyfus G , Vialatte FB ((2015) ) Epoch-based entropy for early screening of Alzheimer’s disease, Int J Neural Syst 25: , 1–18. |
[35] | Stylianou M , Murphy N , Peraza LR , Graziadio S , Cromarty R , Killen A , O’ Brien JT , Thomas AJ , LeBeau FEN , Taylor JP ((2018) ) Quantitative electroencephalography as a marker of cognitive fluctuations in dementia with Lewy bodies and an aid to differential diagnosis, Clin Neurophysiol 129: , 1209–1220. |
[36] | da Silva Lopes HF , Abe JM , Anghinah R ((2010) ) Application of paraconsistent artificial neural networks as a method of aid in the diagnosis of Alzheimer disease, J Med Syst 34: , 1073–1081. |
[37] | Trambaiolli LR , Lorena AC , Fraga FJ , Kanda PAM , Anghinah R , Nitrini R ((2011) ) Improving Alzheimer’s disease diagnosis with machine learning techniques, Clin EEG Neurosci 42: , 160–165. |
[38] | Juckel G , Clotz F , Frodl T , Kawohl W , Hampel H , Pogarell O , Hegerl U ((2008) ) Diagnostic usefulness of cognitive auditory event-related p300 subcomponents in patients with Alzheimer’s disease? J Clin Neurophysiol 25: , 147–52. |
[39] | Haan WD , Stam CJ , F Jones BF , Zuiderwijk IM , van Dijk BW , Scheltens P ((2008) ) Resting-state oscillatory brain dynamics in Alzheimer disease, J Clin Neurophysiol 25: , 187–193. |
[40] | Abásolo D , Hornero R , Escudero J , Espino P ((2008) ) A study on the possible usefulness of detrended fluctuation analysis of the electroencephalogram background activity in Alzheimer’s disease, IEEE Trans Biomed Eng 55: , 2171–2179. |
[41] | Fernández A , Hornero R , Mayo A , Poza J , Maestú F , Alonso TO ((2006) ) Quantitative magneto-encephalo-graphy of spontaneous brain activity in Alzheimer disease: An exhaustive frequency analysis, Alzheimer Dis Assoc Disord 20: , 153–159. |
[42] | Claus JJ , Strijers RL , Jonkman EJ , Ongerboer de Visser BW , Jonker C , Walstra GJ , Scheltens P , van Gool WA ((1999) ) The diagnostic value of electroencephalography in mild senile Alzheimer’s disease, Clin Neurophysiol 110: , 825–32. |
[43] | Ihl R , Brinkmeyer J , Jänner M , Kerdar MS ((2000) ) A comparison of ADAS and EEG in the discrimination of patients with dementia of the Alzheimer type from healthy controls, Neuropsychobiology 41: , 102–107. |
[44] | Petrosian AA , Prokhorov DV , Lajara-Nanson W , Schiffer RB ((2001) ) Recurrent neural network-based approach for early recognition of Alzheimer’s disease in EEG, Clin Neurophysiol 112: , 1378–1387. |
[45] | Apostolova LG , Hwang KS , Avila D , Elashoff D , Kohannim O , Teng E , Sokolow S , Jack CR , Jagust WJ , Shaw L , Trojanowski JQ , Weiner MW , Thompson PM ((2015) ) Brain amyloidosis ascertainment from cognitive, imaging, and peripheral blood protein measures, Neurology 84: , 729–737. |
[46] | Kaneko N , Nakamura A , Washimi Y , Kato T , Sakurai T , Arahata Y , Bundo M , Takeda A , Niida S , Ito K , Toba K , Tanaka K , Yanagisawa K ((2014) ) Novel plasma biomarker surrogating cerebral amyloid deposition, Proc Japan Acad Ser B Phys Biol Sci 90: , 353–364. |
[47] | Kerbage C , Sadowsky CH , Tariot PN , Agronin M , Alva G , Turner FD , Nilan D , Cameron A , Cagle GD , Hartung PD ((2015) ) Detection of amyloid β signature in the lens and its correlation in the brain to aid in the diagnosis of Alzheimer’s disease, Am J Alzheimers Dis Other Demen 30: , 738–745. |
[48] | Ossenkoppele R , Rabinovici GD , Smith R , Cho H , Scholl M , Strandberg O , Palmqvist S , Mattsson N , Janelidze S , Santillo A , Ohlsson T , Jogi J , Tsai R , La Joie R , Kramer J , Boxer AL , Gorno-Tempini ML , Miller BL , Choi JY , Ryu YH , Lyoo CH , Hansson O ((2018) ) Discriminative accuracy of [18F]flortaucipir positron emission tomography for Alzheimer disease vs other neurodegenerative disorders, JAMA 320: , 1151–1162. |
[49] | Ottoy J , Niemantsverdriet E , Verhaeghe J , De Roeck E , Struyfs H , Somers C , wyffels L , Ceyssens S , Van Mossevelde S , Van den Bossche T , Van Broeckhoven C , Ribbens A , Bjerke M , Stroobants S , Engelborghs S , Staelens S ((2019) ) Association of short-term cognitive decline and MCI-to-AD dementia conversion with CSF, MRI, amyloid- and 18 F-FDG-PET imaging, Neuroimage Clin 22: , 101771. |
[50] | Thurfjell L , Lilja J , Lundqvist R , Buckley C , Smith A , Vandenberghe R , Sherwin P ((2014) ) Automated quantification of 18F-flutemetamol PET activity for categorizing scans as negative or positive for brain amyloid: Concordance with visual image reads, J Nucl Med 55: , 1623–1628. |
[51] | Tiepolt S , Barthel H , Butzke D , Hesse S , Patt M , Gertz H-J , Reininger C , Sabri O ((2013) ) Influence of scan duration on the accuracy of β-amyloid PET with florbetaben in patients with Alzheimer’s disease and healthy volunteers, Eur J Nucl Med Mol Imaging 40: , 238–244. |
[52] | Aguilar C , Westman E , Muehlboeck J-S , Mecocci P , Vellas B , Tsolaki M , Kloszewska I , Soininen H , Lovestone S , Spenger C , Simmons A , Wahlund L-O ((2013) ) Different multivariate techniques for automated classification of MRI data in Alzheimer’s disease and mild cognitive impairment, Psychiatry Res 212: , 89–98. |
[53] | Arnaoutoglou NA , Arnaoutoglou M , Nemtsas P , Costa V , Baloyannis SJ , Ebmeier KP ((2017) ) Color perception differentiates Alzheimer’s disease (AD) from vascular dementia (VaD) patients, Int Psychogeriatr 29: , 1355–1361. |
[54] | Balthazar MLF , de Campos BM , Franco AR , Damasceno BP , Cendes F ((2014) ) Whole cortical and default mode network mean functional connectivity as potential biomarkers for mild Alzheimer’s disease, Psychiatry Res Neuroimaging 221: , 37–42. |
[55] | Bartos A , Gregus D , Ibrahim I , Tintěra J ((2019) ) Brain volumes and their ratios in Alzheimer's disease on magnetic resonance imaging segmented using Freesurfer 6.0, Psychiatry Res Neuroimaging 287: , 70–74. |
[56] | Ben Ahmed O , Mizotin M , Benois-Pineau J , Allard M , Catheline G , Ben Amar C ((2015) ) Alzheimer’s disease diagnosis on structural MR images using circular harmonic functions descriptors on hippocampus and posterior cingulate cortex, Comput Med Imaging Graph 44: , 13–25. |
[57] | Besga A , Chyzhyk D , González-Ortega I , Savio A , Ayerdi B , Echeveste J , Graña M , González-Pinto A ((2016) ) Eigenanatomy on fractional anisotropy imaging provides white matter anatomical features discriminating between Alzheimer’s disease and late onset bipolar disorder, Curr Alzheimer Res 13: , 557–565. |
[58] | Bottino CMC , Castro CC , Gomes RLE , Buchpiguel CA , Marchetti RL , Neto MRL ((2002) ) Volumetric MRI measurements can differentiate Alzheimer’s disease, mild cognitive impairment, and normal aging, Int Psychogeriatr 14: , 59–72. |
[59] | Chang Y-T , Chang C-C , Lin H-S , Huang C-W , Chang W-N , Lui C-C , Lee C-C , Lin Y-T , Chen C-H , Chen N-C ((2012) ) Montreal Cognitive Assessment in assessing clinical severity and white matter hyperintensity in Alzheimer’s disease with normal control comparison, Acta Neurol Taiwan 21: , 64–73. |
[60] | Chaves ML , Ilha D , Maia AL , Motta E , Lehmen R , Oliveira LM ((1999) ) Diagnosing dementia and normal aging: Clinical relevance of brain ratios and cognitive performance in a Brazilian sample, Brazilian J Med Biol Res 32: , 1133–1143. |
[61] | Colliot O , Chételat G , Chupin M , Desgranges B , Magnin B , Benali H , Dubois B , Garnero L , Eustache F , Lehéricy S ((2008) ) Discrimination between Alzheimer disease, mild cognitive impairment, and normal aging by using automated segmentation of the hippocampus, Radiology 248: , 194–201. |
[62] | Doan NT , Engvig A , Zaske K , Persson K , Lund MJ , Kaufmann T , Cordova-Palomera A , Alnæs D , Moberget T , Brækhus A , Barca ML , Nordvik JE , Engedal K , Agartz I , Selbæk G , Andreassen OA , Westlye LT ((2017) ) Distinguishing early and late brain aging from the Alzheimer’s disease spectrum: Consistent morphological patterns across independent samples, Neuroimage 158: , 282–295. |
[63] | Donnelly-Kehoe PA , Pascariello GO , Gómez JC ((2018) ) Looking for Alzheimer’s Disease morphometric signatures using machine learning techniques, J Neurosci Methods 302: , 24–34. |
[64] | Fällmar D , Haller S , Lilja J , Danfors T , Kilander L , Tolboom N , Egger K , Kellner E , Croon PM , Verfaillie SCJ , van Berckel BNM , Ossenkoppele R , Barkhof F , Larsson E-M ((2017) ) Arterial spin labeling-based Z-maps have high specificity and positive predictive value for neurodegenerative dementia compared to FDG-PET, Eur Radiol 27: , 4237–4246. |
[65] | Farhan S , Fahiem MA , Tauseef H ((2014) ) An ensemble-of-classifiers based approach for early diagnosis of Alzheimer’s disease: Classification using structural features of brain images, Comput Math Methods Med 2014: , 862307. |
[66] | Ferrari BL , Neto G de CC , Nucci MP , Mamani JB , Lacerda SS , Felício AC , Amaro EJ , Gamarra LF ((2019) ) The accuracy of hippocampal volumetry and glucose metabolism for the diagnosis of patients with suspected Alzheimer’s disease, using automatic quantitative clinical tools, Medicine (Baltimore) 98: , e17824. |
[67] | Frisoni GB , Beltramello A , Weiss C , Geroldi C , Bianchetti A , Trabucchi M ((1996) ) Linear measures of atrophy in mild Alzheimer disease, AJNR Am J Neuroradiol 17: , 913–923. |
[68] | Fritzsche KH , von Wangenheim A , Abdala DD , Meinzer H-P ((2008) ) A computational method for the estimation of atrophic changes in Alzheimer’s disease and mild cognitive impairment, Comput Med Imaging Graph 32: , 294–303. |
[69] | Gerardin E , Chételat G , Chupin M , Cuingnet R , Desgranges B , Kim H-S , Niethammer M , Dubois B , Lehéricy S , Garnero L , Eustache F , Colliot O ((2009) ) Multidimensional classification of hippocampal shape features discriminates Alzheimer’s disease and mild cognitive impairment from normal aging, Neuroimage 47: , 1476–1486. |
[70] | Gerischer LM , Fehlner A , Köbe T , Prehn K , Antonenko D , Grittner U , Braun J , Sack I , Flöel A ((2018) ) Combining viscoelasticity, diffusivity and volume of the hippocampus for the diagnosis of Alzheimer’s disease based on magnetic resonance imaging, Neuroimage Clin 18: , 485–493. |
[71] | Giraldo DL , García-Arteaga JD , Cárdenas-Robledo S , Romero E ((2018) ) Characterization of brain anatomical patterns by comparing region intensity distributions: Applications to the description of Alzheimer’s disease, Brain Behav 8: , e00942. |
[72] | Golebiowski M , Barcikowska M , Pfeffer A ((1999) ) Magnetic resonance imaging-based hippocampal volumetry in patients with dementia of the Alzheimer type, Dement Geriatr Cogn Disord 10: , 284–288. |
[73] | Graña M , Termenon M , Savio A , Gonzalez-Pinto A , Echeveste J , Pérez JM , Besga A ((2011) ) Computer aided diagnosis system for Alzheimer disease using brain diffusion tensor imaging features selected by Pearson’s correlation, Neurosci Lett 502: , 225–229. |
[74] | Guo X , Chen K , Zhang Y , Wang Y , Yao L ((2014) ) Regional covariance patterns of gray matter alterations in Alzheimer’s disease and its replicability evaluation, J Magn Reson Imaging 39: , 143–149. |
[75] | Guo X , Han Y , Chen K , Wang Y , Yao L ((2012) ) Mapping joint grey and white matter reductions in Alzheimer’s disease using joint independent component analysis, Neurosci Lett 531: , 136–141. |
[76] | Gutman B , Wang Y , Morra J , Toga AW , Thompson PM ((2009) ) Disease classification with hippocampal shape invariants, Hippocampus 19: , 572–578. |
[77] | Howett D , Castegnaro A , Krzywicka K , Hagman J , Marchment D , Henson R , Rio M , King JA , Burgess N , Chan D ((2019) ) Differentiation of mild cognitive impairment using an entorhinal cortex-based test of virtual reality navigation, Brain 142: , 1751–1766. |
[78] | Ishii K , Kanda T , Harada A , Miyamoto N , Kawaguchi T , Shimada K , Ohkawa S , Uemura T , Yoshikawa T , Mori E ((2008) ) Clinical impact of the callosal angle in the diagnosis of idiopathic normal pressure hydrocephalus, Eur Radiol 18: , 2678–2683. |
[79] | Jha D , Kim JI , Kwon GR ((2017) ) Diagnosis of Alzheimer’s disease using dual-tree complex wavelet transform, PCA, and feed-forward neural network, J Healthc Eng 2017: , 9060124. |
[80] | Josef Golubic S , Aine CJ , Stephen JM , Adair JC , Knoefel JE , Supek S ((2017) ) MEG biomarker of Alzheimer’s disease: Absence of a prefrontal generator during auditory sensory gating, Hum Brain Mapp 38: , 5180–5194. |
[81] | Kaneko T , Kaneko K , Matsushita M , Kadoya M , Ihara N , Ryokawa A , Ogihara T , Inuzuka S , Ueda H ((2012) ) New visual rating system for medial temporal lobe atrophy: A simple diagnostic tool for routine examinations, Psychogeriatrics 12: , 88–92. |
[82] | Khedher L , Illán IA , Górriz JM , Ramírez J , Brahim A , Meyer-Baese A ((2017) ) Independent component analysis-support vector machine-based computer-aided diagnosis system for Alzheimer’s with visual support, Int J Neural Syst 27: , 1650050. |
[83] | Knight MJ , Wearn A , Coulthard E , Kauppinen RA ((2019) ) T2 relaxometry and diffusion tensor indices of the hippocampus and entorhinal cortex improve sensitivity and specificity of MRI to detect amnestic mild cognitive impairment and Alzheimer’s disease dementia, J Magn Reson Imaging 49: , 445–455. |
[84] | Lebedev AV , Westman E , Van Westen GJP , Kramberger MG , Lundervold A , Aarsland D , Soininen H , Kłoszewska I , Mecocci P , Tsolaki M , Vellas B , Lovestone S , Simmons A ((2014) ) Random Forest ensembles for detection and prediction of Alzheimer’s disease with a good between-cohort robustness, Neuroimage Clin 6: , 115–125. |
[85] | Lu D , Popuri K , Ding GW , Balachandar R , Beg MF ((2018) ) Multimodal and multiscale deep neural networks for the early diagnosis of Alzheimer’s disease using structural MR and FDG-PET images, Sci Rep 8: , 5697. |
[86] | Maas LC , Harris GJ , Satlin A , English CD , Lewis RF , Renshaw PF ((1997) ) Regional cerebral blood volume measured by dynamic susceptibility contrast MR imaging in Alzheimer’s disease: A principal components analysis, J Magn Reson Imaging 7: , 215–219. |
[87] | Magnin B , Mesrob L , Kinkingnéhun S , Pélégrini-Issac M , Colliot O , Sarazin M , Dubois B , Lehéricy S , Benali H ((2009) ) Support vector machine-based classification of Alzheimer’s disease from whole-brain anatomical MRI, Neuroradiology 51: , 73–83. |
[88] | Martínez-Torteya A , Treviño V , Tamez-Peña JG ((2015) ) Improved diagnostic multimodal biomarkers for Alzheimer’s disease and mild cognitive impairment, Biomed Res Int 2015: , 961314. |
[89] | Medaglia JD , Huang W , Segarra S , Olm C , Gee J , Grossman M , Ribeiro A , McMillan CT , Bassett DS ((2017) ) Brain network efficiency is influenced by the pathologic source of corticobasal syndrome, Neurology 89: , 1373–1381. |
[90] | Mendoza-Léon R , Puentes J , Uriza LF , Hernández Hoyos M ((2020) ) Single-slice Alzheimer’s disease classification and disease regional analysis with Supervised Switching Autoencoders, Comput Biol Med 116: , 103527. |
[91] | Mohammadian F , Noroozian M , Nafissi S , Fatehi F ((2015) ) Blink reflex may help discriminate Alzheimer disease from vascular dementia, J Clin Neurophysiol 32: , 505–511. |
[92] | Moscoso A , Silva-Rodríguez J , Aldrey JM , Cortés J , Fernández-Ferreiro A , Gómez-Lado N , Ruibal Á , Aguiar P ((2019) ) Prediction of Alzheimer’s disease dementia with MRI beyond the short-term: Implications for the design of predictive models, Neuroimage Clin 23: , 101837. |
[93] | Oishi K , Mielke MM , Albert M , Lyketsos CG , Mori S ((2012) ) The fornix sign: A potential sign for Alzheimer’s disease based on diffusion tensor imaging, J Neuroimaging 22: , 365–374. |
[94] | Pereira JB , Cavallin L , Spulber G , Aguilar C , Mecocci P , Vellas B , Tsolaki M , Kloszewska I , Soininen H , Spenger C , Aarsland D , Lovestone S , Simmons A , Wahlund LO , Westman E ((2014) ) Influence of age, disease onset and ApoE4 on visual medial temporal lobe atrophy cut-offs, J Intern Med 275: , 317–330. |
[95] | Polat F , Orhan Demirel S , Kitis O , Simsek F , Isman Haznedaroglu D , Coburn K , Kumral E , Saffet Gonul A ((2012) ) Computer based classification of MR scans in first time applicant Alzheimer patients, Curr Alzheimer Res 9: , 789–794. |
[96] | Pucci E , Belardinelli N , Regnicolo L , Nolfe G , Signorino M , Salvolini U , Angeleri F ((1998) ) Hippocampus and parahippocampal gyrus linear measurements based on magnetic resonance in Alzheimer’s disease, Eur Neurol 39: , 16–25. |
[97] | Raji CA , Lee C , Lopez OL , Tsay J , Boardman JF , Schwartz ED , Bartynski WS , Hefzy HM , Gach HM , Dai W , Becker JT ((2010) ) Initial experience in using continuous arterial spin-labeled MR imaging for early detection of Alzheimer disease, AJNR Am J Neuroradiol 31: , 847–855. |
[98] | Roquet D , Sourty M , Botzung A , Armspach J-P , Blanc F ((2016) ) Brain perfusion in dementia with Lewy bodies and Alzheimer’s disease: An arterial spin labeling MRI study on prodromal and mild dementia stages, Alzheimers Res Ther 8: , 29. |
[99] | Scheltens P , Launer LJ , Barkhof F , Weinstein HC , Jonker C ((1997) ) The diagnostic value of magnetic resonance imaging and technetium 99m-HMPAO single-photon-emission computed tomography for the diagnosis of Alzheimer disease in a community-dwelling elderly population, Alzheimer Dis Assoc Disord 11: , 63–70. |
[100] | Shonk TK , Moats RA , Gifford P , Michaelis T , Mandigo JC , Izumi J , Ross BD ((1995) ) Probable Alzheimer disease: Diagnosis with proton MR spectroscopy, Radiology 195: , 65–72. |
[101] | Spasov S , Passamonti L , Duggento A , Liò P , Toschi N ((2019) ) A parameter-efficient deep learning approach to predict conversion from mild cognitive impairment to Alzheimer’s disease, Neuroimage 189: , 276–287. |
[102] | Tang X , Qin Y , Wu J , Zhang M , Zhu W , Miller MI ((2016) ) Shape and diffusion tensor imaging based integrative analysis of the hippocampus and the amygdala in Alzheimer’s disease, Magn Reson Imaging 34: , 1087–1099. |
[103] | Tolboom N , van der Flier WM , Boverhoff J , Yaqub M , Wattjes MP , Raijmakers PG , Barkhof F , Scheltens P , Herholz K , Lammertsma AA , van Berckel BNM ((2010) ) Molecular imaging in the diagnosis of Alzheimer’s disease: Visual assessment of [11C]PIB and [18F]FDDNP PET images, J Neurol Neurosurg Psychiatry 81: , 882–884. |
[104] | Vasta R , Augimeri A , Cerasa A , Nigro S , Gramigna V , Nonnis M , Rocca F , Zito G , Quattrone A , Initiative FTADN ((2016) ) Hippocampal subfield atrophies in converted and not-converted mild cognitive impairments patients by a Markov random fields algorithm, Curr Alzheimer Res 13: , 566–574. |
[105] | Vemuri P , Simon G , Kantarci K , Whitwell JL , Senjem ML , Przybelski SA , Gunter JL , Josephs KA , Knopman DS , Boeve BF , Ferman TJ , Dickson DW , Parisi JE , Petersen RC , Jack CRJ ((2011) ) Antemortem differential diagnosis of dementia pathology using structural MRI: Differential-STAND, Neuroimage 55: , 522–531. |
[106] | Wahlund LO , Julin P , Johansson SE , Scheltens P ((2000) ) Visual rating and volumetry of the medial temporal lobe on magnetic resonance imaging in dementia: A comparative study, J Neurol Neurosurg Psychiatry 69: , 630–635. |
[107] | Wang H , Shu L , Xie J , Zhang H , Zhang D ((2004) ) Diagnostic utility of neuropsychological performance and quantitative MRI-based measurement in Alzheimer disease, Alzheimer Dis Assoc Disord 18: , 163–170. |
[108] | Watanabe T , Shiino A , Akiguchi I ((2008) ) Absolute quantification in proton magnetic resonance spectroscopy is superior to relative ratio to discriminate Alzheimer’s disease from Binswanger’s disease, Dement Geriatr Cogn Disord 26: , 89–100. |
[109] | Westman E , Simmons A , Zhang Y , Muehlboeck J-S , Tunnard C , Liu Y , Collins L , Evans A , Mecocci P , Vellas B , Tsolaki M , Kłoszewska I , Soininen H , Lovestone S , Spenger C , Wahlund L-O ((2011) ) Multivariate analysis of MRI data for Alzheimer’s disease, mild cognitive impairment and healthy controls, Neuroimage 54: , 1178–1187. |
[110] | Yoo Y , Shin SA , Park S , Lee J-H , Youn J-H , Kim YK , Lee J-Y ((2016) ) The Korean Size/Weight Attribute Test: A semantic knowledge test for Korean older adults and brain-imaging evidence, J Alzheimers Dis 49: , 377–386. |
[111] | Yun HJ , Kwak K , Lee J-M ((2015) ) Multimodal discrimination of Alzheimer’s disease based on regional cortical atrophy and hypometabolism, PLoS One 10: , e0129250. |
[112] | Zhan Y , Chen K , Wu X , Zhang D , Zhang J , Yao L , Guo X ((2015) ) Identification of conversion from normal elderly cognition to Alzheimer’s disease using multimodal support vector machine, J Alzheimers Dis 47: , 1057–1067. |
[113] | Kalaria RN , Maestre GE , Arizaga R , Friedland RP , Galasko D , Hall K , Luchsinger JA , Ogunniyi A , Perry EK , Potocnik F , Prince M , Stewart R , Wimo A , Zhang ZX , Antuono P ((2008) ) Alzheimer’s disease and vascular dementia in developing countries: Prevalence, management, and risk factors, Lancet Neurol 7: , 812–826. |
[114] | Yao F , Zhang K , Zhang Y , Guo Y , Li A , Xiao S , Liu Q , Shen L , Ni J ((2019) ) Identification of blood biomarkers for Alzheimer’s disease through computational prediction and experimental validation, Front Neurol 9: , 1158. |
[115] | Doecke JD ((2012) ) Blood-based protein biomarkers for diagnosis of Alzheimer disease, Arch Neurol 69: , 1318. |
[116] | Kavoor AR , Mitra S , Mahintamani T , Chatterjee SS ((2015) ) Primary prevention of Alzheimer’s disease in developing countries, Clin Psychopharmacol Neurosci 13: , 327. |
[117] | Maccioni RB , Lavados M , Maccioni CB , Farias G , Fuentes P ((2006) ) Anomalously phosphorylated tau protein and Abeta fragments in the CSF icorrelates with cognitive impairment in MCI subjects, Neurobiol Aging 27: , 237–244. |
[118] | Blennow K ((2017) ) A review of fluid biomarkers for Alzheimer’s disease: Moving from CSF to blood, Neurol Ther 6: (Suppl 1), 15–24. |
[119] | Anoop A , Singh PK , Jacob RS , Maji SK ((2010) ) CSF biomarkers for Alzheimer’s disease diagnosis, Int J Alzheimers Dis 2010: , 606802. |
[120] | Suppiah S , Didier MA , Vinjamuri S ((2019) ) The who, when, why, and how of PET amyloid imaging in management of Alzheimer’s disease-review of literature and interesting images, Diagnostics (Basel) 9: , 65. |
[121] | Tsolaki A , Kazis D , Kompatsiaris I , Kosmidou V , Tsolaki M ((2014) ) Electroencephalogram and Alzheimer’s disease: Clinical and research approaches, Int J Alzheimers Dis 2014: , 1–10. |
[122] | Snaedal J , Johannesson GH , Gudmundsson TE , Blin NP , Emilsdottir AL , Einarsson B , Johnsen K ((2012) ) Diagnostic accuracy of statistical pattern recognition of electroencephalogram registration in evaluation of cognitive impairment and dementia, Dement Geriatr Cogn Disord 34: , 51–60. |
[123] | Smailovic U , Jelic V ((2019) ) Neurophysiological markers of Alzheimer’s disease: Quantitative EEG approach, Neurol Ther 8: (s2), 37–55. |
[124] | Scheltens P , Fox N , Barkhof F , De Carli C ((2002) ) Structural magnetic resonance imaging in the practical assessment of dementia: Beyond exclusion, Lancet Neurol 1: , 13–21. |
[125] | Frisoni GB , Fox NC , Jack CR , Scheltens P , Thompson PM ((2010) ) The clinical use of structural MRI in Alzheimer disease, Nat Rev Neurol 6: , 67–77. |
[126] | Avila J ((2000) ) Tau aggregation into fibrillar polymers: Taupathies, FEBS Lett 476: , 89–92. |
[127] | Leuzy A , Chiotis K , Lemoine L , Gillberg PG , Almkvist O , Rodriguez-Vieitez E , Nordberg A ((2019) ) Tau PET imaging in neurodegenerative tauopathies—still a challenge, Mol Psychiatry 24: , 1112–1134. |
[128] | Ossenkoppele R , Schonhaut DR , Schöll M , Lockhart SN , Ayakta N , Baker SL , O’Neil JP , Janabi M , Lazaris A , Cantwell A , Vogel J , Santos M , Miller ZA , Bettcher BM , Vossel KA , Kramer JH , Gorno-Tempini ML , Miller BL , Jagust WJ , Rabinovici GD ((2016) ) Tau PET patterns mirror clinical and neuroanatomical variability in Alzheimer’s disease, Brain 139: (Pt 5), 1551–1567. |
[129] | Matsuda H , Shigemoto Y , Sato N ((2019) ) Neuroimaging of Alzheimer’s disease: Focus on amyloid and tau PET, Jpn J Radiol 37: , 735–749. |
[130] | Meyer P-F , Pichet Binette A , Gonneaud J , Breitner JCS , Villeneuve S ((2020) ) Characterization of Alzheimer disease biomarker discrepancies using cerebrospinal fluid phosphorylated tau and AV1451 positron emission tomography, JAMA Neurol 77: , 508. |
[131] | Fleisher AS , Pontecorvo MJ , Devous MD , Lu M , Arora AK , Truocchio SP , Aldea P , Flitter M , Locascio T , Devine M , Siderowf A , Beach TG , Montine TJ , Serrano GE , Curtis C , Perrin A , Salloway S , Daniel M , Wellman C , Joshi AD , Irwin DJ , Lowe VJ , Seeley WW , Ikonomovic MD , Masdeu JC , Kennedy I , Harris T , Navitsky M , Southekal S , Mintun MA ; A16 Study Investigators ((2020) ) Positron emission tomography imaging with [18F]flortaucipir and postmortem assessment of Alzheimer disease neuropathologic changes, JAMA Neurol 27: , 1–11. |
[132] | Ganeshkumar P , Gopalakrishnan S ((2013) ) Systematic reviews and meta-analysis: Understanding the best evidence in primary healthcare, J Family Med Prim Care 2: , 9–14. |
[133] | Lijmer JG , Bossuyt PMM , Heisterkamp SH ((2002) ) Exploring sources of heterogeneity in systematic reviews of diagnostic tests, Stat Med 21: , 1525–1537. |
[134] | Babulal GM , Quiroz YT , Albensi BC , Arenaza-Urquijo E , Astell AJ , Babiloni C , Bahar-Fuchs A , Bell J , Bowman GL , Brickman AM , Chételat G , Ciro C , Cohen AD , Dilworth-Anderson P , Dodge HH , Dreux S , Edland S , Esbensen A , Evered L , Ewers M , Fargo KN , Fortea J , Gonzalez H , Gustafson DR , Head E , Hendrix JA , Hofer SM , Johnson LA , Jutten R , Kilborn K , Lanctôt KL , Manly JJ , Martins RN , Mielke MM , Morris MC , Murray ME , Oh ES , Parra MA , Rissman RA , Roe CM , Santos OA , Scarmeas N , Schneider LS , Schupf N , Sikkes S , Snyder HM , Sohrabi HR , Stern Y , Strydom A , Tang Y , Terrera GM , Teunissen C , Melo van Lent D , Weinborn M , Wesselman L , Wilcock DM , Zetterberg H , O’Bryant SE ; International Society to Advance Alzheimer’s Research and Treatment, Alzheimer’s Association ((2019) ) Perspectives on ethnic and racial disparities in Alzheimer’s disease and related dementias: Update and areas of immediate need, Alzheimers Dement 15: , 292–312. |
[135] | Anstey KJ , Ee N , Eramudugolla R , Jagger C , Peters R ((2019) ) A systematic review of meta-analyses that evaluate risk factors for dementia to evaluate the quantity, quality, and global representativeness of evidence, J Alzheimers Dis 70: , S165–S186. |
[136] | Schindler SE , Bollinger JG , Ovod V , Mawuenyega KG , Li Y , Gordon BA , Holtzman DM , Morris JC , Benzinger TLS , Xiong C , Fagan AM , Bateman RJ ((2019) ) High-precision plasma β-amyloid 42/40 predicts current and future brain amyloidosis, Neurology 93: , 1647–1659. |


