
Biological Features of Reversion from Mild Cognitive Impairment to Normal Cognition: A Study of Cerebrospinal Fluid Markers and Brain Volume
Abstract
Background:
Mild cognitive impairment (MCI) is a transitional condition between normal cognition and dementia. Although a significant proportion of the population with MCI experience reversion to normal cognition, it is still poorly understood.
Objective:
This study was designed to extend the present evidence regarding the difference between stable and reverting MCI by including whole brain atrophy measures as possible parameters involved.
Methods:
405 patients diagnosed with MCI at baseline were selected. After one-year follow-up period, 337 patients (83.2%) were categorized as stable MCI and 68 patients (16.8%) reverted to cognitively normal status (reversion group). Several baseline biomarkers including cerebrospinal fluid (CSF) biomarkers of AD, including Aβ42, t-tau, and p-tau and MRI-based atrophy measurements were compared.
Results:
Participants with stable MCI demonstrated greater brain atrophy as well as lower Aβ and higher tau proteins in the CSF. The atrophy rate was found to be associated with CSF biomarkers merely in the stable group, after adjustment for confounding variables.
Conclusion:
These findings provide novel evidence regarding the biological perspective of the reversion phenomenon in individuals with MCI.
INTRODUCTION
Mild cognitive impairment (MCI) is a transitional state between normal cognition and dementia, which is characterized by deficits in cognitive abilities that does not affect function of daily living activities [1]. It has been extensively studied that patients with MCI do not necessarily progress to dementia and a proportion of the population revert to normal cognitive state [2]. However, the estimated reversion rates are widely heterogonous varying from 2.2%within the Alzheimer’s Disease Neuroimaging Initiative (ADNI) dataset to 53%, depending on diagnostic criteria, length of follow-up time, and characteristics of MCI population [3–5]. Accurate prediction of MCI-to-cognitively normal (CN) reversion could improve allocation of health resources among heterogeneous population of MCI subjects [6], and advance the design of relevant studies that have the aim of preventing dementia [5]. However, few investigations have explored factors that are associated with this phenomenon [7–11].
It has been shown that rates of brain atrophy and longitudinal cognitive performance are associated [12]. Cerebral atrophy and ventricular expansion are two major hallmarks of Alzheimer’s disease (AD). In this regard, few studies has investigated the association between the rates of global brain atrophy and MCI-to-AD conversion using magnetic resonance imaging (MRI) methods [13]. Nevertheless, the knowledge regarding the link between brain atrophy and MCI-to-CN reversion is still limited and inconsistent and it might be interesting to discover whether cognitive recovery in reverted individuals is associated with lesser reduction in the brain volume. This is due to the fact that it helps illuminating the role of neurobiological features of the brain in the development of reversion phenomenon. In other words, reversion could be attributed to explanations other than true recovery of the brain tissue, including, but not limited to, false positive diagnosis of MCI at baseline, practice effect, and alleviation of a psychiatric condition such as depression or stress at the time of follow-up [8].
Therefore, it seems important to investigate the association between neurobiological parameters and reversion to normal cognition status. In addition to the changes in brain size, alterations in three core cerebrospinal fluid (CSF) biomarkers, including amyloid β (Aβ42), total tau (t-tau), and tau hyperphosphorylated at threonine 181 [phosphorylated tau (p-tau)] are considered as appropriate representatives of the biological changes in MCI and hence, worth investigation [14]. In this regard, ADNI database represents an unusual reversion rate in comparison with other clinical- and community- based studies. In complementary, two recent studies on ADNI database have demonstrated that the apparent low reversion rate could be resolved via applying valid neuropsychological (NP) criteria for MCI diagnosis [15, 16]. The later study reported that MCI-to-CN reverted subjects have demographics, AD biomarkers, and risk-of-progression most similar to individuals with normal cognitive performance and represent significant improvement on NP tests over one year of follow-up.
Applying the NP criteria for MCI diagnosis in ADNI database, we aimed to compare MRI indicators of brain atrophy between stable MCI and reverted subjects after adjustment for several confounding variables including age, gender, education, Mini-Mental State Examination (MMSE), and APOE ɛ4 status. Besides, we sought to assess the association between brain atrophy and CSF biomarkers.
MATERIALS AND METHODS
Participant
Participants data were collected from ADNI database which up-to-date information can be accessed through http://www.adni-info.org. ADNI 1, ADNI 2, and ADNI-GO cohorts were evaluated to find participants who completed both baseline and year 1 neuropsychological assessment. Participants with the diagnosis of dementia in either baseline or year 1 were excluded.
Reclassification
Based on ADNI’s criteria for MCI diagnosis, unexpectedly low reversion rate is observed. Thus, we applied Jack/Bondi NP criteria to correct the false positive MCI diagnoses [17, 18]. First, a battery of tests was employed to the subjects to determine cognitive status, consisting of two memory measures: Rey Auditory Verbal Learning Test (RAVLT) delayed free recall, RAVLT recognition; two language measures: 30-item Boston Naming Test (BNT), animal fluency; and two attention/executive function measures: Trail Making Test (TMT), part A and part B [19]. In the next step, the scores of the tests were converted to z-scores adjusted for age, sex, and education based on regression coefficients obtained from ADNI’s CN population (n = 373) [16]. Afterward, subjects were reclassified in either CN or MCI conditions at baseline and year 1 based on Jack/Bondi NP criteria [17, 18]. Finally, the reversion rate was assessed over 1 year of participation following the new classification.
Baseline characteristics
Several baseline biomarkers were compared between a subset of reverted and stable MCI participants: demographic variables, including age, gender, and education; the MMSE as a measure of global cognition; the 13-item Alzheimer’s Disease Assessment Scale-Cognitive Subscale (ADAS-Cog 13); the Functional Activities Questionnaire (FAQ) as a measure of daily functioning; APOE ɛ4 status based on the presence of at least one ɛ4 allele. Moreover, using Elecsys ® immunoassays, CSF biomarkers of AD, including Aβ42, t-tau, and p-tau were also measured for the cases.
MRI
We used the preprocessed atrophy measurements (TBM-SyN and BSI) provided by ADNI in the current study. In Boundary Shift Integral (BSI), brain and ventricular boundaries are automatically delineated from T1-weighted images. Then, month 12 scans are registered to the baseline images using 9 degrees-of-freedom. Finally, BSI is calculated over the boundaries. We used two measures of BSI in this study: ventricular BSI (VBSI), and k-means clustering differential bias-corrected BSI (KMNDBCBBSI) (KBSI) [20].
In Tensor Based Morphometry –Symmetric Diffeomorphic Image Normalization (TBM-SyN) method, a free of bias registration method was used between two time-point scans, and annualized log-transformed Jacobian determinants of 31 regions-of-interest were averaged and provided as a meas-ure of longitudinal volume change (TBM-SYN sco-re) [21].
Statistical analysis
Statistical analysis was done using R Statistical Software v3.4.3 (R Foundation for Statistical Computing). Shapiro-Wilk test and probability plots were used to test the compliance of variables with normal distribution. Baseline variables were compared across stable MCI and reversion groups using the independent t-test, Mann-Whitney U test, or chi-squared test. To evaluate whether atrophy measurements were associated with MCI reversion, logistic regression test was applied, and models were adjusted for age, gender, education, MMSE, APOE ɛ4 allele, CSF Aβ, and CSF t-tau. Spearman’s correlation was used to test the association between measures of 1-year brain atrophy and CSF biomarkers and appropriate correlation plots were created. Moreover, general linear models (GLMs) were used to assess these associations, adjusting for confounding variables including age, gender, education, and APOE ɛ4 allele. p values less than 0.05 were considered to be statistically significant.
RESULTS
Baseline characteristics
Based on NP criteria at baseline and after exclusion of patients without the required MRI data, 405 patients diagnosed with MCI were recruited. After one-year follow-up period, 337 patients (83.2%) were categorized as stable MCI and 68 patients (16.8%) reverted to cognitively normal status (reversion group). Baseline characteristics of stable MCI and reversion groups are presented in Table 1. Age and education were not significantly different comparing two groups (p values = 0.329 and 0.166, respectively). Stable MCI group had more female participants and higher frequency of APOE ɛ4 + subjects (p = 0.026 and 0.001, respectively). Reversion and stable MCI participants were not significantly different considering the baseline FAQ score (p = 0.459); however, stable MCI group had significantly lower scores in MMSE and ADAS-13 tests (both p < 0.001). As expected, these differences are similar to those reported for the same variables by Thomas and colleagues [16].
Table 1
Baseline demographic, clinical, neuropsychological, and biomarker characteristics of stable MCI and reversion cases
| Variable | Reversion N = 68 | Stable MCI N = 337 | p |
| Age in years, mean (SD) | 74.06 (6.62) | 73.14 (7.18) | 0.208 |
| Education in years, mean (SD) | 16.20 (2.74) | 15.67 (2.92) | 0.184 |
| Gender, F/M (%F) | 19/49 (28%) | 143/194 (42%) | 0.068 |
| APOE ɛ4,+/- (%+) | 25/43 (37%) | 206/131 (61%) | 0.003 |
| Aβ (pg/ml), mean (SD) | 838.45 (344.15) | 726.79 (280.02) | 0.020 |
| t-tau (pg/ml), mean (SD) | 243.42 (105.98) | 320.73 (133.48) | < 0.001 |
| p-tau (pg/ml), mean (SD) | 23.46 (11.89) | 32.23 (15.20) | < 0.001 |
| MMSE, mean (SD) | 28.16 (1.76) | 26.93 (1.79) | < 0.001 |
| ADAS-13, mean (SD) | 13.73 (4.70) | 20.31 (5.85) | < 0.001 |
| FAQ, mean (SD) | 28.16 (1.76) | 26.93 (1.79) | 0.770 |
| KMNDBCBBSI, mean (SD) | 9.62 (8.69) | 12.93 (9.34) | 0.007 |
| VBSI, mean (SD) | 2.16 (2.17) | 3.43 (2.81) | < 0.001 |
| TBMSYNSCOR, mean (SD) | –0.01 (0.011) | –0.017 (0.013) | < 0.001 |
MCI, mild cognitive impairment; MMSE, Mini-Mental Status Examination; APOE, Apolipoprotein E; Aβ, amyloid-β; t-tau, total tau; p-tau, hyperphosphorylated tau; ADAS, The Alzheimer Disease Assessment Scale; FAQ, Functional Activities Questionnaire; KMNDBCBBSI, K-means clustering differential bias-corrected BSI; VBSI, Ventricular BSI; TBMSYNSCOR, Tensor Based Morphometry –Symmetric Diffeomorphic Image Normalization score.
Atrophy measurements
Stable MCI group had higher ventricular and whole brain shift of boundary locations, measured by VBSI and KBSI (p = 0.001 and 0.002, respectively), and lower TBM-SYN score (p ≤ 0.001), which provides annualized brain atrophy rate, compared with the reversion group over the study period. Logistic regression tests were used to assess the association between BSI and MCI reversion to normal status (Table 2). Crude models revealed that there are significant associations between atrophy measurements and MCI reversion over one year of follow-up. Moreover, MCI reversion was negatively associated with VBSI (p = 0.011) and positively associated with TBM-SYN score (p = 0.010) after adjustment for covariates (age, gender, education, APOE allele, CSF Aβ, and CSF t-tau).
Table 2
Association between MCI reversion and atrophy measurements
| Outcome | Model | Exponential Beta | Exponential Beta-lower | Exponential Beta-upper | p |
| TBMSYNSCOR | Crude | 1.82 | 1.38 | 2.48 | < 0.001 |
| Adjusted | 1.54 | 1.12 | 2.17 | 0.010 | |
| KMNDBCBBSI | Crude | 0.95 | 0.91 | 0.98 | 0.002 |
| Adjusted | 0.96 | 0.92 | 1.0 | 0.076 | |
| VBSI | Crude | 0.78 | 0.67 | 0.90 | 0.001 |
| Adjusted | 0.81 | 0.68 | 0.94 | 0.011 |
KMNDBCBBSI, K-means clustering differential bias-corrected BSI; VBSI, Ventricular BSI; TBMSYNSCOR, Tensor Based Morphometry –Symmetric Diffeomorphic Image Normalization score.
CSF analysis
Reversion group had lower level of t-tau and p-tau and higher levels of Aβ (p≤0.001, < 0.001, and < 0.026, respectively). Correlation analysis revealed significant associations between atrophy measurements (KBSI and TBM-SYN score) and CSF biomarkers in the Stable MCI groups (Fig. 1). Using GLM, significant associations were observed between atrophy measurements and CSF level of t-tau, p-tau and Aβ in the Stable MCI groups (Table 3). Moreover, no significant association was observed between CSF biomarkers and atrophy measurements in the reversion group.
Fig. 1
Correlation plot of atrophy measurements and CSF biomarkers. Correlation plot in Stable MCI (A) and reversion (B) groups. Aβ, amyloid-β; t-tau, total tau; p-tau, hyperphosphorylated tau; KMNDBCBBSI, K-means clustering differential bias-corrected BSI; VBSI, Ventricular BSI; TBMSYNSCOR, Tensor Based Morphometry –Symmetric Diffeomorphic Image Normalization score.*Significant correlation (p < 0.05).
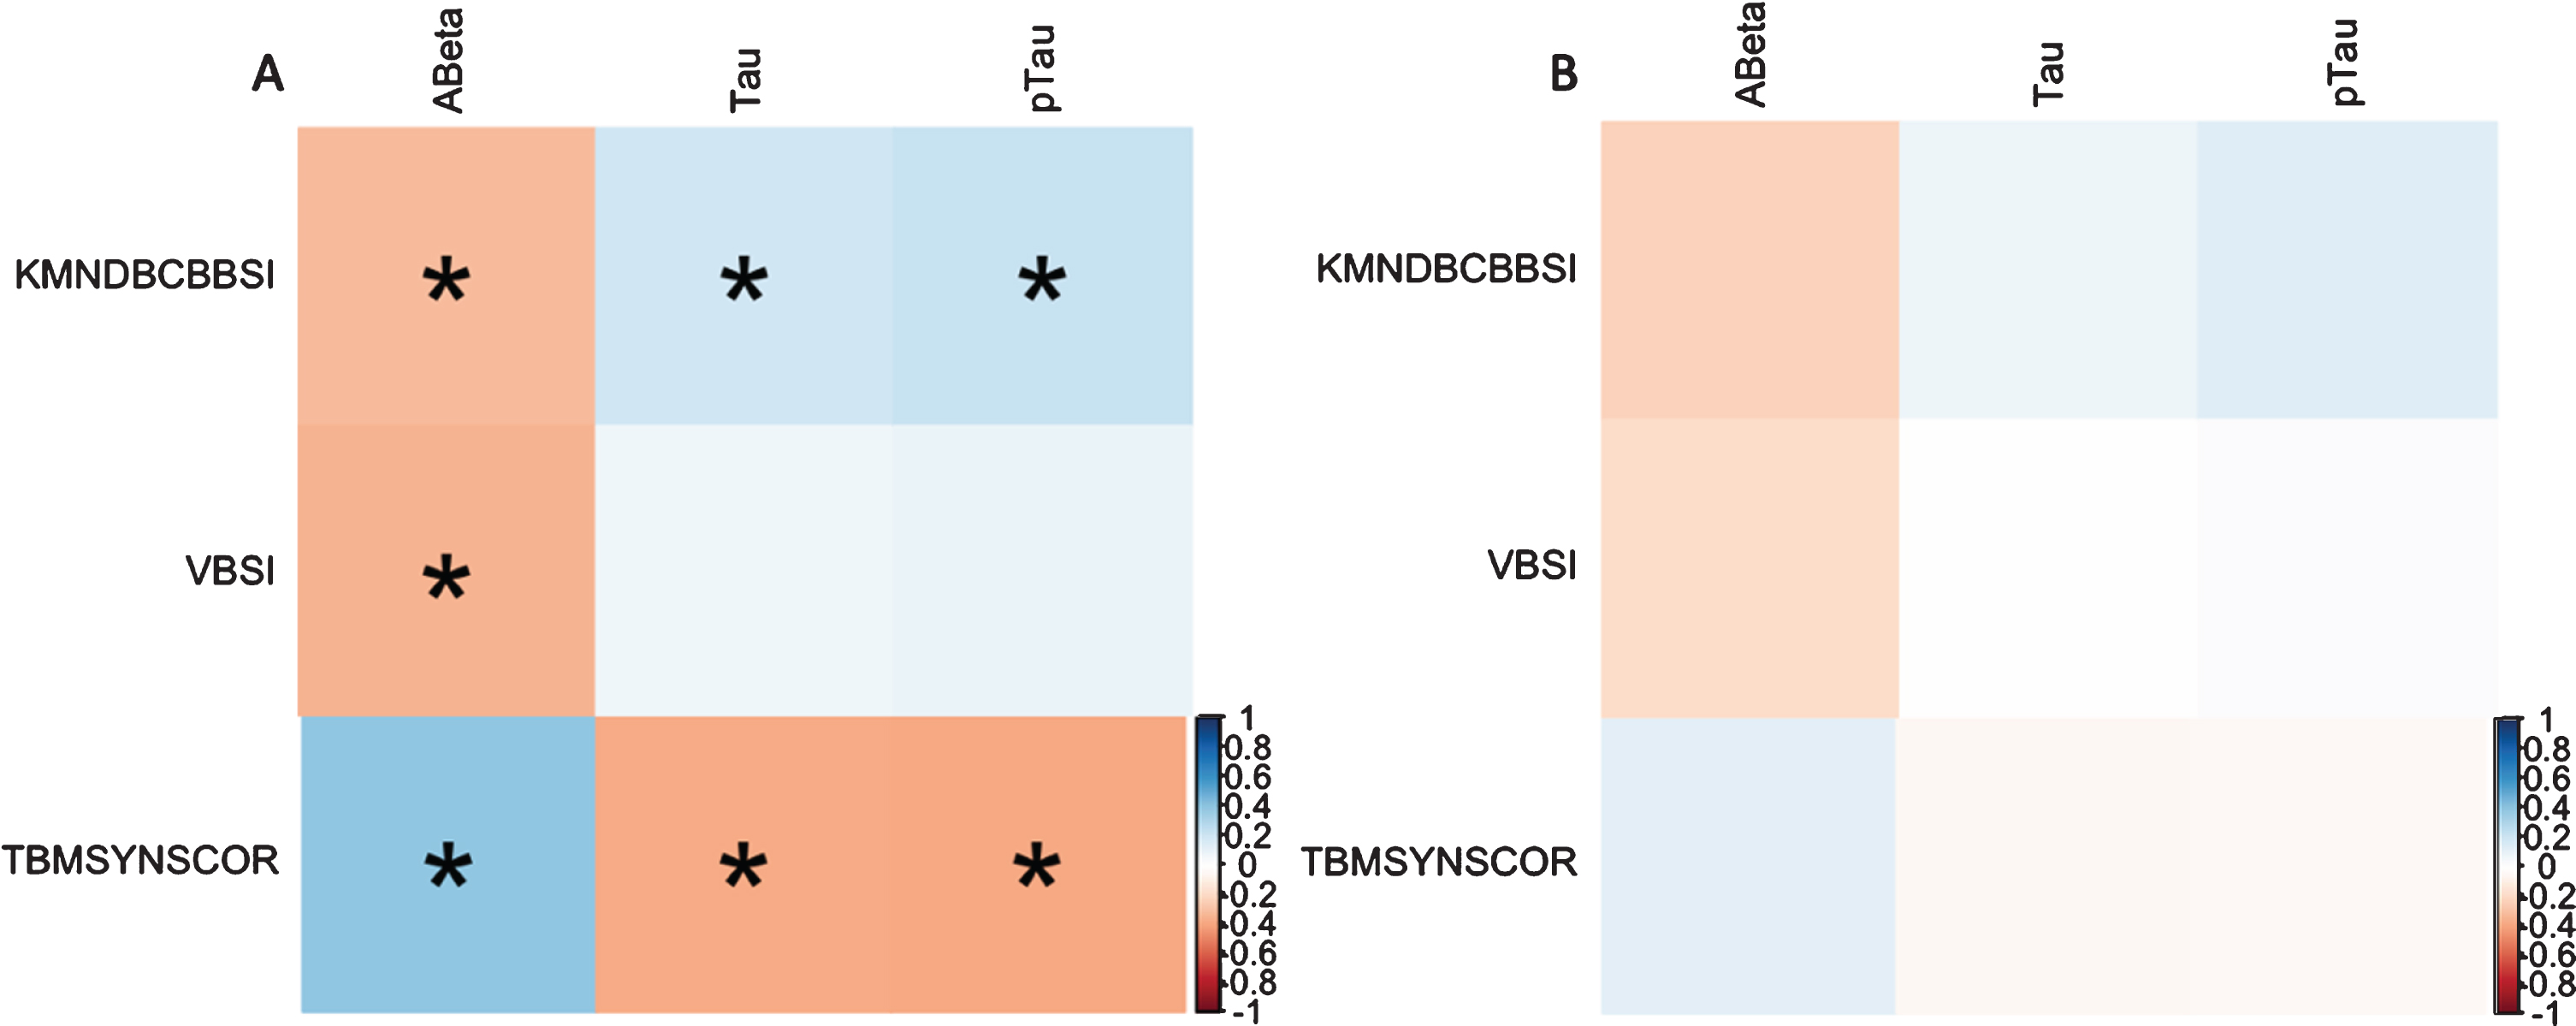
Table 3
Association between CSF biomarkers and atrophy measurements
| Study group | Outcome | Exposure | Beta | Beta - lower | Beta - upper | p |
| Stable MCI | Aβ | TBMSYNSCOR | 9860.48 | 5914.36 | 13806.6 | < 0.001 |
| KMNDBCBBSI | –13.71 | –17.98 | –9.44 | < 0.001 | ||
| VBSI | –40.56 | –54.92 | –26.2 | < 0.001 | ||
| p-tau | TBMSYNSCOR | –340.13 | –519.02 | –161.25 | < 0.001 | |
| KMNDBCBBSI | 0.23 | 0.04 | 0.42 | 0.02 | ||
| VBSI | 0.02 | –0.62 | 0.66 | 0.952 | ||
| t-tau | TBMSYNSCOR | –278916 | –4346.49 | –1231.82 | 0.001 | |
| KMNDBCBBSI | 1.66 | 0 | 3.33 | 0.05 | ||
| VBSI | –0.5 | –6.06 | 5.06 | 0.86 | ||
| Reversion | Aβ | TBMSYNSCOR | 4099.44 | –7482.65 | 15681.53 | 0.479 |
| KMNDBCBBSI | –7.59 | –26.68 | 11.51 | 0.427 | ||
| VBSI | –51.71 | –129.47 | 26.04 | 0.187 | ||
| p-tau | TBMSYNSCOR | 133.08 | –118.71 | 384.88 | 0.292 | |
| KMNDBCBBSI | –0.01 | –0.48 | 0.45 | 0.963 | ||
| VBSI | 0.1 | –1.82 | 2.02 | 0.914 | ||
| t-tau | TBMSYNSCOR | 1075.48 | –1423.86 | 3574.82 | 0.39 | |
| KMNDBCBBSI | –0.28 | –4.53 | 3.97 | 0.896 | ||
| VBSI | –1.76 | –19.3 | 15.77 | 0.84 |
Aβ, amyloid-β; t-tau, total tau; p-tau, hyperphosphorylated tau; KMNDBCBBSI, K-means clustering differential bias-corrected BSI; VBSI, Ventricular BSI; TBMSYNSCOR, Tensor Based Morphometry –Symmetric Diffeomorphic Image Normalization score.
DISCUSSION
In the present study, we compared global brain atrophy over one year between reversion and stable MCI groups using MRI imaging data. We showed that patients with reversion to CN condition represent significantly lower grades of brain atrophy over the time. Besides, our analyses replicated significantly higher Aβ and lower p-tau and t-tau in the CSF of reverted participants compared to the stable MCI [16]. Finally, after adjustment for confounding variables, our results demonstrated that baseline levels of these CSF biomarkers are significantly correlated with the atrophy rate in the stable group, but not in the reversion group.
There has been an ongoing effort for explaining the MCI to CN reversion. Several reasons have been suggested for this phenomenon, including true recovery [10], false-positive errors at baseline diagnosis of MCI [22], practice effect [23], and cognitive fluctuations depending on the underlying etiology [24]. To understand the true essence of reversion, we reduced the possible influence of false-positive errors at diagnosis and practice effect by applying the NP criteria at two measurement points with an interval of one year. Interpreting the MRI findings, reversion to CN might be due to low grades of brain atrophy in conjunction with simultaneous compensatory mechanisms. However, the effects of other aforementioned psychometric etiologies should not still be neglected as these factors could boost the performance of the less impaired group above the thresholds used for MCI.
Reduced CSF levels of Aβ and increased levels of the microtubule-associated proteins tau (p-tau and t-tau) are found in MCI [25, 26]. Beyond that, few investigations have shown significantly different levels of these biomarkers between MCI subcategories. For instance, Thomas and colleagues indicated that subjects with stable MCI exhibit lower levels of Aβ and higher levels of p-tau and t-tau in comparison with those who revert to CN status [16]. Here, in addition to the same finding, we suggested that the CSF levels of the aforementioned biomarkers are associated with brain atrophy in the stable group.
Amyloid cascade hypothesis reflects the point that an imbalance between the production and clearance of Aβ could be the primary cause of MCI progression to AD [27]. In detail, this phenomenon leads to accumulation of extracellular Aβ plaques, which initiates oxidative stress and inflammatory activities, and provokes neurofibrillary tangle formation via changing kinase and phosphatase activity [28]. All these alterations, together, could give rise to neuronal and synaptic dysfunction, and therefore cognitive disruption. This theory might justify our results as those with stable MCI had significantly lower CSF levels of Aβ, which is relatively representative of higher deposition of this peptide in the brain. However, the accuracy of this theory is not certain due to the presence of Aβ plaques even in healthy individuals, as well as the absence of appropriate response from treatments that target Aβ deposition [29]. Further studies are warranted to investigate the exact role of CSF biomarkers in the pathogenesis of MCI.
Some limitations should be considered for this study. First, the 1-year duration of follow-up might not be sufficient for determining the cognitive status of MCI subjects over long-term. Further investigations with longer follow-up period could detect cognitive fluctuations more reliably. Second, other MRI techniques are warranted to study the atrophy in different regions of the brain. Finally, longitudinal evaluation of the CSF biomarkers provides novel information regarding the pathophysiology of reversion phenomenon.
In conclusion, this study showed higher grades of brain atrophy in patients with stable MCI, compared to those who reverted to normal cognition over the study course. Moreover, we discovered that higher reduction of brain volume in subjects with stable MCI is associated with lower CSF Aβ and higher CSF p-tau and t-tau. This finding suggests a possibility that these CSF biomarkers might be responsible for the absence of cognitive recovery and significant atrophy of the brain. Additional studies are required to test this hypothesis.
CONFLICT OF INTEREST
The authors have no conflict of interest to report.
Ethics approval and consent to participate
All procedures performed in the ADNI studies involving human participants were in accordance with the ethical standards of the institutional rese-arch committees and with the 1964 Helsinki declar-ation and its successive revisions. Written informed consent was obtained from all participants or their authorized representatives. The study procedures were approved by the institutional review boards of all participating centers (https://adni.loni.usc.edu/wp-content/uploads/how_to_apply/ADNI_Acknowledgement_List.pdf).
ACKNOWLEDGMENTS
Data collection and sharing for this project was funded by the Alzheimer’s Disease Neuroimaging Initiative (ADNI) (National Institutes of Health Grant U01 AG024904) and DOD ADNI (Department of Defense award number W81XWH-12-2-0012). ADNI is funded by the National Institute on Aging, the National Institute of Biomedical Imaging and Bioengineering, and through generous contributions from the following: AbbVie, Alzheimer’s Association; Alzheimer’s Drug Discovery Foundation; Araclon Biotech; BioClinica, Inc.; Biogen; Bristol-Myers Squibb Company; CereSpir, Inc.; Cogstate; Eisai Inc.; Elan Pharmaceuticals, Inc.; Eli Lilly and Company; EuroImmun; F. Hoffmann-La Roche Ltd and its affiliated company Genentech, Inc.; Fujirebio; GE Healthcare; IXICO Ltd.; Janssen Alzheimer Immunotherapy Research & Development, LLC.; Johnson & Johnson Pharmaceutical Research & Development LLC.; Lumosity; Lundbeck; Merck & Co., Inc.; Meso Scale Diagnostics, LLC.; NeuroRx Research; Neurotrack Technologies; Novartis Pharmaceuticals Corporation; Pfizer Inc.; Piramal Imaging; Servier; Takeda Pharmaceutical Company; and Transition Therapeutics. The Canadian Institutes of Health Research is providing funds to support ADNI clinical sites in Canada. Private sector contributions are facilitated by the Foundation for the National Institutes of Health (http://www.fnih.org). The grantee organization is the Northern California Institute for Research and Education, and the study is coordinated by the Alzheimer’s Therapeutic Research Institute at the University of Southern California. ADNI data are disseminated by the Laboratory for Neuro Imaging at the University of Southern California.
REFERENCES
[1] | Morris JC , Cummings J ((2005) ) Mild cognitive impairment (MCI) represents early-stage Alzheimer’s disease. J Alzheimers Dis 7: , 235–239. |
[2] | Petersen RC , Lopez O , Armstrong MJ , Getchius TSD , Ganguli M , Gloss D , Gronseth GS , Marson D , Pringsheim T , Day GS , Sager M , Stevens J , Rae-Grant A ((2018) ) Practice guideline update summary: Mild cognitive impairment: Report of the Guideline Development, Dissemination, and Implementation Subcommittee of the American Academy of Neurology. Neurology 90: , 126–135. |
[3] | Petersen RC , Aisen P , Beckett LA , Donohue M , Gamst A , Harvey DJ , Jack C , Jagust W , Shaw L , Toga A ((2010) ) Alzheimer’s disease neuroimaging initiative (ADNI): clinical characterization. Neurology 74: , 201–209. |
[4] | Malek-Ahmadi M ((2016) ) Reversion from mild cognitive impairment to normal cognition. Alzheimer Dis Assoc Disord 30: , 324–330. |
[5] | Canevelli M , Grande G , Lacorte E , Quarchioni E , Cesari M , Mariani C , Bruno G , Vanacore N ((2016) ) Spontaneous reversion of mild cognitive impairment to normal cognition: a systematic review of literature and meta-analysis. J Am Med Dir Assoc 17: , 943–948. |
[6] | Canevelli M , Blasimme A , Vanacore N , Bruno G , Cesari M ((2015) ) From evidence to action: promoting a multidimensional approach to mild cognitive impairment. J Am Med Dir Assoc 16: , 710–711. |
[7] | Koepsell TD , Monsell SE ((2012) ) Reversion from mild cognitive impairment to normal or near-normal cognition: risk factors and prognosis. Neurology 79: , 1591–1598. |
[8] | Sachdev PS , Lipnicki DM , Crawford J , Reppermund S , Kochan NA , Trollor JN , Wen W , Draper B , Slavin MJ , Kang K ((2013) ) Factors predicting reversion from mild cognitive impairment to normal cognitive functioning: a population-based study. PloS One 8: , e59649. |
[9] | Tokuchi R , Hishikawa N , Kurata T , Sato K , Kono S , Yamashita T , Deguchi K , Abe K ((2014) ) Clinical and demographic predictors of mild cognitive impairment for converting to Alzheimer’s disease and reverting to normal cognition. J Neurol Sci 346: , 288–292. |
[10] | Pandya SY , Lacritz LH , Weiner MF , Deschner M , Woon FL ((2017) ) Predictors of reversion from mild cognitive impairment to normal cognition. Dement Geriatr Cogn Disord 43: , 204–214. |
[11] | Shimada H , Doi T , Lee S , Makizako H ((2019) ) Reversible predictors of reversion from mild cognitive impairment to normal cognition: a 4-year longitudinal study. Alzheimer Res Ther 11: , 24. |
[12] | Fox NC , Scahill RI , Crum WR , Rossor MN ((1999) ) Correlation between rates of brain atrophy and cognitive decline in AD. Neurology 52: , 1687–1689. |
[13] | Sun Z , van de Giessen M , Lelieveldt BPF , Staring M ((2017) ) Detection of conversion from mild cognitive impairment to Alzheimer’s disease using longitudinal brain MRI. Front Neuroinform 11: , 16–16. |
[14] | Shaw LM , Vanderstichele H , Knapik-Czajka M , Clark CM , Aisen PS , Petersen RC , Blennow K , Soares H , Simon A , Lewczuk P ((2009) ) Cerebrospinal fluid biomarker signature in Alzheimer’s disease neuroimaging initiative subjects. Ann Neurol 65: , 403–413. |
[15] | Thomas KR , Eppig JS , Weigand AJ , Edmonds EC , Wong CG , Jak AJ , Delano-Wood L , Galasko DR , Salmon DP , Edland SD ((2019) ) Artificially low mild cognitive impairment to normal reversion rate in the Alzheimer’s Disease Neuroimaging Initiative. Alzheimers Dement 15: , 561–569. |
[16] | Thomas KR , Edmonds EC , Eppig JS , Wong CG , Weigand AJ , Bangen KJ , Jak AJ , Delano-Wood L , Galasko DR , Salmon DP ((2019) ) MCI-to-normal reversion using neuropsychological criteria in the Alzheimer’s Disease Neuroimaging Initiative. Alzheimers Dement 15: , 1322–1332. |
[17] | Jak AJ , Bondi MW , Delano-Wood L , Wierenga C , Corey-Bloom J , Salmon DP , Delis DC ((2009) ) Quantification of five neuropsychological approaches to defining mild cognitive impairment. Am J Geriatr Psychiatry 17: , 368–375. |
[18] | Bondi MW , Edmonds EC , Jak AJ , Clark LR , Delano-Wood L , McDonald CR , Nation DA , Libon DJ , Au R , Galasko D , Salmon DP ((2014) ) Neuropsychological criteria for mild cognitive impairment improves diagnostic precision, biomarker associations, and progression rates. J Alzheimers Dis 42: , 275–289. |
[19] | Edmonds EC , Delano-Wood L , Clark LR , Jak AJ , Nation DA , McDonald CR , Libon DJ , Au R , Galasko D , Salmon DP , Bondi MW ((2015) ) Susceptibility of the conventional criteria for mild cognitive impairment to false-positive diagnostic errors. Alzheimers Dement 11: , 415–424. |
[20] | Manning EN , Leung KK , Nicholas JM , Malone IB , Cardoso MJ , Schott JM , Fox NC , Barnes J , Alzheimer’s Disease Neuroimaging Initiative ((2017) ) A comparison of accelerated and non-accelerated MRI scans for brain volume and boundary shift integral measures of volume change: evidence from the ADNI Dataset. Neuroinformatics 15: , 215–226. |
[21] | Vemuri P , Senjem ML , Gunter JL , Lundt ES , Tosakulwong N , Weigand SD , Borowski BJ , Bernstein MA , Zuk SM , Lowe VJ , Knopman DS , Petersen RC , Fox NC , Thompson PM , Weiner MW , Jack CR ((2015) ) Accelerated vs. unaccelerated serial MRI based TBM-SyN measurements for clinical trials in Alzheimer’s disease. Neuroimage 113: , 61–69. |
[22] | Brooks BL , Iverson GL , Holdnack JA , Feldman HH ((2008) ) Potential for misclassification of mild cognitive impairment: A study of memory scores on the Wechsler Memory Scale-III in healthy older adults. J Int Neuropsychol Soc 14: , 463–478. |
[23] | Duff K , Lyketsos CG , Beglinger LJ , Chelune G , Moser DJ , Arndt S , Schultz SK , Paulsen JS , Petersen RC , McCaffrey RJ ((2011) ) Practice effects predict cognitive outcome in amnestic mild cognitive impairment. Am J Geriatr Psychiatry 19: , 932–939. |
[24] | Sugarman MA , Alosco ML , Tripodis Y , Steinberg EG , Stern RA ((2018) ) Neuropsychiatric symptoms and the diagnostic stability of mild cognitive impairment. J Alzheimers Dis 62: , 1841–1855. |
[25] | Fjell AM , Walhovd KB , Fennema-Notestine C , McEvoy LK , Hagler DJ , Holland D , Brewer JB , Dale AM , Alzheimer’s Disease Neuroimaging Initiative ((2010) ) CSF biomarkers in prediction of cerebral and clinical change in mild cognitive impairment and Alzheimer’s disease. J Neurosci 30: , 2088–2101. |
[26] | Haldenwanger A , Eling P , Kastrup A , Hildebrandt H ((2010) ) Correlation between cognitive impairment and CSF biomarkers in amnesic MCI, non-amnesic MCI, and Alzheimer’s disease. J Alzheimers Dis 22: , 971–980. |
[27] | Hardy J , Selkoe DJ ((2002) ) The amyloid hypothesis of Alzheimer’s disease: progress and problems on the road to therapeutics. Science 297: , 353–356. |
[28] | Blennow K , Hampel H , Weiner M , Zetterberg H ((2010) ) Cerebrospinal fluid and plasma biomarkers in Alzheimer disease. Nat Rev Neurol 6: , 131. |
[29] | Pimplikar SW ((2009) ) Reassessing the amyloid cascade hypothesis of Alzheimer’s disease. Int J Biochem Cell Biol 41: , 1261–1268. |


