
Validation of the Neuropsychiatric Inventory Based on Item Response Theory
Abstract
Background:
The Neuropsychiatric Inventory (NPI) is a widely used scale for the assessment of the behavioral and psychological symptoms of dementia (BPSD). We previously developed a novel dementia scale, the ABC dementia scale, in the TRIAD1412 trial and we compared the BPSD domain scores with the NPI scores. We, therefore, considered that we should investigate the quality of the NPI items using statistical approaches.
Objective:
We investigated the statistical characteristics of the 12 questions or items in the Japanese version of the NPI using the item response theory. This theory is the standard approach for the development of a new assessment scale and we used it to evaluate the quality of the items in the NPI.
Methods:
First, we performed factor analysis with Promax rotation to identify latent constructs in the data from 312 patients obtained in TRIAD1412. Second, following the result of the factor analysis, we divided the 12 items into domains and then investigated the characteristics of the sub-syndromes in each domain using item response category characteristic curves.
Results:
We found three latent constructs or domains: “hyperactivity,” “psychosis and apathy,” and “affect” (Cronbach’s α= 0.68) in the 12 items. Further, the items on euphoria, apathy, and appetite and eating abnormalities did not provide sufficient information to estimate BPSD severity.
Conclusion:
The NPI item characteristics indicate that while the scale can distinguish whether patients have severe BPSD or not, it cannot estimate the degree of severity in a suspected case with a mild or unknown level of BPSD.
INTRODUCTION
Assessment of behavioral and psychological symptoms of dementia (BPSD) is an essential component of the evaluation of patients with dementia. Physicians often evaluate BPSD by interviewing caregivers who know their patients well. The Neuropsychiatric Inventory (NPI) is an observational assessment scale that evaluates patient behavior with a semi-structured interview administered to the caregivers [1]. The current version of the NPI assesses the frequency and severity of BPSD through the assessment of 12 items, namely 1) delusions, 2) hallucinations, 3) agitation, 4) depression, 5) anxiety, 6) euphoria, 7) apathy, 8) disinhibition, 9) irritability, 10) aberrant motor behavior, 11) night-time behavior disturbances, and 12) appetite and eating abnormalities. Cummings and McPherson [2] insisted that they established the content validity, construct validity, inter-rater reliability, and test-retest reliability of the English version of the NPI. Matsumoto et al. [3] established the test-retest reliability of the Japanese version of the NPI. Kaufer et al. [4] developed the NPI Caregiver Distress Scale (NPI-D) for assessing the impact of neuropsychiatric symptoms on caregiver distress in the case of patients with Alzheimer’s disease (AD).
Previous studies have used principal component analysis (PCA) to identify sub-syndrome groups among the 12 items in the NPI [5–13]. These items compose the latent constructs of the BPSD, and we shall refer to the components or factors as “domains” in this paper. For example, Aalten et al. [5] considered the characteristics of the sub-syndrome associated with each of the components and classified the 12 items into three domains, namely “hyperactivity,” “psychosis,” and “mood/apathy.” Conversely, Mirakhur et al. [11] classified the items into four domains, namely “affect,” “physical behavior,” “psychosis,” and “hypomania.” Other studies have debated whether depression and apathy belong to the same domain [1, 8]. However, as these studies involved different designs, sample sizes, and patient backgrounds, it is not surprising that they identified various components of the domains. Further, PCA uses an unnatural assumption that the components (domains) are orthogonal such that the domains are statistically independent of each other. We should, therefore, use factor analysis (FA) with Promax rotation, which allows for correlations between domains [14]. The technical advantage of FA is that it can identify the domain or latent factor that will affect a sub-syndrome the most; for example, we may say that hyperactivity can explain agitation more effectively than the other domains such as “psychosis,” and “mood/apathy.” In contrast, PCA identifies a set of sub-syndromes to explain a latent construct; for example, when PCA identifies three sub-syndromes, namely agitation, irritability, and aberrant motor behavior in a domain, they can together compose the concept of the latent construct, “hyperactivity.” However, PCA cannot provide information regarding the extent to which hyperactivity can affect each sub-syndrome. In other words, in FA, the latent construct of hyperactivity works as an explanatory variable for each sub-syndrome regarded as a dependent variable. In contrast, in PCA, hyperactivity is an independent variable, and sub-syndromes are explanatory variables to explain the concept of the latent construct, hyperactivity.
Mori et al. [15] have established a new assessment scale called the ABC Dementia Scale (ABC-DS), which consists of 13 questions related to AD that are scored on a nine-point ordinal scale (scores range from least severe to most severe). Further, Kikuchi et al. [16] developed a novel method involving three-dimensional distance (TDD) to evaluate the progress of dementia. Our group previously conducted a clinical trial, TRIAD1412, to establish the concurrent validity of the scale with the Disability Assessment for Dementia [17], NPI-D [4], Mini-Mental State Examination (MMSE) [18], and Clinical Dementia Rating tests [19]. In this paper, we used a part of the data from the TRIAD1412 study to perform a secondary analysis.
We first analyzed the NPI scores and evaluated the profiles of neuropsychiatric syndromes in patients who participated in the TRIAD1412 study. Second, we found latent constructs in the data using FA with Promax rotation and defined the domains. Third, we evaluated the quality of each item in the NPI using the item response theory. Finally, we discussed the statistical limitations of the current version of the Japanese NPI and proposed a remedy.
MATERIALS AND METHODS
Patients and data
In the TRIAD1412 study, we recruited 312 patients who had been diagnosed with: 1) AD, based on the Diagnostic and Statistical Manual of Mental Disorders, Fourth Edition, Text Revision (DSM-IV-TR) criteria [20]; 2) probable AD, based on the criteria suggested by the National Institute on Aging-Alzheimer’s Association (NIA-AA) workgroups [21], National Institute of Neurological and Communicative Disorders and Stroke, or Alzheimer’s Disease and Related Disorders Association [22]; or 3) mild cognitive impairment (MCI), based on the DSM-IV-TR or NIA-AA diagnostic criteria [23]. We excluded individuals with dementia other than AD, as they were likely to be diagnosed with major comorbid neurological or mental disorders. Physicians diagnosed the severity of the symptoms and classified each patient into one of four categories, namely probable MCI, and mild, moderate, and severe BPSD. While we obtained MMSE and ABC-DS data from all patients, we were unable to get NPI data from one patient. We received ethical approval for data collection in the TRIAD1412 study (http://www.umin.ac.jp/, No.UMIN000021134).
Neuropsychiatric inventory assessment
The NPI assessment was performed based on historical information on the neuropsychiatric symptoms of the patients in the month before the study. Our clinical psychologists evaluated the severity and frequency of each symptom by interviewing the caregiver of the patient. Next, we calculated a continuous NPI score for each symptom based on the severity score multiplied by the frequency score, where the severity, frequency, and NPI scores ranged from 0–3, 0–4, and 0–12, respectively. We then converted the NPI scores of 0, 1–3, 4–6, 7–9, and 10–12 into a five-point ordinal scale of 0, 1, 2, 3, 4, and 5, respectively, for the analysis with the item response theory. We also assessed caregiver distress induced by BPSD using the six-point NPI-D scale. We used the ratio (caregiver distress score divided by severity score) as an index of caregiver burden caused by the symptoms of BPSD (Table 1).
Table 1
Mean (standard deviation) of NPI, NPI-D score, MMSE score, and TDD score stratified by stage of disease
| Item | Probable MCI (n = 63) | Mild (n = 88) | Moderate (n = 106) | Severe (n = 52) | ||||||||||||
| Severity | Frequency | Distress | Ratio | Severity | Frequency | Distress | Ratio | Severity | Frequency | Distress | Ratio | Severity | Frequency | Distress | Ratio | |
| Delusions | 0.1 (0.4) | 0.1 (0.5) | 0.2 (0.7) | 1.7 (0.5) | 0.2 (0.6) | 0.2 (0.7) | 0.4 (1.1) | 1.8 (1.1) | 0.3 (0.6) | 0.4 (1.0) | 0.4 (1.0) | 1.6 (1.0) | 0.5 (0.9) | 0.7 (1.2) | 0.8 (1.3) | 1.5 (0.9) |
| Hallucination | 0.0 (0.2) | 0.0 (0.1) | 0.1 (0.4) | 2.3 (1.1) | 0.1 (0.3) | 0.1 (0.4) | 0.1 (0.4) | 1.4 (0.8) | 0.1 (0.4) | 0.2 (0.6) | 0.2 (0.7) | 1.4 (0.7) | 0.3 (0.8) | 0.5 (1.2) | 0.5 (1.2) | 1.8 (0.9) |
| Agitation | 0.2 (0.5) | 0.4 (0.9) | 0.4 (1.0) | 1.7 (0.8) | 0.3 (0.6) | 0.5 (1.0) | 0.5 (1.2) | 1.8 (0.9) | 0.3 (0.6) | 0.5 (1.1) | 0.4 (1.0) | 1.6 (0.8) | 0.8 (1.1) | 1.2 (1.5) | 1.3 (1.7) | 1.6 (0.7) |
| Depression | 0.3 (0.6) | 0.4 (0.8) | 0.3 (0.8) | 1.1 (0.9) | 0.3 (0.6) | 0.5 (1.0) | 0.4 (1.0) | 1.4 (1.0) | 0.2 (0.6) | 0.4 (1.0) | 0.3 (0.8) | 1.3 (1.0) | 0.3 (0.7) | 0.4 (1.0) | 0.3 (0.9) | 1.3 (0.8) |
| Anxiety | 0.2 (0.6) | 0.4 (0.9) | 0.3 (0.8) | 1.5 (0.9) | 0.4 (0.8) | 0.7 (1.3) | 0.5 (1.1) | 1.2 (0.9) | 0.3 (0.7) | 0.5 (1.1) | 0.4 (0.9) | 1.5 (1.0) | 0.4 (0.8) | 0.6 (1.3) | 0.6 (1.3) | 1.6 (0.6) |
| Euphoria | 0.0(0.1) | 0.0 (0.1) | 0.0 (0.1) | 1.0 (0.0) | 0.1 (0.4) | 0.1 (0.6) | 0.1 (0.5) | 1.4 (1.6) | 0.0 (0.2) | 0.1 (0.6) | 0.0 (0.2) | 0.8 (1.0) | 0.2 (0.5) | 0.4 (1.1) | 0.1 (0.5) | 0.6 (0.6) |
| Apathy | 0.5 (0.8) | 1.0 (1.6) | 0.5 (1.0) | 1.1 (0.7) | 0.7 (0.9) | 1.7 (1.9) | 0.7 (1.1) | 1.0 (0.7) | 1.1 (1.0) | 2.3 (1.9) | 1.1 (1.3) | 1.1 (0.8) | 1.1 (1.1) | 2.4 (1.9) | 1.3 (1.4) | 1.2 (0.7) |
| Disinhibition | 0.1 (0.3) | 0.1 (0.4) | 0.1 (0.5) | 1.6 (0.5) | 0.1 (0.4) | 0.2 (0.7) | 0.2 (0.7) | 1.8 (0.9) | 0.2 (0.5) | 0.3 (0.8) | 0.3 (0.8) | 1.5 (0.9) | 0.2 (0.6) | 0.3 (0.8) | 0.3 (0.9) | 1.1 (0.9) |
| Irritability | 0.2 (0.5) | 0.4 (1.0) | 0.4 (1.0) | 1.9 (1.1) | 0.3 (0.7) | 0.5 (1.1) | 0.5 (1.1) | 1.7 (0.9) | 0.3 (0.7) | 0.5 (1.0) | 0.5 (1.0) | 1.6 (0.7) | 0.5 (1.0) | 0.7 (1.3) | 0.7 (1.4) | 1.3 (0.5) |
| Aberrant motor behavior | 0.1 (0.4) | 0.1 (0.5) | 0.1 (0.3) | 1.2 (0.6) | 0.1 (0.4) | 0.2 (0.8) | 0.2 (0.6) | 1.7 (0.8) | 0.4 (0.8) | 0.8 (1.5) | 0.4 (0.9) | 1.1 (0.8) | 0.8 (0.9) | 1.6 (1.6) | 1.3 (1.5) | 1.8 (1.1) |
| Night-time behaviour disturbances | 0.3 (0.6) | 0.5 (1.2) | 0.2 (0.6) | 0.9 (0.6) | 0.3 (0.6) | 0.5 (1.2) | 0.3 (0.9) | 1.3 (0.8) | 0.3 (0.7) | 0.6 (1.2) | 0.5±1.1 | 1.5 (0.9) | 0.6 (0.8) | 1.0 (1.4) | 1.0 (1.4) | 1.9 (1.1) |
| Appetite and eating abnormalities | 0.4 (0.7) | 0.8 (1.5) | 0.3 (0.7) | 0.8 (0.7) | 0.3 (0.7) | 0.7 (1.3) | 0.3 (0.9) | 0.9 (0.8) | 0.3 (0.7) | 0.9 (1.6) | 0.4 (0.9) | 1.1 (1.0) | 0.4 (0.99) | 0.7 (1.4) | 0.5 (1.1) | 1.2 (0.7) |
| MMSE | 25.8 (3.0) | 21.6 (2.9) | 16.9 (3.8) | 6.7 (5.8) | ||||||||||||
| TDD (ABC-DS) | 106 (8.4) | 94.2 (12.6) | 86.6 (12.9) | 58.3 (18.8) | ||||||||||||
NPI, Neuropsychiatric Inventory; NPI-D score, NPI Caregiver Distress Scale; MMSE, Mini-Mental State Examination; TDD, three-dimensional distance; ABC-DS, ABC Dementia Scale.
Statistical analysis
We used SAS (version 9.4; SAS Institute, Cary, NC, USA) and R (version i38635.1; R Foundation for Statistical Computing, Vienna, Austria) for statistical analyses and performed FA with Promax rotation to identify latent constructs within the NPI scores. The Promax rotation maximized the variance of the plotted data on the multi-dimensional axes to allow the most reasonable classification of the 12 neuropsychiatric symptoms into domains. Although among statisticians, there are no generally agreed-upon statistical criteria to decide the most adequate FA model, we selected the best model based on our following arbitrary three conditions: 1) the variance of the FA model is statistically equivalent to that of the data, 2) the sum of squared loadings (SSL) is more than 1.00 for each domain, and 3) any domain must have more than one sub-syndrome. We also calculated Cronbach’s [24] α to estimate the internal consistency of the one-dimensionality and correlation coefficients between factors.
We used a graded response model for the five-point ordinal stages based on the item response theory to evaluate the quality of each item [25] and applied the item response category characteristic curves (IRCCCs) for each domain identified by the FA indicating the probabilities that a patient’s response will fall in a specific category against the “ability” shown as a continuous variable. The term “ability” refers to latent constructs: for example, hyperactivity, psychosis, affect, and apathy. If the curves for an item feature clear peaks dispersed across a possible range of the ability, we considered that the questionnaire description could work well because it can statistically discriminate different levels of ability. Besides this visual check, we also calculated the difficulty parameter (DF) (location) and the discrimination parameter (DIS) (steepness) of the IRCCCs. The DF value must be between –4 and 4 because this range represents a > 99.99% confidence interval for the ability in the population. The DIS value should be between 0.75 and 1.50 to hold a local dependence in the domain [26, 27]. If DF and DIS do not fall within these possible ranges, we should consider that the quality of the item is insufficient, and the assessment scale requires revisions. Finally, we used the areas under the item information curves (IICs) to represent the accuracy in estimating the ability.
Moreover, we applied the TDD scores for the dimensional scores of the NPI and calculated a correlation coefficient between the TDD and NPI distress scores.
Ethics approval and consent to participate
We conducted the TRIAD1412 study under the Declaration of Helsinki and its later amendments, following approval from our institution’s ethics committee and the Japanese Ministry of Health, Labour, and Welfare (“Ethical Guidelines for Medical Research Involving Human Subjects,” clinical trial registration number: NCT02667665). We received informed consent in writing from each patient or their legal guardian, as well as from each patient’s caregiver, before participation.
RESULTS
Patient characteristics
The complete TRIAD1412 dataset consisted of data from 312 patients (126 men and 186 women). The median age of the sample was 81 years (range: 54–96 years). The severities of the symptoms that were subjectively diagnosed by physicians were probable MCI, and mild, moderate, and severe BPSD in 63 (20.2%), 88 (28.2%), 106 (34.0%), and 55 (17.6%) patients, respectively. We indicated the mean and the standard deviation of the MMSE and ABC-DS (TDD) scores per physician-diagnosed AD severity physician (Table 1).
NPI scores and caregiver burden
The mean total NPI scores (severity×frequency) were 6.7, 8.2, 11, and 21 for the patients in the AD stage of probable MCI, and the mild, moderate, and severe categories of BPSD, respectively. As shown in Table 1, we found that the frequency and severity of neuropsychiatric symptoms varied according to the stage of the disease, and there was no clear tendency toward deterioration. Furthermore, caregiver distress scores related to an item of BPSD also varied at different severities.
When we inspected the severity and frequency of symptoms per AD stage in the table, we found that apathy was the most severe and frequent symptom in all phases, followed by appetite and eating abnormalities, which were noted even in mild stages of dementia. Caregivers for patients with probable MCI considered that hallucination was the most burdensome among the 12 symptoms, followed by irritability.
Delusions, agitation, depression, euphoria, and disinhibition were more burdensome for the caregivers of patients with mild AD than for those of patients with other AD levels. Similarly, anxiety, apathy, aberrant motor behavior, night-time behavior, and appetite and eating abnormalities were more burdensome for the caregivers of patients with severe AD than for those of patients at other levels of AD.
Factor analysis
We compared the four-factor (Table 2) and three-factor (Table 3) FA models. The former had no difference in variance between the model and the data (p = 0.447); however, because the SSLs of Factors 3 and 4 were less than 1.00, and Factor 2 had only one sub-syndrome (i.e., appetite and eating abnormalities), we rejected the four-factor model because it did not satisfy our decision criteria. We then selected the three-factor model as an adequate alternative because it met our requirements. The three-factor model did not reject the null hypothesis (p = 0.068) concerning a difference in variance between the model and the data. The SSLs of all factors were higher than 1.00, and all domains had more than one sub-syndrome. The three-factor model explained 30% of the variation in the data. We also found that the factors were correlated with each other (Table 3): Factor 1 was negatively associated with Factors 2 and 3, and Factors 2 and 3 were positively correlated with each other.
Table 2
Factor analysis of the NPI: four-factor model
| NPI item | Loadings | |||
| Factor 1 | Factor 2 | Factor 3 | Factor 4 | |
| Delusions | –0.15 | 0.67 | ||
| Hallucinations | 0.15 | 0.60 | –0.22 | |
| Agitation | 0.64 | 0.21 | ||
| Depression | 0.14 | –0.14 | 0.45 | |
| Anxiety | 0.71 | |||
| Euphoria | 0.37 | |||
| Apathy | 0.15 | 0.17 | 0.15 | |
| Disinhibition | 0.43 | 0.19 | –0.11 | |
| Irritability | 0.79 | |||
| Aberrant motor behavior | 0.21 | 0.16 | ||
| Night-time behavior disturbances | 0.28 | 0.35 | ||
| Appetite and eating abnormalities | 1.04 | |||
| SS loadings | 1.50 | 1.14 | 0.98 | 0.97 |
| Proportion Variance | 0.13 | 0.10 | 0.08 | 0.08 |
| Cumulative Variance | 0.13 | 0.22 | 0.30 | 0.38 |
| Factor Correlations: | Factor 1 | Factor 2 | Factor 3 | Factor 4 |
| Factor 1 | 1.00 | 0.34 | –0.33 | 0.24 |
| Factor 2 | 0.34 | 1.00 | –0.39 | 0.46 |
| Factor 3 | –0.33 | –0.39 | 1.00 | –0.34 |
| Factor 4 | 0.24 | 0.46 | –0.34 | 1.00 |
Table 3
Factor analysis of the NPI-D: three-factor model
| NPI-D item | Loadings | ||
| Factor 1 | Factor 2 | Factor 3 | |
| Delusions | –0.18 | 0.60 | |
| Hallucinations | 0.10 | 0.67 | –0.24 |
| Agitation | 0.62 | –0.11 | 0.22 |
| Depression | 0.16 | –0.15 | 0.47 |
| Anxiety | 0.71 | ||
| Euphoria | 0.36 | ||
| Apathy | 0.13 | 0.19 | 0.16 |
| Disinhibition | 0.44 | 0.14 | |
| Irritability | 0.76 | ||
| Aberrant motor behavior | 0.19 | 0.19 | 0.11 |
| Night-time behavior disturbances | 0.31 | 0.38 | |
| Appetite and eating abnormalities | 0.23 | ||
| SS loadings | 1.42 | 1.09 | 1.04 |
| Proportion Variance | 0.12 | 0.09 | 0.09 |
| Cumulative Variance | 0.12 | 0.21 | 0.30 |
| Factor Correlations: | Factor 1 | Factor 2 | Factor 3 |
| Factor 1 | 1.00 | –0.43 | –0.47 |
| Factor 2 | –0.43 | 1.00 | 0.44 |
| Factor 3 | –0.47 | 0.44 | 1.00 |
To inspect the quality of the items using the item response theory, we made three domains 1, 2, and 3 composed of 1) “agitation, euphoria, disinhibition, irritability, and aberrant motor behavior,” 2) “delusion, hallucinations, apathy, and appetite and eating abnormalities,” and 3) “depression, anxiety, and night-time behavior disturbance,” respectively (Table 3). Considering the sub-syndromes belonging to each domain, we then labeled the domains 1, 2, and 3 as hyperactivity, psychosis and apathy, and affect, respectively. Cronbach’s α value was 0.68.
Item characteristic curves
The difficulty and discrimination parameters for a graded response model are shown in Table 4. We showed the IRCCCs of the domains in Supplementary Figures 1–3. Five of the 12 items, namely agitation, irritability, delusions, hallucinations, depression, and anxiety, featured difficulty parameter values between –4 and 4. We did not find negative values for the difficulty parameter for any of the items, except for apathy. Only three items, namely euphoria, aberrant motor behavior, and night-time behavior disturbances, had discrimination parameter values between 0.75 and 1.50. The IRCCCs indicated that three items, i.e., euphoria, apathy, and appetite and eating abnormalities, contributed amounts of information less than 0.50 (Supplementary Figures 1–3).
Table 4
Parameters of the item characteristic curves
| Domain | Sub-syndrome | DF1 | DF2 | DF3 | DF4 | DF5 | DIS | Info |
| 1 | Agitation | 1.11 | 1.39 | 2.05 | 2.84 | 3.24 | 2.14 | 4.82 |
| Euphoria | 3.93 | 4.45 | 5.23 | 6.33 | 7.16 | 0.85 | 0.46 | |
| Disinhibition | 2.37 | 2.70 | 3.56 | 4.34 | 4.58 | 1.55 | 1.99 | |
| Irritability | 0.99 | 1.23 | 1.82 | 2.51 | 2.85 | 3.16 | 8.54 | |
| Aberrant motor behavior | 1.92 | 2.34 | 3.38 | 4.18 | 4.34 | 0.86 | 0.91 | |
| 2 | Delusions | 1.24 | 1.44 | 1.89 | 2.66 | 3.19 | 3.39 | 9.22 |
| Hallucinations | 2.17 | 2.40 | 2.91 | 3.49 | 3.80 | 2.14 | 3.67 | |
| Apathy | –0.05 | 0.38 | 2.00 | 4.49 | 5.78 | 0.42 | 0.38 | |
| Appetite and eating abnormalities | 3.83 | 4.43 | 7.34 | 10.47 | 11.30 | 0.34 | 0.16 | |
| 3 | Depression | 1.52 | 1.90 | 2.70 | 3.52 | 3.91 | 1.59 | 2.75 |
| Anxiety | 1.17 | 1.45 | 1.88 | 2.30 | 2.57 | 2.49 | 5.16 | |
| Night-time behaviour disturbances | 1.83 | 2.11 | 2.86 | 3.86 | 4.39 | 1.05 | 1.29 |
DF, difficulty parameter; DIS, discrimination parameter; Info, total information that is an under the area of the information function curve from –4 to 4 of the horizontal axis or the ability. Domains 1, 2, and 3 were named by hyperactivity, psychosis and apathy, and affect, respectively.
DISCUSSION
In this study, we assessed the BPSD profiles of patients in the TRIAD1412 trial and discussed the limitations of the NPI assessment scale. Factor analysis revealed the presence of three domains in the NPI: hyperactivity, psychosis and apathy, and affect. We found that depression and apathy did not belong to the same latent construct. We also found that hyperactivity had a negative correlation with both (a) affect and (b) psychosis and apathy, which were positively correlated with each other.
We evaluated the characteristics of the items using the IRCCCs and showed that euphoria, apathy, and appetite and eating abnormalities did not provide sufficient information to estimate the severity of BPSD. Only six of the 12 items had difficulty parameters within the reasonable range. Given that the values of the difficulty parameters were positive for all items, except apathy, the NPI should be used while knowing limitation that it is difficult for quantitative evaluation of mild or unknown severity stages of BPSD. If patients have mild or unknown severity stages of BPSD, the NPI can evaluate presence or absence of symptoms but cannot sufficiently differentiate the degree of severity, signifying that the NPI is not suitable for screening the severity stages of BPSD.. The item information from the three items, namely euphoria, apathy, and appetite and eating abnormalities, was sufficiently small to forestall discrimination of neurological disorders characterized by these symptoms.
It is important to assess the neuropsychiatric symptoms of patients and the caregiver distress associated with these symptoms during the clinical course because these symptoms are associated with increased burden, depression among caregivers, and increased rates of institutionalization of patients [28]. In our study, although the neuropsychiatric symptoms became more severe across the clinical course of the disease, the types of symptoms of BPSD and caregiver burden related to these symptoms varied according to the stage of dementia. Furthermore, we found a dissociation between the severities of some of the symptoms of BPSD and caregiver distress associated with those symptoms. These findings suggest that a more accurate scale for assessing neuropsychiatric symptoms is required, even though the assessment may continue to depend on the subjective impressions of caregivers. There is scope for revising the NPI by considering the item characteristics identified in this study.
Previous studies have indicated the limitations of the NPI. Kørner et al. [29] concluded that the Danish version of the NPI is valid and reliable for the assessment of neuropsychiatric symptoms in dementia, but its scalability was insufficient; they did not recommend the use of single-item scores and the total sum score. Lai [30] insisted that the scale could not discriminate between dementia and other neurological disorders, and the factor structure, responsiveness, and clinical utility of the NPI should be improved by revision. We consider that these points of criticism are reasonable.
When we evaluate the total NPI score, the score is usually valid only if the NPI features one-dimensionality. However, we found that the NPI is a three-dimensional scale; the low Cronbach’s α (0.68) refutes its one-dimensionality. We also suggested the weakness of the NPI in that the item characteristics of the NPI scale are insufficient, and not only the total score but also the single item scores are not sufficiently robust for accurate estimation of the severity of BPSD.
The drawbacks of this scale mentioned above may be addressed by using either the individual domain scores or the TDD [9]. The TDD is a better choice if we wish to estimate the overall severity of BPSD by the NPI that has three dimensions. We can calculate the TDD for the NPI scale using the following formula:
Fig. 1
Correlation between NPI distress score (total) and TDD score. TDD for NPI-D can be calculated by
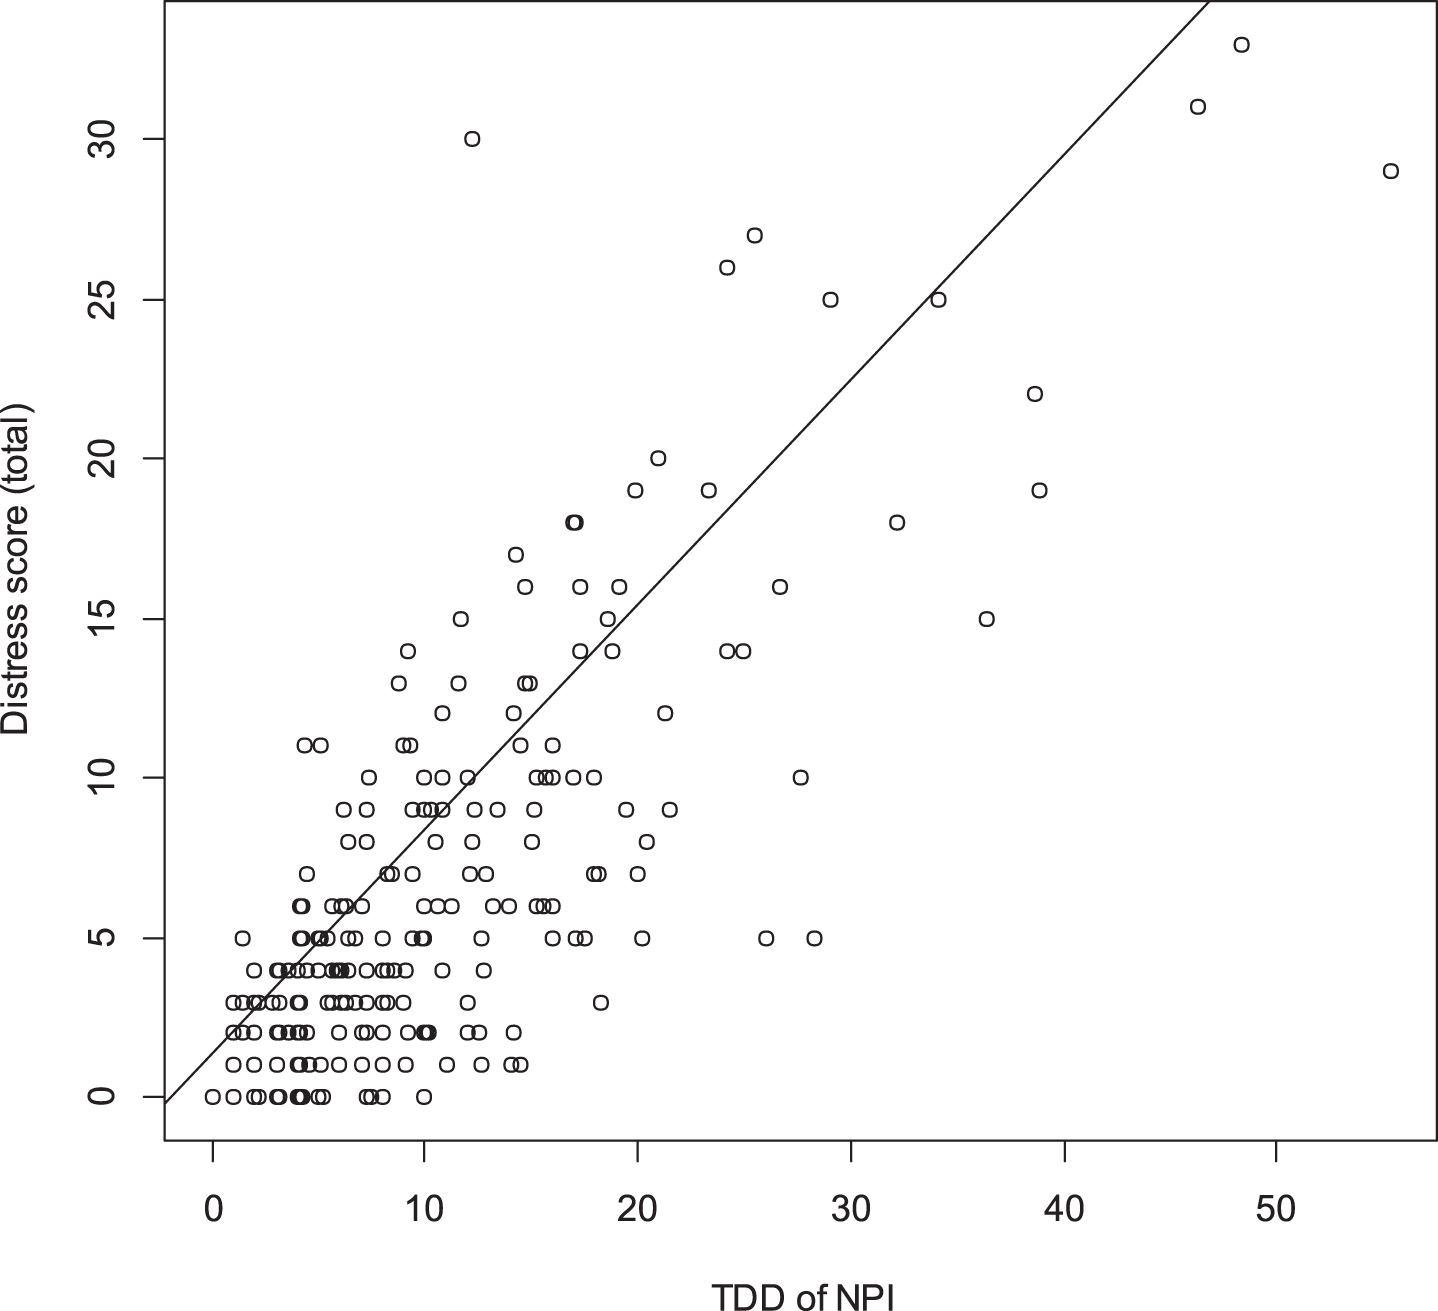
The present study has two significant limitations. First, nobody in the past did a language validation for the Japanese version of the NPI; thus, the equivalence between English and the Japanese translations of the NPI is contestable. Second, the results of FA and the IRCCC behavior depend on the sampled population. Likely, the severity of symptoms of the patients in the TRIAD1410 study may not be comparable to that of the “true population” of patients in Japan. Future studies should enroll patients with more severe dementia and examine the item characteristics of the NPI in correspondingly severe states. Finally, future research should explore the clinical utility of the TDD for the NPI in clinical trials.
Considering the qualities of the item in the NPI by the item response theory, the questionnaire was insufficient to estimate the severity of BPSD, and total scores, therefore, had no meaning.
The NPI needs an extensive revision. Otherwise, we should develop a new assessment scale for BPSD by taking account of the item response theory.
CONFLICT OF INTEREST
The authors have no conflict of interest to report.
ACKNOWLEDGMENTS
We thank Mr. Tsukada, Mr. Sugihara, and Mrs. Nakagawa for participating in the data analysis. We also thank Mr. Sakamine for his contribution to this study as a manager.
The technique TDD is patented. Any individual who wants to use it must obtain a license from the owner ().
While Daiichi Sankyo Co., Ltd. funded this research, they did not play a role in the design of the study, data collection, statistical analyses, or writing this paper.
SUPPLEMENTARY MATERIAL
[1] The supplementary material is available in the electronic version of this article: https://dx.doi.org/10.3233/ADR-200172.
REFERENCES
[1] | Cummings JL , Mega M , Gray K , Rosenberg-Thompson S , Carusi DA , Gornbein J ((1994) ) The Neuropsychiatric Inventory: Comprehensive assessment of psychopathology in dementia. Neurology 44: , 2308–2314. |
[2] | Cummings JL , McPherson S ((2001) ) Neuropsychiatric assessment of Alzheimer’s disease and related dementias. Aging (Milano) 13: , 240–246. |
[3] | Matsumoto N , Ikeda M , Fukuhara R , Hyodo T , Ishikawa T , Mori T , Toyota Y , Matsumoto T , Adachi H , Shinagawa S , Hokoishi K , Tanabe H , Hirono N ((2006) ) Validity and reliability of the Japanese version of the Neuropsychiatric Inventory Caregiver Distress Scale (NPI D) and the Neuropsychiatric Inventory Brief Questionnaire Form (NPI-Q) (in Japanese). No To Shinkei 58: , 785–790. |
[4] | Kaufer DI , Cummings JL , Christine D , Bray T , Castellon S , Masterman D , MacMillan A , Ketchel P , DeKosky ST ((1998) ) Assessing the impact of neuropsychiatric symptoms in Alzheimer’s disease: The Neuropsychiatric Inventory Caregiver Distress Scale. J Am Geriatr Soc 46: , 210–215. |
[5] | Aalten P , de Vugt ME , Lousberg R , Korten E , Jaspers N , Senden B , Jolles J , Verhey FR ((2003) ) Behavioral problems in dementia: A factor analysis of the neuropsychiatric inventory. Dement Geriatr Cogn Disord 15: , 99–105. |
[6] | Benoit M , Staccini P , Robert PH , Brocker P , Benhamidat T , Bertogliati C , Vellas B ((2002) ) Frequence et analyse factorielle des troubles du comportement dans la maladie d’Alzheimer. Rev Med Interne 24: , 319s–324s. |
[7] | Devanand DP , Brockington CD , Moody BJ , Brown RP , Mayeux R , Endicott J , Sackeim HA ((1992) ) Behavioral syndromes in Alzheimer’s disease. Int Psychogeriatr 4: , 161–184. |
[8] | Frisoni G , Rozzini L , Gozzetti A , Binetti G , Zanetti O , Bianchetti A , Trabucchi M , Cummings JL ((1999) ) Behavioral syndromes in Alzheimer’s disease: Description and correlates. Dement Geriatr Cogn Disord 10: , 130–138. |
[9] | Hope T , Keene J , Fairburn C , McShane R , Jacoby R ((1997) ) Behaviour changes in dementia 2: Are there behavioural syndromes? Int J Geriatr Psychiatry 12: , 1074–1078. |
[10] | McShane R ((2000) ) What are the syndromes of behavioral and psychological symptoms in dementia? Int Psychogeriatr 12: , 147–153. |
[11] | Mirakhur A , Craig D , Hart DJ , McLlroy SP , Passmore AP ((2004) ) Behavioural and psychological syndromes in Alzheimer’s disease. Int J Geriatr Psychiatry 19: , 1035–1039. |
[12] | Fuh JL , Wang SJ , Cummings JL ((2005) ) Neuropsychiatric profiles in patients with Alzheimer’s disease and vascular dementia. J Neurol Neurosurg Psychiatry 76: , 1337–1341. |
[13] | Schreinzer D , Ballaban T , Brannath W , Lang T , Hilger E , Fasching P ((2005) ) Components of behavioral pathology in dementia. Int J Geriatr Psychiatry 20: , 137–145. |
[14] | Everitt B ((2005) ) An R and S-plus companion to multivariate analysis. Springer, London. |
[15] | Mori T , Kikuchi T , Umeda-Kameyama Y , Wada-Isoe K , Kojima S , Kagimura T , Kudoh C , Uchikado H , Ueki A , Yamashita M , Watabe T , Nishimura C , Tsuno N , Ueda T , Akishita M , Nakamura Y ; ABC Dementia Scale Study Group ((2018) ) ABC Dementia Scale: A quick assessment tool to determine Alzheimer’s disease severity. Dement Geriatr Cogn Dis Extra 8: , 85–97. |
[16] | Kikuchi T , Mori T , Wada-Isoe K , Umeda-Kameyama Y , Kagimura T ((2018) ) A novel dementia scale for Alzheimer’s disease. J Alzheimers Dis Parkinsonism 8: , 2. |
[17] | Feldman H , Sauter A , Donald A , Gelinas I , Gauthier S , Torfs K , Parys W , Mehnert A ((2001) ) The disability assessment for dementia scale: A 12-month study of functional ability in mild to moderate severity Alzheimer disease. Alzheimer Dis Assoc Disord 15: , 89–95. |
[18] | Folstein MF , Folstein SE , McHugh PR ((1975) ) “Mini-mental state”: A practical method for grading the cognitive state of patients for the clinician. J Psychiatr Res 12: , 189–198. |
[19] | Hughes CP , Berg L , Danziger W , Coben LA , Martin RL ((1982) ) A new clinical scale for the staging of dementia. Br J Psychiatry 140: , 566–572. |
[20] | American Psychiatric Association ((2000) ) Diagnostic and Statistical Manual of Mental Disorders, 4th ed. American Psychiatric Association, Washington. |
[21] | McKhann GM , Knopman DS , Chertkow H , Hyman BT , Jack CR Jr , Kawas CH , Klunk WE , Koroshetz WJ , Manly JJ , Mayeux R , Mohs RC , Morris JC , Rossor MN , Scheltens P , Carrillo MC , Thies B , Weintraub S , Phelps CH ((2011) ) The diagnosis of dementia due to Alzheimer’s disease: Recommendations from the National Institute on Aging-Alzheimer’s Association workgroups on diagnostic guidelines for Alzheimer’s disease. J Alzheimers Dementia 7: , 263–269. |
[22] | McKhann G , Drachman D , Folstein M , Katzman R , Price D , Stadlan EM ((1984) ) Clinical diagnosis of Alzheimer’s disease: Report of the NINCDS-ADRDA Work Group under the auspices of Department of Health and Human Services Task Force on Alzheimer’s Disease. Neurology 34: , 939–944. |
[23] | Albert MS , DeKosky ST , Dickson D , Dubois B , Feldman HH , Fox NC , Gamst A , Holtzman DM , Jagust WJ , Petersen RC , Snyder PJ , Carrillo MC , Thies B , Phelps CH ((2011) ) The diagnosis of mild cognitive impairment due to Alzheimer’s disease: Recommendations from the National Institute on Aging-Alzheimer’s Association workgroups on diagnostic guidelines for Alzheimer’s disease. Alzheimers Dement 7: , 270–279. |
[24] | Cronbach LJ ((1951) ) Coefficient alpha and the internal structure of tests. Psychometrika 16: , 297–334. |
[25] | Thissen D , Wainer H (Eds.) ((2001) ) Test scoring. Routledge, New York. |
[26] | Nguyen TH , Han HR , Kim MT , Chan KS ((2014) ) An introduction to item response theory for patient-reported outcome measurement. Patient 7: , 23–35. |
[27] | Streiner DL , Norman GR , Cairney J ((2015) ) Health measurement scales: A practical guide to their development and use. Oxford University Press, New York. |
[28] | Black W , Almeida OP ((2004) ) A systematic review of the association between the behavioral and psychological symptoms of dementia and burden of care. Int Psychogeriatr 16: , 295–315. |
[29] | Kørner A , Lauritzen L , Lolk A , Abelskov K , Christensen P , Nilsson FM ((2008) ) The Neuropsychiatric Inventory–NPI. Validation of the Danish version. Nord J Psychiatry 62: , 481–485. |
[30] | Lai CK ((2014) ) The merits and problems of Neuropsychiatric Inventory as an assessment tool in people with dementia and other neurological disorders. Clin Interv Aging 9: , 1051–1061. |


