
Design and feasibility of a 30- to 40-knot emission-free ferry
Abstract
This paper explores the design and feasibility of a 200-passenger, 30- to 40-knot emission-free ferry as a potential variant of the traditionally powered Coastal Cruiser 200 ferry currently operating in the Chinese Pearl River Delta. The Pearl River Delta is one of China’s most densely urbanized regions and faces numerous social, health, and economic issues due to air pollution. In addition, globally, there are no currently-operating zero-emission ferries that, at minimum, sail at 30 knots and carry 200 passengers. To assess the feasibility of the new ferry, a two step approach was followed. First, an evaluation of efficiency improving measures, energy carriers, and propulsion systems was performed to assess the tradeoffs and identify early design choices. Second, to quantify the most technically feasible design, a technical parametric model was developed specifically for this case study. Results showed that the ferry is technically feasible using batteries, compressed hydrogen fuel cells, or liquid hydrogen fuel cells; however, each has its distinct advantages and disadvantages which influence the potential final viability. Despite the regional focus of the case study, results are applicable to all ferries with similar design requirements.
1.Introduction
Globally around 66,000 people die prematurely due to ship-related air pollution each year, and roughly one-third of these deaths happen in China [39]. Premature deaths are one of the most considerable effects of ship-related harmful health emissions, which mainly consist of
To help address this problem, this research explored the design and feasibility of a 200-passenger, 30- to 40-knot emission-free ferry for use in the Chinese Pearl River Delta, where currently a ferry named the Coastal Cruiser 200 (CC-200) (Fig. 1) uses traditional power and propulsion to operate. The current CC-200 takes part in the Pearl River Delta’s river transportation services, commonly sailing the 25 NM route between Zhuhai and Shenzhen. During a one-way trip on the Zhuhai–Shenzhen route, the CC-200 spends 50 minutes in transit, 10 minutes maneuvering in port, and 30 minutes in port between its trips [20]. On average, the ferry completes nine trips per day.
![A CC-200 operating in the Pearl River Delta [6].](https://ip.ios.semcs.net:443/media/isp/2023/70-2/isp-70-2-isp230005/isp-70-isp230005-g001.jpg)
In order to develop a suitable ferry for this route, the new ferry should also meet the high speed requirements of the current CC-200 to stay commercially competitive. To test the feasibility of this new emission-free ferry concept, the following requirements were set: a transit speed of at least 30 knots, a passenger capacity of 200, a minimum range of 30 NM, a zero-emission power, propulsion, and energy system, the ability to operate on the CC-200’s operating profile, and at least equal safety and comfort levels to the CC-200.
A state-of-the-art review of zero-emission ferries (Table 1) revealed that no zero-emission ferry currently exists that meet the set of requirements. The most prominent and identifiable gap is that no currently-operating, state-of-the-art, zero-emission ferry offers a passenger capacity of at least 200 in combination with a 30- to 40-knot service speed. Thus, the feasibility of the ferry cannot be concluded by a state-of-the-art review alone. Therefore, the objective of this research is to investigate the feasibility of a 200-passenger, 30- to 40-knot emission-free ferry operating on the Zhuhai–Shenzhen route in the Pearl River Delta, where technical feasibility is defined as compliance with the main requirements provided above.
Table 1
Overview of state-of-the-art zero-emission ferries and ferry feasibility studies [4,8,19,22,24,53,57,58,60,64,70]
| Zero-emission ferry | State of development | Energy source | Capacity (-) | Speed (knots) |
| MF Ampere | Operating since 2015 | Batteries | 360 pax, 120 cars | 10 |
| BB Green | Built 2016 (not in service) | Batteries | 80 pax | 28 |
| Medstraum | In construction June 2021 | Batteries | 150 pax | 23 |
| SF-BREEZE | Concept (2016) | 150 pax | 35 (60% of transit time) | |
| Sea Change | Built early 2021 | 75 pax | 22 | |
| Beluga24 | Expected operation 2023 | Batteries / | 150 pax | 30 |
| Zero-emission CC-300 | Feasibility study (2019) | 300 pax | 30 | |
| NAVAIS ferry family | Project ended 2022 | Batteries | ⩽ 450 pax, 120 cars | 8.5–23 |
2.High level approach and initial design tradeoffs
This research followed a high level two step approach to meet this research objective. First, an evaluation of efficiency improving measures, energy carriers, and propulsion systems was performed to assess the tradeoffs and identify early design choices for the ferry (Section 2). This section is not intended to be a detailed review of all the literature, but instead to be an evaluation of the relevant technologies and approaches that may be applicable to this ferry concept. Second, to quantify and determine the most technically feasible design, a custom parametric model was developed (Section 3) and used in a study focused on the targeted Zhuhai–Shenzhen route (Section 4).
2.1.Improving the efficiency of fast ferries
Two approaches were used to improve the efficiency of fast ferries: first by weight saving measures, and second by implementing hydrofoils.
2.1.1.Weight saving measures
Several weight saving measures were studied: (1) using fiber reinforced composites, (2) removing unnecessary items, and (3) reducing the mass of the currently equipped items. In addition, the weight difference between removing the old diesel engine and propulsion system and the added weight of new power, propulsion, and energy system was considered.
First, carbon fiber-reinforced polymers (CFRP) were identified as one of the major solutions to help reduce structural weight; however, the weight savings of using CFRP instead of metals, such as steel or aluminum, is hard to calculate directly without a detailed design. CFRP is a nonhomogeneous material, meaning that the material properties fluctuate depending on the direction of the force. In a CFRP ship hull, the fibers’ orientation can be placed along the path of the load in a particular component, making a weight estimation based on material properties alone inaccurate. Studies have shown that CFRP structures are approximately 20% to 30% lighter than glass fiber-reinforced structures [25]. For this reason, the weight saving of using a fiber-reinforced hull instead of a metal hull was estimated based on five case studies that researched this exact problem. Those studies, and their relevant ship type, concluded a structural weight saving of:
For the zero-emission CC-200, CFRP could be applied as the material for the hull, superstructure, and U-shaped fender, which are currently constructed from aluminum. Considering that the hull of the CC-200 is already optimised for a low weight, a structural weight saving of 35% has been assumed for this research.
The second identified weight-saving measure consists of the removal of unnecessary items when switching to the zero-emission variant. These include removing: watertight doors placed between the engine room and auxiliary room, the thermal insulation of the interior arrangement which is possible due to the heat conductivity of composites that is around 40 times lower compared to aluminum [1], and the extra noise insulation of the auxiliary rooms due to the reduced noise signature of electric motors.
The third measure taken to lower the mass involves replacing several items with lighter variants. For most items, this measure makes the ferry either more expensive or less comfortable, which is why the measure has not been taken for the original CC-200. First, the glass windows on the upper and main deck can be replaced for polycarbonate windows, saving around 50% in weight [55]. Next, the cooling water system can be replaced with an air cooling system, which is assumed to weigh 70% less as it eliminates the need for metal piping and carrying water in the system. The mass of the electrical systems can also be reduced. The current lead-acid batteries can be replaced with Li-ion batteries, which are almost 60% lighter [36]. Also, the copper electric cables of the control, power, and communication systems can be replaced with aluminum cables, which will save around 40% in weight [12]. Lastly, the ferry can be equipped with lighter standard and VIP seats, saving 22% and 39% in weight, respectively [41].
2.1.2.Use of hydrofoils
As reducing the ferry’s energy consumption was one of the main focuses of this study, hydrofoils were identified as a potential solution to help reach this goal. [22] concluded that the larger 300-person variant of the Coastal Cruiser powered by batteries or hydrogen and sailing at a speed of 30 knots would not benefit from implementing hydrofoils due to the considerable weight of the vessel. This research re-examined the use of hydrofoils as the smaller and lighter CC-200 would increase the likelihood of a feasible hydrofoil system, as studies have shown that the effectiveness of hydrofoil systems is reduced as the ship size increases [44]. Fully submerged hydrofoils were selected over surface piercing hydrofoils due to their high seaworthiness, good high speed maneuverability, and higher lift-to-drag ratio. A hydrofoil and resistance model was created as part of the parametric model to assess the technical performance of this design choice (see Section 3).
2.2.Energy carriers
Batteries and hydrogen fuel cells were examined as to their suitability for the zero-emission CC-200.
2.2.1.Batteries
Various battery options were examined, and Li-ion batteries were selected due to their high gravimetric and volumetric energy density [5]. Specifically, Lithium Manganese Oxide (LMO), Nickel Manganese Cobalt (NMC), Litium Iron Phosphate (LFP), and Lithium Cobalt Oxide (LCO) were examined based on the criteria energy density, life-cycle cost, safety, charging, and availability. Table 2 presents the comparison of the examined batteries where it was concluded that NMC or LTO batteries are likely to be the most suitable battery option for the ferry. For the detailed analysis, the NMC battery is used to test the technical feasibility in Section 4.
Table 2
Comparison of LMO, NMC, LFP and LTO batteries
| Battery | Energy density (Wh/kg) | Life-cycle cost (USD/(kWh*cycle)) | Safety | Charging capability | Availability |
| [48,73] | [3] | [13,17,45,69,73] | [3,62] | [17,26,35,69] | |
| LMO | 100–140 | 0.0875 | Good | Good | Average |
| NMC | 140–200 | 0.113 | Average | Average | Very good |
| LFP | 90–140 | 0.233 | Good | Good | Good |
| LTO | 45–100 | 0.0750 | Very good | Very good | Good |
2.2.2.Fuel cells
Fuel cells can be divided into low-temperature fuel cells, which operate at 50°C to 220°C, and high-temperature fuel cells, which operate above 650°C. High temperature fuel cells were eliminated from consideration due to their long start up times (30 minutes to several hours), longer time for load transients (0–100%) (15 minutes compared to less than 10 seconds for low temperature), and lower power density. For example, high temperature solid oxide fuel cells (SOFCs) have a gravimetric power density of 20 to 230 (W/kg) and a volumetric power density of 8 to 60 (W/l). Meanwhile low temperature proton exchange membrane fuel cells (PEMFCs) achieve up to 229 W/kg and 138 W/l [52].
The following low-temperature fuel cell types have been studied: alkaline (AFC), phosphoric acid (PAFC), and PEMFCs. AFCs have an efficiency of around 50% to 60% and are generally seen as low-cost systems. They have some notable disadvantages, including require a separate potassium hydroxide (KOH) solution to supply the fuel cell module, a high intolerance to
PEMFCs are considered one of the most versatile types of fuel cells and are being used in applications like transport and portable power with an excellent track record. It was thus concluded that a PEMFC would be the most suitable type of fuel cell due to its highest power output per given weight or volume [51], short start-up time, commercial availability, and possibility to operate on pure hydrogen.
In terms of hydrogen storage, both compressed (
2.3.Propulsion
Three main categories of propulsion systems were examined: waterjets, propellers, and thrusters. Waterjets are traditionally the propulsion system of choice for high-speed vessels as they provide a low risk of cavitation [72], have a relatively high power density [23], and emit little waterborne noise [42]. However, using waterjets with a hydrofoil system would significantly lower their efficiency due to the pressure loss caused by the seawater that would have to be pumped through two 90-degree bends and a strut of over 2 meters in height. In addition, the resistance of the vessel would also be higher, as the struts need to be larger in order to house the waterjet inlet ducting. Moreover, waterjets come with high initial costs. Therefore, waterjets may be possible for non-hydrofoil configurations, but were removed from consideration for configurations that employ hydrofoils.
When comparing propellers and thrusters, propellers are likely less expensive. However, they come with a significant set of disadvantages when combined with a hydrofoil system. First, additional support struts are required for the propeller shaft, which increases resistance and weight. Secondly, the propeller shaft should be designed to be as parallel as possible to the water surface. Therefore, it would be a long shaft, increasing resistance, weight, vibrations, and limiting the flexibility in the placement of the prime mover.
Propellers mounted to L-drive or Z-drive thrusters provide a solution to some of these disadvantages. The thruster’s propulsion shaft can be designed to be inside the struts, which would not cause a significant resistance, vibration, or weight increase. Besides, many thrusters have also been designed with electric motors in mind, which is an advantage for the zero-emission CC-200. Although most commercially available thrusters are designed for lower service speeds and are not plug-and-play compatible with hydrofoil ships, it is expected that modifications can be made to overcome these challenges, like mounting a custom propeller or electric motor, elongating the propulsion shaft, or eliminating the 360-degree steerability feature by fixing the bottom part of the thruster to the foils. For these reasons, thrusters are chosen as the propulsion system if hydrofoils are the chosen configuration.
3.Parametric model
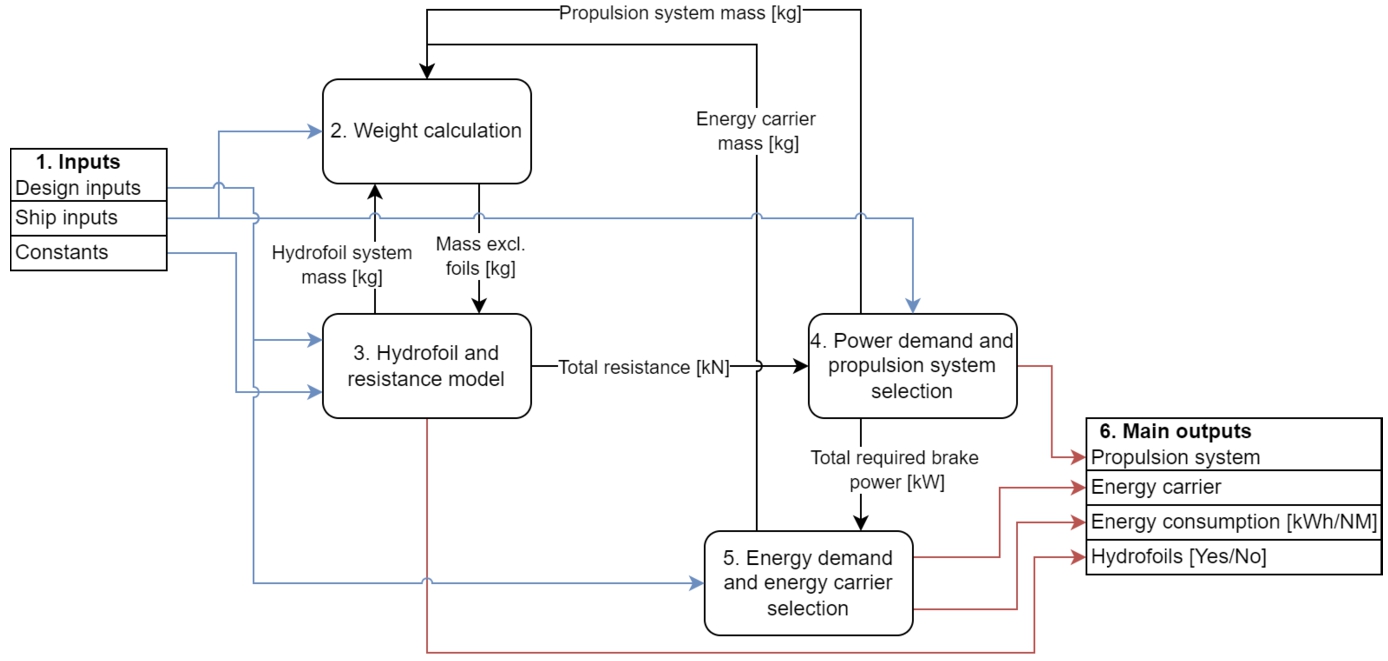
Following the initial trade-offs in Section 2, a parametric model was developed to assess the feasibility of the ferry concept. A flowchart of the parametric model is shown in Fig. 2, which consists of the following main modules: 1) inputs, 2) weight calculation, 3) hydrofoil and resistance model, 4) power demand and propulsion system selection, 5) energy demand and energy carrier selection, and 6) outputs. Due to the interdependencies between various modules, three loop structures have been implemented to ensure convergence of the parametric model. These three loop structures are:
(1) A hydrofoil mass loop between modules 2 and 3, to ensure convergence on the weight estimation including the hydrofoil weight;
(2) A power demand and propulsion system selection loop (modules 2, 3 and 4), to ensure a correct match between the power demand, and electric motor and gearbox selection;
(3) A main loop, controlling the correct mass of the zero-emission energy carrier (module 5), propulsion system (module 4), and hydrofoil system (module 3) input to the model’s weight calculation module (module 2).
Fig. 2.
A flowchart of the developed parametric model.
3.1.Inputs
The parametric model requires inputs related to design inputs, ship inputs, and constants. The inputs include:
Design inputs
∗ Design velocity: Valid values are 30, 32, 34, 36, 38, and 40 [knots].
∗ Required range: Range includes 30 NM to 90 NM.
∗ Use of composites: Choice to use: yes/no.
∗ Remove unnecessary items: Choice to use: yes/no.
∗ Reduce weight of items: Choice to use: yes/no.
Ship inputs
∗ Maximum mass of the CC-200 [kg]
∗ CC-200 diesel engine and propulsion-related systems mass [kg]
∗ Weight saving due to use of composites [kg]
∗ Weight saving due to the removal of unnecessary items [kg]
∗ Weight saving due to a reduction in weight of items [kg]
∗ Air resistance coefficient [-]: Air resistance coefficient for catamarans in foilborne mode, assumed to be 0.9. Typical values lie between 0.6 and 0.9 [43].
∗ Waterline length CC-200 [m]
∗ Foilborne frontal area [
∗ Planing frontal area [
∗ Available volume energy carrier [
∗ Hotel load [kW]: Hotel load of CC-200, assumed to be 50 kW.
Constants
∗ Air density (
∗ Seawater density (
∗ Seawater viscosity [
3.2.Weight calculation
The parametric model calculates the weight of the zero-emission ferry excluding hydrofoils (
Where
Depending on the ferry’s speed and range requirement, the parametric model used Equation (2) to estimate the hydrofoil system weight of six to eight tonnes. This outcome was checked by estimating the hydrofoil system weight based on the volume of the foils and the density of the material. This resulted in a mass of approximately 4.30 tonnes for aluminum, 2.80 tonnes for CFRP, and 12.5 tonnes for steel, assuming the foils are not hollow. This is a conservative estimate, as it is likely possible that the mass could become lower, as room inside of the foils is needed for a possible propeller shaft or flap system.
For these reasons, it could be said that the expected hydrofoil system weight of six to eight tonnes is overestimated when considering the hydrofoils are expected to be constructed from aluminum or CFRP. However, if a zero-emission hydrofoil CC-200 were to be built, it would need local structural reinforcements on the hull to cope with the forces from the struts, which can lift the entire ferry’s weight. These structural reinforcements will add weight. Therefore, a high margin of safety is taken for the expected hydrofoil system weight, which is assumed to compensate for the added weight of the structural reinforcements, which is not yet accounted for.
Since
3.3.Hydrofoil and resistance model
To investigate the potential benefits of a hydrofoil system’s performance on the ferry, a more detailed model is required. For this, the Autowing software [2] was chosen. Autowing uses the vortex lattice method and models a wing configuration advancing at a constant speed in an incompressible, inviscid, and irrotational fluid domain. Effects of viscosity are considered by an iterative procedure following viscous-inviscid flow interaction theory and boundary layer theory. Various studies have found Autowing to be a suitable theoretical design tool and validated that the results of the tool are in good agreement with available experimental results from model tests [33,37,43,47].
Using Autowing, a preliminary assessment of the hydrofoil system’s generated lift and drag in the ferry’s operating conditions were made and the characteristics of the resistance hump were estimated. It was assumed that the resistance hump occurs at a volumetric Froude number
Data of the CC-200’s specifications, such as its mass and dimensions, were used as a basis to form the geometry of a hydrofoil system. It was assumed that the dimensions of the zero-emission ferry’s hull would remain equal to those of the current CC-200. Two lifting foils, one placed aft of the ship and the other placed forward of the ship were chosen in a tandem configuration with equally-sized foils to minimize the geometry’s complexity and keep an equal aspect ratio for both foils. To increase the lift to drag ratio, the span of the foils was chosen to be as long as possible and equal to the ferry’s beam, which is nine meters. The chord of the lifting foils should be as short as possible, but structural considerations constrain it [30]. Furthermore, the span between the struts and the distance between the lifting foils were chosen to be 6 meters and 16 meters, respectively.
The hydrofoil system also consists of four support struts, connecting the lifting foils to the hull of the zero-emission ferry. According to [46], the submergence of the hydrofoils should be at least 1.5 times the chord to avoid most free surface effects, which negatively affect the foil’s lift to drag ratio. For an additional margin of safety, the submergence of the foils was chosen to be two times the chord, or 1.6 meters. It was assumed that in foilborne condition, the zero-emission ferry’s hull would be lifted 1 meter above the free water surface. Therefore, the span of the support struts is 2.6 meters. The forward support struts are constructed from a NACA 0015 profile, while the aft struts will be constructed from a thicker NACA 0024 profile to accommodate a possible propeller shaft or a water intake. The hydrofoil system geometry was modelled using NACA foil profiles, with specifications, span (s), chord (c), profile, and Angle of Attack (AoA), provided in Table 3.
Table 3
Specifications of the defined hydrofoil system geometry
| Foils | s [m] | c [m] | Profile [-] | AoA [deg] |
| Lifting (2x) | 9 | 0.8 | 63-615 | Var. |
| Forw. supp. (2x) | 2.6 | 0.8 | 0015 | 0 |
| Aft supp. (2x) | 2.6 | 0.8 | 0024 | 0 |
The span between the struts was chosen to be six meters. In the modeled geometry, the distance between the lifting foils was chosen to be 16 meters, while the distance from the center of gravity and a lifting foil is eight meters (tandem configuration). However, this can be adapted without many consequences based on the center of gravity of the final ferry, its mass moment of inertia, and design preferences. For example, the ratio of the distance between the foils and the total ship length is slightly smaller compared to other state-of-the-art ferries, which adds a margin of safety. By making this distance larger, the aft lifting foil would experience a more uniform incoming flow, likely resulting in a better lift to drag ratio.
The length of the support struts modeled in Autowing stops at the free water surface and thus the resistance of the part of the struts above the water surface was not accounted for. However, it was assumed that this resistance is negligible compared to the resistance of the hydrofoil system below the free water surface and the air resistance of the ferry itself. Additionally, a number of safety margins were applied where possible to compensate for the resistance that is not accounted for by Autowing. These include the previously mentioned shorter distance between the lifting foils, thicker chord, and longer struts, as well as a relatively high frontal area and air resistance coefficient for the wind resistance calculation. An illustration of the halved hydrofoil system geometry as modeled in Autowing is given in Fig. 3.
Fig. 3.
A halved hydrofoil system geometry modeled in Autowing.
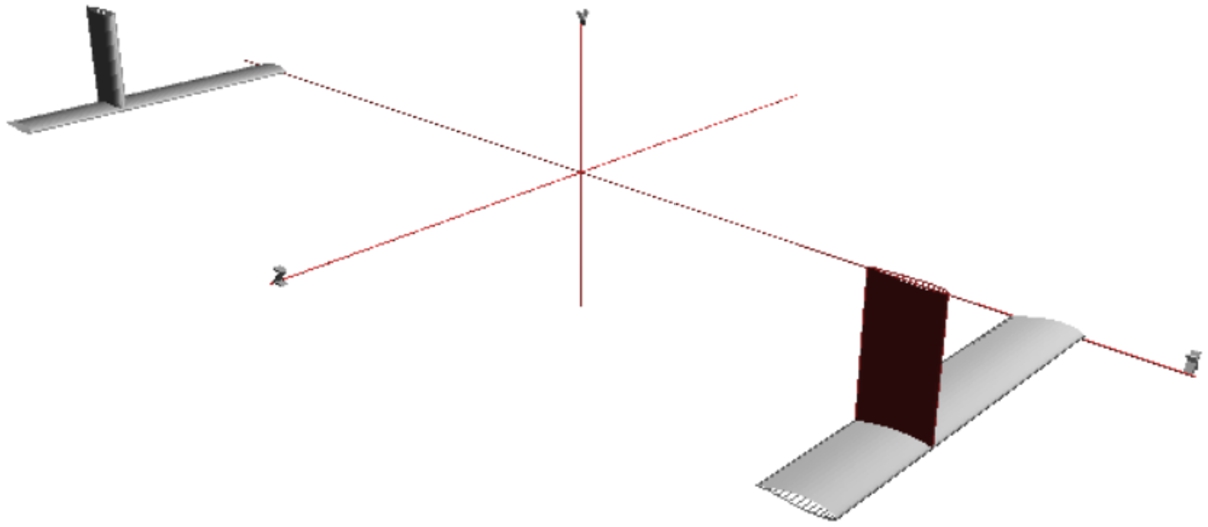
The lift of the hydrofoils was assumed to equal the ship’s mass. The angles of attack have been varied with the goal of achieving lift values of 100 to 150 tonnes, which is the expected range of the zero-emission ferry’s mass. Furthermore, the calculations, each taking around 10 minutes of computing time, used the following inputs:
Configuration, as illustrated in Fig. 3 and Table 3 using NACA 63-615, NACA 0015, and NACA 0024 foils.
Roughness, assumed equal to 40 microns for fresh paint [27]
Coefficient of kinematic viscosity, assumed equal to 1.063
Temperature, assumed equal to 20 degrees Celcius
Number of iterations, set equal to 20 to reach a converged solution for an acceptable computing time
Table 4
Lift and drag data results from experiments using Autowing
| Speed [knots] | Angle of attack [deg] | Lift [t] | Drag [t] | Lift/drag [-] |
| 30 | 4 | 132.6 | −8.06 | 16.44 |
| 30 | 3.5 | 124.7 | −7.38 | 16.89 |
| 30 | 3 | 116.6 | −6.74 | 17.31 |
| 30 | 2.5 | 108.5 | −6.14 | 17.67 |
| 30 | 2 | 100.3 | −5.58 | 17.97 |
| 32 | 4 | 150.1 | −9.28 | 16.17 |
| 32 | 3 | 131.9 | −7.77 | 16.97 |
| 32 | 2.5 | 122.7 | −7.08 | 17.32 |
| 32 | 2 | 113.4 | −6.44 | 17.60 |
| 32 | 1.5 | 104.1 | −5.85 | 17.80 |
| 34 | 2.5 | 137.8 | −8.01 | 17.20 |
| 34 | 2 | 127.4 | −7.28 | 17.49 |
| 34 | 1.5 | 116.9 | −6.61 | 17.69 |
| 34 | 1 | 106.3 | −5.98 | 17.76 |
| 36 | 2 | 142.1 | −8.17 | 17.39 |
| 36 | 1.5 | 130.4 | −7.41 | 17.59 |
| 36 | 1 | 118.6 | −6.71 | 17.68 |
| 36 | 0.5 | 106.3 | −6.04 | 17.59 |
| 38 | 1 | 131.6 | −7.47 | 17.61 |
| 38 | 0.5 | 117.9 | −6.72 | 17.52 |
| 38 | 0 | 104.9 | −6.06 | 17.32 |
| 40 | 0.5 | 130.2 | −7.45 | 17.48 |
| 40 | 0.25 | 122.7 | −7.06 | 17.38 |
| 40 | 0 | 115.8 | −6.70 | 17.28 |
Data of the hydrofoil system’s lift and drag forces is listed in Table 4, where, it can be seen that the acquired lift to drag ratios range between 16.2 and 18.0. These results were compared to lift to drag data from literature. The acquired lift to drag ratios are somewhat higher but in reasonably good agreement with the lift to drag ratios of existing hydrofoil vessels built in the 20th century, which range between 8 and 12.5 [14]. A number of possible reasons can explain the lower lift to drag ratios of the existing vessels. First, the used configurations vary extensively, as the compared hydrofoil vessels use other foil profiles, arrangements, aspect ratios, and speeds that are often higher than 40 knots. Additionally, the lift to drag ratios could be based on the whole vessel (including air resistance), while the acquired lift to drag ratios are based on the hydrofoil resistance only. For the zero-emission CC-200, it should be noted that the effective lift to drag ratios will lower once the (air) resistance of the hull itself is added, which can be significant considering the relatively high operational speed of 30 to 40 knots.
Moreover, researchers that performed experimental validation of lift and drag forces on an asymmetrical hydrofoil found that for an angle of attack between zero and three degrees, the lift to drag ratio can be between 92.6 and 18.5, respectively [9]. Although the results of these studies can not be compared directly to the results of Autowing because of the varying foil geometry and conditions, they indicate that higher lift to drag ratios can be achieved. Therefore, it is assumed that the obtained lift to drag ratios are reasonable and can be used in this research.
Additionally, in regards to the interaction between the two foils, it was seen that the aft foil provided slightly less lift and had a lower lift to drag ratio compared to the forward foil, presumably due to an interaction between the foils. In one of the analyses, both foils provided 116.59 tonnes of lift in total. The forward foil was responsible for roughly 53% of the total lift, while the aft foil caused roughly 47% of the total lift. If the forward foil provides more lift compared to the aft foil, a disruption in the balance of the system may be created. However, it is assumed that this can be compensated by the hydrofoil’s active control system, increasing the angle of attack of the aft foil, or by placing the aft foil a further distance from the ferry’s center of gravity.
By curve fitting the lift and drag force data for each tested speed, the following speed-specific equations (Equations (4) to (9)) were obtained that estimate the resistance of the hydrofoils based on the mass of the ferry and are used to estimate the ferry’s hydrofoil resistance:
For a hydrofoil ferry at operational speed, the air resistance must be added to the hydrofoil drag to obtain the total resistance. The air resistance of the zero-emission ferry in foilborne mode was calculated using Equation (10).
The resistance of the hydrofoil is compared with the resistance of a ferry sailing without hydrofoils in the same conditions. The frictional resistance of the ferry without hydrofoils is calculated using the ITTC-1957 frictional resistance coefficient formula (
Once the frictional resistance coefficient (
Using a combination of above methods, the characteristics of the zero-emission ferry’s resistance hump (
3.4.Power demand and propulsion system selection
The power demand and propulsion system selection part of the parametric model determines the required brake power for the zero-emission ferry. If a hydrofoil system is applied, the parametric model uses the performance of a propeller for further calculations. It is assumed that the modifications required to make a commercially available thruster compatible with a hydrofoil system are feasible. If a hydrofoil system is not applied, it was assumed that a waterjet is used as it is also currently applied on the CC-200.
The propeller calculations are based on the open water characteristics of Wageningen B-series propellers. The PropCalc software was used to evaluate the open water characteristics of the used propeller [68]. Using an optimization method based on a known velocity, thrust, and propeller diameter, PropCalc searches for the optimal open water efficiency configuration and provides the propeller revolutions (
With the delivered propeller power known, the required brake power of the propulsion system is determined using Equation (18), taking the following efficiencies into account: shaft (
3.5.Energy demand and energy carrier selection
The final part of the parametric model calculates the energy demand of the zero-emission ferry and selects an energy carrier system based on the outcome of the power demand and propulsion system selection module. From the range requirement input, the ferry’s operational time is estimated. The energy demand in kWh is obtained by multiplying the operational time with the total power, consisting of total propulsion brake power and hotel load.
Based on the selection of energy carrier systems in Section 2.2, the following three options for the energy carrier system are implemented in the parametric model:
(1) A battery system. For the batteries, the XMP 98P battery module manufactured by Xalt Energy was selected as the most feasible option [71].
(2) A hydrogen fuel cell with
(3) A hydrogen fuel cell with
The parametric model assesses which of these three options is best suited to satisfy the energy demand of the zero-emission ferry. For each option, the energy carrier system’s total mass, volume, and range is calculated. Subsequently, the energy carrier that is both the lightest and most compact is selected. In the situation that none of the three options is both the lightest and most compact, it was assumed that there is a preference for the lightest energy carrier, as long as it fits the volume constraint based on the available room inside the ferry.
3.6.Output
The primary outputs of the parametric model include:
(1) The selected propulsion system
(2) The selected energy carrier
(3) The energy consumption [kWh/NM]
(4) Whether the concept has hydrofoils or not
Using these outputs, the parametric model can be used to investigate what combination of design choices in terms of the emission-free energy carrier, weight saving measures, inclusion of a hydrofoil system, and the propulsion system is expected to result in the most technically feasible configuration for a range of design inputs.
4.Case study
The model was used to both check the technical feasibility of the ferry concept on the Zhuhai–Shenzhen route, as well as to understand the technical boundaries of the zero-emission concept for possible use in other ferry markets.
4.1.Setting a baseline for evaluating technical feasibility
First a baseline was set based on the minimum speed (30 knots) and range (30 NM) requirements for the emission-free CC-200. This baseline also included the considered weight saving measures. The model showed that the hydrofoil system lowers the resistance of the zero-emission ferry by around 10% at operational speed and the total mass of the would be around 120 tonnes, similar to the mass of the current CC-200. This shows that for the applied requirements, the zero-emission ferry would be heavier than the CC-200 if the lightest emission-free energy carrier would not have been chosen and the identified weight-saving measures would not have been applied. The required installed propulsion power for the ferry would be 2,285 kW, which is higher than the installed 2,160 kW on the CC-200, mainly due to a 15% margin that is applied in the parametric model between the used brake power and required brake power [67].
It can be preliminarily concluded that a zero-emission ferry with the aforementioned requirements is technically feasible. The zero-emission ferry would apply weight-saving measures, hydrofoils, a thruster propulsion system, and a
4.2.Influence of speed and range requirements
The influence of the speed and range requirements were then tested, based on the assumption that the hydrofoil system will continue to be beneficial, even at the higher speeds. The results in this sensitivity study incorporate a
Fig. 4.
The zero-emission ferry’s mass as a function of its required speed and range.
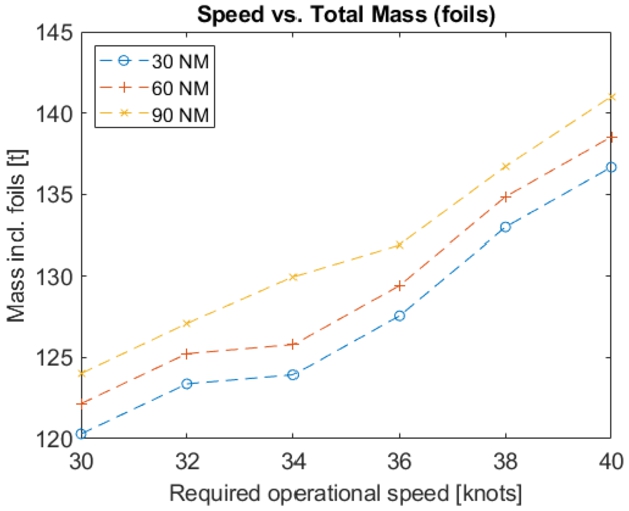
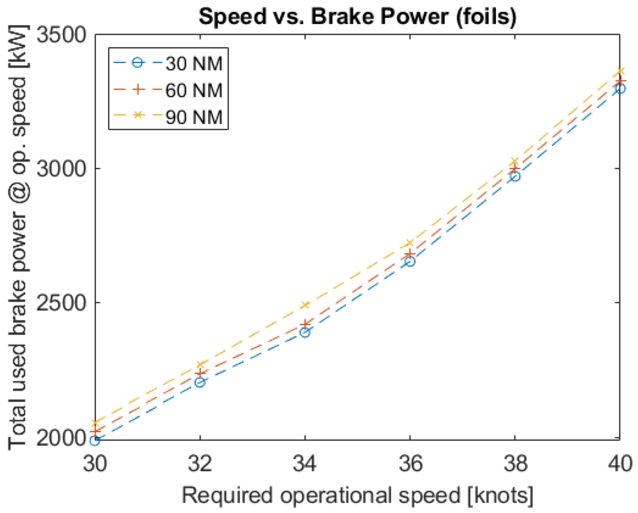
Fig. 5.
The zero-emission ferry’s total used brake power as a function of its required speed and range.
The results are in line with expectations. A higher operational speed requires a more powerful power plant, which increases the total used brake power. A more powerful power plant is also heavier as more fuel cells and larger electric motors are required. Therefore, the mass of the ferry increases. Moreover, a higher required range increases the required amount of hydrogen tanks, leading to a higher mass and brake power.
Figure 4 shows how the ferry’s mass increases at higher required operational speeds. The increase in mass is mainly caused by fuel cell units added to the design. The zero-emission ferry is designed with symmetry in mind, so the number of required fuel cells is always an even number. In Fig. 4, the required number of fuel cells increases from 12 to 14 when going from 30 to 32 knots for the three tested ranges. Consequently, a sharper increase in the ferry’s total mass is observed. Also, when looking at the 30 and 60 NM requirements, two additional fuel cells are required when going from 34 to 36 knots, but this is not yet required for the 90 NM requirement. This is why the lines of Fig. 4 do not follow the exact same pattern.
Figure 5 shows that a higher required speed does significantly increase the used brake power. The used brake power increases from around 2,000 kW at 30 knots to almost 3,400 kW at 40 knots. It is also concluded that increasing the required range has a much less significant impact on the used brake power. By increasing the required range, the most significant change is an increased number of required hydrogen tanks, causing only a slight increase in weight and therefore power.
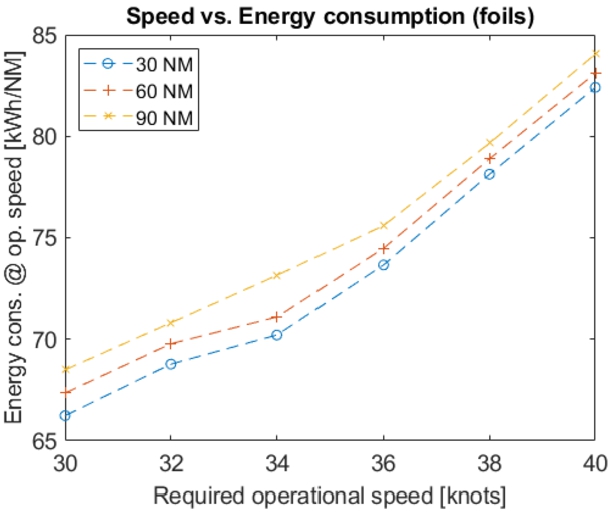
Next, Figs 6 and 7 show how the required operational speed and range affect the ferry’s resistance and energy consumption. Figure 6 shows how the ferry’s resistance changes by using hydrofoils or altering its range or speed. First, a higher required range increases the ferry’s resistance, as a higher range requirement results in a larger energy carrier system, which increases the ferry’s weight and thus its resistance. However, this impact is relatively small, which was expected as the impact of increasing the required range on the brake power is also small, as was seen in Fig. 5. Next, it is concluded that a hydrofoil system lowers the ferry’s resistance for the entire range of operational speeds. This difference is smallest at an operational speed of 30 knots and highest at 40 knots. In other words, the hydrofoil ferry’s resistance increases relatively little when the operational speed is raised. This is one of the main reasons why only very high-speed ships use hydrofoils.
Figure 7 shows the ferry’s energy consumption as a function of the required speed. It shows similar characteristics as Fig. 5. The ferry’s energy consumption ranges between roughly 66 kWh/NM at 30 knots and 84 kWh/NM at 40 knots. The energy consumption at 40 knots is slightly lower compared to the 150-passenger Electra hydrofoil ferry concept, which is expected to have an energy consumption of 90 kWh/NM at 40 knots [16]. On the other hand, the energy consumption at 30 knots of 66 kWh/NM is significantly higher compared to the 150-passenger Beluga24 ferry concept, which promises a consumption of 30 kWh/NM at 30 knots [29].
Fig. 6.
The zero-emission ferry’s total resistance as a function of its required operational speed and range.
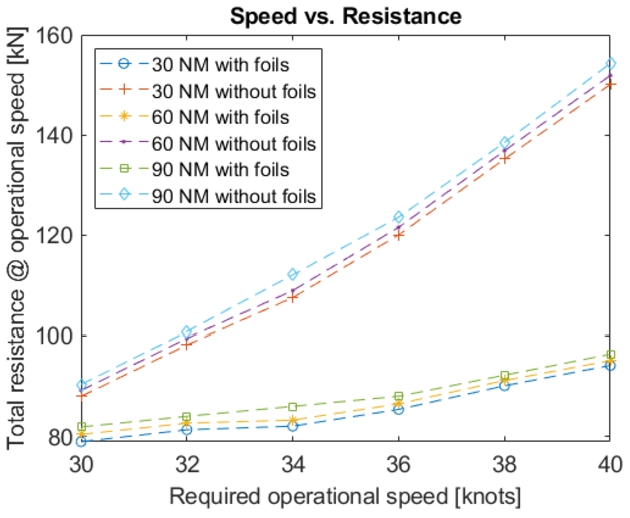
Fig. 7.
The zero-emission ferry’s energy consumption as a function of its required operational speed and range.
Figures 8 and 9 compare how the mass and volume of the three energy carrier options are affected by the speed and range requirements. The figures are created using total ferry mass based on the mass of the
Fig. 8.
The mass of the energy carrier system as a function of the required range.
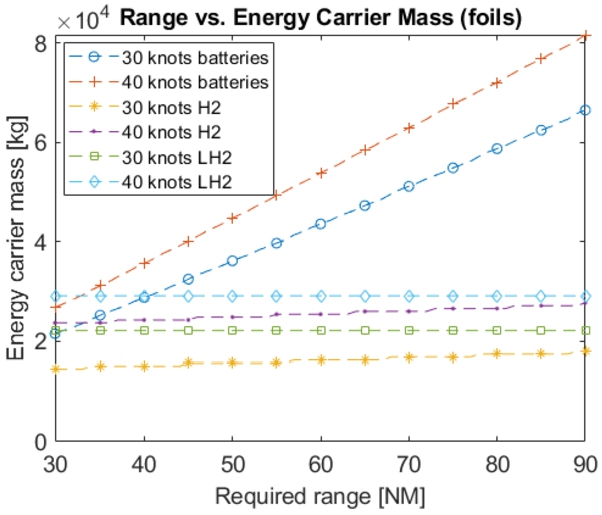
Fig. 9.
The volume of the energy carrier system as a function of the required range.
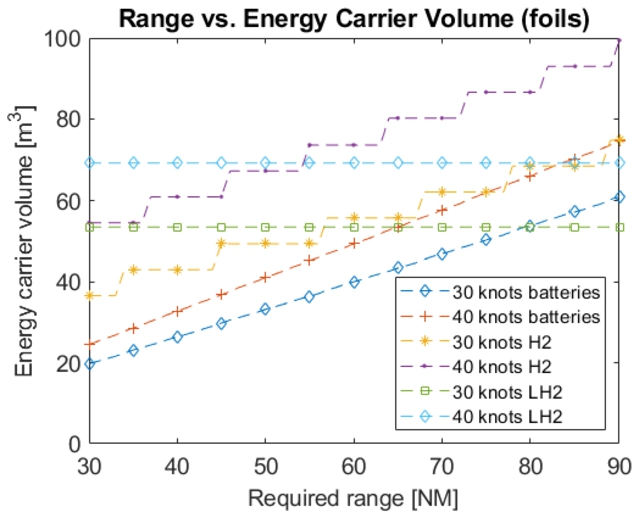
Figure 8 shows the energy carrier system mass for a required range of 30 to 90 NM and a required speed of 30 or 40 knots. It shows that the
Finally, Fig. 9 compares the energy carrier’s volume instead of its mass. It can be seen that the battery system scores much better on compactness than lightness as it is the most compact option below a required range of roughly 80 NM for a 30-knot ferry and around 83 NM for a 40-knot ferry. For higher ranges, the
4.3.Comparing CH 2 LH 2
So far the model has shown that a
4.3.1.Qualitative comparison
First, a battery-powered ferry is studied. From Figs 8 and 9, it can be concluded that a battery system is most attractive for lower range requirements as the system’s mass and volume scale strongly when the range requirement is increased. Therefore, it is chosen to study a 30-knot battery-powered ferry with the minimum range requirement of 30 NM.
Second, a
Finally, the
4.3.2.Technical comparison
The main specifications of the baterry-,
Table 5
Comparison of a
| Batteries | CC-200 | |||
| Speed [knots] | 30 | 30 | 30 | ∼30 |
| Range [NM] | 30 | 255 | 30 | ∼420 |
| Required refills per day [-] | 9 | 1 | 9 | 1 |
| Time in port [min] | 30 | 30 | 30 | 30 |
| Minimum refuel or recharge time [min] | 20 | N/A | 18 | N/A |
| Energy consumption [kWh/NM] | 66 | 73 | 73 | ∼80 |
| Mass energy carrier system [t] | 15 | 24 | 24 | N/A |
| Volume energy carrier system [m^3] | 37 | 58 | 22 | N/A |
| Total mass [t] | 120 | 131 | 131 | ∼120 |
The parametric model found feasible ferry configurations that comply with the minimum requirements. Table 5 shows that the most technically-feasible ferry configuration depends on the preferences of the ferry’s designer and operator, as each configuration has its own advantages and disadvantages.
First, an advantage of the battery-powered ferry is that there is no requirement for the presence of a hydrogen supplier in the proximity of the ferry’s port. However, there is a requirement for a suitable electricity grid and charging station. If enough power is available, the selected battery modules can be fully charged in 18 minutes. However, to minimize the load on the charging station, a time of 25 minutes is assumed for the charging procedure. Based on the ferry’s energy consumption, it can be found that around 1,823 kWh of energy must be charged after a one-way trip. Together with the charging time, it would require a charging infrastructure that can charge at approximately 4.4 MW. In this research, it is assumed that this charging power is technically feasible, as other electric ferries like the MF Aurora (10.5 MW) and MS Color Hybrid (7 MW) charge at higher powers [32]. Another advantage of the battery-powered ferry is that its required energy carrier volume (21.6
The
Finally, the
4.4.Technical boundaries
In this section, the technical boundaries of the zero-emission ferry configurations are tested. For operating speeds between 30 and 40 knots, the following configurations of the three zero-emission variants were evaluated to find the technical boundaries:
Optimized (hydrofoils and all weight-saving measures incorporated)
No hydrofoils
No weight saving measures
No weight saving measures and no hydrofoils
The technical boundaries of the ferries are assumed to be reached at one of the following limits:
Mass ⩾ 150 tonnes. If this limit is exceeded, it is assumed that the ferry becomes too heavy, as no hydrofoil lift and drag data are collected for a lift greater than 150 tonnes. It was chosen not to make this limit foil-specific to prevent a skewed comparison between a normal and hydrofoil ferry.
Total resistance ⩾ 105 kN (foil-specific). If this limit is exceeded, no data relevant to the propeller calculations was collected, which means results start becoming inaccurate. This limit is foil-specific as the ferry without hydrofoils uses a waterjet propulsion system.
Total brake power ⩾ 4,400 kW. Above this point, the most potent electric motors and gearboxes selected for the ferry are not powerful enough to comply with the ferry’s power demand.
Energy carrier volume ⩾ 100
Required charging power ⩾ 11 MW (battery-specific). This charging power is the limit of the Tower-type FerryCHARGER charging station [21]. The required charging power is based on a charging time of 25 minutes and a one-way sailing distance of 25 NM.
Hydrogen consumption per 25 NM ⩾ 180 kg (
Required
4.4.1.Technical boundaries of the battery-powered ferry
The technical boundaries of the battery-powered ferry are illustrated in Fig. 10, and were limited by the constraints in Table 6. Based on these results, the following conclusions can be made:
Fig. 10.
The technical boundaries of the battery-powered ferry.
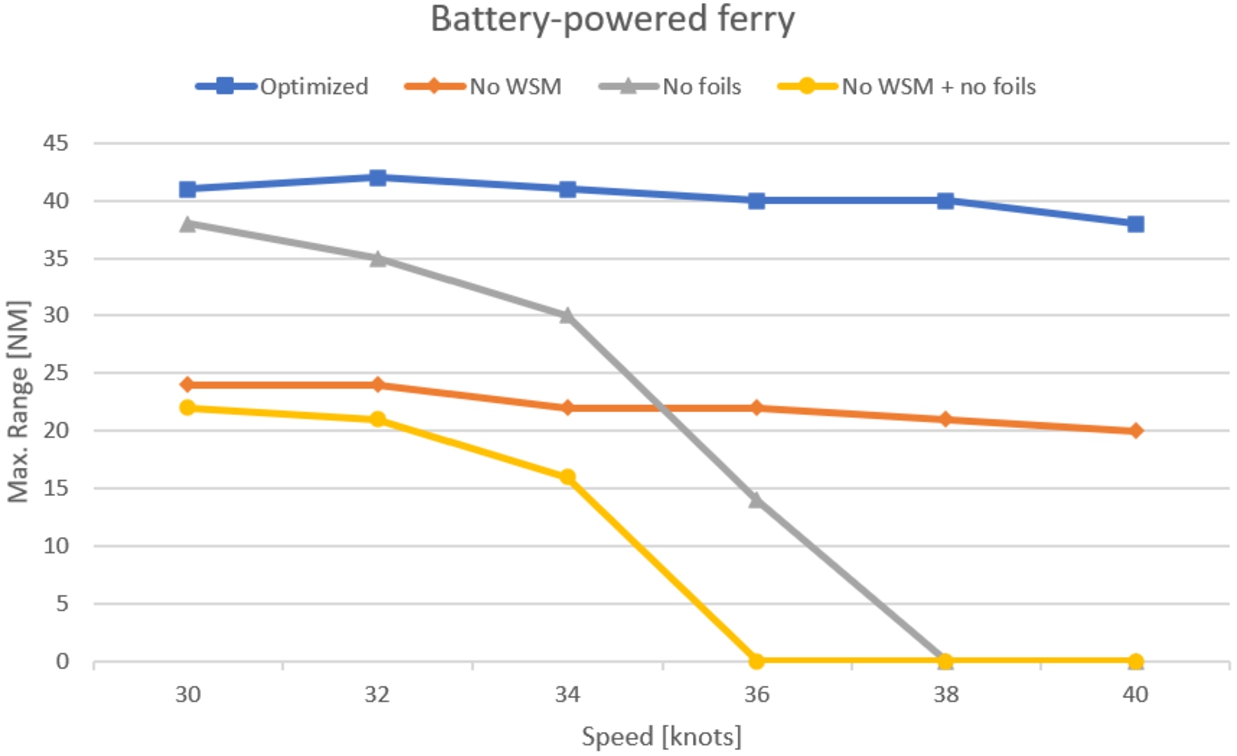
Table 6
Overview of the reached technical limits of the battery-powered ferry
| Configuration | Speed [knots] | Reached limit |
| Optimized | 30–40 | Mass ⩾ 150 tonnes |
| No WSM | 30–40 | Mass ⩾ 150 tonnes |
| No foils | 30–32 | Mass ⩾ 150 tonnes |
| 34–40 | Total brake power ⩾ 4,400 kW | |
| No WSM + no foils | 30–32 | Mass ⩾ 150 tonnes |
| 34–40 | Total brake power ⩾ 4,400 kW |
The 30 NM range requirement can only be achieved for speeds up to 40 knots by the optimized configuration. The ferry without foils can only achieve the range requirement at a maximum speed of 34 knots. The other two configurations can not reach the range requirement.
The speed of a hydrofoil ferry has a much less significant impact on its maximum range compared to a ferry without foils. This is mainly due to the ferry’s resistance, which increases less significantly in case hydrofoils are used.
As a 30-knot, 30 NM, battery-powered ferry without hydrofoils is also technically feasible, it is compared to the same ferry with hydrofoils in Table 7:
Table 7
The impact of hydrofoils on a 30-knot, 30 NM, battery-powered ferry
| Ferry reqs. | Hydrofoils | Tot. req. P_B [MW] | Battery modules [-] | Energy cons. [kWh/NM] | Total mass [t] |
| 30 knots, 30 NM | Yes | 2.5 | 280 | 73 | 131 |
| 30 knots, 30 NM | No | 3.2 | 354 | 92 | 130 |
From these specifications, eliminating the hydrofoil system does not prevent it from being technically feasible, but it does increase the required brake power and energy consumption. For this reason, the propulsion and energy carrier system of the ferry without foils will be larger. To decide between these configurations, it is recommended to look at the economic feasibility. If the capital and operating expenses of the hydrofoil system are lower compared to the extra capital and operating expenses of the larger propulsion and energy carrier systems (compared to the systems of the hydrofoil ferry), then the hydrofoil ferry will be more attractive from an economic perspective, and vice versa.
4.4.2.Technical boundaries of the CH 2
The technical boundaries of the
Fig. 11.
The technical boundaries of the
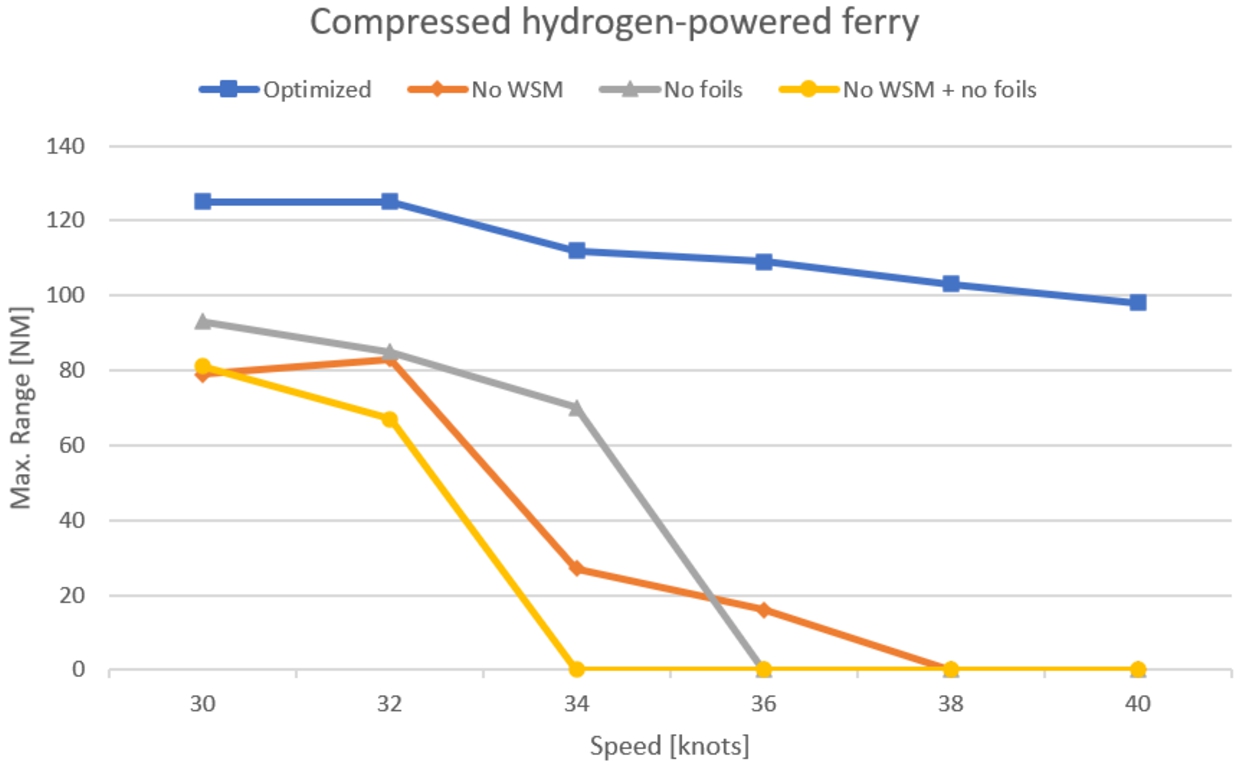
The 30 NM range requirement can only be achieved for speeds up to 40 knots by the optimized configuration. The ferry without weight-saving measures becomes too heavy at speeds at and above 34 knots and the ferry without hydrofoils requires too much brake power at and above 36 knots.
The maximum range for the optimized configuration of the
If the maximum mass limit is eased, the ferry without weight-saving measures would likely also comply with the 30 NM range requirement at speeds of 30 to 40 knots.
Table 8
Overview of the reached technical limits of the
| Configuration | Speed [knots] | Reached limit |
| Optimized | 30–40 | Energy carrier volume ⩾ 100 |
| No WSM | 30–40 | Mass ⩾ 150 tonnes |
| No foils | 30–34 | Energy carrier volume ⩾ 100 |
| 36–40 | Total brake power ⩾ 4,400 kW | |
| No WSM + no foils | 30–32 | Energy carrier volume ⩾ 100 |
| 34–40 | Total brake power ⩾ 4,400 kW |
At last, the same main conclusions can be made regarding the comparison of a 30-knot, 30 NM ferry with hydrofoils and the same ferry without hydrofoils as for the battery-powered ferry.
4.4.3.Technical boundaries of the LH 2
Fig. 12.
The technical boundaries of the
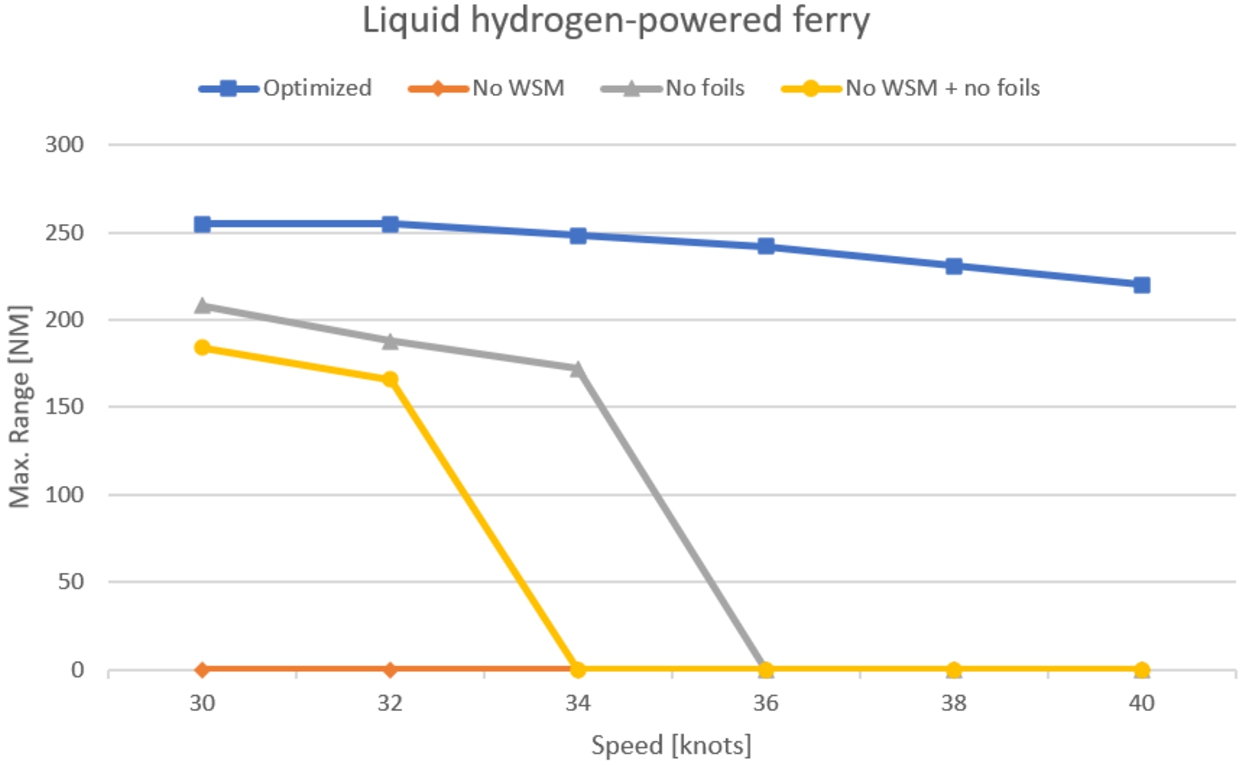
The technical boundaries of the
The 30 NM range requirement can only be achieved for speeds up to 40 knots by the optimized configuration. The ferry without weight-saving measures becomes too heavy at all speeds, and the ferry without hydrofoils requires too much brake power at and above 36 knots.
In general, the maximum range of the
If the maximum mass limit is eased, the ferry without weight-saving measures would likely also comply with the 30 NM range requirement at speeds of 30 to 40 knots.
Table 9
Overview of the reached technical limits of the
| Configuration | Speed [knots] | Reached limit |
| Optimized | 30–40 | Required |
| No WSM | 30–40 | Mass ⩾ 150 tonnes |
| No foils | 30–34 | Required |
| 36–40 | Total brake power ⩾ 4,400 kW | |
| No WSM + no foils | 30–32 | Required |
| 34–40 | Total brake power ⩾ 4,400 kW |
5.Conclusions
Internal combustion engine (ICE) emissions cause numerous social, environmental, health, and economic issues, including extreme weather or harm to public health. These effects are also experienced in the Chinese Pearl River Delta, where a 30-knot, 200-passenger ferry named the Coastal Cruiser 200 (CC-200) uses ICEs to operate. To negate its contribution to the total ICE emissions, the technical feasibility of a zero-emission CC-200 variant was investigated. It was found that there are currently no zero-emission ferries sailing at 30 knots and carrying 200 passengers. A two step approach was followed to explore the technical feasibility of a zero-emission ferry meeting these requirements. First, a qualitative trade-off study was performed on the efficiency improving measures, energy carriers, and propulsion systems. Secondly, a parametric model was developed to explore in more detail the technical feasibility of such a concept.
Results of the case study showed that a 200-passenger, 30- to 40-knot, emission-free ferry is technically feasible when implementing a battery-,
Table 10
Conclusions of advantages and disadvantages of battery-,
| Advantages | Disadvantages | |
| Battery | No requirement for hydrogen supplier near port | A charging station with sufficient power output must be available at both ports (roughly 4.4 MW in case of the Zhuhai–Shenzhen route) |
| Requires low volume for the energy carrier, allowing for additional usable space inside ferry. | Limited range (only around 40 NM at most) | |
| The lightest and most energy-efficient ferry. | Requires to refuel multiple times per day | |
| No cooling system needed for hydrogen tanks | A refueling station must be installed at at least one port. | |
| Full-day energy storage capacity | Structural reinforcements needed for placement of hydrogen tank, increasing weight. | |
| Tanks can be refueled by | Heaviest and least efficient configuration |
Additionally, by assessing the technical boundaries of the zero-emission ferry configurations, the most important conclusions are:
Using the weight saving measures and hydrofoils, the 30 NM range can be achieved by all three power and energy configurations sailing up to a speed of 40 knots.
In general, a zero-emission ferry without hydrofoils is technically feasible at 30 knots; however, the likely feasibility drops at close to 40 knots where the required brake power increases greatly.
A 30 knot, 30 NM battery-powered ferry without hydrofoils is technically feasible but requires a significantly larger and more powerful energy carrier and propulsion system.
For larger range requirements, the
This research has showed the initial technical feasibility of zero-emission ferry concept for a specific route; however, results can easily be extrapolated to other ferry routes with similar requirements.
6.Future work
Based on these conclusions, several recommendations are provided to build on, confirm, and enrich these results. As this study was aimed to perform an initial feasibility of the overall concept, future work should entail higher fidelity analyses into weight and weight saving measures, stability and safety, geometry optimization, cavitation and ventilation characteristics of the hydrofoil system, and power and propulsion modeling to help validate these results. This is especially important as the hydrodynamic and weight design of hydrofoil vessels is particularly complex, and these details need to be incorporated when the concept progresses to a more detailed design stage. Second, this study focused specifically on concepts with zero or only
7.Funding
The authors report no funding.
8.Conflict of interest
The authors have no conflict of interest to report. Austin A. Kana is an Editorial Board Member of this journal, but was not involved in the peer-review process nor had access to any information regarding its peer-review.
9.CRediT authorship contribution statement
Patryk Doornebos Conceptualisation, Investigation, Methodology, Software, Writing – Original Draft, Writing – Review & Editing Moreno Francis Conceptualisation, Supervision, Writing – Review & Editing Joan le Poole Writing – Review & Editing Austin A. Kana Conceptualisation, Interpretation of data, Supervision, Writing – Review & Editing
Nomenclature
s | Span of a foil [m] |
c | Chord of a foil [m] |
Angle of Attack of a foil [deg] | |
Total required brake power per electric motor [kW] | |
Delivered power per propeller [kW] | |
Shaft efficiency, assumed to be 95% (typical shaft efficiency of 97% and additional transmission gear losses of Z-drive of two percentage points [57]) | |
Efficiency of the DC–DC converter, assumed to be 98% [22] | |
Efficiency of the DC–AC converter, assumed to be 98% [22] | |
Gearbox efficiency, assumed to be 98% [59] | |
Efficiency of the electric motor, assumed to be 97.2% [54] | |
Resistance of the hull [N] | |
Frictional resistance coefficient [-] | |
Residual resistance coefficient [-] | |
Seawater density [kg/m3] | |
V | Ship’s velocity [m/s] |
Ship velocity at Froude number of 0.7 [m/s] | |
Ship velocity at a Froude number of 0.8 [m/s] | |
S | Wetted surface area of ferry [m2] |
Total resistance at the hump [N] | |
Air resistance at the hump [N] | |
Foil resistance at the hump [N] | |
Hull resistance at the hump [N] | |
Reynolds number [-] | |
Frictional resistance coefficient [-] | |
Total mass of the hydrofoil ferry [t] | |
Mass of the hydrofoil system [t] | |
Air resistance [N] | |
Air density [kg/m3] | |
Air velocity [m/s], assumed equal to the ferry’s speed | |
Frontal area of ferry [m2] | |
Air resistance coefficient of ferry [-] | |
Mass of the ferry, excluding hydrofoils [kg] | |
Mass of the CC-200 [kg] | |
Mass of the CC-200’s propulsion-related systems [kg] | |
Mass difference due to the applied weight-saving measures [kg] | |
Mass of the energy carrier system [kg] | |
Mass of the propulsion system [kg] | |
Volumetric Froude number [-] |
Acknowledgements
This work was performed as part of the MSc thesis for the lead author, [15]. The thesis was performed in Marine Technology at Delft University of Technology, and the authors would like to acknowledge Delft University of Technology and CoCo Yachts for their support of this research.
References
[1] | Aluminium vs carbon fiber – comparison of materials, (2015) , http://www.dexcraft.com/articles/carbon-fiber-composites/aluminium-vs-carbon-fiber-comparison-of-materials/. |
[2] | Autowing – Lehrstuhl für Modellierung und Simulation – Universität, Rostock, (2022) , https://www.lemos.uni-rostock.de/lehre/sonstiges/downloads/autowing/. |
[3] | W. Ayers and E. Bay, Comparative payback of lithium-Ion batteries for Pacific NW Ferries, (2016) , https://www.ebdg.com/wp-ebdg-content/uploads/2017/02/Payback_Lithium-Ion_NWFerries_paper.pdf. |
[4] | BB green prototype, (2022) , https://www.bbgreen.eu/. |
[5] | V. Beggi, L. Loisel and X.-T. Nguyen, Microgrid in USTH campus: Architecture and power management strategies, PhD thesis, (2018) . doi:10.13140/RG.2.2.25145.42085. |
[6] | M. Buitendijk, Repeat order for three coastal cruisers 200: SWZ: Maritime, (2014) , https://swzmaritime.nl/news/2014/02/12/repeat-order-for-three-coastal-cruisers-200/. |
[7] | M. Burman, J. Kuttenkeuler, I. Stenius, K. Garme and A. Rosén, Comparative life cycle assessment of the hull of a high-speed craft, SAGE Publications 230: (2) ((2015) ), 378–387, ISSN 20413084. doi:10.1177/1475090215580050. |
[8] | J. Butler, This new high speed ferry is an electric hydrofoil catamaran, (2021) , https://plugboats.com/new-high-speed-ferry-electric-hydrofoil-catamaran/. |
[9] | G. Byrne, T. Persoons and W. Kingston, Experimental validation of lift and drag forces on an asymmetrical hydrofoil for seafloor anchoring applications, Journal of Ocean and Climate ((2018) ), https://journals.sagepub.com/doi/pdf/10.1177/1759313118811979. |
[10] | B.R. Clayton and R.E.D. Bishop, Mechanics of Marine Vehicles, Gulf Publishing Company, Bristol, (1982) . |
[11] | Composite technology for work boats – can composites pay their way?, (2015) . |
[12] | Copper vs. aluminum conductors | Anixter, (2022) , https://www.anixter.com/en_us/resources/literature/wire-wisdom/copper-vs-aluminum-conductors.html#. |
[13] | B. Craig, The future of batteries in the marine sector: What lies beyond the horizon? Tschuch, (2020) , https://www.southampton.ac.uk/~assets/doc/The%20Future%20of%20Batteries%20in%20the%20Marine%20Sector.pdf. |
[14] | P.R. Crewe, The hydrofoil bots; its history and future prospects, The institution of naval architects, quarterly transactions ((1958) ), http://www.foils.org/wp-content/uploads/2018/01/INAtransactions1958Oct.pdf. |
[15] | P. Doornebos, Design and feasibility of a 30- to 40-knot emission free ferry, (2022) , http://resolver.tudelft.nl/uuid:c0ef61b6-b84b-47b7-a774-bf5e607c54ac. |
[16] | Electra, (2022) , https://www.boundarylayer.tech/electra. |
[17] | Electrifying city transports – safety first when going from fossil fuels to batteries, (2021) , https://echandia.se/insights/article/electrifying-city-transports-safety-first-when-going-from-fossil-fuels-to-batteries/. |
[18] | O.M. Faltinsen, Hydrodynamics of High-Speed Marine Vehicles, Cambridge University Press, (2005) . |
[19] | A.E.-P. Ferry, (2021) , https://www.ship-technology.com/projects/norled-zerocat-electric-powered-ferry/. |
[20] | Ferry lines Shenzhen, time tables and distances.xlsx, CoCo Yachts, Gorinchem, (2019) . |
[21] | FerryCHARGER, (2022) , https://www.stemmann.com/documents/catalogues/FerryCHARGER_Solutions.pdf. |
[22] | M. Francis, Feasibility study of a fast electric passenger ferry, (2019) , http://resolver.tudelft.nl/uuid:cf138038-adc9-41b6-a08f-3f2e9359a3fc. |
[23] | J. Grevink, MT44006 2021-6-Waterjets, TU Delft, Delft, (2021) . |
[24] | K.D. Guia, Cummins fuel cells powering North America’s first commercial zero emissions ferry, (2021) , https://www.cummins.com/news/2021/02/09/cummins-fuel-cells-powering-north-americas-first-commercial-zero-emissions-ferry. |
[25] | M. Håkansson, E. Johnson and J.W. Ringsberg, Cost and weight of composite ship structures: A parametric study based on Det Norske Veritas rules, Proceedings of the Institution of Mechanical Engineers Part M: Journal of Engineering for the Maritime Environment 232: (3) ((2018) ), 331–350, ISSN 20413084. https://www.researchgate.net/publication/315649927_Cost_and_weight_of_composite_ship_structures_A_parametric_study_based_on_Det_Norske_Veritas_rules. doi:10.1177/1475090217693419. |
[26] | H. Helgesen, S. Henningsgard and A. Aarseth Langli, Battery systems for maritime applications-technology, sustainability and safety study on electrical energy storage for ships, EMSA European Maritime Safety Agency DNV GL, (2020) , https://ktn-csbs-media.s3-eu-west-1.amazonaws.com/62714fed-93be-4ee3-82d4-3195419cc09b/studyelectricalenergystorageforships.pdf. |
[27] | Help for Autowing, University of Rostock, (2022) , https://www.lemos.uni-rostock.de/storages/uni-rostock/Alle_MSF/Lemos/Lehre/Downloads/CFD/AUTOWING_Help_for_Autowing.pdf. |
[28] | L. Hertzberg, Lightweight construction applications at sea, 2016, ISSN 0284-5172, http://e-lass.eu.loopiadns.com/media/2016/08/LASS-SP_Report_2009_13.pdf. ISBN 9789185829972. |
[29] | High-speed emission free catamaran – BELUGA24, (2021) , https://www.shippax.com/en/press-releases/high-speed-emission-free-catamaran-beluga24.aspx. |
[30] | S.F. Hoerner, W.H. Michel, L.W. Ward and T.M. Buermann, Hydrofoil Handbook Volume 1: Design of Hydrofoil Craft, Hydrofoil Research Project for Office of Naval Research Navy Department, Washington, (1954) . |
[31] | ITTC, Concluding technical session: Decisions, in: Proceedings of the 8th International Towing Tank Conference, ITTC’57, Madrid, Spain, (1957) . |
[32] | S. Karimi, M. Zadeh and J.A. Suul, Shore charging for plug-in battery-powered ships: Power system architecture, infrastructure and control, Technical Report. |
[33] | N. Kornev, K.G. Hoppe, A. Nesterova and G. Migeotte, Design of hydrofoil assisted catamarans using a non-linear vortex lattice method, Journal of Marine Engineering ((2005) ). https://marine-eng.ir/article-1-13-en.pdf. |
[34] | J. Kuzjatkin, Structural weight optimisation of a carbon fibre ferry, PhD thesis, KTH Royal Institute of Technology, (2014) . |
[35] | Lithium marine batteries, (2022) , https://www.super-b.com/en/lithium-marine-batteries. |
[36] | Lithium-Ion battery 12 V – 150Ah – 1.92kWh – PowerBrick+ / LiFePO4, (2022) , https://www.powertechsystems.eu/home/products/12v-lithium-battery-pack-powerbrick/150ah-12v-lithium-ion-battery-pack-powerbrick/. |
[37] | H. Loveday, The design of a hydrofoil system for sailing catamarans, PhD thesis, University of Stellenbosch, (2006) . |
[38] | X. Lu, T. Yao, J.C.H. Fung and C. Lin, Estimation of health and economic costs of air pollution over the Pearl River Delta region in China, Science of The Total Environment 566–567: ((2016) ), 134–143, https://www.sciencedirect.com/science/article/abs/pii/S0048969716309913#f0020. doi:10.1016/j.scitotenv.2016.05.060. |
[39] | X. Mao, C. Chen, B. Comer and D. Rutherford, Costs and benefits of a Pearl River Delta emission control area, (2019) , https://theicct.org/sites/default/files/publications/ICCT_pearl_river_delta_eca_20190718.pdf. |
[40] | Marine modules – fuel cell power products | Ballard power, (2022) , https://www.ballard.com/fuel-cell-solutions/fuel-cell-power-products/marine-modules. |
[41] | Marine seats for passenger with various types | YSmarines, (2022) , https://www.ysmarines.com/products/collections/passengerseat.html. |
[42] | A. Menon, Understanding water jet propulsion – working principle, design and advantages, (2021) , https://www.marineinsight.com/naval-architecture/understanding-water-jet-propulsion-working-principle-design-and-advantages/. |
[43] | G. Migeotte, Design and optimization of hydrofoil-assisted catamarans, PhD thesis, University of Stellenbosch, Stellenbosch, (2002) . |
[44] | K.-S. Min, S.-H. Kang and O.-H. Kim, Conceptual design of very large-size super-high-speed foil catamaran containership, Practical Design of Ships and Other Floating Structures 1: ((2001) ), 105–111, https://www.sciencedirect.com/science/article/pii/B9780080439501500144. doi:10.1016/B978-008043950-1/50014-4. |
[45] | N. Mjøs, G.P. Haugom and B. Gully, DNV GL Handbook for Maritime and Offshore Battery Systems, DNV GL, (2016) . |
[46] | A.F. Molland and S.R. Turnock, Marine Rudders, Hydrofoils and Control Surfaces: Principles, Data, Design, 2nd edn, Butterworth-Heinemann, (2021) . |
[47] | R. Moolman, G. Migeotte, T. Harms and V. Bertram, Comparative evaluation of a hydrofoil-assisted trimaran, R & D Journal ((2006) ), https://icarusmarine.com/wp-content/uploads/2018/02/Moolman-et-al.-2006-Comparitive-Evaluation-of-a-hydrofoil-assisted-Trimaran.pdf. |
[48] | T. Nemeth, P. Schröer, M. Kuipers and D.U. Sauer, Lithium titanate oxide battery cells for high-power automotive applications – electro-thermal properties, aging behavior and cost considerations, Journal of Energy Storage 31: ((2020) ), 101656, ISSN 2352-152X. doi:10.1016/J.EST.2020.101656. |
[49] | D. Oh, S. Jung and S. Jeong, Effect of a lightweight hull material and an electric propulsion system on weight reduction: Application to a 45 ft CFRP electric yacht, Journal of the Korean Society of Marine Environment & Safety 24: (6) ((2018) ), 818–824. doi:10.7837/kosomes.2018.24.6.818. |
[50] | Overview hydrogen refuelling for heavy duty vehicles, (2021) , https://h2-mobility.de/wp-content/uploads/sites/2/2021/08/H2-MOBILITY_Overview-Hydrogen-Refuelling-For-Heavy-Duty-Vehicles_2021-08-10.pdf. |
[51] | PEM-FCS stack technology | Nedstack, (2022) , https://nedstack.com/en/pem-fcs-stack-technology. |
[52] | Perspectives for the use of hydrogen as fuel in inland shipping, MariGreen ((2018) ), https://cdn.hexagongroup.com/uploads/2019/11/Hydrogen-Feasibility-Study-MariGreen.pdf. |
[53] | Platform-based ferry product family – NAVAIS, (2021) , https://www.navais.eu/workspaces/platform-based-ferry-product-family. |
[54] | PMM 450 1.6 MW, (2016) , http://theswitch.com/wp-content/uploads/2016/08/450.pdf. |
[55] | Polycarbonate windows for your race car (Lexan), (2016) , http://timeattackbuilders.com/2016/09/29/polycarbonate-race-car-windows/. |
[56] | PowerCellution marine system 200, (2021) , https://www.datocms-assets.com/36080/1637225345-marine-system-200-v-221.pdf. |
[57] | J.W. Pratt and L.E. Klebanoff, Feasibility of the SF-BREEZE: A zero-emission, hydrogen fuel cell, high-speed passenger ferry, (2016) , https://www.maritime.dot.gov/sites/marad.dot.gov/files/docs/innovation/meta/9841/sf-breeze-ferry-feasibility-study-report-sandia-national-laboratory-2.pdf. |
[58] | N.H. Prevljak, Construction starts on world’s 1st zero-emission fast ferry, (2021) , https://www.offshore-energy.biz/construction-starts-worlds-1st-zero-emission-fast-ferry/. |
[59] | Product selection guide 2022, (2022) , https://www.zf.com/products/media/industrial/marine/brochures_1/Product_Selection_Guide.pdf. |
[60] | PROJECTS, (2022) , https://ggzeromarine.com/projects/. |
[61] | A. Rufolo, Foil weight saving and hydrofoil performance, Naval Engineers Journal 78: (5) ((1966) ), 905–913. doi:10.1111/j.1559-3584.1966.tb04163.x. |
[62] | C. Ruoff, Charged EVs | seaworthy EVs: Leclanché designs and manufactures Li-ion cells and systems – charged EVs, (2016) , https://chargedevs.com/features/seaworthy-evs-leclanche-designs-and-manufactures-li-ion-cells-and-systems/. |
[63] | Seawater properties, (2022) , https://www.engineeringtoolbox.com/sea-water-properties-d_840.html. |
[64] | The Beluga24, (2022) , https://www.greencityferries.com/. |
[65] | U.S. Department of Energy, Fuel cells ((2015) ), https://www.energy.gov/sites/prod/files/2015/11/f27/fcto_fuel_cells_fact_sheet.pdf. |
[66] | L. van Biert, K. Mrozewski and P. ‘t Hart, Public final report: Inventory of the application of fuel cells in the MARitime sector (FCMAR) project data, (2021) , https://www.koersenvaart.nl/files/MIIP%20007-2020%20FCMAR%2003022021.pdf. |
[67] | H. van Herwijnen, Technical specification coastal cruiser 199.docx, Technical Report, CoCo Yachts, Gorinchem, (2017) . |
[68] | H. van Keimpema and E. Ulijn, PropCalc, TU Delft, Delft. |
[69] | J. Verma and D. Kumar, Recent developments in energy storage systems for marine environment, Materials Advances 2: (21) ((2021) ), 6800–6815, ISSN 26335409. https://pubs.rsc.org/en/content/articlehtml/2021/ma/d1ma00746g https://pubs.rsc.org/en/content/articlelanding/2021/ma/d1ma00746g. doi:10.1039/D1MA00746G. |
[70] | Worlds first zero-emission hydrogen fuel cell ferry launched, (2021) , https://safety4sea.com/worlds-first-zero-emission-hydrogen-fuel-cell-ferry-launched/. |
[71] | XMP 98P high power, (2022) , https://indd.adobe.com/view/c0c507f9-ce02-466c-a2e3-87b8909d3566. |
[72] | L. Yun and A. Bliault, High Performance Marine Vessels, Springer, (2012) . |
[73] | G. Zubi, R. Dufo-López, M. Carvalho and G. Pasaoglu, The lithium-ion battery: State of the art and future perspectives, Renewable and Sustainable Energy Reviews 89: ((2018) ), 292–308, ISSN 1364-0321. doi:10.1016/J.RSER.2018.03.002. |


