
Designing the zero emission vessels of the future: Technologic, economic and environmental aspects
Abstract
One of the major challenges facing the maritime sector today is the transition to zero emission carbon-neutral vessels. In particular, work vessels such as dredging vessels are required to operate worldwide and under heavy conditions. These vessels have a high power density, limited on-board space, require often a large autonomy, and therefore will need very energy dense fuels. This article presents an environmental and economic assessment of four cutter suction dredger drive system design alternatives with the life cycle performance assessment tool. This tool includes the most important environmental factors as well as the net present value. The effect of emission costs and fuel price developments may be taken into account with scenarios, and this article illustrates that they have a large effect on the economic viability of future zero emission vessels. A combination of clean fuels, new prime mover technologies, efficient design and effective system integration has the potential to achieve zero emissions while maintaining the vessels’ functionality. However, technology alone cannot solve the complex challenge of energy transition in the maritime sector. In order to make zero emission designs economically viable, a system wide integration is needed, meaning cooperation in the value chain and effective policies.
1.Introduction
1.1.The challenge of decarbonisation
The decarbonisation of the world’s entire energy system is one of the major challenges of the 21st century. Fossil fuels such as coal, oil & gas supplied 81% of the world’s primary energy demand in 2017 and resulted in a total carbon dioxide (CO2) emission of 32.6 Gt [26]. The Paris Agreement has the aim to limit the global temperature rise due to global warming limited to 1.5–2°C compared to the pre-industrial era [53]. Figure 1 highlights two possible CO2 emission pathways up to 2100 and their effect on the average temperature on Earth compared to the pre-industrial era. The baseline (business-as-usual) scenario results in a temperature increase of 3.2–5.4°C, while the Paris Agreement pathway results in an increase of 0.9–2.3°C. The Paris Agreement requires a sharp decrease of CO2 emissions and possibly negative CO2 emissions after 2080.
![CO2 emission scenarios up to 2100 [21].](https://ip.ios.semcs.net:443/media/isp/2020/67-1/isp-67-1-isp190276/isp-67-isp190276-g001.jpg)
The International Maritime Organisation (IMO) mainly focussed on the reduction of harmful emissions e.g. sulphur oxides (SOX), nitrogen oxides (NOX) and particulate matter (PM) emissions from shipping. In addition, the IMO has currently two energy efficiency measures in place to reduce CO2 emissions from ships. These are the Energy Efficiency Design Index (EEDI) and the Ship Energy Efficiency Management Plan (SEEMP). The EEDI applies to new ships from the largest and most energy intensive vessel types, covering about 85% of the CO2 emissions from international shipping. It requires a 30% CO2 reduction in grams per tonne mile for vessels built in 2025 compared to the reference value (average from 2000 to 2010) [27].
Greenhouse gas (GHG) emission reduction is gaining importance within the IMO, even though the Paris Agreement does not include the shipping sector. IMO has adopted an initial strategy on the reduction of greenhouse gas emissions from ships [28] during the 72nd meeting of the Marine Environment Protection Committee (MEPC) in April 2018. The initial IMO GHG strategy has the objective to reduce the total GHG emissions of shipping with at least 50% in 2050 compared to the 2008 level and aims to pursue efforts to phase GHG emissions out entirely. This 50% CO2 reduction is in line with the proposal of the International Chamber of Shipping [29].
The shipping sector emitted 854 Mt of CO2 emissions in 2017, about 2.6% of the total global amount of CO2 emissions in 2017 [26]. The CO2 emissions of shipping are expected to increase in the future for several reasons. The shipping volume is expected to grow with 32% until 2030 (compared to 2016) [13] and the maritime fleet size will likely increase with 35% in deadweight by 2050 [27]. The long economic lifetime of vessels about 25–30 years, results in a slow pickup of alternative (cleaner) fuels due to the fuel dependent retrofit costs.
Work vessels present a particularly difficult challenge. For example, dredging vessels are often required to operate worldwide and under heavy conditions. These vessels have a high power density, limited on-board space, require often a large autonomy, and therefore will need very energy dense fuels. The alternatives are needed for the maritime sector and for work vessels in particular include:
alternative renewable fuels;
novel cleaner prime movers;
efficient designs;
system integration at both the vessel and the value chain level (i.a. the fuel logistics & availability and clear policy).
1.2.Alternative fuels
Several alternative fuels or energy carriers are considered in literature to replace fossil fuels in the maritime sector [14,16,29,38,43]. Each of these alternatives has their own issues regarding the sufficient availability for the maritime sector, the transport & bunkering logistics, the status of the renewable production processes and the fuel & investment costs. Table 1 provides an overview of the technology readiness level (TRL), the possible prime movers, the total cost of ownership (TCO) and emissions of a vessel operating on these alternatives. NASA developed the TRL system to assess the maturity of a technology with certain criteria for each level from 1 to 9 as explained by Mankins (2004) [39]. The emissions in Table 1 include the GHG and hazardous tank-to-propeller (TTP) emissions, however the well-to-tank (WTT) emissions are not considered in the table. The “+” and the “
transition fuels: fossil fuels emitting less harmful emissions (NOX, SOX & PM) and possibly less GHG emissions;
bio-based fuels: fuel with carbon from biomass emitting nett less GHG emissions;
renewable e-fuels: fuels with carbon captured from the environment for example via exhaust gas capture or direct air capture (DAC);
carbon-free fuels/energy carriers such as hydrogen (compressed, liquefied), ammonia (NH3), reversible metal hydrides (MH2), alkali metal hydrides (such as sodium borohydride (NaBH4)), iron powder (Fe) and batteries.
Table 1
Alternative fuel characteristics and integration aspects [4]
| Fuel | TRL | Prime mover | TCO | Emissions |
| GTL (syn. diesel) | 8 | CI/FC | ||
| LNG/CNG | 9 | DF/SI/FC | + | |
| LPG | 9 | DF/SI/FC | + | + |
| MeOH | 8 | DF/SI/FC | − | |
| DME | 6 | CI/FC | − | |
| HVO (biodiesel) | 8 | CI/FC | ||
| Biogas (NG) | 8 | DF/SI/FC | ||
| BioMeOH | 7 | DF/SI/FC | ||
| BioDME | 6 | CI/FC | + | |
| BioEtOH | 9 | SI/FC | ||
| Ren. MeOH | 7 | DF/SI/FC | + | |
| LH2 | 9 | DF/SI/FC | − | 0 |
| NH3 | 5 | FC | + | 0 |
| NaBH4 | 3 | DF/SI/FC | 0 | |
| Fe | 3 | n/a | 0 | |
| Li-ion | 9 | n/a | 0 |
CI: compression ignition internal combustion engine (ICE), DF: dual fuel ICE, SI: spark ignited ICE & FC: fuel cell (type depends on fuel).
Figure 2 shows the energy storage density per mass and per volume for several energy carriers including their storage system. These properties are independent of the fuels origin (fossil, biomass, e-fuel/renewable or a blend). Biofuels may be a future fuel option for the maritime sector, but should be produced 100% renewable and not compete with food production. The production processes of biofuels, renewable e-fuels and the carbon-free fuels are still in development, making it difficult to predict which will be the future fuel for (work) vessels. Brynolf et al. (2018) [2] concluded that methane is the least costly e-fuel to make, followed by methanol, dimethyl ether, gasoline and diesel, but these estimations have uncertainties. Renewable methane can theoretically be produced with 80% efficiency based on the lower heating value (LHV) using a solid oxide electrolysis cell for co-electrolysis [35], but the technology is still in development. The process requires CO2, but this is also the case for the production of other hydrocarbon fuels (e.g. methanol, DME & diesel).
Fig. 2.
Volumetric and gravimetric energy density of logistic fuels including the tank system [41]. *Low temperature AB2, Ovonic, **fuel 30, wet spent fuel (reactor not included), ***spent fuel (reactor not included).
![Volumetric and gravimetric energy density of logistic fuels including the tank system [41]. *Low temperature AB2, Ovonic, **fuel 30, wet spent fuel (reactor not included), ***spent fuel (reactor not included).](https://ip.ios.semcs.net:443/media/isp/2020/67-1/isp-67-1-isp190276/isp-67-isp190276-g002.jpg)
Hydrogen (H2) in the form of liquefied hydrogen (LH2) or compressed gaseous hydrogen (CGH2) is an option for vessels operating close to the coast or on inland waterways. These do not require a large autonomy as they can refuel on a more regular and if required daily basis. The low energy density (Fig. 2) of hydrogen limits its use on work vessels as these usually have no fixed route, have a high power density, have limited space for fuel storage and require a large autonomy.
Ammonia (NH3) has a higher energy density than hydrogen and does not require CO2 as a feedstock unlike renewable hydrocarbon e-fuels. Ammonia is currently not used in commercial applications as a fuel, due to among others its high toxicity and its about 5 times lower laminar flame speed than methane (CH4) [32] which makes it difficult to combust in an engine. The application of ammonia as an energy carrier is currently researched in several projects such as the EU project ShipFC in which a 2 MW ammonia fuel cell will be retrofitted on the offshore support vessel Viking Energy [18]. Ammonia was also used as a fuel during the 2nd World War to power commercial busses in Belgium due to a diesel shortage [34].
Solid energy carriers are being investigated as an alternative fuel for the maritime sector. Figure 2 shows three options, namely reversible metal hydrides (MH2), an alkali metal hydrides e.g. sodium borohydride (NaBH4) and iron powder (Fe). The energy density of NaBH4 in Fig. 2 is based on the wet spent fuel (NaBO2) as this has a higher mass [56]. Storing the fuel in a dry form may increase the energy density, but results in additional energy consumption due to the need to produce fresh water onboard for the hydrogen release reaction. The used fuel may be stored dry, but this requires the drying and thus additional energy consumption. The energy density does not include the required hydrogen release reactor for NaBH4. The efficient recycling of the sodium metaborate (NaBO2) to the usable NaBH4 still posses an issue [36]. The iron powder (Fe) energy density is based on the used fuel as this in the form of haematite (Fe2O3) is about 43% heavier than the unused fuel due to the additional bound oxygen atoms [33]. The combustion chamber required for iron powder is not included in the energy density of this fuel.
Literature [14 ,16,29,38,43] also mentions nuclear, solar and wind power, but these are not included here. Work vessels often operate globally under unpredictable sea conditions and require a reliable and stable power source with a high energy density. This rules out solar and wind power as the main energy source, but, they can play an auxiliary role. Wind (assisted) power with for example a Flettner rotor can reduce fuel consumption on some types of work vessels by reducing the required propulsion power. Nuclear power is not a likely power source for commercial shipping as it is a controversial technology due to its social acceptance and high capital costs. Work vessels usually operate close to the coast and enter harbours frequently, thus its application is not expected for these vessels. Nuclear power is probably limited to military applications and to vessels that operate very remotely with no bunkering infrastructure.
1.3.Prime movers
The shift from heavy fuel oil (HFO) to alternatives allows for the application of novel prime movers with a higher efficiency and lower emissions. The diesel engine is currently the predominant prime mover in the maritime sector, but the natural gas fuelled pilot ignited dual fuel engine has been gaining traction recently. The prime movers considered for (future) maritime application can be divided in two categories, namely internal combustion engines and fuel cells. Gas turbines are continuous internal combustion engines, but are not common for maritime application due to their low efficiency in the required power range.
Reciprocating internal combustion engines can be split in compression ignition (CI), pilot ignited gas-diesel (GD), pilot ignited dual fuel (DF) and spark ignited (SI) engines. Table 1 showed that CI engines can be used for high Cetane number (CN) fuels such as marine diesel oil (MDO) or marine gasoil (MGO), biodiesel either hydrotreated vegetable oil (HVO) or fatty acid methyl esters (FAME), gas-to-liquid (GTL) also known as synthetic diesel and (bio)dimethyl ether (DME). Fuels with a low CN have a too large ignition delay and cannot be used in the CI engines [25]. Combusting ammonia in a CI engine requires a compression ratio of more than 35 to achieve the auto ignition temperature in the cylinder [11,37].
Low CN fuels such as methanol (MeOH), ethanol (EtOH), liquefied petroleum gas (LPG) and natural gas either liquefied (LNG) or compressed (CNG) require an external ignition source to start the combustion process. DF and SI engines add the main energy source to the fresh airflow either in the inlet port, the inlet receiver or before the compressor [19]. This air-fuel mixture is ignited in the cylinder with either a diesel pilot (in a DF engine) or a spark plug (in a SI engine). SI engines general have pre-combustion chambers with a richer air-fuel mixture to ensure combustion in the main chamber. Using a pre-chamber allows these engine to run on more lean mixtures, resulting in a higher engine efficiency and lower NOX emissions. Injecting the fuel in the inlet receiver or before the compressor of engines with a valve overlap results in fuel slip. For some fuels, such as methane, this has a negative impact on the GHG emissions of these engines. Therefore, most modern dual fuel engines inject the fuel in the inlet receiver and time it based on the exhaust valve closure. These engines may still have fuel slip due to an incomplete combustion as there are dead spots in the cylinder which the flame front may not reach [7].
The GD engine alternatively injects the main energy source at high pressure in the cylinder through the flame created by the combustion of the pilot fuel [19]. This combustion method may be applied for the same fuels as the DF and SI processes indicated in Table 1. The GD process results in a diesel like combustion and transient response. It prevents the occurrence of knocking and misfiring, but does result in NOX emissions similar to those of diesel engines.
Fuel cells are an alternative prime mover with less harmful emissions, less noise and higher efficiencies than internal combustion engines, but at the cost of a slower transient response and a lower tolerance for fuel impurities [55]. The most promising fuel cell types for maritime applications are the low temperature proton exchange membrane fuel cell (LT-PEMFC), the high temperature proton exchange membrane fuel cell (HT-PEMFC) and the solid oxide fuel cell (SOFC) [52].
Table 2 provides an overview of the characteristics of these three fuel cell types. LT-PEMFCs are used by car manufacturers as a primary mover due to the high power density and the good transient capability for a fuel cell, but hydrogen with a high purity is required as a fuel. For the maritime application of LT-PEMFCs, the main issues to be solved are the on-board availability of pure hydrogen and the possible failure mechanisms in a marine environment due to for example the saline air [30].
Table 2
Overview of the characteristics of various fuel cell technologies [55]
| Property | Unit | LT-PEMFC | HT-PEMFC | SOFC |
| Operating temperature | °C | 65–85 | 140–180 | 500–1000 |
| Electrical efficiency (LHV) | % | 40–60 | 30–40 | 50–65 |
| Fuel requirements | 99.9999% H2 | CO < 3% | S < 20 ppm | |
| Gravimetric power density | W/kg | 125–750 | 25–150 | 8–80 |
| Volumetric power density | W/l | 50–400 | 15–120 | 4–32 |
| Stack life time | 5–20 kh | 10–30 kh | 20–90 kh | |
| System life time | ⩾10 years with stack replacement | |||
| Cold start-up time | <10 s | 10–60 min. | >30 min. | |
| Load transients (0 to 100%) | seconds | <5 min. | <15 min. | |
| Current capital cost | €/kW | 1000–2500 | 3000–5000 | 3500–15000 |
| Projected capital cost | €/kW | 50–500 | 100–1000 | 200–2000 |
| Maritime TRL | 6–7 | 5–6 | 4–5 | |
| Cooling medium | Liquid | Liquid | Air | |
SOFCs have a higher tolerance for fuel impurity, allowing for operation on light hydrocarbons such as natural gas [54]. The high temperature of the SOFC also allows for reforming in the stack and operation on ammonia, which can be cracked in the stack [9]. However, SOFCs have a low power density and a slow transient response to prevent thermal stress in the stack [45]. SOFCs are generally applied on land in mission critical systems such as data centres and in combined heat and power systems. Maritime application of SOFCs requires an increase of the power density and a reduction of the cost price per kilowatt.
HT-PEMFCs are an alternative for both as these have a higher tolerance to carbon monoxide (CO) than the LT-PEMFCs and a faster transient response than the SOFC, but at a lower efficiency [6]. A possible implementation of HT-PEMFCs is to replace auxiliary engines, which generally have a lower power than the main engines. The HT-PEMFC may be used to operate on the reformate of a fuel which is easy to reform such as methanol [31]. Fuels that require higher temperatures to reform such as methane should not be combined with HT-PEMFCs as the operating temperature is not high enough to reform the fuel and the need for external heat would further decrease the efficiency.
1.4.Energy efficiency measures
Efficient vessel designs may be combined with novel fuels and prime movers to further decrease the CO2 emissions. More efficient vessels require less fuel, which can increase its autonomy or reduce its size. Therefore, improving the energy efficiency of vessels is required for the successful implementation of alternative fuels with a lower energy density.
Bouman et al. (2017) [1] made a review regarding the state-of-art of measures to reduce GHG emissions from shipping. Figure 3 shows their results for 22 measures distributed in 5 categories. Some of these measures are mutually exclusive, but others can be combined. Current technologies make it possible to reduce CO2 emissions with 50–60% for freight transport without including the effect of renewable fuels.
![CO2 emission reduction potential as published by Bouman et al. (2017) [1].](https://ip.ios.semcs.net:443/media/isp/2020/67-1/isp-67-1-isp190276/isp-67-isp190276-g003.jpg)
The improvement from these measures is smaller for work vessels such as trailing suction hopper dredgers (TSHDs) as the dedicated mission equipment requires a significant part of the installed power [10,49]. The propulsion system of TSHDs accounts for about 50% of the total power requirement. Therefore, improvement to both the power generation system and the propulsion system are important.
Improving the hull shape of a TSHD may reduce resistance with approximately 15% on top of the about 30% reduction achieved for TSHD’s during the last 25 years [41]. The propeller efficiency may be improved significantly by applying CFD for more accurate propeller flow calculations of new designs. This results in a better efficiency at a certain thrust to speed ratio and a propeller which does not cavitate during normal operation. The new Wageningen C4-40 propeller has a maximum efficiency of 78% at a P/D of 1.4 [8], a 30% efficiency improvement compared to the 60% efficiency of current propellers. The combination of using light weight materials (±5%), hull shape optimisation (±15%), a more efficiency propeller (±23%) and measures to reduce resistance such as hull coatings (±5%) results in a propulsion system efficiency improvement of a TSHD of about 40%.
The power generation system efficiency of a TSHD may increase with about 20% by combining a hybrid power system with fuel cells and waste heat recovery based on the results of Bouman et al. (2017) [1]. The total fuel efficiency improvement of a TSHD varies between 30% to 40% for a propulsion system energy consumption of 33–67%.
Cutter suction dredgers (CSDs) have a different load profile than TSHDs and a 4.4–24% fuel consumption reduction is possibly by hybridising the drive system [20]. The power generation system efficiency may increase with 10–20% by applying fuel cells in combination with a waste heat recovery (WHR) system [1]. Thus, the total fuel efficiency improvement that may be achieved for a CSD varies between 14% to 40% depending on the operational profile.
1.5.System integration
The drive systems of zero emission vessels with the new energy carriers and novel prime movers require four changes from a system integration perspective, namely design for operational profile, electrification, hybridisation and modularisation. Further, not only the vessel, but also the whole value chain must be integrated, so that zero emission vessels can operate economically with alternative cleaner fuels.
Design for operational profile means the installed power will match the usual power requirements, and is not defined based on a “design point” of an extreme situation that may rarely occur. This extreme situation must be considered as well and measures must be taken to ensure the safety of the vessel and crew in such situations.
Electrification is necessary for the application of novel prime movers such as fuel cell systems, energy storage systems (ESS) and energy recovery devices such as WHR systems based on steam or on an Organic Rankine cycle (ORC) as all of these systems produce either DC or AC power [50,59].
Hybridisation (with an ESS) allows for the use of prime movers with a slower transient response than diesel engines [15,17]. During large load fluctuations an ESS may be used to prevent e.g. a DF engine from changing to diesel operation or prevent a spark-ignited engine from stalling [40]. SOFCs require hybridisation as their dynamic behaviour is limited due to the internal thermal gradients of the cells. LT-PEMFCs have a better dynamic response, but large load variations will significantly reduce the lifetime of the fuel cell due to problems with membrane humidification and gas starvation [47]. For vessels with a low (average) engine load due to dynamic positioning requirements, an ESS may be used as a spinning reserve, delivering power during the failure of an engine or switchboard. This would allow fewer engines to operate and the operating engines will have a higher average engine load, reducing the specific fuel consumption. Fewer running hours and higher engine loads also reduce engine wear and maintenance costs.
Modularisation of future drive systems will allow the flexibility to optimize the drive system for each task the work vessel has to perform based on the operational profile. Drive systems are generally designed for the most extreme situation they could encounter during its operation, while this situation is not very common [22]. This results in overpowered and suboptimal vessels from a fuel consumption perspective as the specific fuel consumption of engines increases at part and low load. Modular power supply units that can be switched on and off as required can overcome this problem and it allows to exchange drive components with limited costs when they become outdated (e.g. for emission purposes).
The integration of the value chain means that zero emission vessels can operate with economic viability and without major limitations. For example, they can bunker their fuel of choice near their operational area. Currently, alternative cleaner fuels are produced in small amounts and the fuels logistics network is underdeveloped, limiting their introduction for maritime applications [48]. Vessel owners need to go to great lengths to organise the fuel supply on their own. The same challenge holds for spare parts and maintenance for novel (often more complex) drive systems, for which crews and maintenance operators need special training. In the view of the multiple alternatives ahead (multiple fuels, multiple prime movers), a wide cooperation is needed at the value chain level, to make sure the energy transition can occur at bearable costs, so systems integration is also needed at a global maritime level. Further, policies that stimulate the cleaner technologies need to come in place, in order to shift the economic balance [24]. A current example is the discussions on the tax exemption of maritime fuels and the introduction of carbon and emission pricing. The effect of a clean design and wide system integration including policies is illustrated in the next section with the example of four design alternatives for self propelled CSD.
2.Methods
2.1.Design alternatives
Designing future proof zero emission vessels is a complex task, involving many choices and a comprehensive systems perspective that the maritime sector still needs to develop. Efforts have been made into developing tools that help designers make these choices and access their effect with limited effort at an early stage. Such a tool is the Life Cycle Performance Assessment (LCPA) tool, described in the next section.
In order to illustrate the effect of design, fuel and prime mover choice, efficiency measures and system integration, four design alternatives of a self-propelled CSD are described and assessed on their environmental performance and economic viability. DF engines using LNG as the main fuel and MDO as the pilot fuel resemble the baseline design. The choice for LNG leads to lower harmful emissions and lower CO2 emissions. Therefore, DF engines fuelled with LNG are the first transition step towards clean zero emission vessels. Fossil LNG is selected as the use of this fuel is increasing in the maritime sector and renewable LNG is currently not available in sufficiency amounts.
DF engines are capable of operating in two modes, the “gas mode”, where main fuel is LNG using diesel as pilot fuel, and the “diesel mode”, where the main fuel is diesel. DF engines switch to diesel mode when subjected to large transient loads. Large load fluctuations are common when dredging of materials such as hard packed sand or rock with a cutter suction dredgers [40,49]. The switch to diesel mode protects the engine from damage, but results in higher emissions than in the gas mode, as the main fuel used is diesel and not natural gas. In order to eliminate the need to switch to diesel mode, two options are available:
use a hybrid drive system with an energy storage system for peak shaving in order to accommodate the large transient loads;
use more engines in parallel to decrease the load change per engine.
The most sustainable option to currently power a vessel is a fuel cell which is fuelled with hydrogen produced from renewable energy. Hydrogen has been selected as it can be produced with available technology (TRL 9) and there are currently several hydrogen fuelled vessels being built powered by either fuel cells or engines. Renewable methane or other renewable hydrocarbon fuels are not considered in this study as these require a carbon source from either biomass and/or DAC and the technologies to produce these fuels are not yet mature (Table 1). When renewable hydrocarbon fuels become available, they are likely more expensive than renewable hydrogen as this is used in their production process. Therefore, four design alternatives were evaluated for the work vessel:
baseline DF LNG: the DF engines change from gas mode to diesel mode during large transient loads;
hybrid DF LNG: improved version of the baseline design using a flywheel to achieve peak shaving with minimum installed power and operational conditions in gas mode, a DF LNG power supply is used;
more engines: add one extra engine (3 engines in total) in order to guaranteed operational conditions in gas mode only for the DF power supply;
future design: hydrogen fuelled fuel cell system with a hybrid drive system able to do peak shaving using a flywheel and batteries. Fuel cell systems should operate with limited dynamic loads for maximum efficiency and lifetime of the stacks. This design is expected to score the best on the environmental performance.
2.2.Vessel weight, materials & investment costs
The baseline vessel design weighs about 15,000 metric tons and the distribution of materials can be found in Table 3. The hybrid LNG and the More Engines designs are assumed to have nearly identical weight and the Future design is assumed to be 10% heavier, due to the relative large weight of hydrogen storage systems. This is a rough estimation and at this early stage, it is not very significant, because the materials have limited impact in the assessment. Besides, this type of vessel spends a significant amount of time not sailing or at a very low speed, so the impact of weight on fuel consumption is considered very limited. The material composition used in the assessment has been limited to simplify the modelling as this has a limited impact on the total results.
Table 3
Material composition and weight of the baseline vessel
| Material | Mass (mt) |
| Steel (85%) | 12,800 |
| Copper (5%) | 750 |
| Others (10%) | 1,450 |
| Total | 15,000 |
Regarding the investment costs, the Hybrid and More Engines designs cost 5% more than the baseline, the Future design costs 40% more. This is only a rough estimation, required to show eventual effects of initial costs of design alternatives.
2.3.Operational phase modelling
The operational phase is modelled in a simplified way as a 30 year use phase. A use phase from 2025 to 2055 is chosen as the used fuel and emission costs are known for this time period. The energy consumption of the alternatives is modelled according to the operational profiles below [42,44]:
the baseline DF design operates 15% of the time in diesel mode;
the Hybrid DF LNG uses 1% more fuel compared to the baseline and operates 100% of the time in gas mode;
more engines DF LNG uses 11% more fuel and operates 100% of the time in gas mode;
future design Hydrogen Fuel Cell is estimated to use 30% less fuel compared to the baseline. Fuel cell systems are known to have a higher efficiency than internal combustion engines. Combining fuel cells with a hybrid system, optimal installed power for the operational profile and a WHR system, may achieve a reduction of at least 30% in fuel consumption for the same functionality. The chosen fuel is hydrogen produced from excess offshore wind energy.
2.4.LCPA method
The LCPA method was developed in the FP7 EU-funded project JOULES based in the life cycle assessment (LCA) methodology standard ISO 14040 [23,57]. The LCPA method is a simplified screening LCA capable evaluating the environmental performance of design alternatives for maritime equipment at an early stage. Six relevant aspects for the maritime sector were defined. These key performance indicators (KPIs) are included in the method and are calculated with widely accepted methods for each of them [51,57,58]. The chosen environmental indicators are consistent with results from previously performed screening LCAs for applications in which large amounts of fossil fuels are used such as the transport sector [3,5]. The net present value (NPV) has been added as an economic indicator, resulting in the following KPIs measured over the entire life cycle of the vessel:
global warming potential (GWP) in [tCO2-eq]: calculated with the CO2 and CH4 emissions with an GWP attributed to methane of 28 [46];
acidification potential (AP) in [tSO2-eq]: based on the amounts of SOX, NH3, HCl and NOX emissions;
aerosol formation potential (AFP) in [tPM2.5-eq]: caused by PM, SOX and NOX emissions;
cumulative energy demand (CED) in [MWh]: the total required by a process or product over the entire life-cycle;
eutrophication potential (EP) in [tPO4-eq]: resulting from NH3 and NOX emissions;
net present value (NPV) in [€]: calculated with the standard method and a 10% discount rate.
The LCPA tool structure is displayed in Fig. 4 with the characterisation of all emissions and energy consumption in impact categories. The method makes an inventory of all materials flowing into the system, the energy flows and the emissions produced by the system.
![LCPA tool schematic from input to KPI [51].](https://ip.ios.semcs.net:443/media/isp/2020/67-1/isp-67-1-isp190276/isp-67-isp190276-g004.jpg)
The LCPA method includes the three phases of a product during its lifetime, namely: production, operation and end-of-life. It also includes the energy used and emissions produced during the material production and fuels production (well-to-tank energy and emissions). An estimation of the maintenance costs is also included in the calculation. Therefore, the LCPA can be used during the early stages of the design process to get a rough estimation of the vessel’s performance during its entire life cycle.
2.5.Scenarios, fuel costs & emission costs
The LCPA tool has the option to work with various scenarios related to fuel price and emission costs (also called external costs). These scenarios can be used to show the profitability of the design alternatives and the conditions required for a design to be economically viable. Two scenarios based on those of the International Energy Agency (IEA) [26] are used, where the most extreme conditions are described, namely:
business as usual: fossil fuel is cheap, clean fuels expensive and absence of emission costs;
sustainable development: higher fossil fuel costs and emission taxes resulting in better viability of clean fuels.
Tables 4, 5, 6, 7 & 8 show the fuel (MDO, LNG & LH2) and emission costs (CO2, SOX, NOX & PM) as used in the LCPA tool [4].
Table 4
| Date | Costs (USD/mt) | ||
| Low | Middle | High | |
| 1-1-2025 | 554.4 | 792.9 | 1465.2 |
| 1-1-2030 | 558.6 | 920.7 | 1678.5 |
| 1-1-2035 | 621.0 | 1061.1 | 1909.8 |
| 1-1-2040 | 659.7 | 1234.8 | 2185.2 |
| 1-1-2045 | 692.1 | 1375.2 | 2416.5 |
| 1-1-2050 | 724.5 | 1483.2 | 2647.8 |
Table 5
| Date | Costs (€/MWh) | ||
| Low | Middle | High | |
| 1-1-2025 | 29.4 | 51.0 | 62.9 |
| 1-1-2030 | 29.9 | 49.2 | 67.8 |
| 1-1-2035 | 30.0 | 51.8 | 69.2 |
| 1-1-2040 | 33.8 | 59.3 | 80.4 |
| 1-1-2045 | 37.7 | 66.9 | 91.7 |
| 1-1-2050 | 41.5 | 75.6 | 102.9 |
Table 6
| Date | Costs (€/kg) |
| 1-1-2025 | 5.7 |
| 1-1-2030 | 5.2 |
| 1-1-2035 | 4.7 |
| 1-1-2040 | 4.2 |
| 1-1-2045 | 3.8 |
| 1-1-2050 | 3.3 |
Table 7
| Date | CO2-equivalent cost (€/mt) | ||
| Low | Middle | High | |
| 1-1-2020 | 50 | 105 | 160 |
| 1-1-2030 | 70 | 145 | 215 |
| 1-1-2040 | 95 | 190 | 290 |
| 1-1-2040 | 130 | 260 | 390 |
2.6.End-of-life
The end-of-life phase of the four concepts has been modelled as the scrapping and recovery of materials from the vessel. The costs of scrapping are estimated at a lump sum of € 1,000,000.– for all design alternatives. It is assumed that 100% of the steel content and 60% of the copper content is recovered during scrapping. The remaining materials are disposed as waste.
3.Results
3.1.Business-as-usual scenario
The results of the LCPA assessment are presented for the business as usual case in Table 9. The business as usual scenario uses the low fuel costs as defined in Tables 4, 5, & 6 and assumes that there are no external costs (i.e. emission costs). Figures 5 to 10 show the major emissions relevant for the maritime sector for both the business as usual and the sustainable development scenario. The results show that all alternative designs score better than the baseline for most impact categories, except for the NPV value. The More engines alternative scores worse for the GWP due to additional fuel consumption at low engine load [42].
The following sections show the spider web diagram visualisation of the LCPAs KPIs and go into detail in the global warming potential and external costs aspects. These show that the hydrogen fuel cell design alternative scores much better than the other design alternatives on all environmental KPIs except for the cumulative energy demand KPI. It seems that a higher energy consumption compared to fossil fuels is the trade-off required for using clean renewable fuels.
Table 9
Impact category KPI results, relative to the baseline (business as usual scenario)
| Property | Baseline DF | Hybrid DF | More engines | Hydrogen fuel cell |
| NPV | 100 | 93.0 | 81.4 | 55.6 |
| AFP | 100 | 63.6 | 69.3 | 5.5 |
| AP | 100 | 59.7 | 65.0 | 7.4 |
| GWP | 100 | 95.9 | 103.5 | 16.9 |
| CED | 100 | 100.5 | 109.3 | 118.5 |
| EP | 100 | 68.5 | 74.5 | 2.2 |
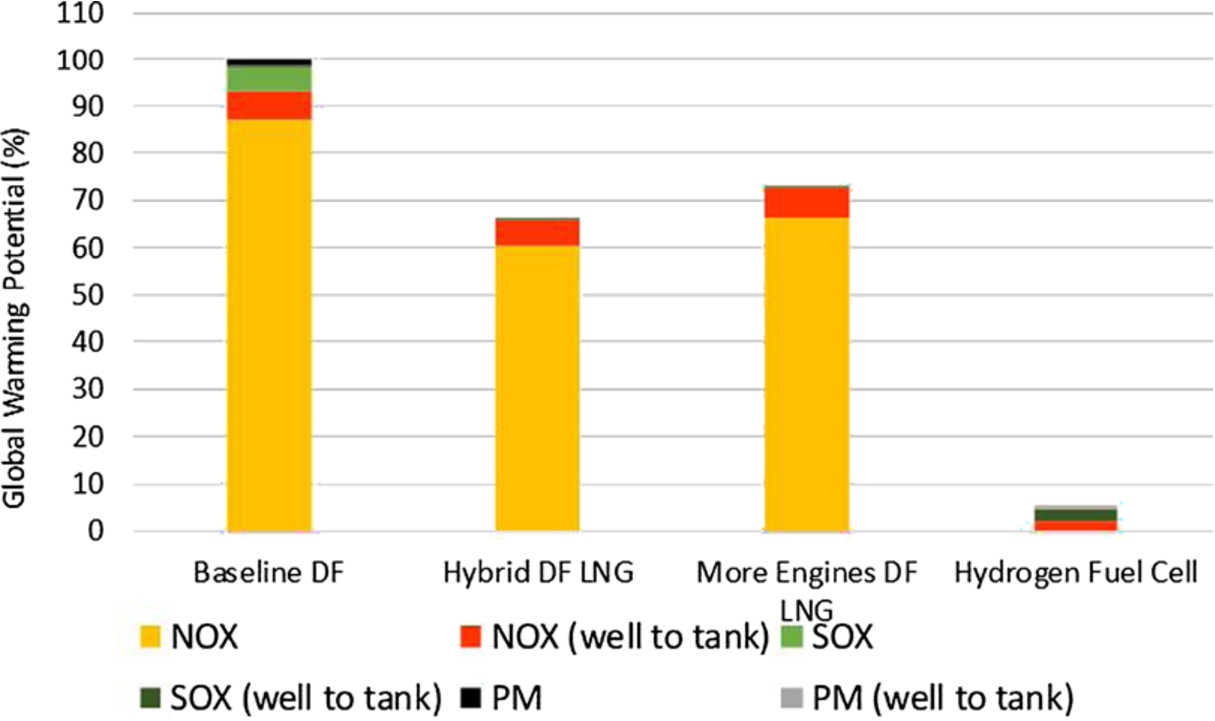
Figure 5 shows the amount of harmful emissions produced from well-to-propeller (WTP) split between the WTT and the TTP emissions. The hydrogen design alternative has only limited emissions, which originate from the offshore wind infrastructure required to produce renewable hydrogen, but has no harmful emissions during operation.
Fig. 5.
Amounts of the harmful emissions NOX, SOX and PM during the lifecycle.
3.2.Spider web diagram visualisation
The spider web diagram of the design alternatives is shown in Fig. 6. The baseline is in grey as backgrounds, and all KPIs are compared to the baseline, which is scaled to 100%. More than 100% is an improvement for the NPV and for the other KPIs less than 100% is an improvement. This figure shows that the “Hybrid DF” design has a slight advantage compared with the “More engines DF”.
Fig. 6.
Spider web diagram showing the KPIs performance, scenario business-as-usual.
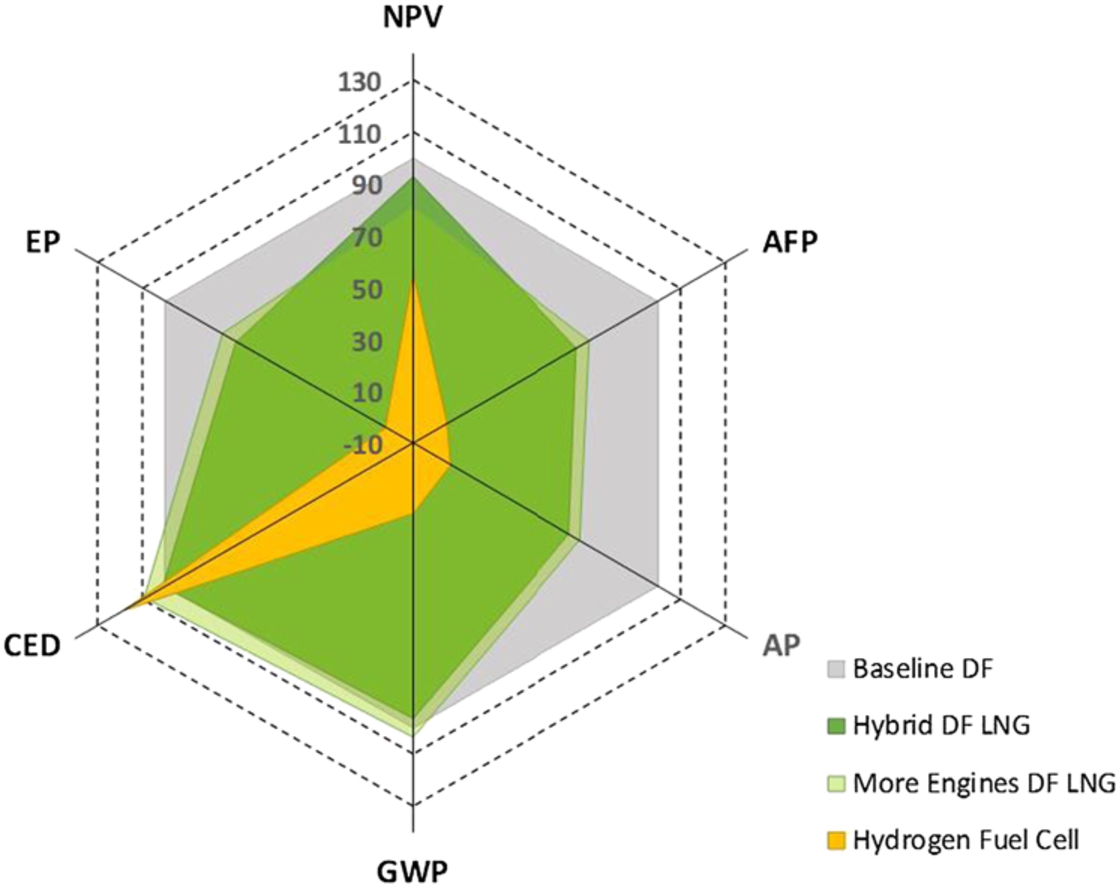
The best environmental performance is originated by the Hydrogen fuel cell, as it could be expected, as the hydrogen is produced from offshore wind, so the emissions over the lifecycle are very low. All alternatives score worse in the CED as they require more fuel in the case of the “Hybrid” and “More engines”, and in the case of “Hydrogen Fuel Cell, the production of hydrogen from electrolysis requires a large amount of energy. The environmental performance of the Hybrid DF is expected to be better in reality, as the effect of engine load in the emissions is not captured with full detail in the LCPA tool.
All design alternatives score lower in the NPV (the economic indicator) than the Baseline DF, as the initial investment and higher fuel costs of hydrogen have a negative impact on the economic aspect. Hydrogen production from renewable sources requires more energy than fossil LNG production, what is also visible in the CED axis.
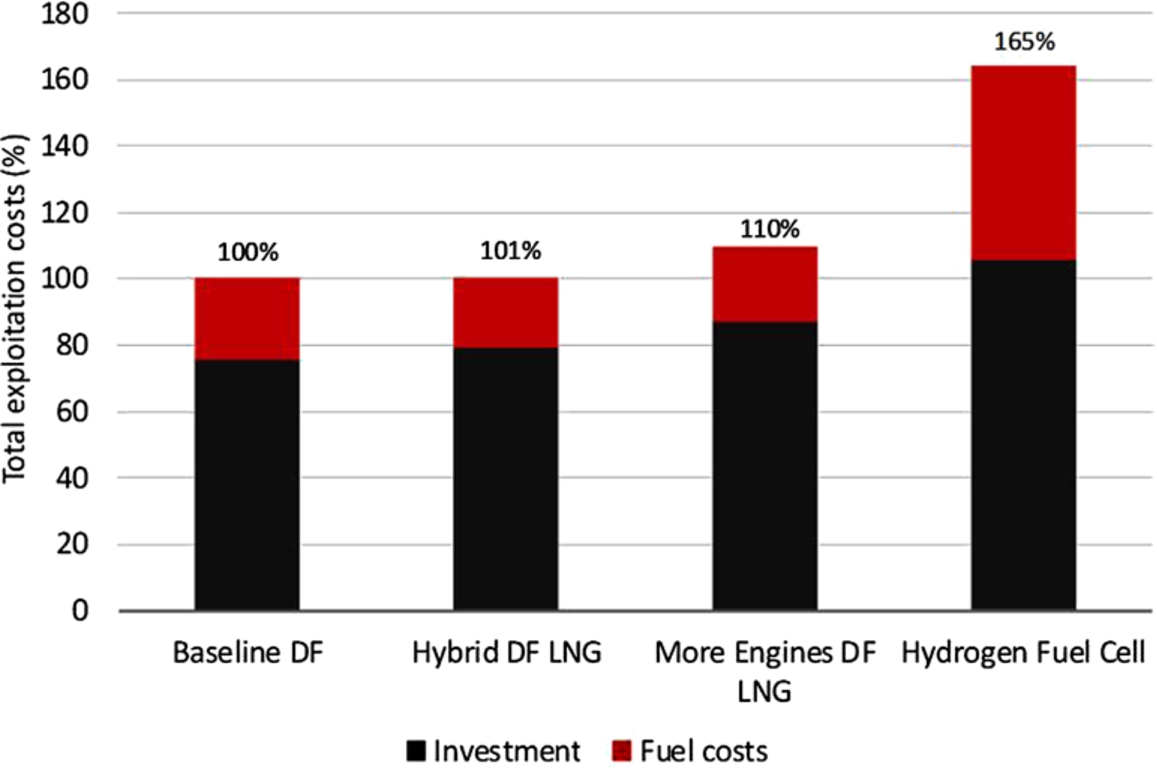
The cumulative costs over the lifecycle, shown in Fig. 7 are in this scenario 165% for the Fuel Cell Hydrogen vessel compared to the Baseline DF design, as the higher investment costs add up to the higher fuel costs. The higher efficiency is not able to compensate sufficiently for the fuel cost
Fig. 7.
Cumulative costs of investment and fuel, scenario business-as-usual.
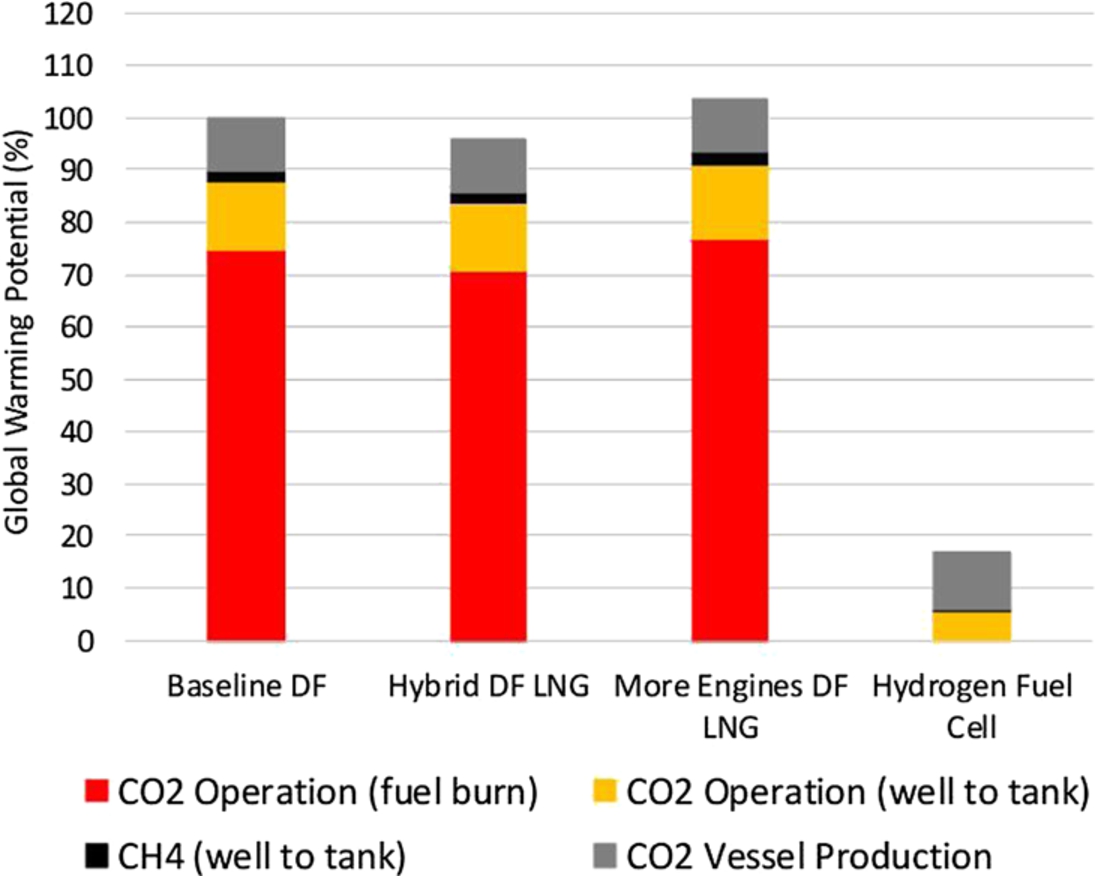
3.3.Global warming potential
The global warming potential is highlighted here in more detail, due to the recent policy developments on reduction of CO2 emissions. Figure 8 shows that the Hybrid DF design has a slightly better performance in this KPI, even having a slightly higher fuel consumption, as it is known that LNG produces less CO2 emissions per kWh than diesel. Even when accounting for some CH4 emissions (methane slip), the result of eliminating the time that the engine changes to diesel mode results in a lower total GWP score [42]. The total GWP of the More Engines design is higher due to the lower engine efficiency at low load and the higher methane slip emissions as calculated in Mestemaker et al. (2019) [42]. The Hydrogen Fuel Cell design has some CO2 and CH4 emissions, which are originated by the upstream processes, the materials production and infrastructure of the offshore wind installation.
Fig. 8.
Global warming potential over the lifecycle.
3.4.Sustainable development scenario
The sustainable development scenario is based on the scenario sketched by the IEA [26] in which fossil fuels and emissions are taxed. In addition, local governments may impose constraints on dredging in tenders to favour solutions with lower emissions and higher costs over those with higher emissions and lower costs by placing a value on the emissions emitted during the dredging works. This scenario uses the high fossil fuel costs as defined in Tables 4 & 5, the middle fuel costs for hydrogen from Table 6 and assumes that there are external costs. These external costs consists of the high CO2 price as defined in Table 7 and the SOX, NOX & PM costs as provided in Table 8.
The introduction of high fossil fuel costs and high emission costs result in a different score for the NPV, where the hydrogen fuel cell vessel scores the best as shown in Fig. 9. The other scores remain unchanged, as only the costs change. In this situation, the hydrogen fuel cell vessel has an NPV of 108%, compared to the baseline DF design. This is the cumulative effect of the fuel savings due to the high efficiency of the fuel cell system and the savings on the emission costs of CO2 and the harmful emissions: NOX, SOX & PM. The effect of the fuel and emissions costs in this scenario is show in Fig. 10. This figure illustrates the important impact of the economic-environmental policies of attributing costs to emissions on the economic viability of cleaner vessels. Figures 7 and 10 do not include the revenues, as the assumption in the LCPA model is that these are the same for all vessel design alternatives.
Fig. 9.
Spider web diagram showing the KPIs performance, sustainable development scenario.
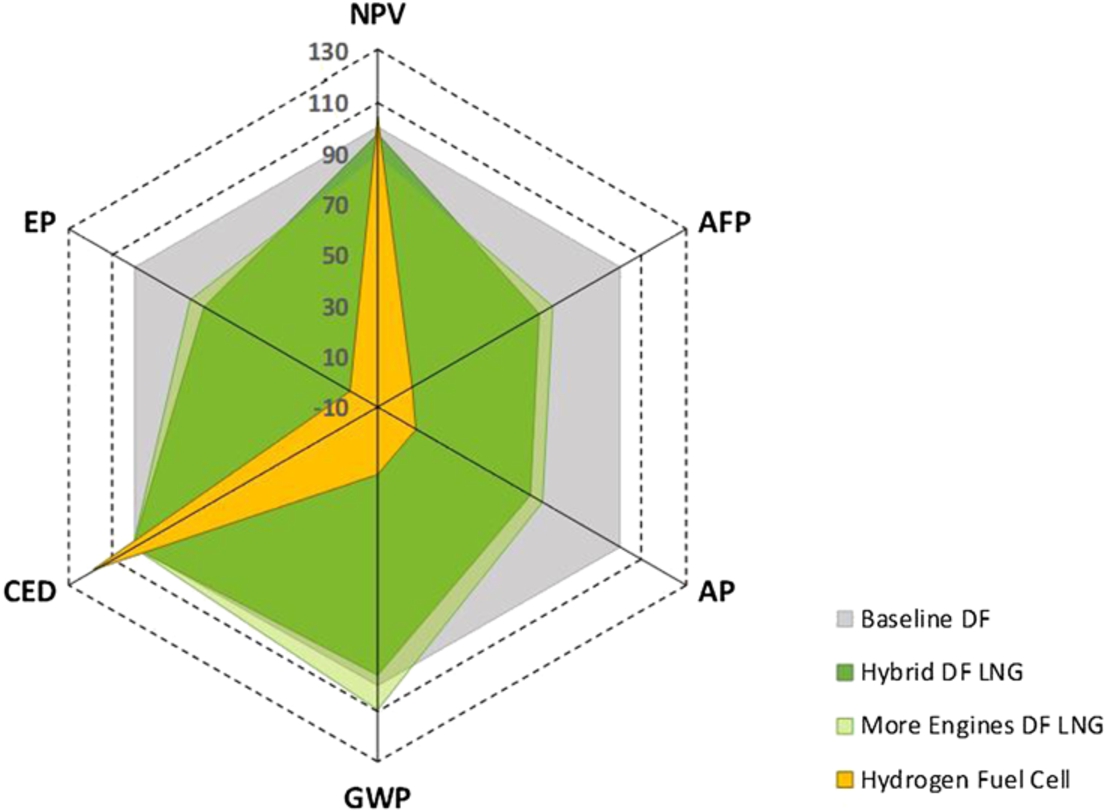
Fig. 10.
Cumulative costs of investment, fuel and emissions, sustainable development scenario.
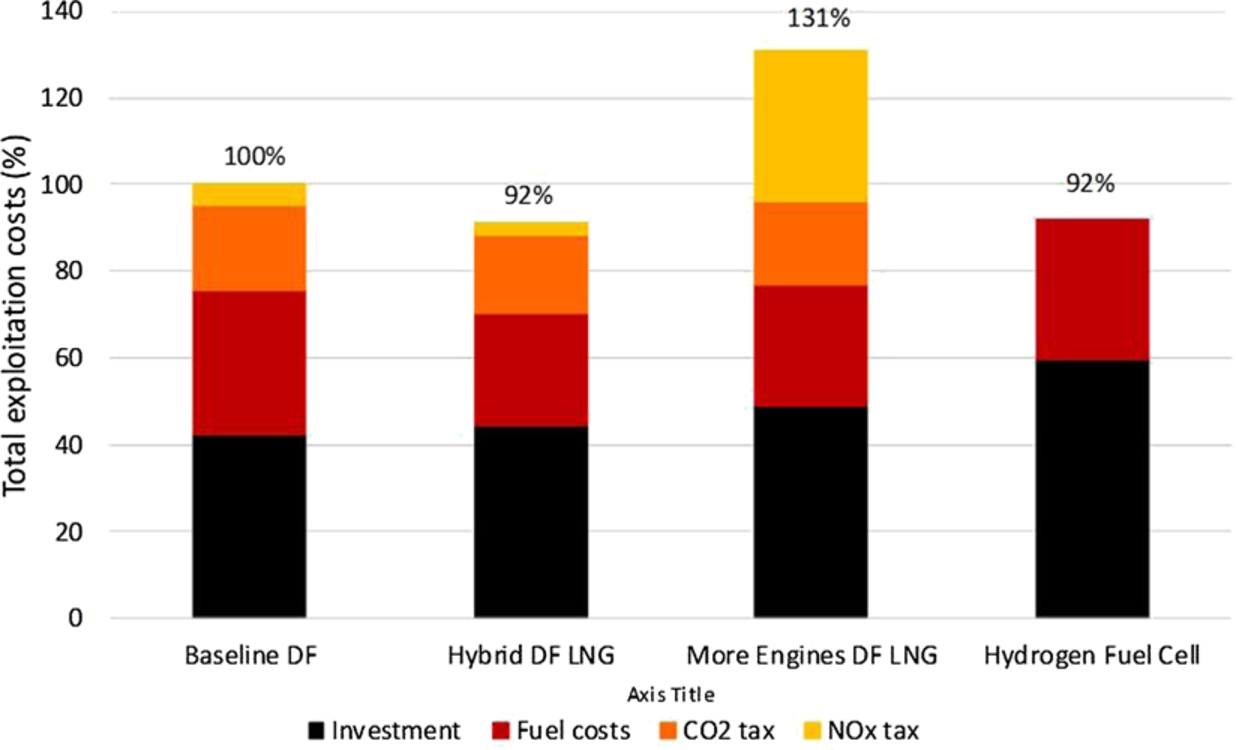
In Fig. 7, the best choice in economic terms is the baseline design, closely followed by the hybrid DF. The hydrogen fuel cell design is the least attractive due to high technology costs and high fuel costs compared to LNG. For the sustainable development scenario, Fig. 10, the result is opposite and the hydrogen fuel cell and the hybrid DF LNG designs are the most economically viable as these have lower emission costs. Therefore, in a future scenario where fossil fuels are costly and emissions are taxed, the cleanest technology also becomes the most economic viable. When comparing both figures, it seems that in an uncertain future, choosing a clean fossil fuel with high efficiency drive system (i.e. the hybrid DF concept) might strike a good compromise.
The implementation of emission taxes alone may not be enough to provide cleaner concepts with a financial advantage over more polluting drive system designs. Figure 10 shows that the LNG fuelled hybrid concept has the same cumulative costs as the renewable hydrogen fuel cell design in the sustainable development scenario despite the higher emissions of the hybrid system design (Fig. 5). If policy makers want to stimulate a change to a zero emission maritime sector, new policy is required consisting of subsidies and/or more strict legislation. New legislation may not be limited to new-built vessels, but could include the existing fleet as vessels generally have a lifetime of 25–30 years [12]. This legislation may limit both GHG emissions (CO2 & CH4) and harmfull emissions (SOX, NOX & PM). Additionally, policy makers may include specific demands in tender processes as well as prohibit vessels from operating in certain areas.
These results should not be taken as a conclusion as they are obtained with simplifications and a prognoses of price and tax developments. But, it is demonstrated that the LCPA tool can be used at an early design stage to make a first assessment of design alternatives. The design parameters need to be carefully analysed in each case in order to reach a robust conclusion. A more detailed modelling of the drive system is required to compare the harmful emissions, this requires the inclusion of the dynamic aspects of the driveline behaviour such as studied by Mestemaker et al. (2020) [40].
4.Conclusions
The energy transition poses complex vessel design problems with multiple factors, but this is not only a challenge in the sense of technology and design. In order to achieve zero emissions with economic viability, wide cooperation and effective legislation are needed for the maritime sector. The results presented in this article illustrate that design alternatives can be modelled at an early stage and evaluated using the life cycle performance assessment methodology. This approach is able to translate the effects of design choices and provides a first indication of the environmental and economic performance of the vessel over the entire lifetime, and thereby assists designers and ship operators to choose fuels and driveline designs at an early design stage.
The operational phase is the most important in the environmental performance of work vessels, and all vessel types and accounts for more than 90% of the total environmental impact of the whole life cycle of the vessel. The design of efficient vessels has a positive effect on the environmental performance, especially when considering greenhouse gas emissions. The combination of efficient designs and clean fuels has a tremendous potential for future vessels aiming to achieve zero emission as is shown in this article.
At an early stage, some details seem to be very important, while others are less important. The vessel weight and materials composition do not require detailed modelling for a self-propelled cutter suction dredger. However the costs, the fuel consumption and emissions do require detailed modelling. This is required in order to capture the economic and environmental performance accurately and to be able to compare the design alternatives on a sound basis.
The possibility of using scenarios with variations in fuel prices and emission costs is very valuable as well. In this article, the large effect of scenario variables is illustrated, resulting in the economic viability of either a fossil-fuel-based technology or a zero-emission-based technology. Next to the technological developments, policies are required in order to stimulate the (maritime) energy transition and create a level playing field for the maritime industry. Ship owners striving for clean innovations should be rewarded and the economic viability of the sector should be safeguarded on the long term.
Abbreviations
AFP | aerosol formation potential |
AP | acidification potential |
CED | cumulative energy demand |
CGH2 | compressed gaseous hydrogen |
CH4 | methane |
CI | compression ignition |
CN | Cetane number |
CNG | compressed natural gas |
CO2 | carbon dioxide |
CO | carbon monoxide |
CSD | cutter suction dredgers |
DAC | direct air capture |
DF | dual fuel |
DME | dimethyl ether |
EEDI | Energy Efficiency Design Index |
EP | eutrophication potential (EP) |
ESS | energy storage systems |
EtOH | ethanol |
FAME | fatty acid methyl esters |
FC | fuel cell |
Fe | iron (powder) |
Fe2O3 | haematite |
GD | gas-diesel |
GHG | greenhouse gas |
GTL | gas-to-liquid |
GWP | global warming potential |
H2 | hydrogen |
HCl | hydrogen cloride |
HFO | heavy fuel oil |
HT-PEMFC | high temperature proton exchange membrane fuel cell |
HVO | hydrotreated vegetable oil |
ICE | internal combustion engine |
IEA | International Energy Agency |
IMO | International Maritime Organisation |
KPI | key performance indicator |
LCA | life cycle assessment |
LCPA | Life Cycle Performance Assessment |
LH2 | liquefied hydrogen |
LHV | lower heating value |
LNG | liquefied natural gas |
LPG | liquefied petroleum gas |
LT-PEMFC | low temperature proton exchange membrane fuel cell |
MDO | marine diesel oil |
MeOH | methanol |
MEPC | Marine Environment Protection Committee |
MH2 | (reversible) metal hydrides |
MGO | marine gasoil |
NaBH4 | sodium borohydride |
NaBO2 | sodium metaborate |
NH3 | ammonia |
NOX | nitrogen oxides |
NPV | net present value |
ORC | Organic Rankine cycle |
PM | particulate matter |
PO4 | phosphate |
SEEMP | Ship Energy Efficiency Management Plan |
SI | spark ignited |
SOFC | solid oxide fuel cell |
SOX | sulphur oxides |
TCO | total cost of ownership |
TRL | technology readiness level |
TSHD | trailing suction hopper dredger |
TTP | tank-to-propeller |
WHR | waste heat recovery |
WTP | well-to-propeller |
WTT | well-to-tank |
References
[1] | E.A. Bouman, E. Lindstad, A.I. Rialland and A.H. Strømman, State-of-the-art technologies, measures, and potential for reducing GHG emissions from shipping – A review, Transportation Research Part D, 52: ((2017) ), 408–421. doi:10.1016/j.trd.2017.03.022. |
[2] | S. Brynolf, M. Taljegard, M. Grahn and J. Hansson, Electrofuels for the transport sector: A review of production costs, Renewable and Sustainable Energy Reviews 81: ((2018) ), 1887–1905. doi:10.1016/j.rser.2017.05.288. |
[3] | M.B.G. Castro, M.J. Holtkamp, P.M. Vercruijsse, E.C. van der Blom and D. van Woerden, Using Life Cycle Analysis Methodology to assess the sustainability of dredging equipment and its manufacturing process, in: Proceedings of the CEDA Dredging Days, 10–11 November 2011. |
[4] | M.B.G. Castro, B.T.W. Mestemaker and H.N. van den Heuvel, Towards zero emission work vessels: The case of a dredging vessel, in: Proceedings of the 2nd International Conference on Modelling and Optimisation of Ship Energy Systems (MOSES2019), 8–10 May 2019, pp. 145–153. ISBN 9781909522510. |
[5] | M.B.G. Castro, J.A.M. Remmerswaal and M.A. Reuter, Life Cycle Impact Assessment of an average passenger vehicle in the Netherlands, International Journal of Life Cycle Assessment 8: ((2003) ), 297–304. doi:10.1007/BF02978922. |
[6] | A. Chandan, M. Hattenberger, A. El-kharouf, S. Du, A. Dhir, V. Self, B.G. Pollet, A. Ingram and W. Bujalski, High temperature (HT) polymer electrolyte membrane fuel cells (PEMFC) – A review, Journal of Power Sources 231: ((2013) ), 264–278. doi:10.1016/j.jpowsour.2012.11.126. |
[7] | CIMAC WG 17, Gas Engines, Methane and formaldehyde emissions of gas engines, 2014. |
[8] | J. Dang, H. van der Boom and J.Th. Ligtelijn, The Wageningen C- and D-series propellers, in: Proceedings of FAST’13, (2013) . |
[9] | N. Dekker and B. Rietveld, Highly efficient conversion of ammonia in electricity by solid oxide fuel cells, in: Proceedings of the 6th European Solid Oxide Fuel Cell Forum, (2004) . |
[10] | L.J.A. den Boer, R.H.A. Kuypers, E.C. van der Blom, B.T.W. Mestemaker and M.B. Gonçalves Castro, Optimizing drive train design for TSHD’s using dynamic simulation models, in: WODCON XX: The Art of Dredging, Brussels, Belgium, 2013 – Proceedings, World Organization of Dredging Associations, 3–7 June 2013. |
[11] | P. Dimitriou and R. Javaid, A review of ammonia as a compression ignition engine fuel, International Journal of Hydrogen Energy 45: ((2020) ), 7098–7118. doi:10.1016/j.ijhydene.2019.12.209. |
[12] | O. Dinu and A.M. Ilie, Maritime vessel obsolescence, life cycle cost and design service life. OP Conference Series: Materials Science and Engineering 95: ((2015) ), 012067. doi:10.1088/1757-899X/95/1/012067. |
[13] | DNV GL, Maritime forecast to 2050: Energy transition outlook 2018, 2018. |
[14] | DNV GL, Assessment of selected alternative fuels and technologies, 2018. |
[15] | R.T. Doucette and M.D. McCulloch, A comparison of high-speed flywheels, batteries, and ultracapacitors on the bases of cost and fuel economy as the energy storage system in a fuel cell based hybrid electric vehicle, Journal of Power Sources 196: ((2011) ), 1163–1170. doi:10.1016/j.jpowsour.2010.08.100. |
[16] | J. Ellis and K. Tanneberger, Study on the use of ethyl and methyl alcohol as alternatives for shipping, European Maritime Safety Agency, 2015. |
[17] | M. Faisal, M.A. Hannan, P.J. Ker, A. Hussain, M.B. Mansor and F. Blaabjerg, Review of energy storage system technologies in microgrid applications: Issues and challenges, IEEE Access 6: ((2018) ), 35143–35164. doi:10.1109/ACCESS.2018.2841407. |
[18] | FCH Europe, Major FCH JU funded project will install the world’s first ammonia-powered fuel cell on a vessel, https://www.fch.europa.eu/news/major-fch-ju-funded-project-will-install-world%E2%80%99s-first-ammonia-powered-fuel-cell-vessel. |
[19] | I. Georgescu, D. Stapersma, L.M. Nerheim and B.T.W. Mestemaker, Characterisation of large gas and dual-fuel engines, MTZ industrial 6: ((2016) ), 64–71. doi:10.1007/s40353-016-0029-z. |
[20] | J.L.S. Gerritsen, The hybrid cutter dredger, Delft University of Technology, 2016. |
[21] | Global Carbon Project, Global Carbon Budget 2016, http://globalcarbonbudget2016.org/, 2016. |
[22] | M. Godjevac, B.T.W. Mestemaker, K. Visser, Z. Lyu, E.J. Boonen, F. van der Veen and C. Malikouti, Electrical energy storage for dynamic positiong operations: Investigation of three application case, in: 2017 IEEE Electric Ship Technologies Symposium (ESTS), (2017) , pp. 182–186. doi:10.1109/ESTS.2017.8069278. |
[23] | J.B. Guinée, M. Gorrée, R. Heijungs, G. Huppes, R. Kleijn, A. de Koning, L. van Oers, A.W. Sleeswijk, S. Suh, H.A.U. de Haes, H. de Bruijn, R. van Duin and M.A.J. Huijbregts, Part III: Scientific background, in: Handbook on Life Cycle Assessment. Operational Guide to the ISO Standards, Kluwer Academic Publishers, Dordrecht, (2002) . ISBN 1402002289. |
[24] | J. Hansson, S. Månsson, S. Brynolf and M. Grahn, Alternative marine fuels: Prospects based on multi-criteria decision analysis involving Swedish stakeholders, Biomass and Bioenergy 126: ((2019) ), 159–173. doi:10.1016/j.biombioe.2019.05.008. |
[25] | J.B. Heywood, Internal Combustion Engine Fundamentals, (1988) . ISBN 0071004998. |
[26] | International Energy Agency (IEA), World Energy Outlook 2018, 2018. |
[27] | International Maritime Organization (IMO), Amendments to the annex of the protocol of 1997 to amend the international convention for the prevention of pollution from ships, 1973, as modified by the protocol of 1978 relating thereto: Inclusion of regulations on energy efficiency for ships in MARPOL Annex VI, Resolution MEPC.203(62), 2011. |
[28] | International Maritime Organization (IMO), Initial IMO strategy on reduction of GHG emissions from ships, Resolution MEPC.304(72), 2018. |
[29] | International Chamber of Shipping (ICS), Delivering CO2 emission reductions: International shipping is part of the solution, 2015. |
[30] | S. Jafarzadeh, I. Schjølberg, K. Visser, L. van Biert, R. d’Amore-Domenech, A. Villalba-Herreros and T.J. Leo, Fuel cell solutions for maritime applications: Possibilities and challenges, in: World Hydrogen Energy Conference 2018, (2018) . |
[31] | R. Kerr, H.R. García, M. Rastedt, P. Wagner, S.M. Alfaro, M.T. Romero, C. Terkelsen, T. Steenberg and H.A. Hjuler, Lifetime and degradation of high temperature PEM membrane electrode assemblies, International Journal of Hydrogen Energy 40: ((2015) ), 16860–16866. doi:10.1016/j.ijhydene.2015.07.152. |
[32] | H. Kobayashi, A. Hayakawa, K.D.K.A. Somarathne and E.C. Okafor, Science and technology of ammonia combustion, Proceedings of the Combustion Institute 37: ((2019) ), 109–133. doi:10.1016/j.proci.2018.09.029. |
[33] | C. Kramers, N. van Rooij, V. Seijger, T. Spee, J. Coenen, R. Hermanns, D. Stapersma and studententeam SOLID, IJzer als brandstof voor schepen, 2019. |
[34] | E. Kroch, Ammonia – A fuel for motorbuses, Journal of the Institute of Petroleum 31: ((1945) ), 213–223. |
[35] | M.A. Laguna-Bercero, Recent advances in high temperature electrolysis using solid oxide fuel cells: A review, Journal of Power Sources 203: ((2012) ), 4–16. doi:10.1016/j.jpowsour.2011.12.019. |
[36] | J. Larminie and A. Dicks, Fuel Cell Systems Explained, 2nd edn, SAE International. (2003) . ISBN 978-0768012590. |
[37] | D. Lee, H.H. Song, H. Min and H. Park, Development of new combustion strategy for internal combustion engine fueled by pure ammonia, in: 2017 AIChE Annual Meeting, AIChE, (2017) . |
[38] | Lloyd’s Register and University Maritime Advisory Services (UMAS), Zero emission vessels 2030. How do we get there?, (2017) . |
[39] | J.C. Mankins, National Aeronautics and Space Administration (NASA), Technology readiness levels, 2004. |
[40] | B.T.W. Mestemaker, M.B.G. Castro, H.N. van den Heuvel and K. Visser, Dynamic simulation of a vessel drive system with dual fuel engines and energy storage, Energy 194: ((2020) ), 116792. doi:10.1016/j.energy.2019.116792. |
[41] | B.T.W. Mestemaker, M.B.G. Castro, E.C. van der Blom, H.J. Cornege and K. Visser, Zero emission vessels from a shipbuilders perspective, in: 2nd International Conference on Smart & Green Technology for the Future of Marine Industries (SMATECH 2019) – Conference Proceedings, 11–12 July 2019, pp. 52–61. ISBN 9781999614461. |
[42] | B.T.W. Mestemakera, M.B.G. Castro, H.N. van den Heuvel and K. Visser, Evaluation of the dynamic behaviour of a dredging vessel with dual fuel engines using a simulation model, in: Proceedings of the 2nd International Conference on Modelling and Optimisation of Ship Energy Systems (MOSES2019), 8–10 May 2019, pp. 101–110. ISBN 9781909522510. |
[43] | K. Moirangthem and D. Baxter, Alternative fuels for marine and inland waterways, Joint Research Centre technical reports, European Union, 2016. |
[44] | R. Nagel, Results from the JOULES project, 2017. |
[45] | A. Nakajo, Z. Wuillemin, J. Van herle and D. Favrat, Simulation of thermal stresses in anode-supported solid oxide fuel cell stacks. Part I: Probability of failure of the cells, Journal of Power Sources 193: ((2009) ), 203–215. doi:10.1016/j.jpowsour.2008.12.050. |
[46] | R.K. Pachauri and L.A. Meyer, Climate Change 2014: Synthesis Report. Contribution of Working Groups I, II and III to the Fifth Assessment Report of the Intergovernmental Panel on Climate Change, Intergovernmental Panel on Climate Change (IPCC), Geneva, Switzerland, (2014) . ISBN 9789291691432. |
[47] | P. Pei and H. Chen, Main factors affecting the lifetime of Proton Exchange Membrane fuel cells in vehicle applications: A review, Applied Energy 125: ((2014) ), 60–75. doi:10.1016/j.apenergy.2014.03.048. |
[48] | J.A. Ryste, M. Wold, J. Frimann-Dahl, C. Chryssakis, M.S. Eide, O. Endresen and H. Hustad, DNV GL, Comparison of alternative marine fuels, Report 2019-0567 Rev. 3, 2019. |
[49] | W. Shi, B.T.W. Mestemaker, L.J.A. den Boer, C. Contessi and A. Zotti, Application of LNG DF engines in dredging vessels, in: CEDA Dredging Days 2015 – Proceedings, 5–6 November 2015. |
[50] | D.V. Singh and E. Pedersen, A review of waste heat recovery technologies for maritime application, Energy Conversion and Management 111: ((2016) ), 315–328. doi:10.1016/j.enconman.2015.12.073. |
[51] | C. Thiem, R. Nagel, J. Ellis and S. Hänninen, JOULES technical report D21.1. Cost models and LCA, 2017. |
[52] | T. Tronstad, H.H. Åstrand, G.P. Haugom and L. Langfeldt, European Maritime Safety Agency (EMSA), Study on the use of fuel cells in shipping, 2017. |
[53] | United Nations Framework Convention on Climate Change (UNFCCC), What is the Paris Agreement?, https://unfccc.int/process-and-meetings/the-paris-agreement/what-is-the-paris-agreement, 2015. |
[54] | L. van Biert, Delft University of Technology, Solid Oxide Fuel Cells for Ships – System Integration Concepts with Reforming and Thermal Cycles, (2020) . ISBN 978-94-6366-248-2. doi:10.4233/uuid:dd1f7899-38ee-4c78-a5b0-a6fa92c90f56., |
[55] | L. van Biert, M. Godjevac, K. Visser and P.V. Aravind, A review of fuel cell systems for maritime applications, Journal of Power Sources 327: ((2016) ), 345–364. doi:10.1016/j.jpowsour.2016.07.007. |
[56] | F.M. van Nievelt, Delft University of Technology, Maritime application of sodium borohydride as an energy carrier, 2019. |
[57] | S. Wurst, JOULES technical report R22-1. Guidelines for LCPA software tool, 2013. |
[58] | S. Wurst, R. Nagel, S. Vatanen, A. Liebich and J. Ellis, D 22.1 – LCPA-Tool incl. LCPA and LCA description, JOULES Deliverable 22.1, 2014. |
[59] | S. Zhu, K. Zhang and K. Deng, A review of waste heat recovery from the marine engine with highly efficient bottoming power cycles, Renewable and Sustainable Energy Reviews 120: ((2020) ), 109611. doi:10.1016/j.rser.2019.109611. |

