
Zero carbon propulsion in shipping – scenarios for the development of hydrogen and wind technologies with the MATISSE-SHIP model
Abstract
This paper introduces the MATISSE-SHIP model for illustrative long term scenarios of technical change in shipping. It applies current theory for sustainable innovation – ‘transition theory’ – and uses an agent-based modelling (ABM) approach that explicitly represents a range of decision makers with different decision criteria. It models investment decisions for new ships, concentrating on the choice of power train and generates time paths of shares of a range of propulsion technologies. Two scenarios were generated to illustrate pathways under which hydrogen achieves a major market in shipping by 2050: 1) If current SOx/NOx legislation does not lead to the large scale adoption of LNG and there is an expectation of strengthened climate change policy in the medium term, wind/H2 combined power systems take off, as they can demonstrate cost savings with GHG emissions reductions. The need for high power applications may lead to the uptake of biofuels as they can provide significant reductions in GHG emissions, while not requiring new bunker infrastructure or changes in operating patterns. 2) If, in addition to these developments, there is acceptance of changes in operations towards lower speeds in container shipping and biofuels remain limited in their adoption (e.g. due to limited supply and high fuel costs), combined wind/H2 propulsion systems could be the main alternative to 2050. High power installations are then covered by fossil fuels to 2050, with Power to Gas/Liquid technologies being developed in the longer term.
1.Introduction
Shipping appears to be moving into a period of rapid technological change [26]. This is partly being driven by environmental legislation. The immediate requirement is the reduction of the emission of SOx, NOx and soot from ships through the emissions control zones, the IMO NECAs and SECAs. This is extended by the IMO global sulphur limit of 0.5% sulphur content in fuel for all ships, implemented from 1st Jan 2020 [10,11]. This means that most ships will have to change their propulsion systems in some way. Current alternatives being adopted are exhaust treatment systems or low sulphur fuels. Low sulphur fuels commercially available as bunkers include low sulphur HFO, MGO/MDO and LNG [7,16]. Further alternatives for which multi-fuel engines are already available are being developed including methanol and ammonia [8,22], while other Low Flashpoint Liquid (LfL) fuels such as dimethyl ether or ethanol, used in products carriers are also being considered.
However, a further environmental issue – greenhouse gas (GHG) – emissions may drive further changes. Anderson et al. [2] argue that pressure to meet climate change mitigation targets will require reductions of 80% or more in GHG emissions from ships. Large reductions in GHGs will require the adoption of non-fossil fuels. These include carbon-neutral biofuels, synthetic fuels produced using renewable energy (so-called PtG/PtL fuels), H2 (possibly using ammonia) fuel cells and batteries using renewable electricity and direct use of wind, all of which are in development and demonstration [7,27,29].
This long list of alternatives, with different requirements for production and bunkering infrastructures, drive trains and bunker/fuels systems presents a highly uncertain situation for shipowners and charterers (which we simplify to call shipowners in the model), who have to consider these possibilities for their different trades. At the same time, there are very few studies of the longer term possibilities for shipping. There are a few scenario studies [1,2,7,27,29]. The IMO 3rd GHG study [1] was an extensive scenario assessment of GHG emissions in shipping. This compared AIS data with bunker reports and used global fleet projections to estimate an increase of 50% to 250% in GHG emissions from shipping from 2012 to 2050 for a business as usual case. The Rehmatulla et al. analyses [27] and Smith et al. [29] use a comprehensive techno-economic model (GLOTRAM) that applies established economic theories of innovation also used in energy system analysis.
However, these modelling exercises use simulation models that only consider capital and operating costs required to meet emissions targets. They do not take into account the other barriers to adopting new technologies. An important consideration is the uncertainty of supply of alternative bunker fuels. While a supply infrastructure for LNG is beginning to be developed, this is still very limited and other alternatives are still at the early demonstration stage [16,25]. Alternative fuels apart from LNG are more expensive in terms of their energy content that HFO/MDO. Biofuels are also more expensive [5,16]. The alternative technologies and fuels all involve increased capital expenditure compared to current diesel motor systems. The only technologies to offer cost savings are the wind assistance/propulsion technologies, as they reduce the fuel requirement. A further barrier is that the performance of new fuels and technologies is uncertain, such that most shipowners are not yet prepared to take the risk of investing [16,19,25]. A further important barrier for wind propulsion is the limitation on power available, such that ships would have to sail much more slowly and would require new operational patterns [25]. Regulatory requirements may also have to be updated [19]. These other barriers have contributed to the very slow uptake of alternatives to meet the NECAs and SECAs [16] and hesitant progress towards sail and H2, both of which are at the demonstration stage [16,25].
Therefore, the MATISSE-SHIP model has been developed to generate illustrative long term scenarios of technical change in shipping. This paper discusses scenarios in which low carbon shipping replaces the present diesel powered fleet. The structure and parameterisation of the model is explained and then two scenarios of alternative pathways to low carbon shipping are examined, with a discussion of the conditions for such scenarios, given the assumptions and the parameterisation of the model. The implications of the scenarios for investment strategies for new shipping are discussed.
2.Theory and structure of the MATISSE-SHIP model: Transitions to sustainability
The MATISSE model was developed as a simulation model of the non-linear processes of changes in ‘socio-technical systems’. It applies current theory for sustainable innovation – ‘transition theory’ [9] – and uses an agent-based modelling (ABM) approach that explicitly represents a range of decision makers with different decision criteria. This is argued to be an appropriate approach for the simulation modelling of scenarios applying transitions theory concepts [15]. The argument is that new technologies arise through scientific and engineering innovation to improve performance or to address a new requirement in society. Such new technologies face resistance from the established technologies and institutions (the ‘regime’) and therefore often appear as ‘niches’. Niches are networks of users and developers where particular characteristics of the new technology make users willing to switch to the new technology, even though it is not as reliable or has lower performance in some respects compared to the established technology [9].
The MATISSE-SHIP version models investment decisions for new ships, concentrating on the choice of power train and generates time paths of shares of a range of propulsion technologies [12]. The structure of the model is shown in Fig. 1.
Fig. 1.
Structure of the MATISSE-SHIP model.
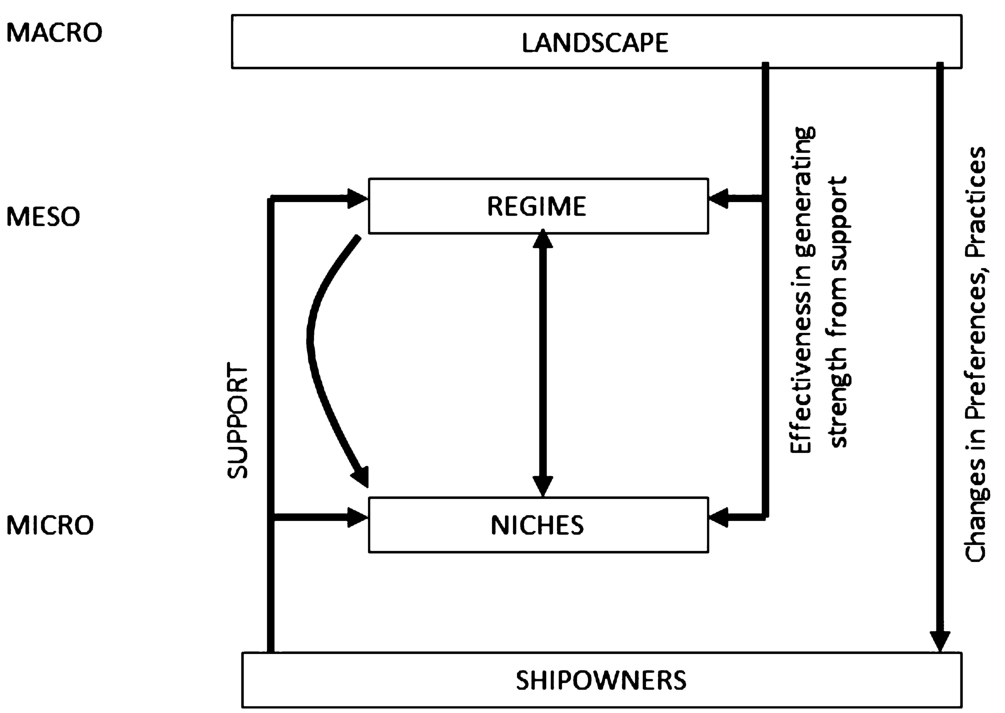
The ‘landscape’ in Fig. 1 represents the general influences that impact on the regime, niches and requirements of the shipowners such as environmental policy, cost of bunker fuel or the willingness to adopt slow steaming. These are assumptions in the model run. The shipowners then change their requirements through the simulation e.g. towards a requirement for lower emissions due to environmental policy. The regime develops the technology in response to the changing demand from shipowners for their technology. The niches also develop their technology in response to the requirements of shipowners, but also to improve environmental performance as a response to landscape changes and (anticipated) environmental legislation. This structure has been adopted from the original MATISSE model [3,13,18] and the decision making structure is explained in the Appendix.
The model simulates the relative shares of the technology regime and alternative technology niches. In each period (year), some shipowners order new ships and choose a propulsion technology; either remaining with their previous choice or changing. The decisions of the shipowners are based on their requirements and views of the characteristics, called practices, of the technologies. They choose the technology that is closest to their desired practices, as described in the Appendix.
The model represents not only the cost and environmental drivers, but also the attitudes of shipowners towards new technologies, the need for new bunker infrastructures and slow speed operation. The MATISSE-SHIP model is calibrated to represent the global shipping fleet at 2015 and in particular the range of propulsion technologies used and in development for different markets in commercial shipping.
The regime technology is considered to be propulsion by diesel motors. The alternatives considered for niches are:
Liquid Natural Gas including dual and triple fuel engines (LNGDF);
Low flashpoint Liquid fuels e.g. Methanol, ethanol, ammonia, dimethyl ether (LfL);
Hydrogen (H2);
Wind with renewable auxiliary power from H2 fuel cells (WindH2);
Wind assistance (Wind assist);
Biofuels;
Synthetic fuels from renewables (so-called power-to-gas/liquid PtG/PtL).
There are some technologies that have not been included. Atomic power is not simulated, because there is no indication that commercial use will increase beyond the few Russian nuclear powered icebreakers in the foreseeable future [8]. Battery propulsion is not included because it is currently not a feasible option for larger ships and the energy storage density of batteries is not improving quickly enough to compete with fuel cells for main propulsion for commercial shipping for the foreseeable future [20].
Table 1
Initial practices of technologies
| GHG Emission CO2Equiv/MWh | Fuel Cost $/Tonne HFO energy equivalent | Opspeed Av. Kts | NOx SOx/MWh emissions2% of diesel | CAPEX $/MW | Operational and technology change | Bunkers – Compatible with current HFO/MGO | |
| Diesel HFO+ MGO | 90 [10, 100] (0) | 40 [0, 100] (0.5) | 50 = 25 kts 10000 TEU 15 kts Bulker [0, 100] (0) | 100 [0, 100] (0) | 40 [30, 60] (0) | 100 [50, 100] (0) | 100 [90, 100] (0) |
| LNG (including dual fuel) | 80 [70, 100] (0) | 38 slightly lower than ISO 380 [0, 100] (0.5) | 50 as diesel [0, 100] (0) | 10 (pure) LNG has no SO2 and reduced NOx [0, 100] (0) | 80 mature tech, LNG tanks very expensive [40, 60] (0) | 903[0, 50] (0) | 50 mature but new cryo-bunker infrastructure [60, 80] (0) |
| Low Flashpoint Fuels e.g. methanol (including dual/triple fuel) | 80 [70, 100] (0) LNG feedstock | 38 slightly lower than ISO 380 [0, 100] (0.5) | 50 as diesel [0, 100] (0) | 10 Methanol has no SO2 and reduced NOx [0, 100] (0) | 50 Mainly single-use zones [30, 50] (−0.5) | 904[0, 50] (0) | 90 mod HFO bunker infra-structure5[90, 100] (+0.1) |
| Hydrogen (Stored as H2 on board) | 50 renewables stored on board [5, 100] (0) | 80 [0, 100] (0) | 50 lower energy density than Diesel HFO [0, 100] (0) | 10 renewables [5, 100] (0) | 100 higher than LNG [0, 100] (0.1) | 100 [20, 100] (0) | 50 industry infrastructure mature6[50, 90] (+0.1) |
| Wind | 5 [1, 10] (0) | 10 (for emergency/aux) [5, 40] (0) | 10 =5 kts [5, 20] (0.1) | 10 (Aux/ emergency) [5, 10] (0) | 30 Mainly single-use zones [5, 50] (−0.5) | 10 very slow and variable [5, 10] (0) | 100 aux only [0, 100] (0) |
| Wind Assistance 10% energy saving of HFO | 80 (90%) of ICE [50] (−0.5) | 35 (half local, half long distance) [0, 90] (−0.5) | 45 optimally a bit slower [0, 50] (0) | 90 [40, 100] (−0.5) | 45 extra installation, smaller diesel [30, 50] (−0.5) | 90 in demonstration [5, 100] (0) | 100 [50, 100] (0) |
Table 1
(Continued)
| GHG Emission CO2Equiv/MWh | Fuel Cost $/Tonne HFO energy equivalent | Opspeed Av. Kts | NOx SOx/MWh emissions2% of diesel | CAPEX $/MW | Operational and technology change | Bunkers – Compatible with current HFO/MGO | |
| Biofuel | 70 [0, 100] (−1.0) | 80 [50, 100] (0) | 50 as diesel [0, 100] (0) | 10 [5, 100] (0) | 40 drop-in [30, 60] (0) | 100 [50, 100] (0) | 80 drop-in, limited supply chain [90, 100] (0) |
| PtG/PtL Power to Liquid/Gas l renewables | 30 [5, 50] (−0.1) | 807[50, 100] (0) | 50 as diesel [0, 100] (0) | 10 [5, 100] (0) | 40 drop-in [30, 60] (0) | 100 [50, 100] (0) | 80 drop-in, limited supply chain [90, 100] (0) |
[
3 [26] as source; special procedures required for bunkering.
4 Methanol is poisonous, requires extra safety measures vs. HFO [6].
5 Liquid, requires minor modifications to HFO bunkering and storage [6].
6 Hydrogen requires a different infrastructure to HFO/MGO [6].
7 Biofuels and PtL fuels have similar costs (in 2018), of the order of 2–4* MGO (Workshop input from Project workshop: Bioökonomie als gesellschaftlicher Wandel, Modul 2 [26]: Reflexive Governance und dynamische Innovationssysteme am Beispiel der energetischen und stofflichen Nutzung biogener Rohstoffe (FKZ 031B0237)) Fraunhofer ISI 2019.
The choice dimensions included in the MATISSE-SHIP model are intended to allow for a wider range of decision variables than is used in other ‘techno-economic’ models of technological development. In addition to costs and emissions, infrastructures for new fuels are an important concern for shipowners and shipowners were often cautious about adopting wind technologies that required changes to operational patterns [9,16,25]. A common concern was the reliability of arrival times and the increased passage times for ships powered primarily by wind. Finally, slow steaming has an increasing influence on operations of many ships [28]. Required operational speed is an important factor, not just for wind, but for other power systems with lower energy storage densities than conventional liquid fuels, as well as saving operating costs of conventional ships in periods of low demand. As discussed in the introduction, environmental legislation such as emissions taxes and standards are also important factors in technology development and uptake. Following these sources and discussion, the practice dimensions are:
GHG intensity – CO2 emissions/MWh;
fuel cost Euro/tonne;
operational speed (adoption of slow steaming);
local air emissions /MWh (NOx, SOx, particles);
capital cost/MW;
perceived technological and operational change (reduced operational speed and weather optimised routing, including extended transit times compared to diesel propulsion at current operational speeds;
requirement for new bunker infrastructure.
The shipping companies take decisions based on their requirements for these practice dimensions, e.g. Expectations of environmental legislation for emissions reduction will result in shipowners placing a greater weight on the GHG intensity and/or local air emissions. The shipowners are parameterised in groups representing the following market segments: Cruise and ferry, LNG cruise and ferry, bulker/tanker, wind assisted bulker/tanker, service vessels (PSV/tugs/fishing vessels), LNG service vessels. Each of these groups have a distribution of required practices, with a stochastic distribution of the supporters in a group around a central value for the group. These groups are differentiated by their performance requirements and hence their positions in the practice dimensions. The structure of the decision modelling is outlined in the appendix.
3.Parameterisation of the model
The model is calibrated for the initial characteristics – practices – of the technologies as shown in Table 1. This shows, for the regime and niche technologies, their initial position in the practice dimensions. The niches and regime technologies can develop their technologies, but with constraints. For example, niches that have the goal of reducing their emissions cannot increase their emissions. These constraints are shown as the values in square brackets in Table 1 and Table 2. The rate at with which technologies are initially developed are shown in curved brackets. The emissions performance of most technologies is assumed to be initially constant. In 2015, systems for SOx exhaust treatment or the adoption of low Sulphur fuels were still in development, but this changed by 2020. LNG, LfL fuels and wind have emissions characteristics determined by their chemical and physical properties and therefore have a zero rate of change intitially. Biofuels and PtG/PtL fuels were in a slow process of development. However, the model includes the possibility for technologies to develop to change their characteristics, so that the initial level and zero rates of change do not prevent technological developments as has been seen in the case of the response to the NECAs, SECAs and the IMO global Sulphur limit on fuels.
Table 2
Initial practices of shipping companies here
| GHG Emission CO2Equiv/MWh | Fuel Cost $/Tonne HFO/MGO | Opspeed Av. Kts | NOx SOx emissions/MWh % of diesel | CAPEX $/MW | Operational and technology change | Bunkers – Compatible with current HFO/MGO | |
| Mainstream: as diesel initially | |||||||
| Cruise, ferry, RoPax | 90 [10, 100] | 40 [0, 100] (0.5) | 50 = 25 kts [0, 100] | 100 [0, 100] | 40 [30, 60] (0) | 100 [50, 100] | 100 [90, 100] (0) |
| solid and liquid bulk including chemicals and Gas carriers | 90 [10, 100] | 40 [0, 100] (0.5) | 50 = 15 kts [0, 100] | 100 [0, 100] | 40 [30, 60] (0) | 100 [50, 100] | 100 [90, 100] (0) |
| Container, RoRo | 90 [10, 100] | 40 [0, 100] (0.5) | 50 = 25 kts 10000 TEU [0, 100] (0) | 100 [0, 100] (0) | 40 [30, 60] (0) | 100 [50, 100] | 100 [90, 100] (0) |
| Platform Support Vessels and Offshore vessels; tugs dredgers etc;, specialist vessels | 90 [10, 100] | 40 [0, 100] (0.5) | 50 [0, 100] | 100 [0, 100] | 40 [30, 60] (0) | 100 [50, 100] | 100 [90, 100] (0) |
| Niches | |||||||
| Cruise LNG | 90 [10, 100] | 45 [0, 100] (0.5) | 50 [0, 100] (0) | 10 [0, 100] (0) | 40 [30, 60] (0) | 90 [50, 100] | 60[50, 100] (0) |
| Ferry LNG | 90 [10, 100] | 45 [0, 100] (0.5) | 50 [0, 100] | 10 [0, 100] | 40 [30, 60] (0) | 90 [50, 100] | 60 [50, 100] (0) |
| PSV_Service LNG | 90 [10, 100] | 45 [0, 100] (0.5) | 50 [0, 100] | 10 [0, 100] | 40 [30, 60](0) | 90 [50, 100] | 60 [90, 100] (0) |
| Wind assist bulkers | 80 [10, 100] | 35 [0, 100] (0.5) | 50 [0, 100] | 100 [0, 100] | 45 [30, 60] (0) | 90 [50, 100] | 100 [90, 100] (0) |
[
The model is calibrated to recent data for the different technologies ([1,16,17,25], stakeholder interviews11), for capital and operational costs, CO2 and NOx/SOx emissions. Bunkering requirements are parameterised as the requirement for new bunkering infrastructure compared to HFO/MGO. For example, LNG powered ships require a new bunkering infrastructure compared to HFO/MDO and therefore have a lower value of the bunkering dimension. The potential for new operating patterns including slow steaming is estimated from typical designs. Wind powered vessels have a much lower operating speed than diesel powered container ships, so the operating speed for the niche is much lower than diesel. LfL fuels are still a new technology for ships other than products carriers, so they have a much lower value of the new technology dimension compared to the regime of diesel motors. The actual values of these variables are inferred from the literature and checked with experts through interviews and workshops [16,25].
LNG and LfL CAPEX are assumed to be higher than diesel, while fuel cost of LfL and LNG are assumed to be similar to the conventional fuels. H2 systems have a high CAPEX and fuel costs, as they involve complex cryogenic systems and fuel production systems [7,20]. Wind assistance technologies have a low CAPEX and deliver small reductions in fuels costs, while wind as a main propulsion system is assumed to have a similar CAPEX to conventional systems [19,25]. This variable is highly uncertain, because full scale wind systems as the propulsion power have not yet been demonstrated for larger commercial vessels. PtG/PtL and biofuels are assumed to have a much higher initial fuel cost than conventional fuels, because they require a new supply chain with an associated high investment to meet large-scale market demand. Their CAPEX is however, the same as conventional motors, because both are ‘drop-in’ fuels, which can be produced to have almost the same characteristics as conventional fossil fuels [5,7].
The limits (in square brackets in Table 1) on the technologies have been assessed from the technological characteristics of the fuels and the potential for emissions removal equipment. In principle, ‘end-of-pipe’ emissions removal equipment can be developed for all technologies and greenhouse gas emissions can be reduced by the development of carbon capture and sequestration technology. For biofuels and PtG/PtL fuels, the emissions depend on the power sources. These considerations mean that the technological limits to emissions cover a wide range. Infrastructure characteristics are based on a comparison to current bunker supply chains and systems. LNG and LfL fuels, as well as H2 require new infrastructures. PtG/PtL fuels and biofuels can use the same bunker systems as fossil fuels. Wind does not require a fuel infrastructure.
Operational constraints are only significant for the wind technologies, as all the other technologies can be designed to meet similar power requirements to current diesel systems (but with possibly more regular refuelling). Wind systems therefore have a much lower value for operational speed than conventional ships.
The calibration of the shipowners for the different market segments are shown in Table 2. The values are calibrated relative to current ships with HFO/MDO/MGO. This initial calibration assumes that most shipowners start by requiring similar cost, emissions and operational performance to current ships. The impact of local air emissions legislation is reflected in the LNG niche, which in 2015 was already a response to local air emissions regulations.
The shipowners may change their requirements over time e.g. in response to new market conditions such as higher profitability enabling a more positive attitude to new technologies or new environmental legislation. These are the ‘landscape’ changes discussed in Section 2 above. They may also have limits to the range of their practices e.g. if the regime shipowners are operating on very small profit margins, they will not be willing to accept increased costs. Alternatively cruise operators who are enjoying a growing market might be subject to customer pressure to improve environmental performance, making them place a higher priority on improved environmental performance than keeping costs to a minimum. The development of the technologies responds to the choice of the shipowners and these dynamics generate the pathways of technology uptake in the model. Constraints on how the shipowners can change their requirements are in square brackets, the initial rate at which shipowners are initially changing their requirement is shown in the curved brackets.
4.Scenario assumptions and results
Scenarios are generated by varying the changes over time of the requirements of the shipowners in the different market segments. These changes are considered as responses to the landscape changes. For the two scenarios illustrated here, the landscape changes are the implementation of further environmental policy, the main current (2019–2020) factor forcing change on the industry [7,16].
Two scenarios were generated to illustrate pathways under which hydrogen achieves a major position in shipping by 2050. Both scenarios assume a slowly increasing importance of CO2 emissions for shipowners and a requirement that costs do not increase. They are differentiated by attitudes to NOx/SOx emissions and changing attitudes of shipowners to very low speed operation. The results are shown in Figs 2 and 3. The graphs show the share of the different technologies (summed over all the market segments) through time, from 2015 through to 2050.
Fig. 2.
A mixed transition to wind with H2 in tankers, bulkers and container ships with biofuels for cruise ships and some service vessels.
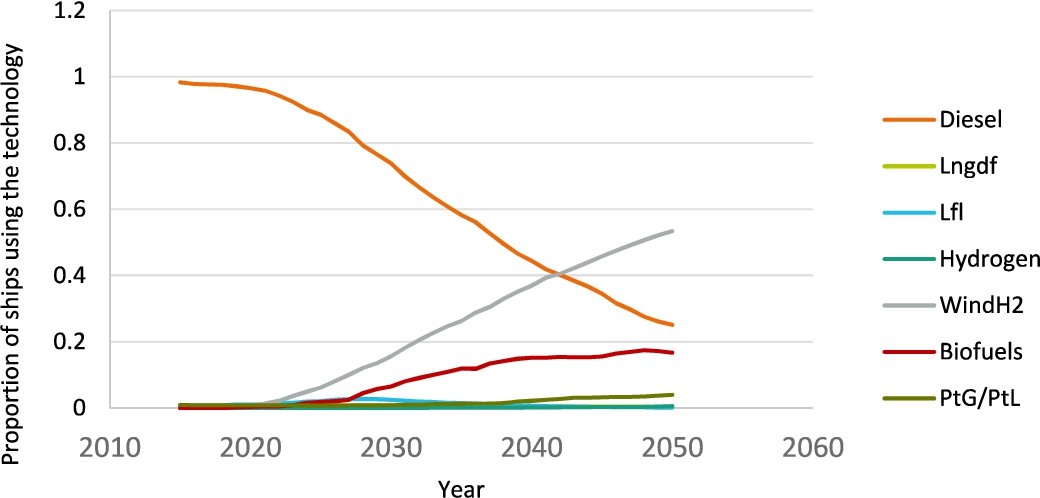
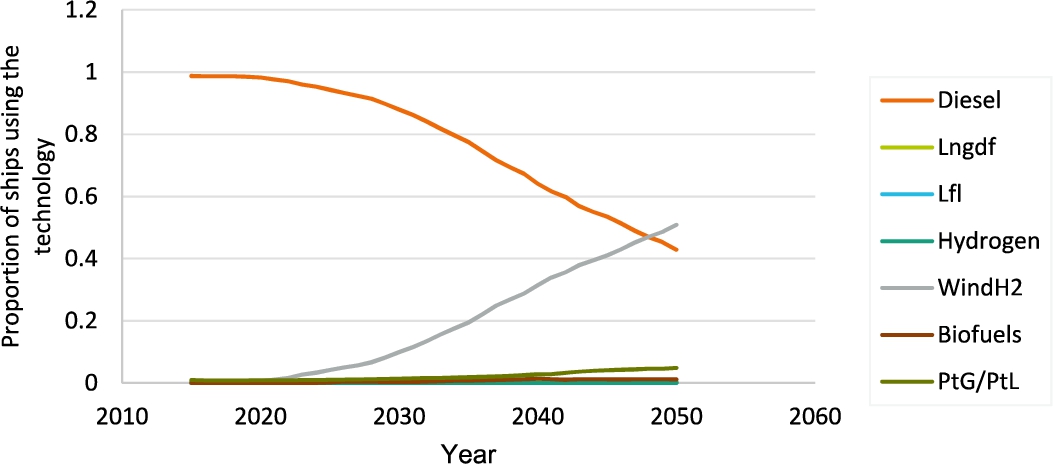
Fig. 3.
A transition to wind/H2.
In Fig. 2, freight transport shipping delays the adoption of new technologies to respond to the NECAs, SECAs and the IMO Sulphur limit. Although some cruise ship operators adopt LNG Dual Fuel (LNGDF) propulsion systems, the market for this technology does not expand and remains small. Some operators adopt other LfL fuels, as these offer lower capital costs. However, by 2030 binding and effective regulation is enforced to require major CO2 emissions from ships. This has two effects on technology development. From around 2025, shipowners require major reductions in CO2 emissions from newbuildings. The main alternatives are biofuels, PtG/PtL and wind. Wind systems are also required to have auxiliary propulsion for safety reasons in storms and for manoeuvring in harbours and restricted waters. However, in 2025 there is still no developed infrastructure for the low carbon alternatives – biofuels and PtG/PtL. Therefore, wind systems are combined with power intake systems to generate relatively small amounts of H2. Shipowners then realise the cost savings that can be realised by large scale adoption of the wind/H2 combination and this leads to accelerating adoption. This combines with a limited market for H2 fuel cell ferries and service vessels to encourage the market for H2 auxiliary power systems, such that the wind/H2 combination takes off, reducing the costs of the auxiliary H2 systems through learning effects.
At the same time, LfL remains expensive while biofuels are developed for the segments with high power requirements, in particular cruise and ferry. This is partly because biofuels are also adopted by aviation, leading to an expansion of the supply infrastructure and decreasing costs. However, the supply of biofuels is limited because of the increasing demand for aviation and limited supply due use land use issues such that biofuel systems, although cheaper to install and operate than PtG/PtL fuels, remain more expensive than the wind/H2 combination. This has a major impact on container shipping, which accepts much lower operating speeds for most goods. The development of more complex, internet-based B2B markets for logistics enables the high value goods to be shipped by a combination of higher speed, but smaller container ships and aircraft. Therefore, the share of biofuels remains relatively small and the combination of wind and H2 develops a new regulatory and market regime in shipping.
Figure 3 shows an alternative scenario in which biofuels do not play a significant role. Effective legislation for GHG mitigation in shipping is slower to be adopted, but there is an increasing acceptance of new operating patterns including slower speeds to reduce fuel and energy requirements and continuous real-time route optimisation. The supply of biofuels remains limited by rapidly increasing demand for biofuels from aviation, combined with continuing difficulties in expanding the global supply chain for carbon neutral biofuels. The price of biofuels remains high compared to other bunkers for the shipping industry. This combination of effects prevents the growth of LNGDF and forces the development of wind and H2 technologies even more strongly than in Fig. 2. LNG remains a very small niche, stabilising at around 200 vessels in the global fleet for some large cruise ships and some ferries. Operating speeds are reduced for other ferries, while H2 technologies develop to enable most ferries to run on H2 fuel cells for up to 12 hours. The limited high speed markets for passengers and very high value goods remain with aviation.
In both scenarios, the development of H2 technologies also supports the development of PtG/PtL technologies in the long run. By 2050, PtG/PtL is a significant niche in both scenarios with a share of around 4–5% of the global fleet.
5.Discussion and conclusions
The purpose of the MATISSE-SHIP model is to illustrate potential longer term pathways of technology change in shipping. The shipping industry is facing a period of uncertainty, because environmental legislation is forcing changes in propulsion systems. The large number of options means that shipowners face a complex choice problem. Considerations of the availability of bunkers and the assessment of risks in adopting new, complicated technologies and new patterns of operation will also be a part of the choice decision.
This means that, to develop scenarios of uptake of the new technologies, the usual models from the scientific literature, which assume an average decision maker optimising over costs and revenues alone, have considerable limitations [14]. The MATISSE-SHIP model has been developed to expand the set of choice functions to include the ‘psychological’ choice variables and to allow for different owners to take different decisions, even within the same market segment. The structure of the model implements the current literature on sustainability transitions [9,15].
The model produces a wide range of results, even given the same starting conditions, because of the complex, non-linear interactions between the shipowners and the developments in the technologies available [9,13]. However, we argue that this is the situation that shipowners – and charterers, financial institutions and insurance – face in shipping. Recognising this, the results are illustrative and not predictive. The contribution of this model is that the consequences of different assessments of the future can be illustrated and the range of possibilities identified.
Two scenarios were generated to illustrate pathways under which hydrogen achieves a major position in shipping by 2050: 1) If current SOx/NOx legislation does not lead to the large scale adoption of LNG and there is an expectation of strengthened climate change policy in the medium term, wind/H2 combined power systems take off, as they can demonstrate cost savings with GHG emissions reductions. The need for high power applications may lead to the uptake of biofuels as they can provide significant reductions in GHG emissions, while not requiring new bunker infrastructure or changes in operating patterns. 2) If, in addition to these developments, there is acceptance of changes in operations towards lower speeds in container shipping and biofuels remain limited in their adoption (e.g. due to limited supply and high fuel costs), combined wind/H2 propulsion systems could be the main alternative to 2050. High power installations are then covered by fossil fuels to 2050, with PtG/PtL technologies being developed in the longer term.
The implications for investment in new ships are firstly, that if CO2 legislation is extended over the next 5–10 years, investment in LNG may end up as ‘sunk’ investment. The technology for production of synthetic fuels from renewables is at an early stage of development and is therefore relatively costly. In both scenarios, this gives the wind/H2 combined power train a significant cost advantage. In the longer term i.e. 20–30 years, ships may begin to adopt synthetic fuels. Until then, conventional diesel newbuildings could be designed for cost savings through much lower operating speeds and wind assistance where feasible and effective. Another route is for more extensive adoption of combined power trains using wind and hydrogen fuel cells. The current demonstrations such as [31] can be expected to reduce costs through learning of fuel cells, which combined with the fuel savings of wind systems can give combined wind/H2 power systems a cost advantage large enough to overcome the barriers to lower operational speeds and new operating methods.
The model has many limitations, because it concentrates on the technology choice decision. It does not consider the major problem of split incentives for energy reducing investments between shipowners, charterers and ship management companies. It also only has a very simplified representation of the different propulsion systems and their characteristics. The impact of different sizes of ships in different trades is approximated, but could be explicitly addressed through a model concentrating on a subset of the shipping markets. It does not explicitly consider retrofit decisions, which is to be investigated in further research. The model is being adapted to allow for Monte-Carlo type exploratory modelling [23,24], to allow a more structured exploration of the uncertainties in the input parameters, especially the attitudinal variables.
Finally, this analysis is intended to contribute towards the development of visions for sustainability for shipping. Such visions [4] can contribute to a common understanding in the maritime sector of what the future might hold for shipping and hence reduce the uncertainty in taking the decisions for large, long term investments in ships.
Notes
1 Interviews conducted in meetings for the EU INTERREG Dual Ports project and the International Wind Ships Association.
Appendices
Appendix
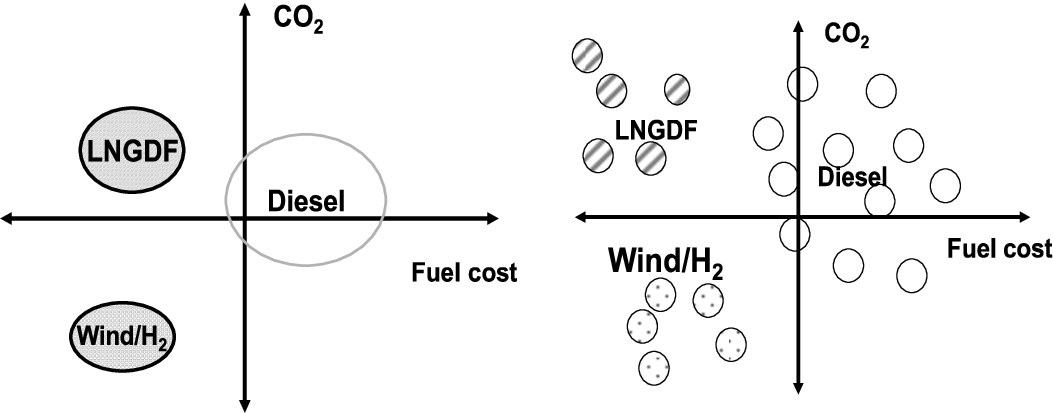
Adapted from [3]. Figure A1 schematically shows a two-dimensional practices space, which might be, for example, Px CO2 emissions and Py cost of bunker fuel. The technology agents (regime and niches) and the supporter agents (shipowners in the MATISSE-SHIP model) are shown separately for clarity, but actually occupy positions along the same Px and Py practices axes. Supporter agents are points in the space, while in the figure the size of the regime and niche ovals is proportional to their relative support. The model is stochastic in that the simple agents are initially assigned over the practice space, with grouped distributions (e.g. diesel ships, a smaller set of ‘green’ shipowners). There is also a random element in the initial distribution to allow for variation in agents’ behaviours. In the model the supporter agents choose to adopt the practices (propulsion technology characteristics in the current example) of the niche or regime agent that is closest to them. The distance from the supporter’s position to that of the niche or regime under consideration is calculated for all of the practice dimensions and these distances are summed as a vector to calculate an overall vector distance between the supporter and the niche or regime in the (multi-dimensional) practice space. The positions of the supporters in the practices space change depending on landscape signals, so the regime and niches have to move, not only to grow, but often just to maintain their support. The movement strategies, that is, the development strategies of the regime and niches, are explained in [3]. The regime develops such as to maximise its support over all supporters while the niches develop in a direction that increases their support locally, such that they adjust to a particular sub-set of supporters (e.g. bulker owners operating in the North Sea and Baltic SECA).
Fig. A1.
Two illustrations of a two-dimensional practices space, with practice axes
References
[1] | 3rd IMO study IMO, Third IMO GHG Study 2014. MEPC 67/INF.3. Hg. v. IMO, London, 2014. Available at http://www.imo.org/en/OurWork/Environment/PollutionPrevention/AirPollution/Pages/Greenhouse-Gas-Studies-2014.aspx. |
[2] | K. Anderson and A. Bows, Executing a scharnow turn. Reconciling shipping emissions with international commitments on climate change, Carbon Management, 3: (6) ((2014) ), 615–628. doi:10.4155/cmt.12.63. |
[3] | N. Bergman, A. Haxeltine, L. Whitmarsh, J. Köhler, M. Schilperoord and J. Rotmans, Modelling socio-technical transition patterns and pathways, Journal of Artificial Societies and Social Simulation 11: ((2008) ), 3–7. Available online at jasss.soc.surrey.ac.uk/11/3/7.htm. |
[4] | C. Cagnin, M. Keenan, R. Johnston, F. Scapolo and F. Barré, Future-Oriented Technology Analysis, Springer, Berlin Heidelberg, (2008) . doi:10.1007/978-3-540-68811-2. |
[5] | J.P. Deane and Pye, Europe’s ambition for biofuels in aviation – a strategic review of challenges and opportunities, Energy Strategy Reviews 20: ((2018) ), 1–5. doi:10.1016/j.esr.2017.12.008. |
[6] | DNV-GL, Alternative Fuels for Shipping. Position Paper 1-2014. DNV-GL. Hoevik, Norway, 2017. |
[7] | DNV-GL, Assessment of selected alternative fuels and technologies, 2018, Hamburg, Available online at www.dnvgl.com, checked on 11/12/2018. |
[8] | DNV-GL, Methanol as marine fuel: Environmental benefits, technology readiness, and economic feasibility, Report No.: 2015-1197, Rev. 2, 2015, http://www.imo.org/fr/OurWork/Environment/PollutionPrevention/AirPollution/Documents/Report%20Methanol%2021.01.2016.pdf, accessed 10/03/2020. |
[9] | J. Grin, J. Rotmans and J.W. Schot (eds), Transitions to sustainable development. New directions in the study of long term transformative change. ebrary, Inc. New York: Routledge (Routledge studies in sustainability transitions), 2010. Available online at http://site.ebrary.com/lib/alltitles/docDetail.action?docID=10370143. |
[10] | IMO, Sulphur oxides (SOx) and Particulate Matter (PM) – Regulation 14, 2020, http://www.imo.org/en/OurWork/Environment/PollutionPrevention/AirPollution/Documents/Air%20pollution/MEPC.305%2873%29.pdf, accessed 10/03/2020. |
[11] | IMO, MEPC.280(70) Effective date of implementation of the fuel oil standard in Regulation 14.1.3 of Marpol Annex VI, 2016, http://www.imo.org/en/KnowledgeCentre/IndexofIMOResolutions/Marine-Environment-Protection-Committee-%28MEPC%29/Documents/MEPC.280%2870%29.pdf, accessed 10/03/2020. |
[12] | J. Köhler, Transitions pathways to very low emissions shipping: The matisse-ship model, in: The Royal Institution of Naval Architects, International Conference on Wind Propulsion, RINA, London, (2019) , pp. 83–90. |
[13] | J. Köhler, Modelling the multi-level perspective: The MATISSE agent-based model, in: Modelling Transitions–Vices and Virtues, Lessons and a Look Ahead, E. Moallemi and F. de Haan, eds, Routledge, (2019) . |
[14] | J. Köhler, Advances in modelling sustainable innovation: From technology bias to system theories and behavioural dynamics, in: Handbook of Sustainable Innovation, F. Boons and A. McMeekin, ed., Routledge, (2019) . |
[15] | J. Köhler, F. de Haan, G. Holtz, K. Kubeczko, E. Moallemi, G. Papachristos and E. Chappin, Modelling sustainability transitions. An assessment of approaches and challenges, JASSS 21: (1). doi:10.18564/jasss.3629. |
[16] | J. Köhler, D. Kirsch and S. Timmerberg, Teilstudie “Studie Über die Marktreife Von Erdgasmotoren in der Binnen- und Seeschifffahrt”. Wissenschaftliche Beratung des BMVI, Fraunhofer Institute, Karlsruhe, (2018) , Available online at https://www.bmvi.de/SharedDocs/DE/Artikel/G/MKS/studie-marktreife-erdgasmotore-schifffahrt.html?nn=214206. |
[17] | J. Köhler, D. Nelissen and M. Traut, Fighting the windbreak, The Naval Architect ((2017) ), 26–32. |
[18] | J. Köhler, L. Whitmarsh, B. Nykvist, M. Schilperoord, N. Bergman and A. Haxeltine, A transitions model for sustainable mobility, Ecological Economics 68: (12) ((2009) ), 2985–2995. doi:10.1016/j.ecolecon.2009.06.027. |
[19] | Lloyd’s Register, Wind-powered shipping: A review of the commercial, regulatory and technical factors affecting uptake of wind-assisted propulsion. Lloyd’s Register Marine, 2015. |
[20] | Lloyds Register/UMAS, Zero-Emission Vessels: Transition Pathways: Fuel production cost estimates and assumptions, 2019, available from LR at https://www.lr.org/en/insights/global-marine-trends-2030/zero-emission-vessels-transition-pathways/, accessed 26/09/2019. |
[21] | MAN, Marine Engine IMO Tier II and Tier III Programme 2017, MAN Diesel & Turbo, 2017. http://marine.man.eu/docs/default-source/shopwaredocuments/marine-engine-programme-2217.pdf?sfvrsn=4, letzter Zugriff: 26.07.2017. |
[22] | MAN, Engineering the future two-stroke green-ammonia engine, 2019, https://marine.man-es.com/docs/librariesprovider6/test/engineering-the-future-two-stroke-green-ammonia-engine.pdf?sfvrsn=7f4dca2_4 accessed 10/03/2020. |
[23] | E. Moallemi, F. de Haan and J. Köhler, Exploratory analysis of transitions: An emerging approach for coping with uncertainties in transitions research, in: Modelling Transitions–Vices and Virtues, Lessons and a Look Ahead, E. Moallemi and F. de Haan, eds, Routledge, (2019) . |
[24] | E.A. Moallemi and J. Köhler, Coping with uncertainties of sustainability transitions using exploratory modelling. The case of the MATISSE model and the UK’s mobility sector, in: Environmental Innovation and Societal Transitions, (2019) . doi:10.1016/j.eist.2019.03.005. |
[25] | D. Nelissen, M. Traut, J. Köhler, W. Mao, J. Faber and S. Ahdour, Study on the analysis of market potentials and market barriers for wind propulsion technologies for ships, Edited by CE Delft, 2016. Available online at http://www.cedelft.eu/publicatie/study_on_the_analysis_of_market_potentials_and_market_barriers_for_wind_propulsion_technologies_for_ships/1891. |
[26] | H. Psaraftis, Sustainable Shipping a Cross-Disciplinary View: A Cross-Disciplinary View, (2019) . doi:10.1007/978-3-030-04330-8. |
[27] | N. Rehmatulla, J. Calleya and T. Smith, The implementation of technical energy efficiency and CO 2 emission reduction measures in shipping, Ocean Engineering 139: ((2017) ), 184–197. doi:10.1016/j.oceaneng.2017.04.029. |
[28] | D. Rutherford, X. Mao, L. Osipova and B. Comer, Limiting engine power to reduce CO2 emissions from existing ships, Working Paper 2020-01, International Council on Clean Transportation, 2020. https://www.euractiv.com/wp-content/uploads/sites/2/2020/02/ICCT-shipping.pdf, accessed 10/03/2020. |
[29] | T. Smith, C. Raucci, S. Haji Hosseinloo, I. Rojon, J. Calleya, S. Suarez de la Fuente et al., CO2 Emissions from International Shipping: Possible Reduction Targets and Their Associated Pathways, UMAS, London, (2016) , Available online at https://u-mas.co.uk/LinkClick.aspx?fileticket=na3ZeJ8Vp1Y%3D&portalid=0. |
[30] | Wärtsilä (2013): Carlo Contessi (Wärtsilä): Gas engine emissions – Wärtsilä Dual-Fuel, 16. December 2013. |
[31] | World Maritime News, Norled Picks Westcon to Build World’s 1st Hydrogen Ferry. World Maritime News, 2019. Available online at https://worldmaritimenews.com/archives/277732/norled-picks-westcon-to-build-worlds-1st-hydrogen-ferry/, checked on 10/22/2019. |


