
Literature review on sources of interference and proposed solutions for RFID installations in complex production and logistics processes in the automotive industry
Abstract
RFID (Radio Frequency Identification) is used in complex production and logistics processes in the automotive industry. One of the biggest challenges with RFID installations is the bad performance, especially the low read rates. One reason for the low read rates are sources of interference. In order to reduce sources of interference in RFID installations, these and possible solutions must first be known. Therefore, in this paper a literature review was conducted to identify the known sources of interference and proposed solutions for RFID installations in the automotive sector. These were divided into the four categories RFID components, electrical signals, physical environment and environmental influences. In addition, this paper presents a procedure for reducing sources of interference in RFID installations. With this information, a company can build up know-how and support the reduction of interference sources in RFID installations, which in turn increases the read rate.
1Introduction
RFID belongs to the automatic identification methods (Auto-ID) and is used to identify objects and to store additional information about the objects. The advantage of RFID over other Auto-ID methods, such as barcode systems, is that no visual sight is required when reading/writing data (Finkenzeller, 2015). Therefore, RFID technology is used in various industries and sectors, such as production and logistics (Kirch et al., 2017, p. 526), healthcare (Tu et al., 2019), and fashion and apparel retail (Esposito et al., 2015). In production and logistics in the automotive industry, RFID is used in various applications to automate and optimize complex processes. These applications include automatic goods receipt booking, transport acknowledgement, container management, plausibility checks during the installation of components, automatic material retrieval and vehicle localization (Richter, 2013).
One of the main challenges with RFID installations is the low read rate, especially when many tags are read simultaneously (Ebrahimi-Asl et al., 2017; Luh & Liu, 2011). In (Verein Deutscher Ingenieure, 2008) the read rate is defined as in Equation 1.
(1)
The terms read rate and reading rate are used synonymously in this paper. Low read rates lead to a high level of process inaccuracy, which in turn usually results in costs, e.g. due to manual rework. This can lead to a decreasing acceptance of RFID and a reduced further distribution of this technology. The cause of low read rates can be quite different and results from the factors influencing the read rate, which are explained in detail in Section 2.3.
The influencing factors show that the sources of interference are a cause of a low read rate. Sources of interference themselves or their effects are not visible and therefore they are difficult to identify and eliminate. Because of this, it is important to know the possible sources of interference in RFID installations and corresponding solutions for these. This leads to the investigated research question in this paper “What are the known sources of interference and proposed solutions for RFID installations?”.
In order to answer this research question, a literature review is conducted. Based on the assumption that sources of interference can be dependent on the environment of the RFID installations, the focus of the literature research is placed on production and logistics processes in the automotive industry. The objective is to cluster the sources of interference and proposed solutions found through the literature research and to derive a recommendation for action to reduce sources of interference in RFID installations and thus increase the read rate.
The remainder of this paper is structured as follows. In paragraph 2, the fundamentals of RFID technology are explained and the problem statement is deepened. This is followed by the methodology of the literature review in paragraph 3 and the description of the results of this literature review in paragraph 4. Finally, the known sources of interference and proposed solutions are clustered in paragraph 5 and a procedure to reduce sources of interference for RFID installations is proposed, applied and verified in paragraph 6. Finally, the summary follows in paragraph 7.
2RFID Technology
2.1RFID system
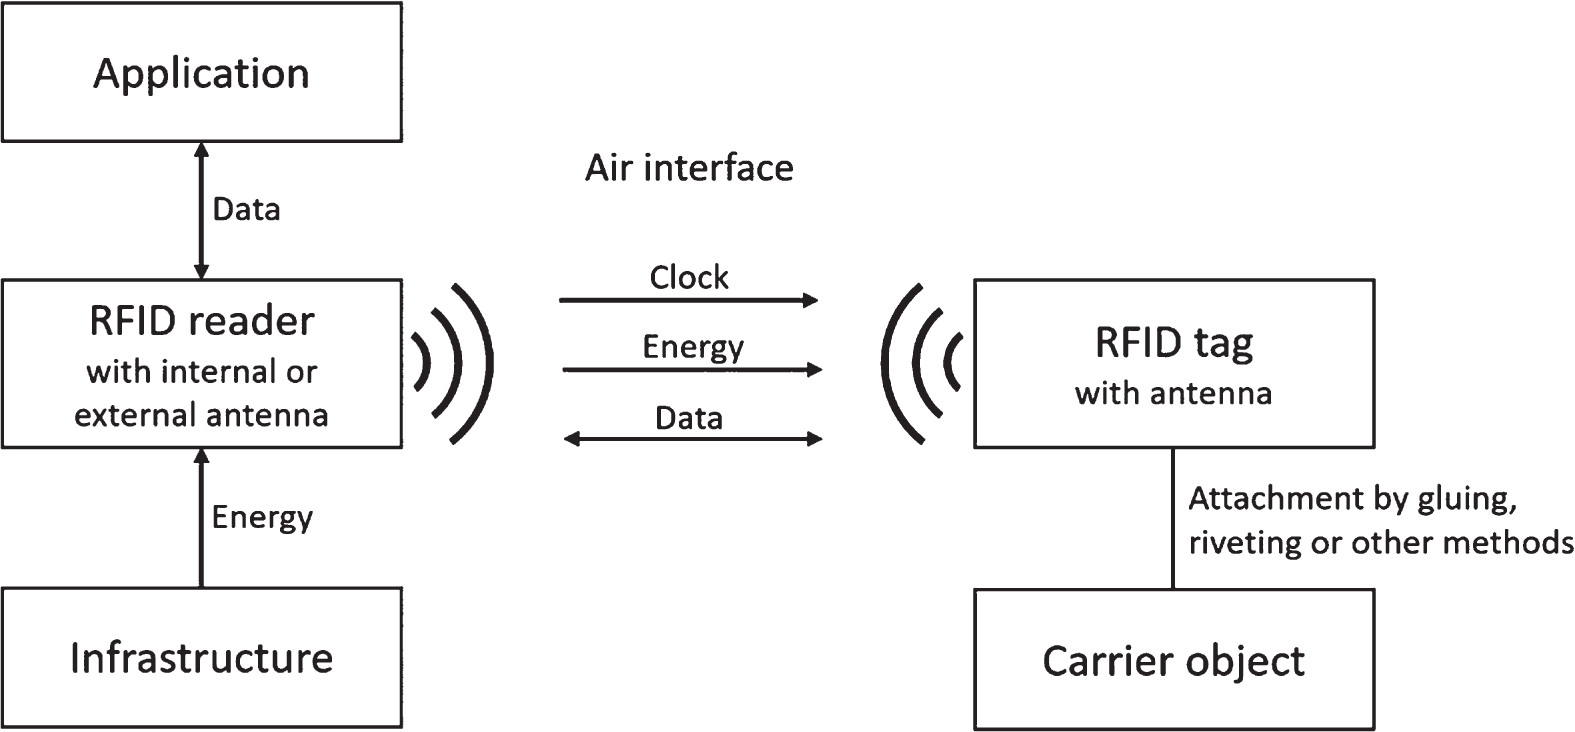
Figure 1 shows the typical structure of an RFID system. The RFID reader has an integrated antenna and/or external antennas to amplify or reduce the reader signal. The reader supplies the passive RFID tags with energy and sets the clock for the data exchange. The data read from the RFID tags is sent from the reader to the application for further processing. The reader itself is supplied with energy through power cords or Power-Over-Ethernet (POE). The RFID tags are attached to the object to be identified, such as a load carrier, by gluing, riveting or other methods. RFID tags are divided into passive, semi-active and active tags. The active tags have their own battery to supply the microchip contained in the tag with energy and to send data. The semi-active tags, on the other hand, only use the battery to power the microchip and the passive tags only use the energy transmitted by the reader to power the microchip and send data. Because of these characteristics, the read range of (semi-)active transponders is greater than that of passive transponders. However, since passive transponders are cheaper, they are used more often and are also considered in this paper (Finkenzeller, 2015, pp. 11–12; Azizi, 2019, pp. 12–14).
Fig. 1
Structure of an RFID system, according to (Finkenzeller 2015, p. 11; Azizi 2019, p. 13; Matheus & Klumpp 2008, p. 10).
2.2Backscatter communication
The frequency range UHF is typically used in production and logistics processes because it provides the required read-distances from few centimetres to several meters. The reader generates an electromagnetic field and thus supplies the tag with energy to activate it. The reader also sends its data by means of the electromagnetic signals. The tag reflects these electromagnetic signals to send its data, which is modulated by a load resistor. Because of the reflection of the electromagnetic signals, this method is called backscatter communication. When the tag antenna is in resonance with the incoming waves, the backscatter signal is particularly good. To indicate the signal strength of the signal reflected by the tag, the Received Signal Strength Indication (RSSI) or Received Signal Strength (RSS) value is used. This factor provides information about how well a tag is read (Finkenzeller, 2015, pp. 58–61, pp. 142–143; Wang, 2017).
2.3Low read rate problem
The low read rate problem is one of the main challenges with RFID installations, especially when many tags are read simultaneously (Ebrahimi-Asl et al., 2017; Luh & Liu, 2011). The cause of low read rates can be quite different and results from the factors influencing the read rate, which are the following:
• Sources of interference, which are described in paragraph 5 (Fescioglu-Unver et al., 2015; Segura-Velandia et al., 2016; Costa et al., 2017; Windmann et al., 2017; Cairo et al., 2018; Ciftler et al., 2015; Xie et al., 2019; Ding et al., 2017; Kim et al., 2008; Elewe et al., 2016; Lazaro et al., 2009; Yaacob et al., 2019; Zhang et al., 2014; Lechner & Günthner, 2016; Labels & Labeling, 2019; Kim et al., 2017; Brunner et al., 2015; Zhenzhong et al., 2011; Le Breton et al., 2017; Verein Deutscher Ingenieure, 2008; Verband der Automobilindustrie, 2015c)
• Antenna polarization (Armstrong, 2013)
• Distance between reader and tag (Huang et al., 2008)
• Hardware (RFID reader and RFID tags) (Luh & Liu, 2011)
• Reader settings, e.g. power (Armstrong, 2013)
• Orientation between tag and antenna (Huang et al., 2008; Potdar et al., 2007)
• Reading frequency (Huang et al., 2008)
2.4Definition of sources of interference
In physics, the noun interference is defined as “The combination of two or more electromagnetic waveforms to form a resultant wave in which the displacement is either reinforced or cancelled. The fading or disturbance of received radio signals caused by unwanted signals from other sources, such as unshielded electrical equipment, or broadcasts from other stations or channels.” (Oxford University Press)
In this paper, the term source of interference is used in a broader sense as influences, which negatively affect the electromagnetic field of the reader or the backscatter signal of the tag and thus the communication between the RFID reader and tag, resulting in a lower read rate, read frequency per second or reading range. In addition, environmental influences that can affect the tag and thus have a negative impact on communication are referred to as sources of interference in this paper.
In contrast, controllable parameters such as reader settings, orientation between reader and tag, antenna polarisation, process errors or defective reader hardware are not considered as source of interference, even though these can have the similar negative effects.
2.5Impact of interferences in RFID-installations in complex production and logistics processes in the automotive industry
In production and logistics in the automotive industry, RFID technology is used to automate and optimise complex processes. However, interferences can occur in the environment of any RFID installation. These lead to the fact that “the read rates— and therefore the functionality of the system— can be hampered on anything from a minor to catastrophic level” (Wyld, 2005). The low read rates caused by interference (Zahran et al., 2016; Fescioglu-Unver et al., 2015; Brunner et al., 2015) logically result in an impairment of the process quality and process automation. As soon as the read rate is lower than the read rate required for the process, manual reworking is necessary and the advantages of RFID technology cannot be used. For example, in case of automatic goods receipt booking with an RFID gate, the barcode of each load carrier would have to be scanned individually, if the read rate is too low. This manual rework has the consequence that, in the worst case, the investment in RFID installations is not profitable.
3Methodology of Literature Review
The procedure for the systematic literature research was as follows: In the first step, literature was searched using defined criteria and in the second step, the literature relevant to the subject was selected from the search results. The defined criteria for the search are described below:
• Publication date: The publication date has been restricted to the years since 2015 in order to get current literature.
• Databases: It was searched in the databases Google Scholar, Science Direct and ACM Digital Library.
• Search term: Each database was searched for the following three search terms:
1. RFID AND Sources of interference AND Automotive industry
2. RFID “Issues OR solutions” AND installation AND “production OR logistics” AND automotive
3. RFID AND sources of interference
The search results were sorted by relevance and from the results of each search the first 10 and therefore most relevant sources were selected. These search results were checked and selected for their technical relevance based on the title and abstract. Technically relevant literature contains information on sources of interference or proposed solutions for RFID installations that can occur or be applicable in the production or logistics of the automotive industry and technically relevant literature deals with the UHF frequency range with passive RFID tags. The selected literature was then read in its entirety and checked again for technical relevance and selected. This methodology led to the selected literature in paragraph 4.
As the results of the systematic literature research were not sufficient to fully answer the research question, further specific literature was searched in various databases at a later stage.
4Results of literature review
4.1Overview of the results
Table 1 shows the results of the literature research (see paragraph 3) and in which database and via which search term these sources were found as well as the publication date.
Table 1
Results of the Literature Review
| Database | Search term | Title of the selected literature | Publication date |
| Google Scholar | 1 | A novel self-configuration method for RFID systems in industrial production environments (Windmann et al. 2017) | 2017 |
| Industrie 4.0 implementations in the automotive industry (Segura-Velandia et al. 2016) | 2016 | ||
| RFID in production and service systems: Technology, applications and issues (Fescioglu-Unver et al. 2015) | 2015 | ||
| 2 | RFID in production and service systems: Technology, applications and issues (Fescioglu-Unver et al. 2015) | 2015 | |
| 3 | A novel self-configuration method for RFID systems in industrial production environments (Windmann et al. 2017) | 2017 | |
| Interference sources in congested environments and its effects in UHF-RFID systems: A review (Cairo et al. 2018) | 2018 | ||
| Experimental performance evaluation of passive UHF RFID systems under interference (Ciftler et al. 2015) | 2015 | ||
| Science Direct | 1 | – | |
| 2 | Improving visibility using RFID –the case of a company in the automotive sector (Costa et al. 2017) | 2017 | |
| 3 | – | ||
| ACM Digital Library | 1 | – | |
| 2 | – | ||
| 3 | Tagtag: material sensing with commodity RFID (Xie et al. 2019) | 2019 | |
| Poster: Bidimensional relative localization leveraging interference among passive tags (Ding et al. 2017) | 2017 |
4.2Summary of the literature
RFID in production and service systems: Technology, applications and issues
The paper “RFID in production and service systems: Technology, applications and issues” (Fescioglu-Unver et al., 2015) provides an overview of the RFID technology, RFID applications in the production area and problems with RFID which are known in the literature. The RFID applications material handling, food supply chain management (SCM), manufacturing and process monitoring, and product lifecycle data management are described. Problems with RFID include data reliability, security and privacy, electromagnetic interference and return on investment (ROI). The sources of interference for RFID installations include reader signal collisions, which occur when two or more RFID readers try to read the same tag at the same time. In addition, tag collisions are a problem for RFID, because here the tags interfere with each other. Other problems with RFID but not direct sources of interference are tags that are not read (false negatives) or tags that are read but should not be recognised (false positives). Another influence on RFID applications is the orientation between RFID reader and tag as well as objects made of metal or liquids in the environment. All these problems lead to unreliable data and have the effect of low detection rates, for example. Security attacks also interfere with the correct functioning of RFID installations by intentionally emitting interfering signals that affect the communication between reader and tag or by sending fake messages to reader or tag. It is also mentioned that RFID can cause electromagnetic interference for other electronic devices, mainly in healthcare, but this is not a source of interference for RFID installations. This paper does not propose solutions to these problems.
Industrie 4.0 implementations in the automotive industry
The paper “Industrie 4.0 Implementations in the automotive industry” (Segura-Velandia et al., 2016) describes, how RFID can be used for cyber-physical systems (CPS) to map the physical objects in the software. The CPS of a test factory is realized by attaching RFID tags to engine components and their load carriers. In addition, a method for implementing RFID was developed and five case studies were implemented based on the method. This method includes the identification of RF interferences, the RFID tag engineering and the RFID portal engineering which should be considered during the development and implementation of an RFID solution. The following are mentioned as possible RF interference: forklift, washing basket, separator’s structural reinforcements, temperature and humidity changes, chemical agents and mechanical vibration. In addition, the carrier material of the RFID tag, which can be plastic or metal, as well as the type of affixing (gluing, riveting or screwing) have an influence on the RFID tag performance. In addition, the tag-to-tag interference was investigated to determine the optimum distances to reduce or avoid interferences between the tags when they are attached.
Improving visibility using RFID –the case of a company in the automotive sector
The paper “Improving visibility using RFID –the case of a company in the automotive sector” (Costa et al., 2017) describes the challenges of implementing RFID installations based on a literature review and a practical project. In the literature review, the challenges are divided into technical and organisational. The technical ones are:
1. data storage and access, because tracking items generates large amounts of data
2. the tendency towards absolute accuracy for identification systems
3. electromagnetic interference from other radio devices, such as telephones or personal digital assistants (PDAs)
The following organisational challenges are mentioned:
1. question of who is the data owner
2. security of the data on the tag
3. cost of the tags, as this may prevent the technology from spreading
Furthermore, the literature review summarises the results of different case studies. The results of the Walmart case study include interference with other devices such as walkie-talkies, forklifts, electric motors and computing equipment. In addition, the case studies show that the lack of standards, the management of large amounts of data, the exchange of information between stakeholders and the implementation costs can be problematic when implementing RFID. The implementation of the practical project, which improves the internal logistics visibility, showed that the lack of know-how is one of the “most important aspects” (Costa et al., 2017).
A novel self-configuration method for RFID systems in industrial production environments
The authors of the paper “A novel self-configuration method for RFID systems in industrial production environments” (Windmann et al., 2017) developed a method for an RFID system, which automatically adjusts the transmission power and transmission frequency of the RFID reader to the environment. The aim is to counteract sources of interference from the environment, as these have a negative effect on the reading range. Sources of interference include “metallic environments, atmospheric influences, large-scale objects, and switching operations or high frequency transmissions in power nets” (Windmann et al., 2017), but RFID readers themselves can also be a source of interference. For the self-configuration, the interfering signal is measured on each channel and then the channel with the lowest interfering signal is selected as the transmission channel. In addition, the transmission power is determined using the received signal strengths indicator (RSSI) of the tags and the time at which the signal arrives at the reader. With this method, the transmission power could be reduced on average from 27 dBm to 15.2 dBm.
Interference sources in congested environments and its effects in UHF-RFID systems: A review
In (Cairo et al., 2018) various sources of interference for RFID systems are analysed and divided into the three areas of self-leakage, other radios and nearby tags. Self-leakage (self-jammer) leads to a reduction in the read range. The reason for this can be the PCB design or nearby objects that reflect the continuous carrier wave and thus lead to sensitivity problems. Interference from other radios includes mobile phones, because mobile phone communication in various countries uses frequency channels that are close to the frequencies used for RFID. The interference from mobile phones has the effect of reducing the reading range. But also other RFID readers are a source of interference because the interference from another distant reader can lead to the fact that the backscatter signals from the tags can no longer be decoded correctly. Nearby tags are also a source of interference, which occurs when “multiple tags are in the proximity of the reader” (Cairo et al., 2018). The reason for this is that when there are many tags in the reading field of a reader, each individual tag receives less power and tag collisions occur as well. This leads to a “low tag identification efficiency” (Cairo et al., 2018). In addition, tag side effects lead to a reduced read range because they weaken the backscatter signal. All these sources of interference should be taken into account when developing an RFID system.
Experimental performance evaluation of passive UHF RFID systems under interference
In the paper “Experimental performance evaluation of passive UHF RFID systems under interference” (Ciftler et al., 2015) experiments are conducted to investigate the influence of electromagnetic interference (EMI), which can occur in industrial environments, on the read rate per second. Since Impulsive EMI, Gaussian EMI and Rayleigh EMI typically occur in industrial environments, these three were investigated. Impulsive EMI is caused by machines in the environment, Gaussian and Rayleigh EMI are caused by “the nature of the industrial floors cluttered with various kinds of machines, devices, switches, etc.” (Ciftler et al., 2015) and “the harsh structural environment composed of metal ceiling, cable trays, ladders, etc.” (Ciftler et al., 2015). In the experiments, the tags are positioned at different distances from the reader and then the read rate per second is determined. First the read rate per second was measured without electromagnetic interference and then for the three types of interference. The experiments showed that at one position the read rate is always significantly lower due to reflections from objects. Furthermore, all three types of interference degraded the read rate per second. Impulsive EMI degraded the read rate per second the least on average and Rayleigh EMI the most. In addition, the experiments showed that the read rate per second deteriorates significantly more when the EMI generation is further away from the antenna and thus closer to the tags.
Tagtag: material sensing with commodity RFID
The paper “Tagtag: Material Sensing with Commodity RFID” (Xie et al., 2019) describes how RFID can be used to detect different materials. This is done using the property that the impedance changes depending on the material and this leads to a change in the RSS value and the phase. Since the resolution of the phase is better than the RSS value, this is used for material sensing. The RFID tag does not have to be placed directly on the material, but can also be placed on the housing of the material. In this paper, conductive liquids are mentioned as a challenge, as they reflect the signals and thus lead to a change in the phase. For material sensing, the reflection by conductive liquids is modelled accordingly. However, material sensing does not work for metal enclosures, as in this case the tag is difficult to read. In the future, specially designed tags for metal surfaces could be tested and used.
Poster: Bidimensional relative localization leveraging interference among passive tags
Table 2
Sources of interference and proposed solutions –RFID components
| Source of interference | Description | Proposed solutions |
| Reader-to-tag signal collisions | Reader-to-tag signal collisions, also called reader-to-tag interference, occur when two readers try to read the same tag at the same time, which can lead to problems and undesired behaviour when the tag is read out (Fescioglu-Unver et al. 2015; Kim et al. 2008). | Reader-to-tag signal collisions can be minimised by using an RFID network planning algorithm (Elewe et al. 2016). Other possibilities are the use of shielding material so that the readers’ detection fields do not overlap, to position the readers further apart or to reduce the power of the readers and thus their reading field. |
| Reader-to-reader interference | Signals from other RFID readers can also be a source of interference, even if the interrogation field of the readers does not overlap, because they can still interfere with the backscatter signal of a tag in the reading range of another reader. (Kim et al. 2008; Cairo et al. 2018; Windmann et al. 2017; Lazaro et al. 2009) | To solve this, multiple access mechanisms are used, such as frequency-division multiple access (FDMA), time-division multiple access (TDMA), or carrier-sense multiple access (CSMA). Furthermore, the interrogation range reduction ratio (IRRR) value can be calculated for the analysis of complex interference problems (Kim et al. 2008). |
| Another solution is to use only neighbouring readers that use different times or frequencies, or to switch off the readers while they are not needed and activate them only by means of a sensor. In addition, the encoding can be changed, for example FM0 is more sensitive to interference than Miller (Lazaro et al. 2009). | ||
| A self-configuration method could be used to “select the transmission channel with the lowest interference” (Windmann et al. 2017). | ||
| Tag collisions | Tag collisions (sometimes also referred to as tag interference) occur when several tags are in the reading field of an RFID reader at the same time and send data to the reader at the same time. In this case, the reader cannot clearly distinguish the signals and cannot read the IDs of the tags. (Kim et al. 2008; Fescioglu-Unver et al. 2015; Yaacob et al. 2019; Cairo et al. 2018) | The solution to this is to use a suitable anti-collision protocol, such as Slotted Aloha or the Q-Algorithm (Kim et al. 2008; Yaacob et al. 2019). The EPC UHF Gen2 Air Interface Protocol describes an example slot-count (Q) selection algorithm (GS1 2018). |
| Tag-to-tag interference | If the distance between the tags is too small, interference occurs. This interference can mean that more power is needed to read the tags, but also that the tags can no longer be read by the reader at a given distane, which has a negative effect on the read rate. (Segura-Velandia et al. 2016; Ding et al. 2017; Zhang et al. 2014) | One solution is to carry out experiments to find out the minimum distance needed between RFID tags in order to place the tags optimally on the objects to be identified (Segura-Velandia et al. 2016). |
This poster describes a system for localising passive RFID tags that uses the interference caused by tags with a small distance. An experiment shows that two tags positioned very close to each other “with mutual interference become unreadable” (Ding et al., 2017). This effect only occurs at a distance of less than ∼1.5 cm between the tags. However, the distance between the tags and the reader in this experiment is not mentioned. In addition, the RSS value of one tag was measured and this showed that when a second tag is close, the RSS value drops significantly. (Ding et al., 2017)
5Sources of Interference and Proposed Solutions
This paragraph describes the sources of interference and suggested solutions for RFID installations. The sources of interference are divided into the categories RFID components, electrical signals, physical environment and environmental influences.
5.1RFID components
5.2Electrical Signals
Table 3
Sources of interference and proposed solutions –Electrical signals
| Source of interference | Description | Proposed solutions |
| Interference from electrical devices | Electromagnetic interference can be caused by other electrical devices, such as telephones, mobile device (GSM uplink signal), Personal Digital Assistants (PDA), walkie-talkies, electric motors, WLAN, frequency converters, monitors, or also switching operations or high frequency transmissions in power nets. These interferences have an impact on the read range of RFID systems and lead to poorer performance, which is reflected in the read rate per second. (Windmann et al. 2017; Costa et al. 2017; Ciftler et al. 2015; Brunner et al. 2015; Verein Deutscher Ingenieure 2008) | It is possible to use an RFID system that adapts the transmission channel and the transmission power to the respective environment, as described in (Windmann et al. 2017). Furthermore, the encoding Miller can be used, as this is less sensitive to interference than FM0 (Lazaro et al. 2009). If possible, the interfering electrical devices should be removed from the environment or shielded. In addition, an internal radio standard could be created that regulates the radiation of devices and the use of frequency channels. |
| Interference from attackers | Attackers can intentionally send jamming signals or fake messages to disrupt communication between the reader and the tag (Fescioglu-Unver et al. 2015). | Here, communication protocols that prevent attacks and detect security vulnerabilities could be a solution (Fescioglu-Unver et al. 2015). |
5.3Physical Environment
Table 4
Sources of interference and proposed solutions –Physical environment
| Source of interference | Description | Proposed solutions |
| Reflections from the environment | Reflections from the environment are caused by large objects, a metallic environment (Windmann et al. 2017) or metallic objects (Fescioglu-Unver et al. 2015), forklift, “washing basket”, “separator’s structural reinforcements” (Segura-Velandia et al. 2016) or “the harsh structural environment composed of metal ceiling, cable trays, ladders” (Ciftler et al. 2015). | One proposed solution is the use of a self-configuration RFID system, which determines the optimal transmission channel and performance depending on the environment, as described in (Windmann et al. 2017). Another possibility is to modify the environment by removing interfering objects or using shielding. In addition, lower power could reduce reflections, but this should be tested individually. |
| Reflections lead to reading holes and overreach and to an electromagnetic field with different field strengths (Lechner & Günthner 2016). Reflections from the environment have the effect of a lower read rate per second (Ciftler et al. 2015). | ||
| If the continuous carrier wave of the reader is reflected by nearby objects into the receiver, this leads to sensitivity problems and a reduction of the reading range (Cairo et al. 2018). | ||
| Blocking by objects between the reader and tag | Objects which are made of reflecting (e.g. metal) or absorbing materials (e.g. water) and placed between the reader and tag can block the signals or impact the range and reliability (Sattlegger & Denk 2014). | The material of objects between the reader and tag should be taken into account during the implementation of the RFID system and during transponder positioning (Verband der Automobilindustrie 2015c). When using load carriers, for example, “other measures must be taken, such as guaranteeing the orientation of the container, placing multiple tags around the container or using readers at different angles” (Sattlegger & Denk 2014). |
| If possible, the absorbing/reflecting objects or materials should be replaced. Also, if absorbent materials are present, the power of the RFID reader could be increased. | ||
| Carrier material | Another source of interference are carrier objects or the contents of the object to be identified made of the materials metal, ESD (Electrostatic Discharge), glass and conductive liquids. Because these can lead to resonance detuning, reflections and lower RSS values as well as lower detection rates. (Xie et al. 2019; Segura-Velandia et al. 2016; Labels &Labeling 2019; Verband der Automobilindustrie 2015c) | The solution are RFID tags specially designed for the carrier material, for example there are special on-metal tags or ESD labels as well as so-called flag-tags, where the tag is perpendicular to the surface and thus creates distance to the carrier material (Xie et al. 2019; atlasRFIDstore; Labels &Labeling 2019; Kim & Kim 2012; Armata-ID) |
| If possible, the carrier material can also be replaced by a suitable one. |
5.4Environmental Influences
Table 5
Sources of interference and proposed solutions –Environmental Influences
| Source of interference | Description | Proposed solutions |
| Temperature and humidity | In (Segura-Velandia et al. 2016) changes in temperature are mentioned as interference sources and in (Verein Deutscher Ingenieure 2008) temperature is listed as an ambient condition which affects RFID systems but in both sources this phenomena is not explored further. Changes in humidity are mentioned as an interference source in (Segura-Velandia et al. 2016) but is not described further and (Windmann et al. 2017) says that atmospheric influences “have a great impact on the range of wireless communication systems” (Windmann et al. 2017). No further details on this source of interference are given in these two sources. In (Verband der Automobilindustrie 2015c) snow, frost, ice, precipitation and fog are mentioned in the weather-related influences for tags. In (Kim et al. 2017) experiments have shown that changes in temperature and distance between tag and antenna have an effect on the read rate. However, in this experiment only the tag was heated in a box and changes in humidity due to changes in temperature were not measured. Therefore, the change in temperature only affects the tag surrounding and not the entire air interface between the reader and the tag. | The environmental influences can usually not be changed. Therefore, the requirements regarding the environmental conditions for an RFID installation should be taken into account during development and implementation (Segura-Velandia et al. 2016), especially when choosing the tags and in most of the use cases it is recommended to use tags with protection class IP 5 (cf. IEC 60529) (Verband der Automobilindustrie 2015c) As a solution for water on the tag or antenna in (Le Breton et al. 2017) hyrophobic radome is proposed. Furthermore, experiments can identify the effects of environmental influences for the respective application and determine parameters such as the optimal distance between tag and antenna under these conditions (Kim et al. 2017). In addition, the novel self-configuration method could be used, as described in (Windmann et al. 2017). |
| Temperature and humidity changes of the whole system including tag, antenna and air interface were analysed in the experiments in (Zhenzhong et al. 2011). In those experiments the antenna and tag were placed in an environmental chamber and because of the metal sidewalls the experiments were done with closed and opened door of the environmental chamber. | ||
| These experiments have revealed that there is “a linear relationship between passive UHF RFID tags’ resonant frequency and temperature at relative humidity (RH) of 50% and 80% ” (Zhenzhong et al. 2011) and that “as the relative humidity increased, at different levels of temperature, an insignificant change in frequency (resonant and impedance) is observed” (Zhenzhong et al. 2011). | ||
| In (Le Breton et al. 2017) it is shown that water on base antenna, water on tag, cable temperature, tag temperature, wood stake moisture (carrier material) and atmospheric conditions of the air have an effect on the phase. | ||
| Salt content of the air | In (Verein Deutscher Ingenieure 2008; Verband der Automobilindustrie 2015c) the salt content is mentioned as an influencing factor for tags and RFID systems. | |
| Chemical stresses | Chemical stresses includes oil, detergent, lubricants, acids, alkalis, alcohol, surfactant and solvents (Segura-Velandia et al. 2016; Verband der Automobilindustrie 2015c; Verein Deutscher Ingenieure 2008). | |
| Mechanical stresses | Mechanical stresses include mechanical vibration, shocks, oscillations, pressure and friction (Segura-Velandia et al. 2016; Verband der Automobilindustrie 2015c). |
6Procedure to reduce Sources of Interference in RFID Installations in Automotive Production and Logistics Processes
This paragraph proposes a procedure to reduce sources of interference for RFID installations in production and logistics in the automotive industry.
Initial situation and preconditions
• The RFID installation has already been developed and set up.
• The RFID installation can be in a test environment or real environment.
• It is assumed that the optimal adjustable parameters, such as reader power, have already been identified by various tests and/or experts. For this the following test procedures and guidelines can be used: ISO/IEC 18046-1 (International Organization for Standardization 2011), ISO/IEC 18046-2 (International Organization for Standardization 2020a), ISO/IEC 18046-3 (International Organization for Standardization 2020b), AIM 4472 Part 10 (Verein Deutscher Ingenieure 2008).
• It is assumed that a suitable anti-collision algorithm is used and that tag collisions are not a problem.
• During development, attention is already paid to ensuring that the selected hardware is suitable for the mechanical stresses and chemicals, thus eliminating these sources of interference.
Start trigger
The following in-house procedure can be used for newly set up installations, when something has changed in the environment of existing installations and when the performance of an existing installation is not satisfactory.
Procedure
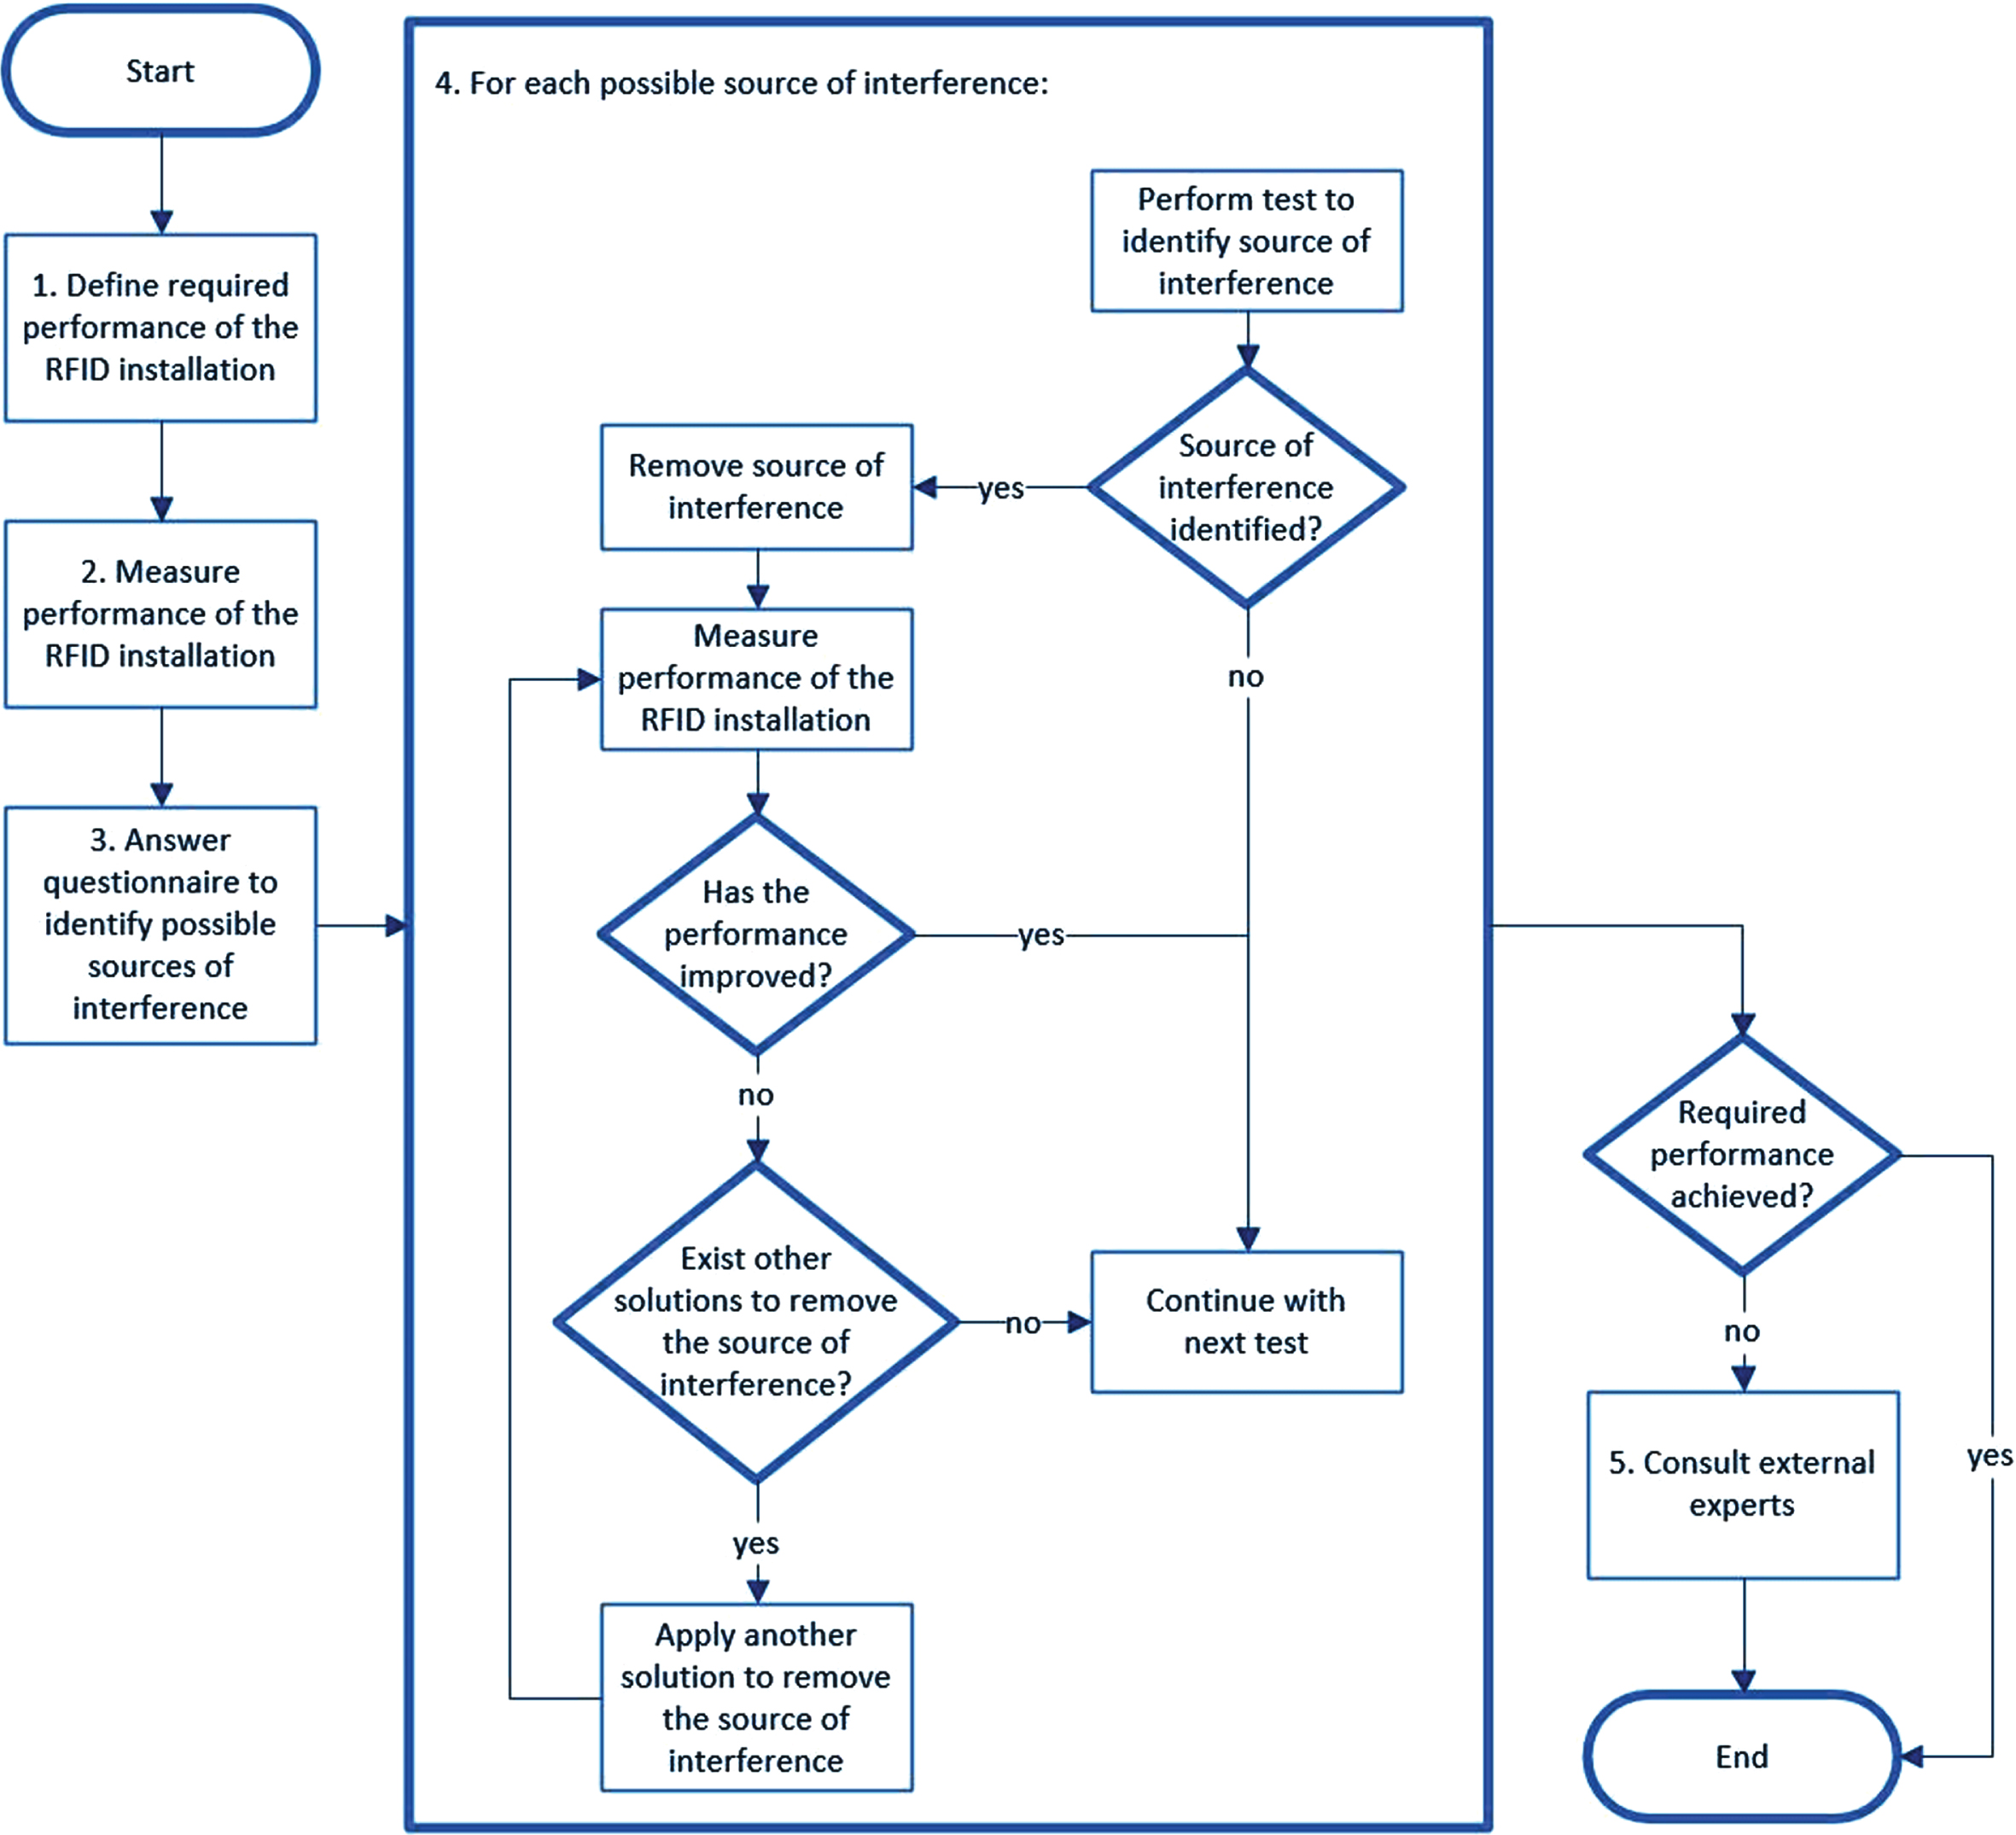
The procedure is shown in Fig. 2.
1. First of all, the performance required for RFID installation must be defined, this can be a certain detection rate, range or similar and depends on the individual process where RFID is used.
2. The performance of the RFID installation must then be measured.
3. If the measured performance is lower than the required performance, the possible sources of interference must first be identified. To identify the possible sources of interference, the questionnaire from section 6.1 can be filled out. This questionnaire also contains the corresponding tests for each question answered with “yes” in order to determine the influence of the sources of interference.
4. The tests identified by the questionnaire must then be carried out in sequence, which are described in section 6.2. If a test identifies a source of interference, it should first be eliminated and, if not already done as part of the test, the performance should be measured again to identify the influence of the countermeasures. If the performance was not improved and other solutions to remove the source of interference exist, another solution should be applied and the performance should be measured again. This procedure should be repeated for each test. The procedure can be terminated as soon as the desired performance has been achieved.
5. If all possible sources of interference have been identified and eliminated, but the required performance has not been achieved, external experts (e.g. from commercial or University test facilities) should be consulted and the hardware and adjustable parameters checked.
Fig. 2
Procedure to reduce sources of interference.
6.1Questionnaire
This is the questionnaire to determine which tests are likely to be most useful in identifying sources of interference.
1) Is the carrier object or the content of the object made of metal, ESD, glass or conductive liquids or other absorbent or reflective materials? → Carrier material test
2) Are there other electrical devices or other radio devices in the vicinity of the RFID installation or is interference by an attacker conceivable) → Interference test
3) Are there other UHF RFID readers in the vicinity? → Reader-to-tag signal collision test and reader interference test
4) Are several RFID tags placed very close to each other? → Tag interference test
5) Are there other objects between the RFID tag and the reader that are made of metal, ESD, glass or conductive liquids or other absorbent or reflective materials? → Absorption test
6) Is the RFID installation in an environment with extreme temperatures / humidity / salt content of the air or differ the environmental influences greatly from those of the test environment? → Environmental impact test
7) Is the RFID installation in a metallic environment or are there large metal objects near the RFID installation? → Reflection test
6.2Tests to identify Sources of Interference
The tests described here are intended to help identify sources of interference for RFID installations with as little equipment and effort as possible.
6.2.1Carrier material test
The carrier material test can be used to determine the influence of the carrier material on the power of the backscatter signal and thus on the reading range. This can be used to determine whether the carrier material is a source of interference.
Test environment
The carrier material test should be performed in an anechoic chamber.
Hardware and software
For the test, an RFID measuring device is required that contains a network analyser optimised for RFID measurements, such as the Tagformance Pro Measurement System (Voyantic Ltd. 2018) (see Fig. 3). In addition, the software belonging to the RFID measuring device is required.
Fig.3
Tagformance Measurement Cabinet at HFT Stuttgart.
Test procedure
1) Attach the tag to the carrier material required for the RFID installation.
2) Position the tag with the carrier material in the measuring chamber.
3) Set the frequency range to the frequency range used for the RFID installation.
4) Start measuring the sensitivity and the backscatter signal.
5) Save the measurement results.
6) Attach the tag to a neutral carrier material, e.g. plastic or foam, and repeat steps 2–5.
7) The results from the different substrates must then be compared with each other.
Interpretation of the test results
If the backscatter signal and the reading range of the RFID installation’s carrier material is significantly lower than that of the neutral carrier material, then this carrier material is a source of interference.
6.2.2Interference test
The aim of this test is to identify interference generated by other electrical devices or radios devices for an RFID installation.
Test environment
The interference test is carried out in the area of the RFID installation.
Hardware and software
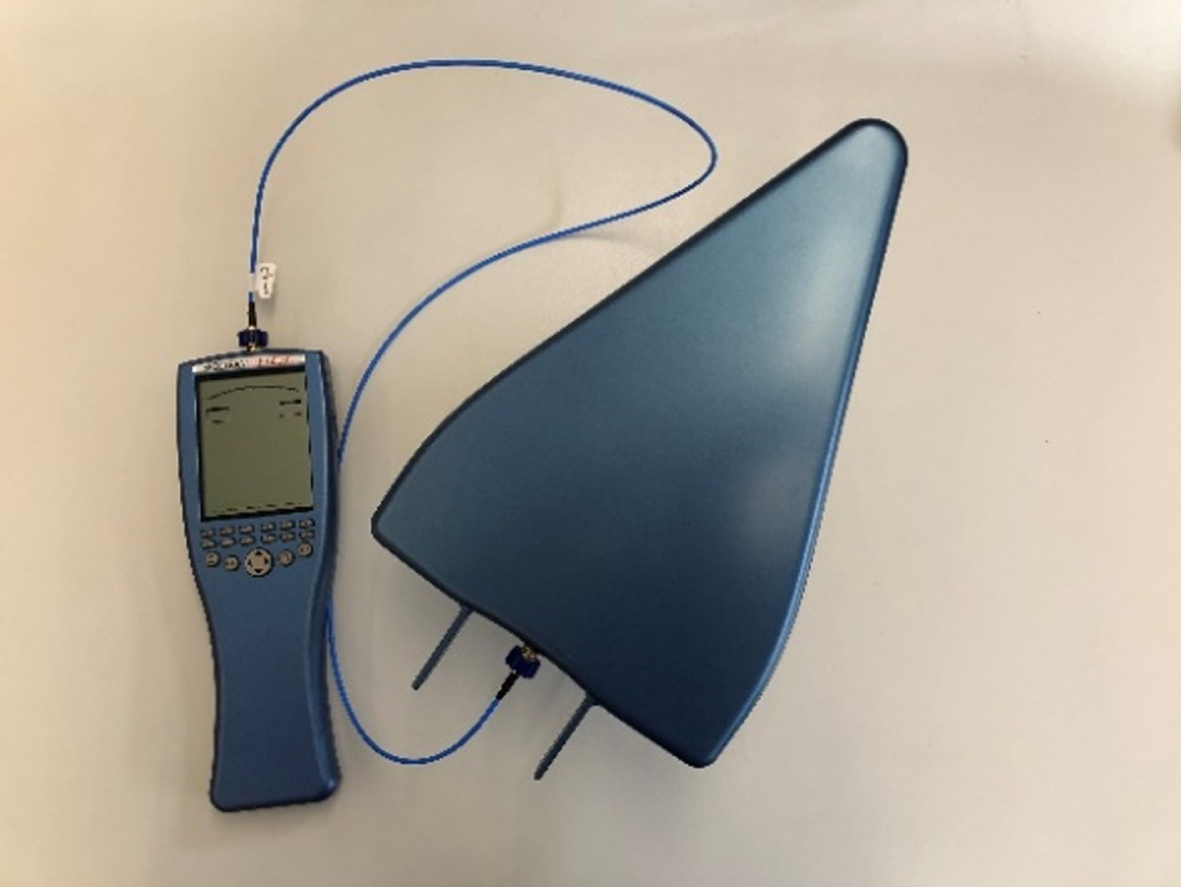
A portable spectrum analyser suitable for the frequency range of the RFID installation and the corresponding software are required, such as the Aaronia SPECTRAN HF-60100 handheld spectrum analyser with UHF antenna (Aaronia) as shown in Fig. 4.
Fig. 4
Aaronia SPECTRAN HF-60100 handheld spectrum analyser with UHF antenna.
Test procedure
1) First, deactivate the reader of the RFID installation and, if present, the RFID readers in the vicinity.
2) Then a portable spectrum analyser must be put into operation as described in the corresponding manual and the relevant frequency range used by the RFID installation must be set, e.g. 865.0 MHz–868.5 MHz.
3) In step 3, the frequency sweep measurement must be started and during the measurement the entire range of the RFID installation must be scanned with the antenna and the antenna must be swivelled until the max hold values no longer change.
4) The measurement results must be saved.
Interpretation of the test results
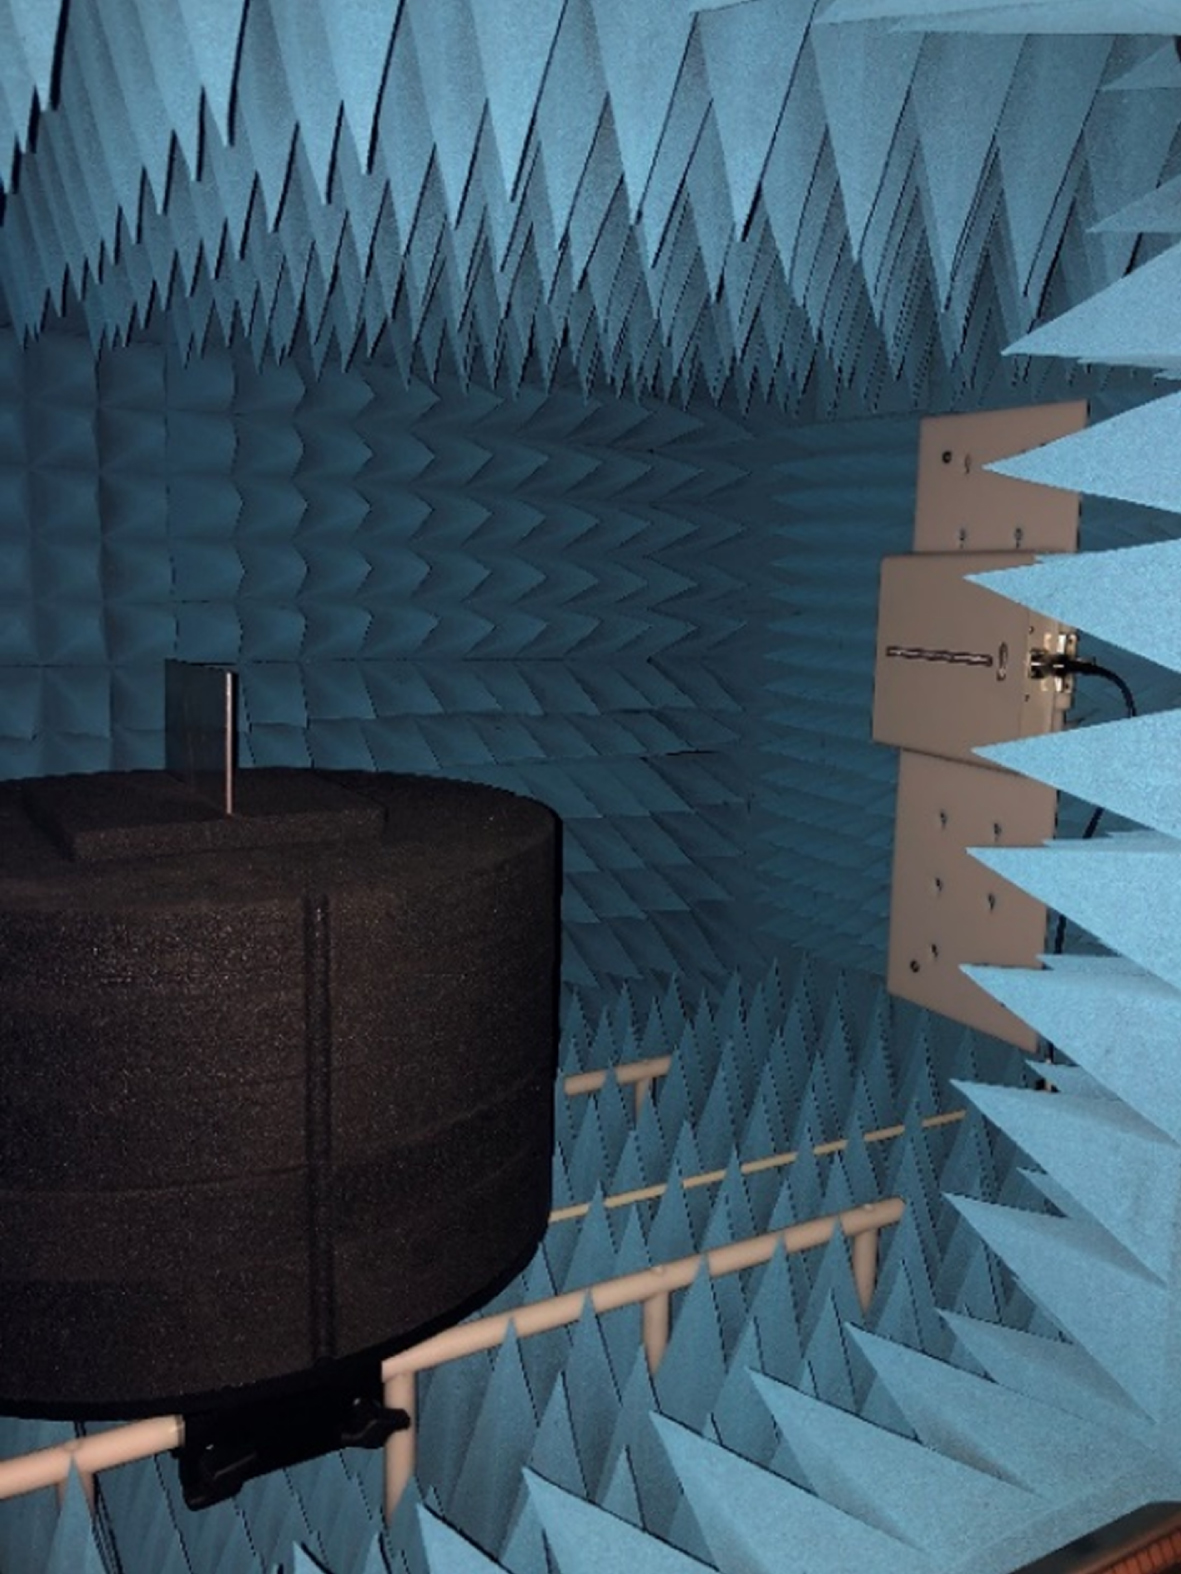
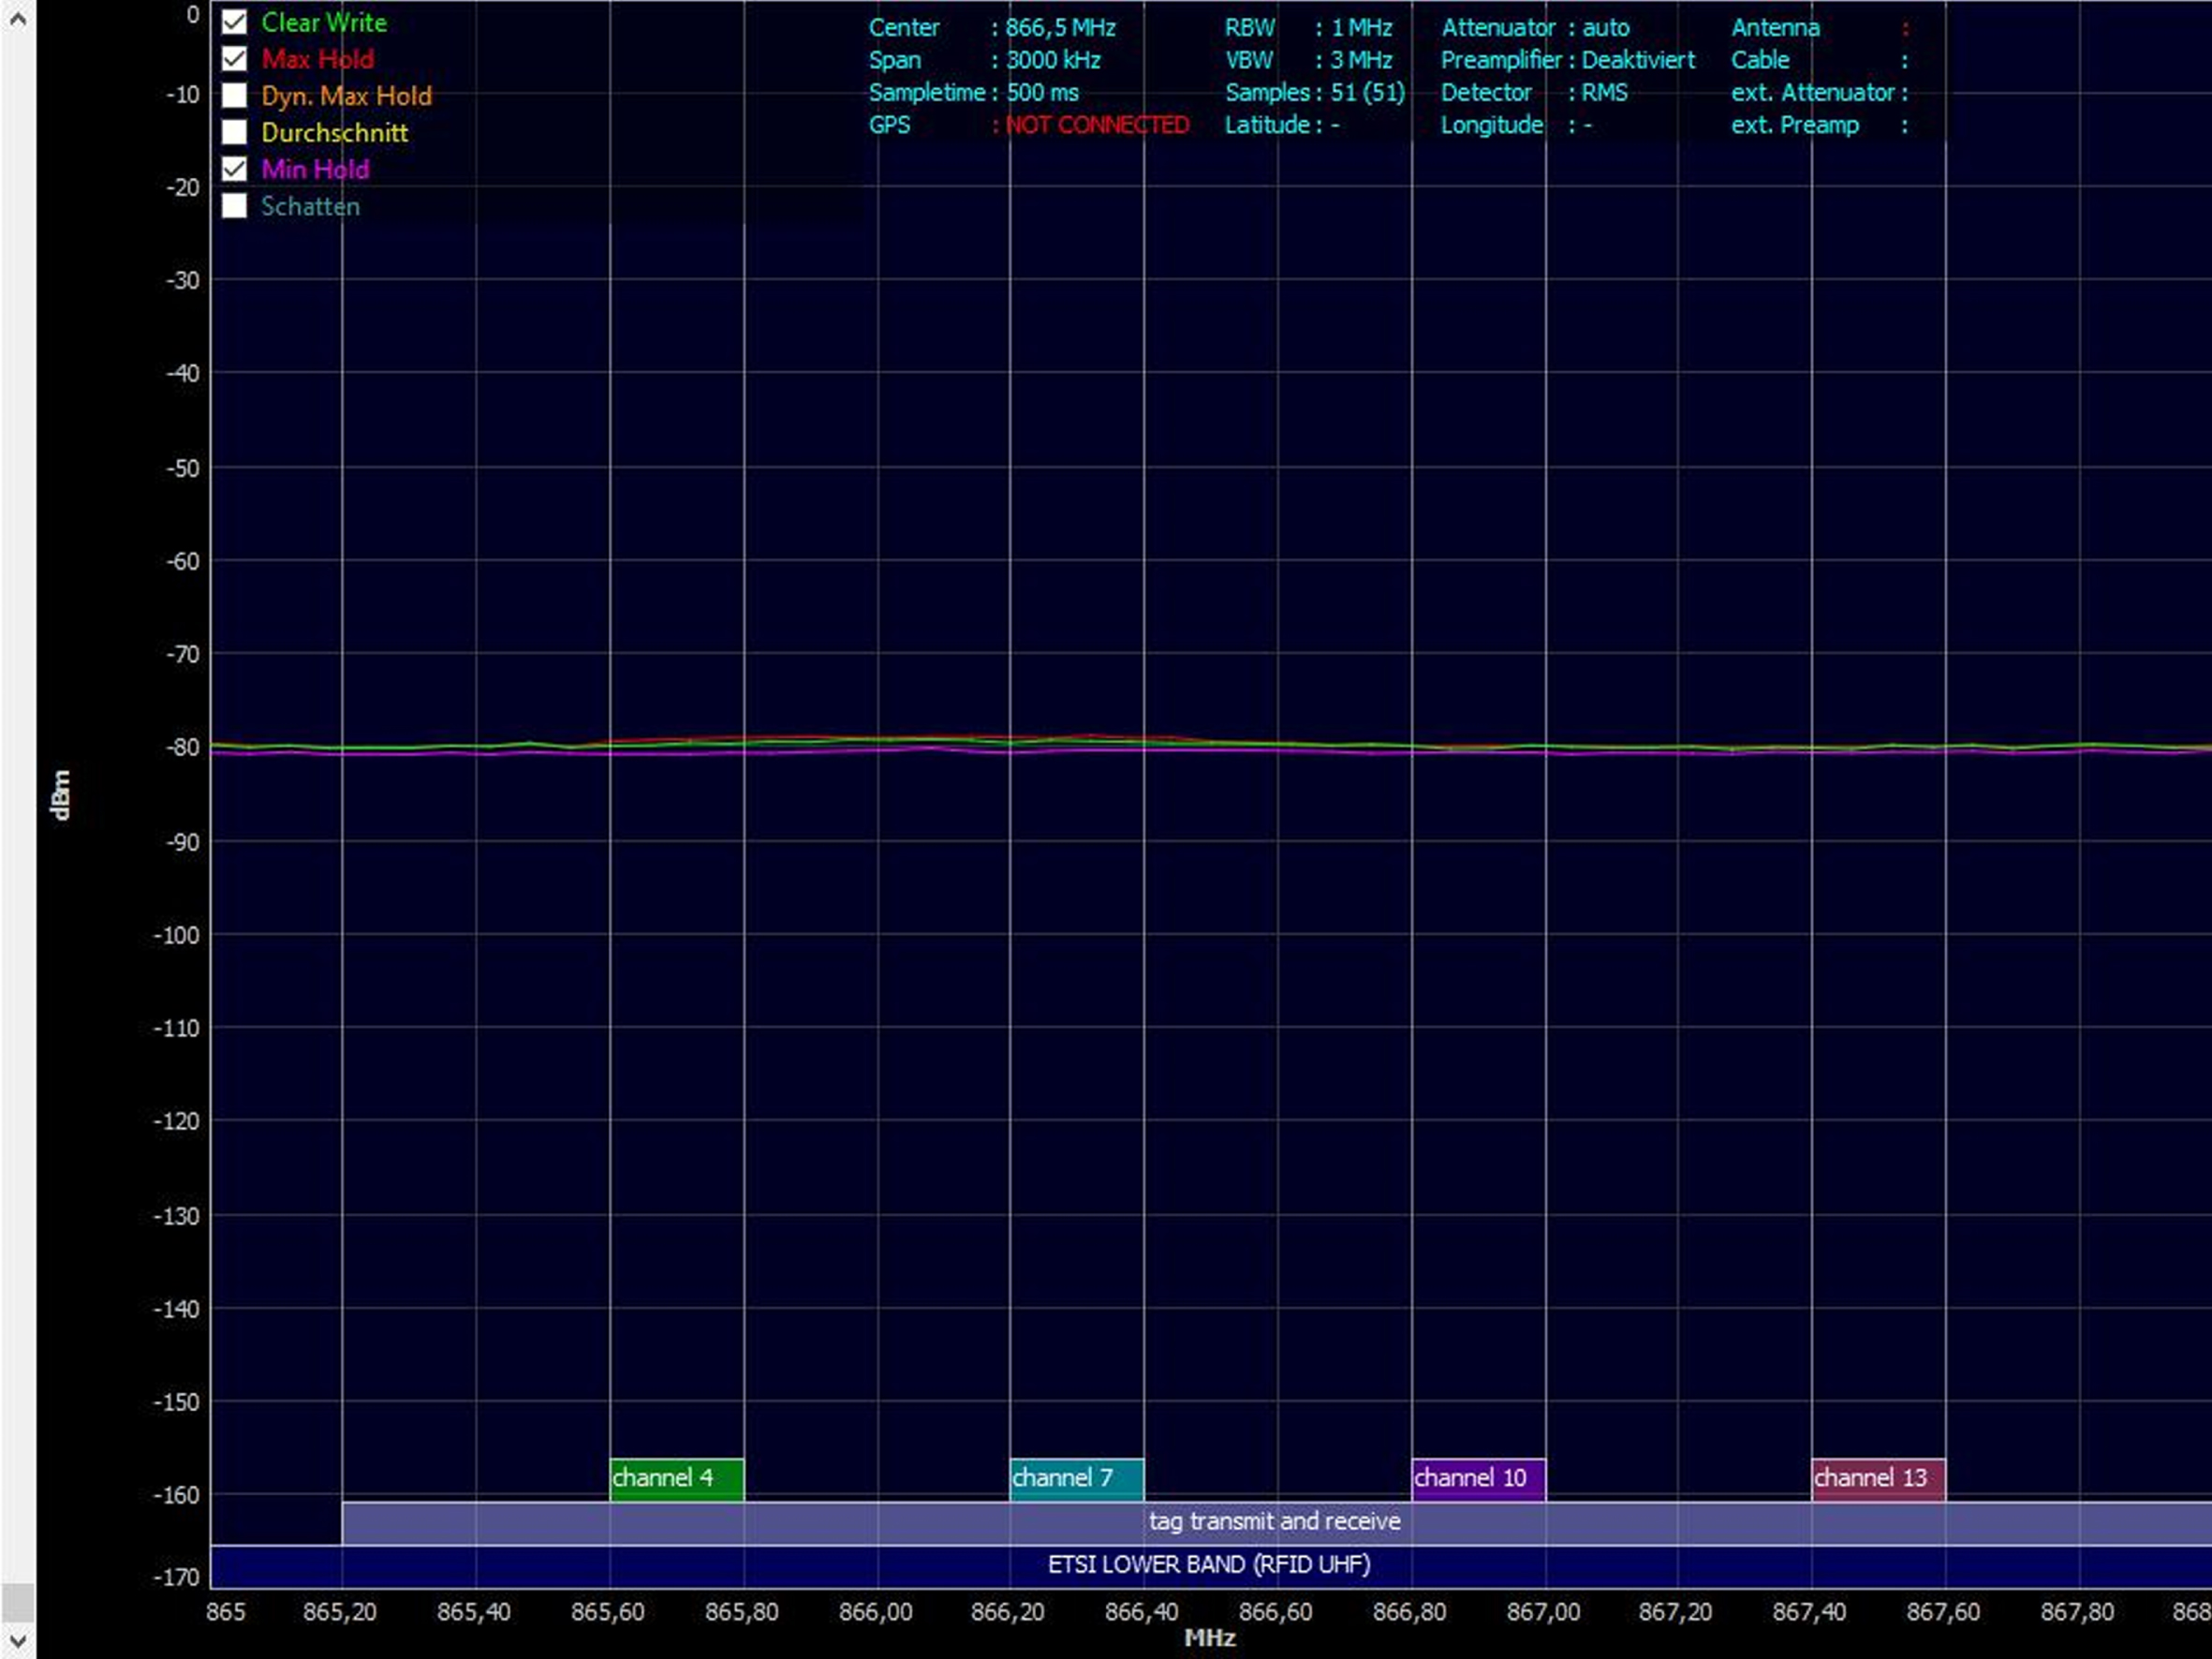
If the measured power is around –80 dBm or lower, it can be assumed that there is no interference from other electrical equipment or radios. We suggest this limit value because the ISO/IEC 18046-1 which contains RFID device performance test methods specifies in the test conditions for the RF environment that “spurious transmissions in functional band for the test must be less than –80 dBm” (International Organization for Standardization 2011). Therefore, at this limit value the performance of the RFID installation should not be influenced by signals in the environment. The other reason for this limit value are the measurements of the power in the UHF RFID frequency range inside the anechoic measurement cabinet at HFT Stuttgart (see Fig. 5) with almost closed door and at the RFID test centre of Mercedes Benz in Germany where no electrical devices or active RFID readers were placed in the vincity environment. The results of both measurements show that the max hold values are approximately –80 dBm (see Figs. 6 and 7).
Fig. 5
Antenna of the spectrum analyser inside the Measurement Cabinet at HFT Stuttgart.
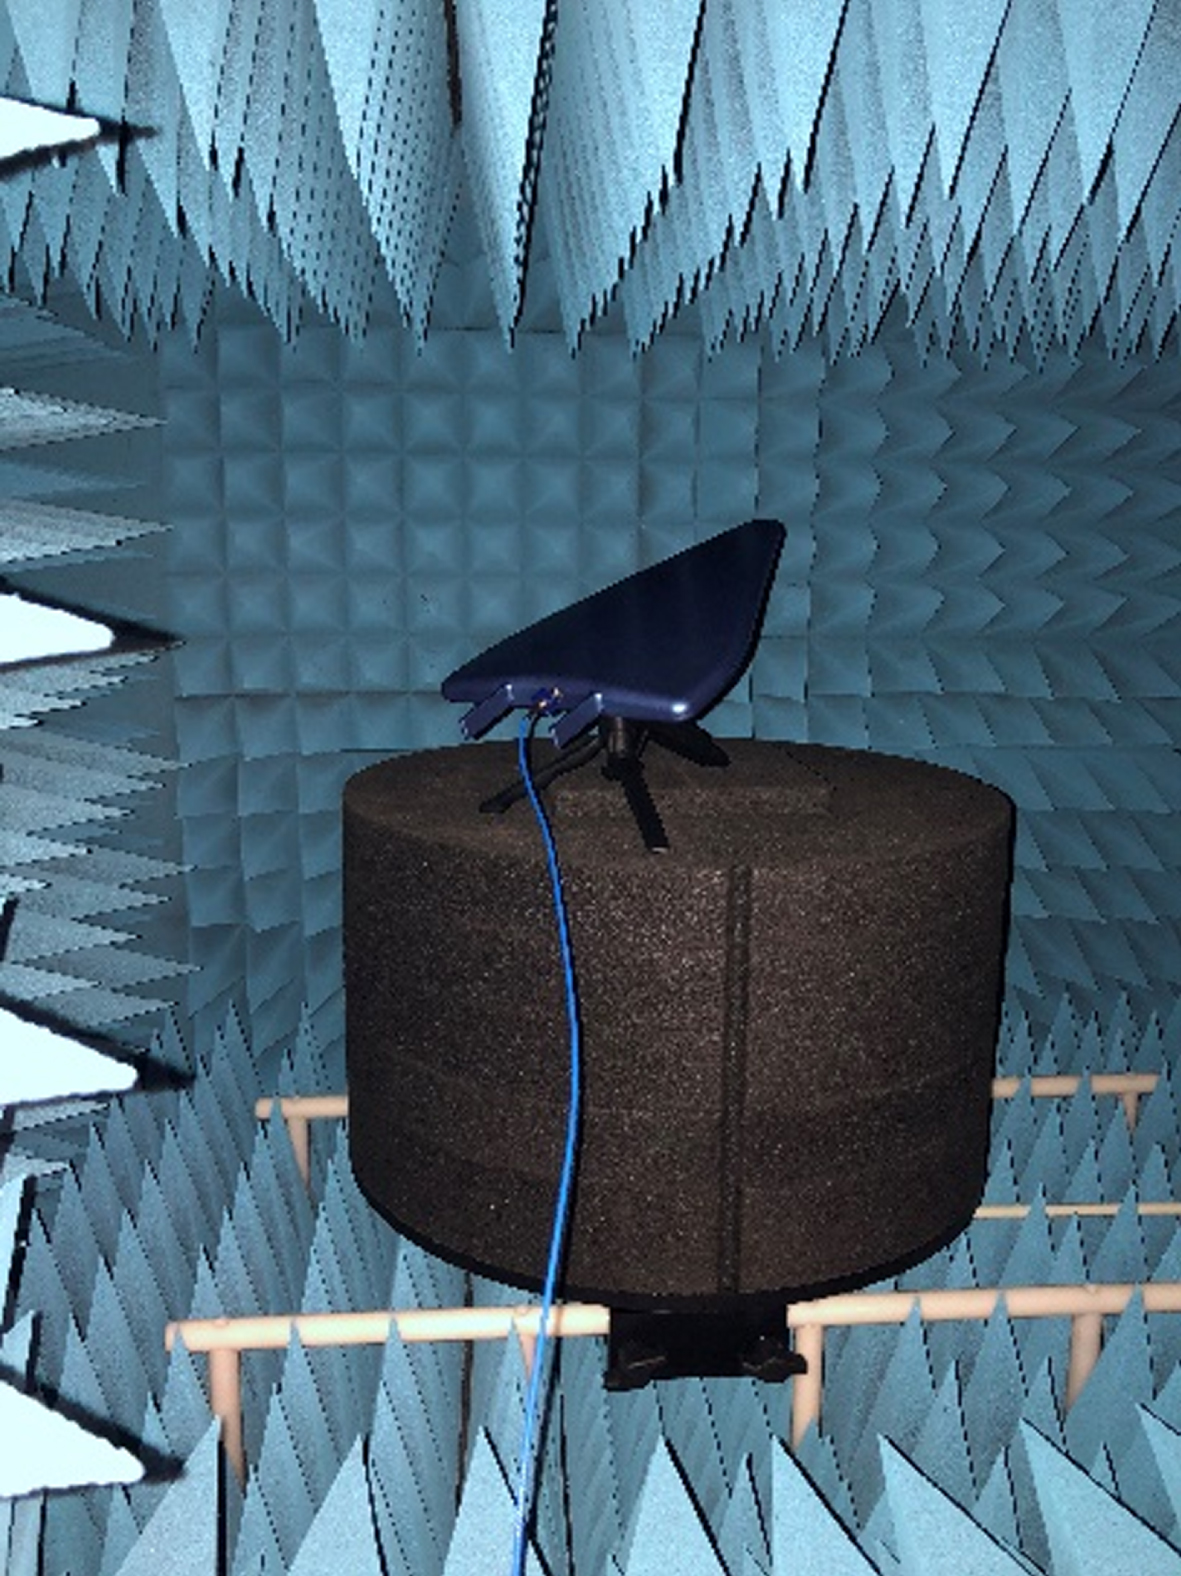
Fig. 6
Measurement of the power in the UHF RFID frequency range inside the Measurement Cabinet at HFT Stuttgart.
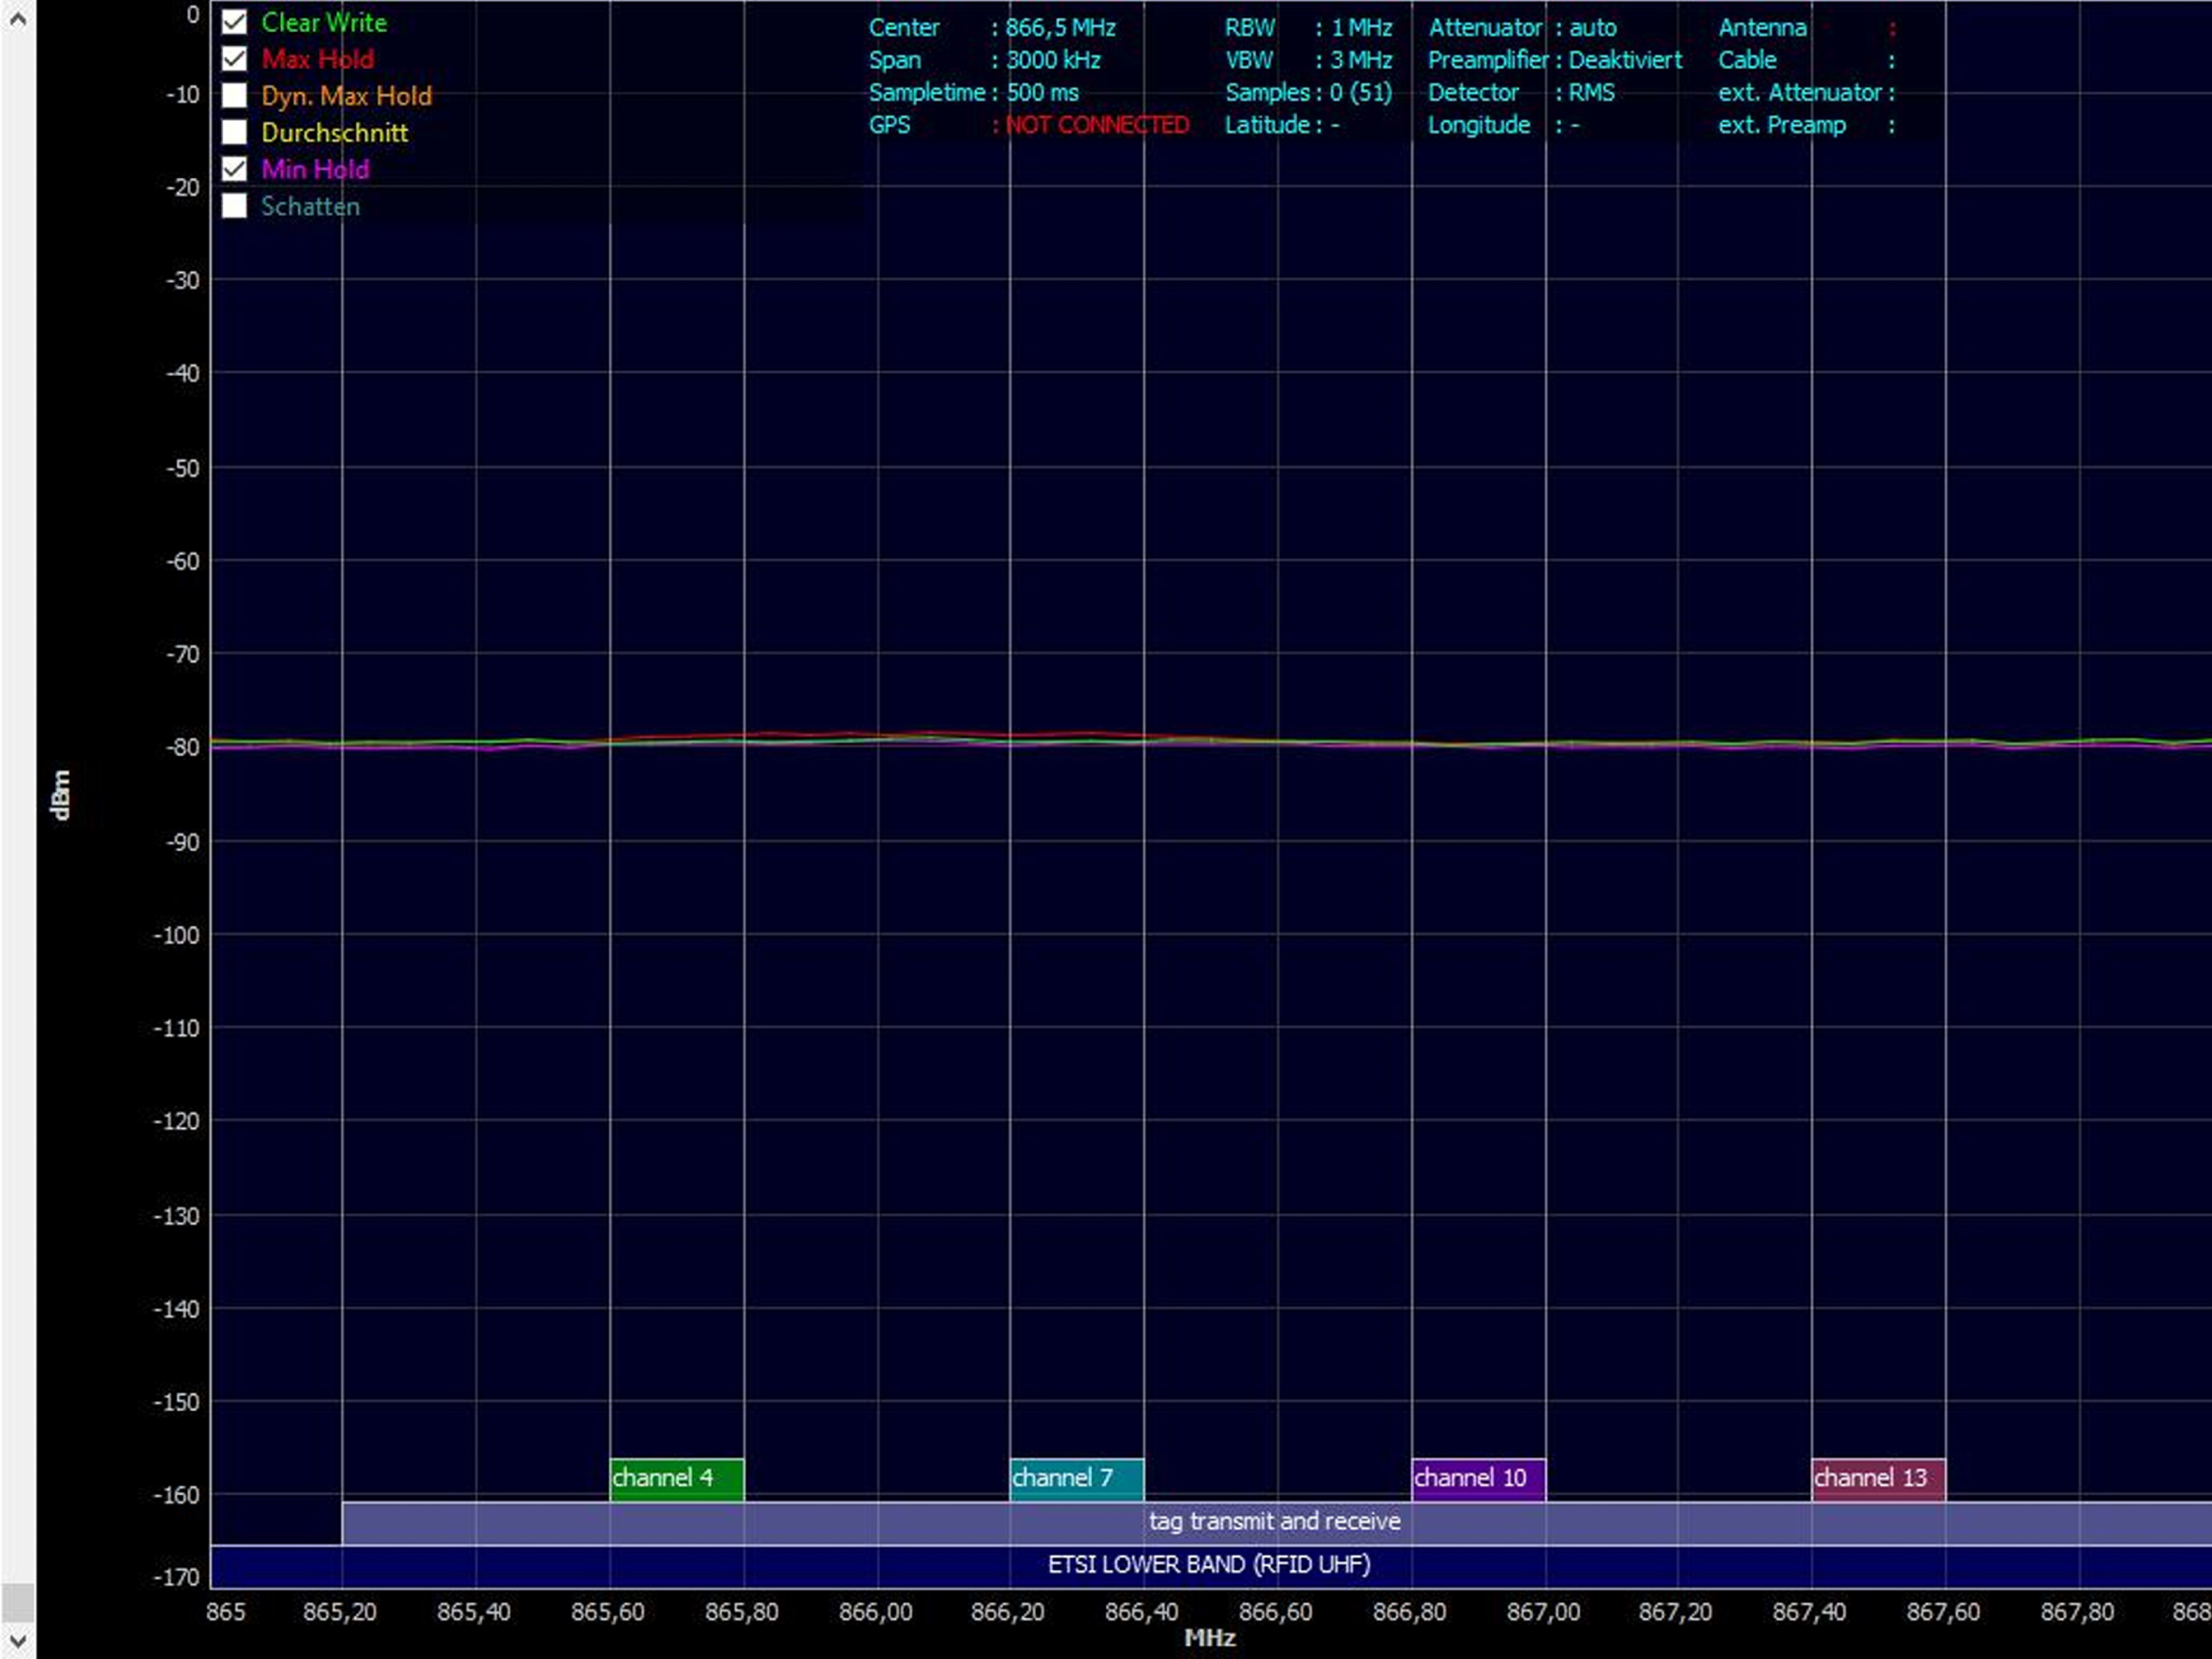
Fig. 7
Measurement of the power in the UHF RFID frequency range at the RFID testcenter.
Since the interference test is a snapshot, it can be repeated at another time if necessary. If signals with stronger power are measured, then all electrical devices in the vicinity of the RFID installation should be (temporarily) deactivated or removed or the RFID installation should be shielded and this test should be performed again to see if this has reduced the interference. In addition, the performance of the RFID installation should be measured again to identify the impact of the interference on the performance of the RFID installation.
6.2.3Reader-to-tag signal collision test
The aim of the test is to find out whether reader-to-tag signal collisions are a source of interference for the RFID installation.
Test environment
The test environment of this test is the place where the RFID installation is located.
Hardware and software
The RFID reader and associated software or middleware for reading RFID tags are required, as well as an RFID tag.
Test procedure
1) Deactivate the reader of the RFID installation.
2) Within the reading range of the deactivated reader, hold and move a tag to cover all possible positions and see if this tag is read by the RFID reader in the vicinity.
Interpretation of the test results
If the RFID tag, which is in the reading range of the RFID installation, is read by one or more other RFID readers, then their reading ranges overlap and reader-to-tag signal collisions can occur. In this case, the other RFID readers should be deactivated and the performance measured again. If the performance has not improved, then reader-to-tag signal collisions can be ruled out as a source of interference, otherwise they should be solved permanently (see paragraph 5).
If the tag is not read by other RFID readers, this is not a 100 percent guarantee that there are no reader-to-tag signal collisions and an additional measurement concept can be used to examine the reading field of an RFID installation as described in in (Lechner & Günthner 2016) or, if the required hardware is not available, deactivate the other RFID readers and measure the performance as described above.
6.2.4Reader interference test
The aim is to find out whether reader interference is a source of interference for the RFID installation. The prerequisite for this test is that reader-to-tag signal collisions and interference from other electrical devices or other radio signals have already been ruled out.
Test environment
The test must be carried out in the area of the RFID installation.
Hardware and software
A portable spectrum analyser suitable for the frequency range of the RFID installation and the corresponding software are required.
Test procedure
1) Deactivate the reader of the RFID installation.
2) Then the portable spectrum analyser must be put into operation as described in the corresponding manual and the frequency range used by the RFID installation must be set, e.g. 865.0 MHz–868.5 MHz.
3) In step 3 the frequency sweep measurement must be started and during the measurement the range of the RFID installation must be scanned and the antenna must be swivelled until the max hold values do not change any more.
4) Finally, the measurement results must be saved.
Interpretation of the test results
If the signals from other RFID readers have a power of more than –80 dBm, this can lead to reader interference (see section 6.2.2. for more details on this limit value). To find out the influence of this interference, all other RFID readers must be deactivated and the performance of the RFID installation measured again. If the performance has not improved, then the other readers can be ruled out as a source of interference and if the performance has improved, then the other readers are a source of interference and a permanent solution from paragraph 5 should be applied.
6.2.5Tag interference test
The aim is to find out whether tag interference is a source of interference for the RFID installation. The prerequisite for this test is that the carrier material has been excluded as a source of interference for the performance of the RFID installation. In order to detect tag interference and at the same time determine the optimal distance between tags, an experiment similar to the ones performed in (Segura-Velandia et al., 2016; Ding et al., 2017) is carried out in this test.
Test environment
The test should be performed in an environment, e.g. test centre, where sources of interference from the environment can be excluded.
Hardware and software
An RFID reader and associated middleware or software that can measure the RSSI values of the RFID tags are required.
Test procedure
1) During the measurement of the performance of the RFID installation, the RSSI values must be read and stored when reading the RFID tags.
2) Then the tags are placed further apart.
3) The performance and RSSI values are measured and stored again.
4) This procedure can be repeated for several distances.
Interpretation of the test results
If the RSSI values of the RFID tags and performance improve significantly at greater distance, it means that there is tag interference at close distance. With this experiment, the optimal distances can be determined at the same time in order to eliminate this source of interference.
6.2.6Absorption test
The aim is to find out what influence the absorbing / reflecting objects or materials between the RFID reader and the tags have.
Test environment
The test environment is the place where the RFID installation is located.
Hardware and software
The RFID reader, associated middleware or software and RFID tags are required.
Test procedure
1) Remove absorbent / reflective materials or objects between the RFID tags and the RFID reader or replace them with neutral materials, e.g. plastic or foam.
2) The performance of the RFID installation must then be measured.
Interpretation of the test results
If the performance of the RFID installation has improved without the absorbing / reflecting objects or materials, then this is a source of interference.
6.2.7Environmental impact test
The aim of the test is to identify environmental influences and their effects. For this purpose, an experiment is carried out in this test, similar to (Kim et al., 2017; Zhenzhong et al., 2011).
Test environment
The test must be carried out in a climate chamber.
Hardware and software
The RFID reader with associated middleware or software and RFID tags are required.
Test procedure
1) First, the RFID tags and the RFID reader are positioned in the climate chamber.
2) Measure the temperature, humidity and salt content of the air of the RFID installation.
3) Set the measured temperature, humidity and salt content of the air in the climate chamber.
4) Measure and store the read rate or backscatter signal of the RFID tags.
5) Gradually increase and decrease each parameter (temperature, humidity or salt content of the air) and repeat step 4.
Interpretation of the test results
The results must then be compared with each other at different temperatures, different humidity or different salt content of the air. If the read rate or the backscatter signal is better in other environmental conditions than in the RFID installation, the environmental influences are a source of interference. In this case, look for hardware that is suitable for these environmental influences and carry out the test with it again.
6.2.8Reflection test
The aim of this test is to determine the influence of reflections on the performance of the RFID installation.
Test environment
The test is carried out in the area of the RFID installation.
Hardware and software
The RFID reader with associated middleware or software and RFID tags of the RFID installation are required.
Test procedure
1) Measure the performance of the RFID installation.
2) Metallic objects and materials must be covered with shielding material or removed.
3) Measure the performance of the RFID installation again.
Interpretation of the test results
If the performance has improved with the shielding of the metallic objects and materials, then this is a source of interference and a permanent solution should be applied (see paragraph 5). To make a more accurate test where reflections lead to reading holes or overreach, the measurement concept described in (Lechner & Günthner, 2016) can be used to measure the exact reading field of the antennas.
6.3Verifications of the Tests to identify Sources of Interference
In this section, some of the previously described tests are applied to show how they are carried out in practice and to verify the tests. For this purpose, real RFID applications are used or RFID applications are imitated and the different sources of interference are simulated.
6.3.1Verification of the carrier material test
RFID application and setup of the RFID installation
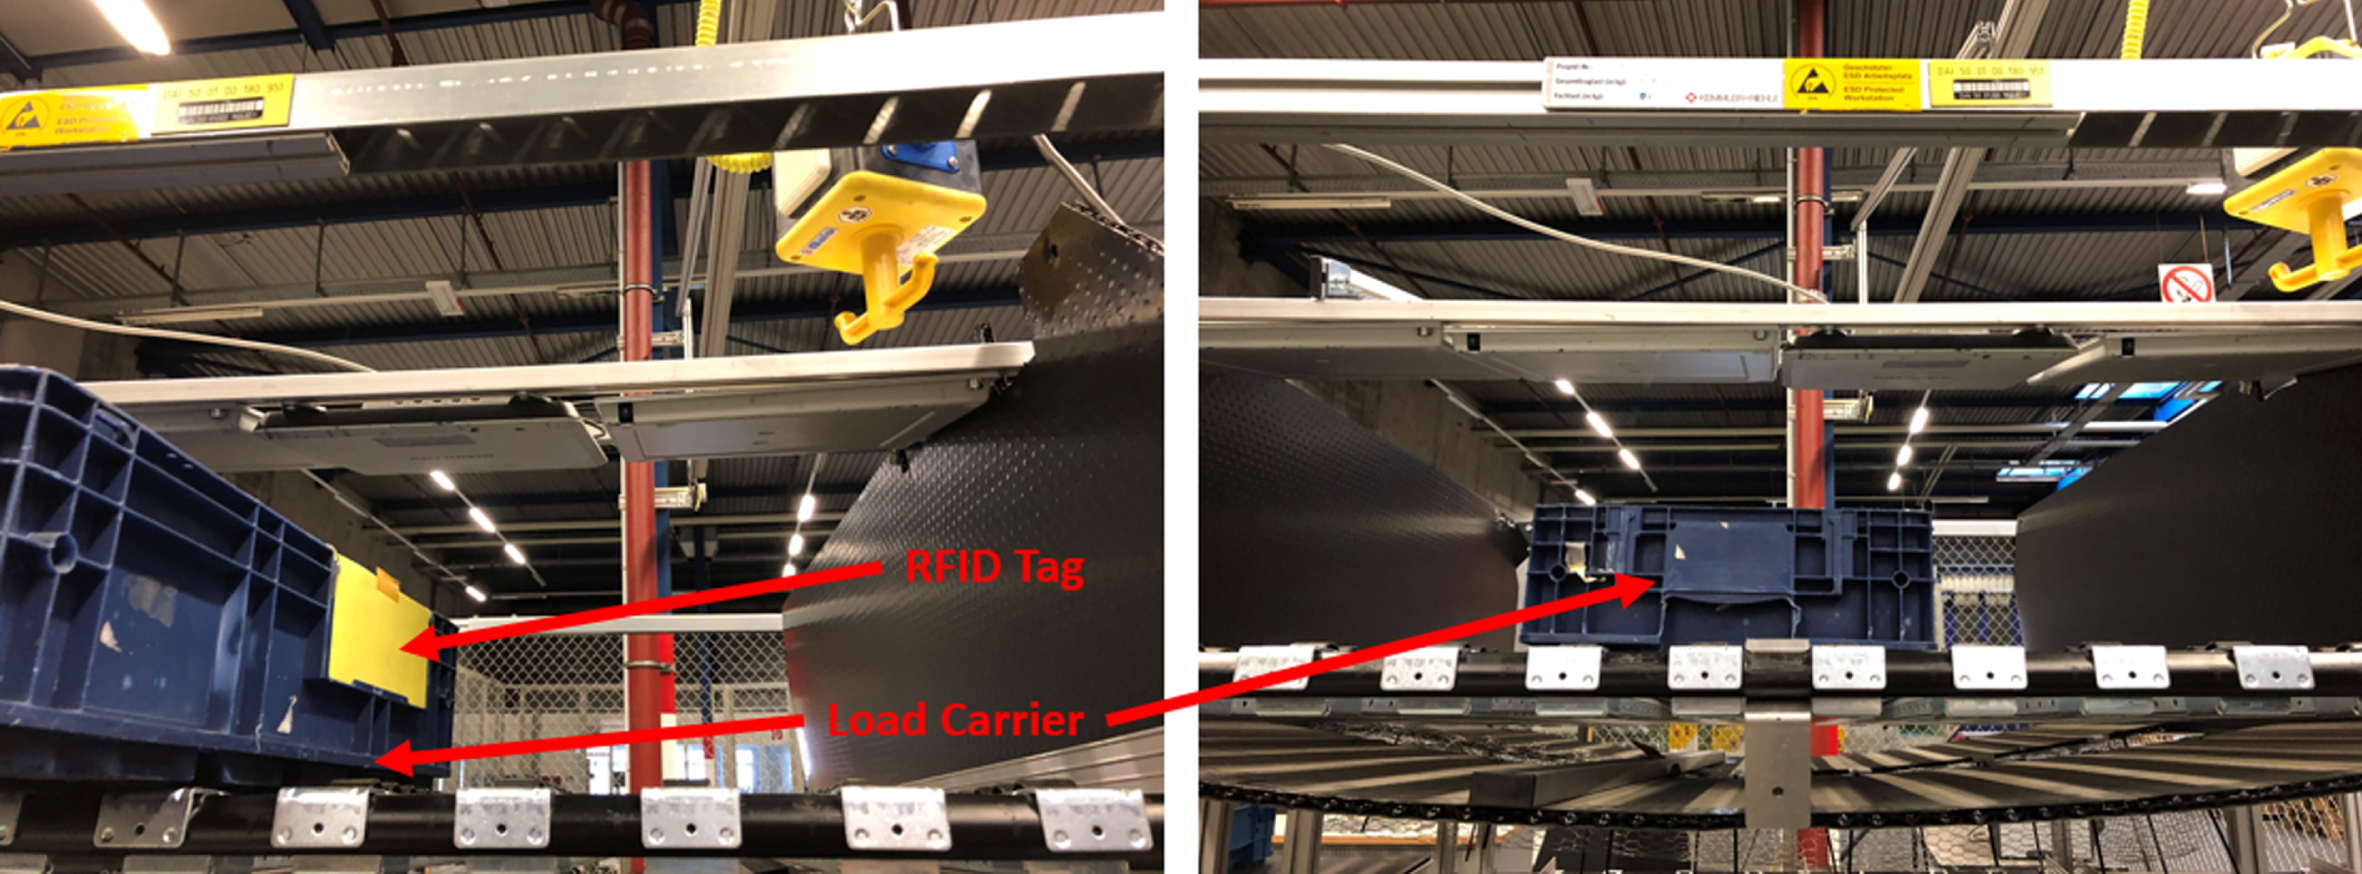
The carrier material test is verified using the RFID application automatic material retrieval with RFID reader on the shelf. This application is used, for example, on the assembly line in the automotive industry. The prerequisite for this application is that all load carriers are equipped with RFID tags. The RFID tag used for this verification is the Confidex eKanban Single Label. An RFID installation for this application is shown in Figs. 8 and 9 The full load carriers are placed in the lower rails of the shelf and the empty load carriers are placed in the empty rail at the top. Above the empty rail is the RFID reader ARU 2400 from Kathrein, which itself contains an antenna and three additional external antennas. As soon as an empty load carrier is placed in the empty rail, it slides to the back and its RFID tag is read and the correct material is automatically reordered.
Fig. 8
Shelf with RFID reader and external antennas.
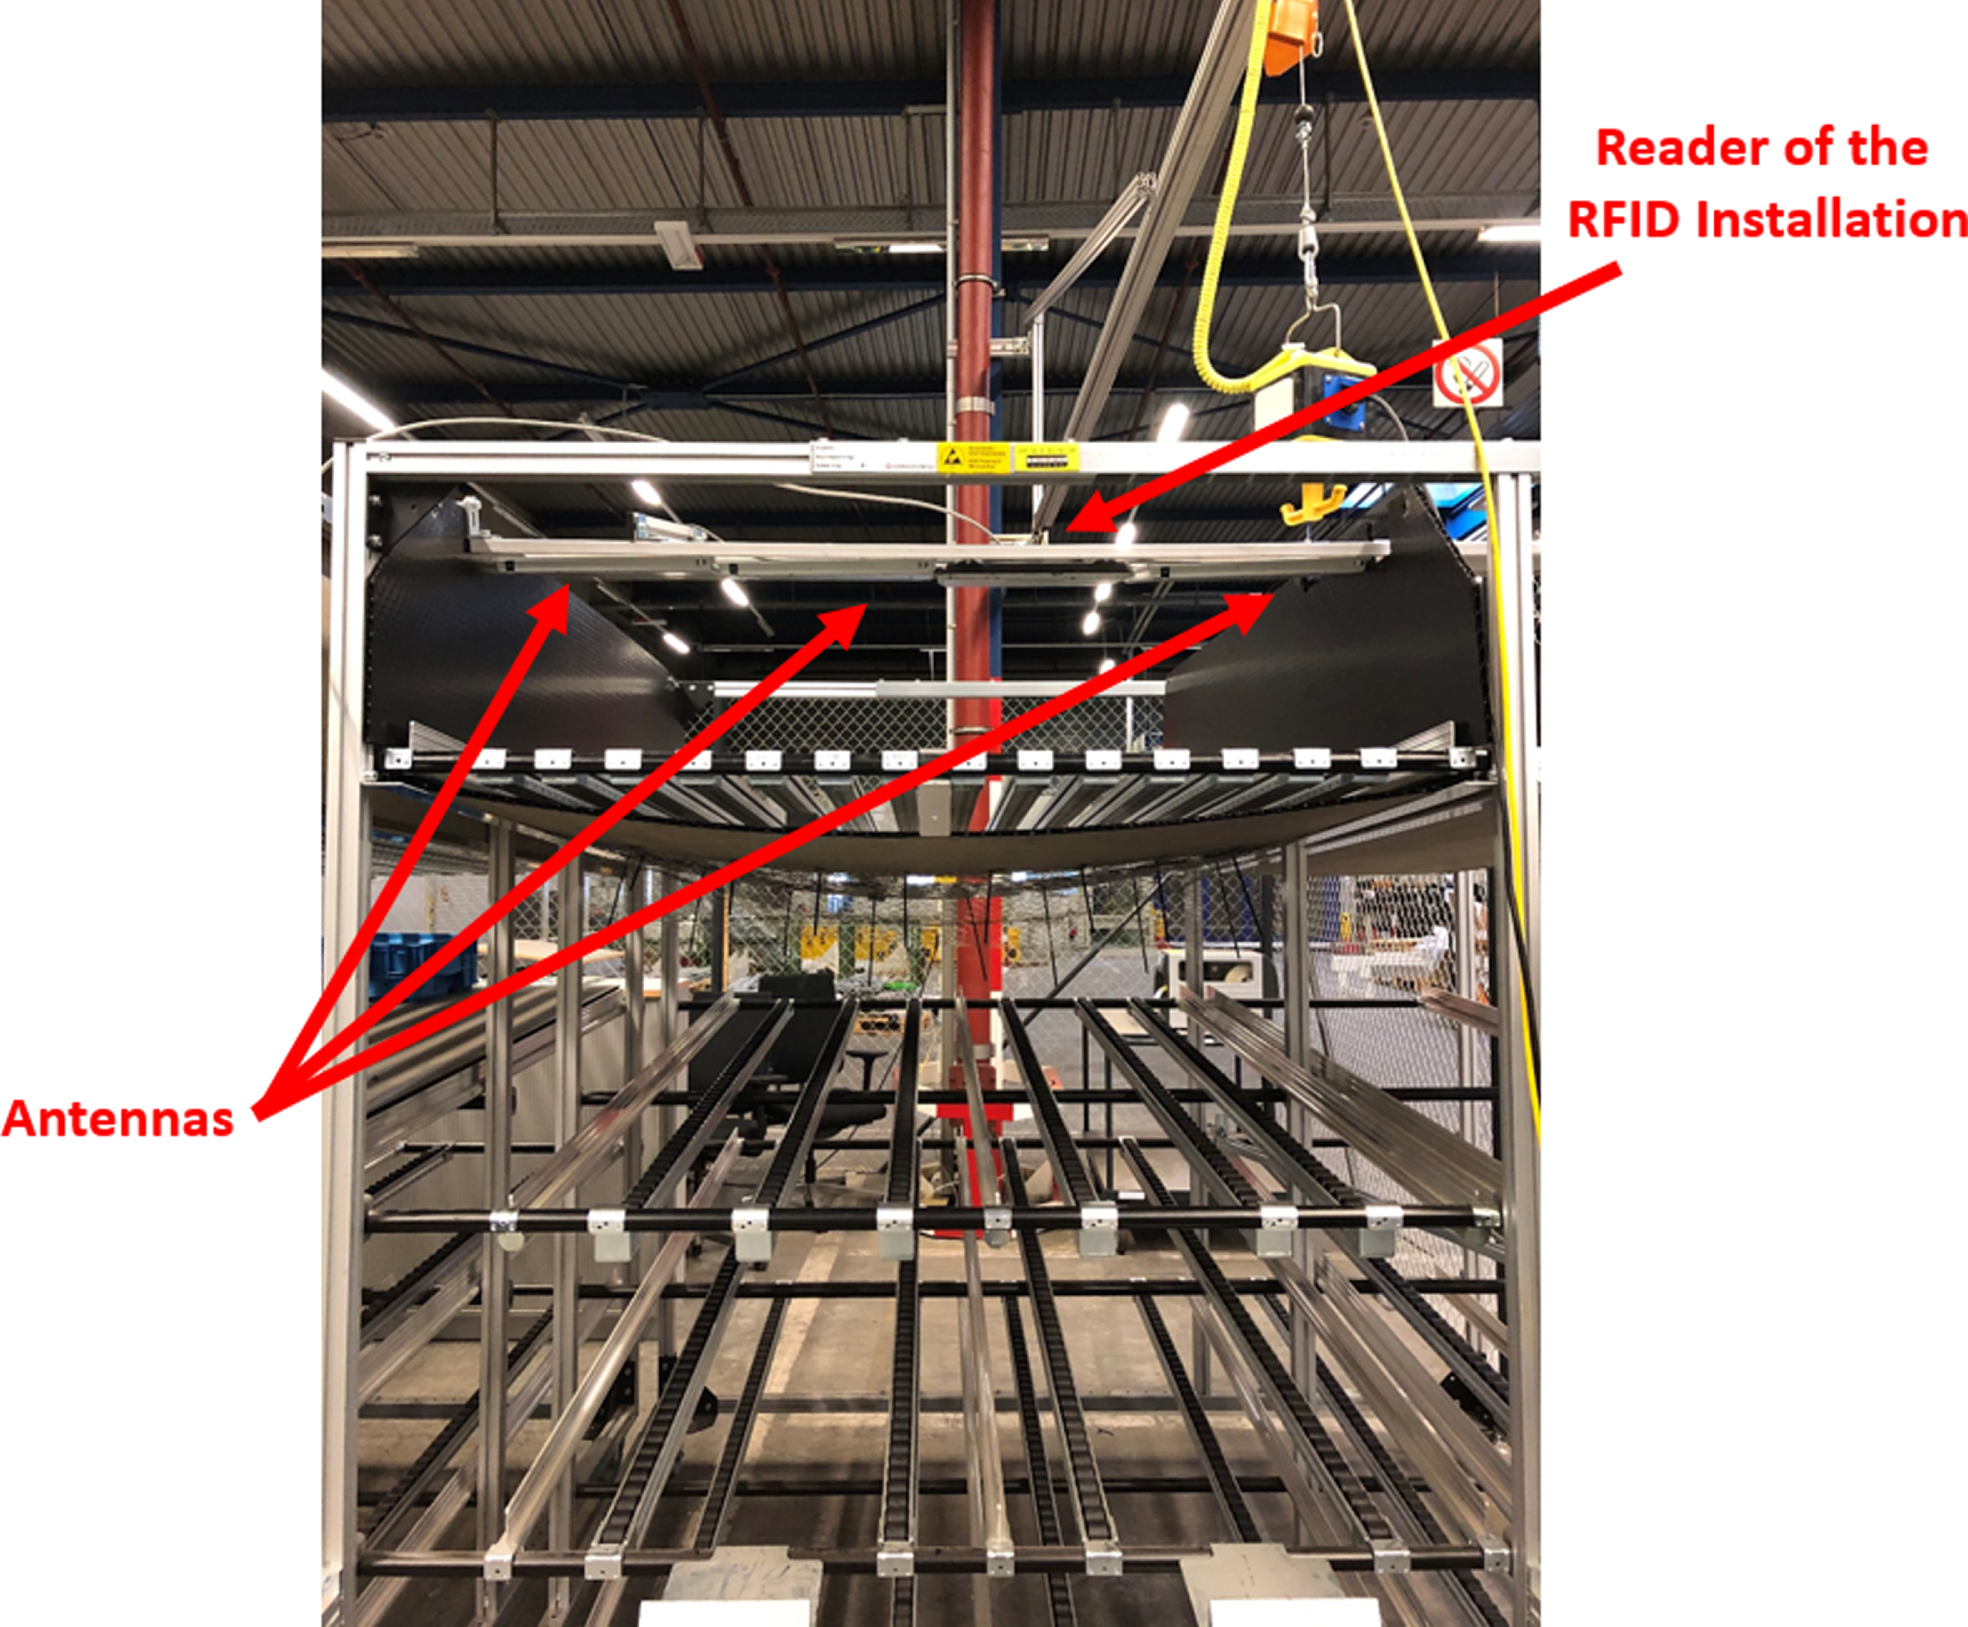
Fig. 9
Process of how a load carrier is pushed into the shelf.
Simulation of the source of interference
For the verification of this test, the interference source carrier material is simulated by a so-called ESD (electrostatic discharge) load carrier, which consists of electrically conductive plastic and protects against ESD (electrostatic discharge).
Start Trigger
Fig. 10
Reader settings of the RFID installation reader.
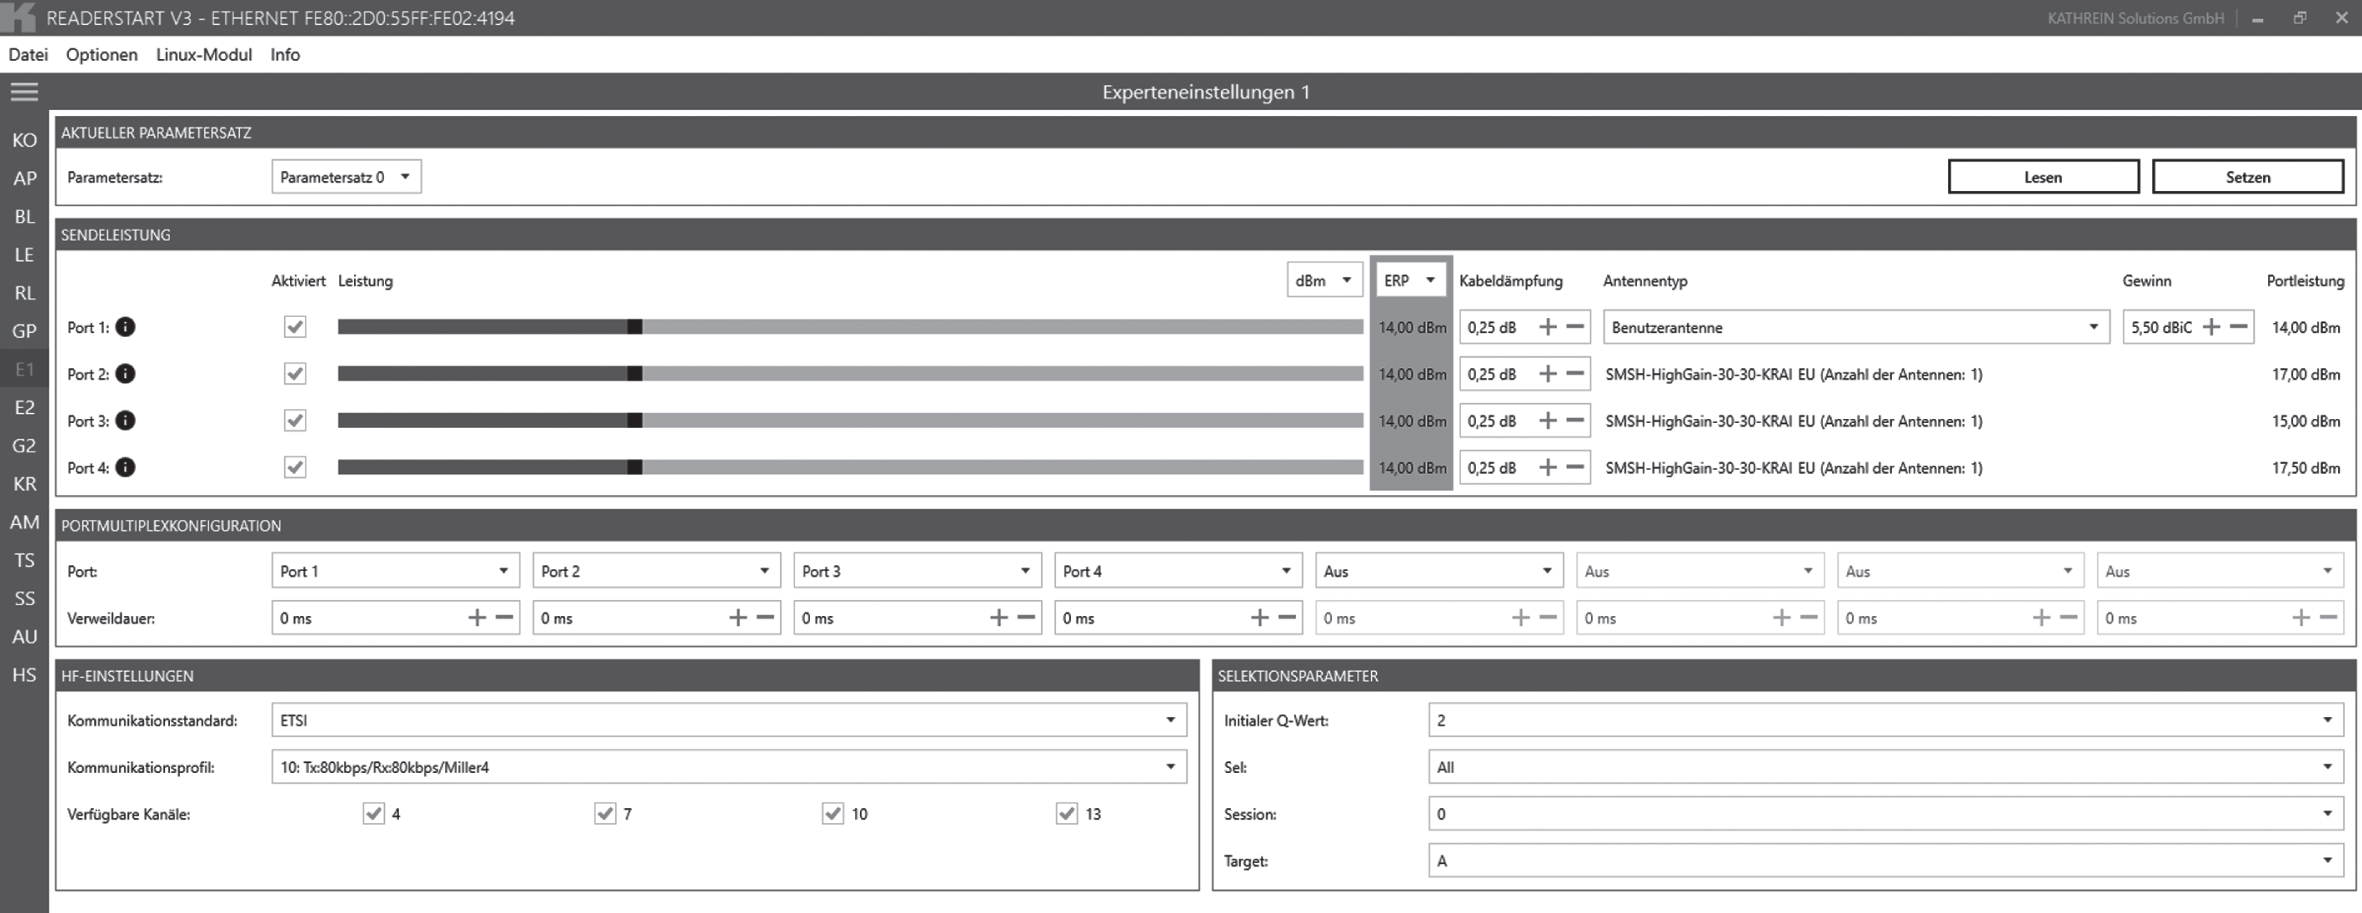
Start trigger for carrying out the procedure to identify the source of interference could be, for example, insufficient performance of the RFID installation, which is noticeable in practice by missing material that has not been automatically reordered.
Procedure
1) The number of readings of the RFID tag per pass-through of the load carrier is used as the performance of the RFID installation, as this is an indicator of the stability of the process, and for this verification the number of readings should be on average at least 20.
2) In the second step, the performance of the RFID installation is measured. The RFID reader is configured as shown in Fig. 10, and an ESD small load carrier 61151The VDA (Verband der Automobilindustrie) has specified small load carriers and their properties, such as size and colour, in VDA 4500 (Verband der Automobilindustrie 2015a) and VDA 4504 (Verband der Automobilindustrie 2015b). is pushed through the shelf 5 times and the average number of reads is evaluated. The ESD load carrier is read 13 times on average (see Table 6) and therefore the performance is lower than defined.
3) As this RFID installation is located in a test centre, only question 1 “Is the carrier object or the content of the object made of metal, ESD, glass or conductive liquids or other absorbent or reflective materials?” is answered with yes.
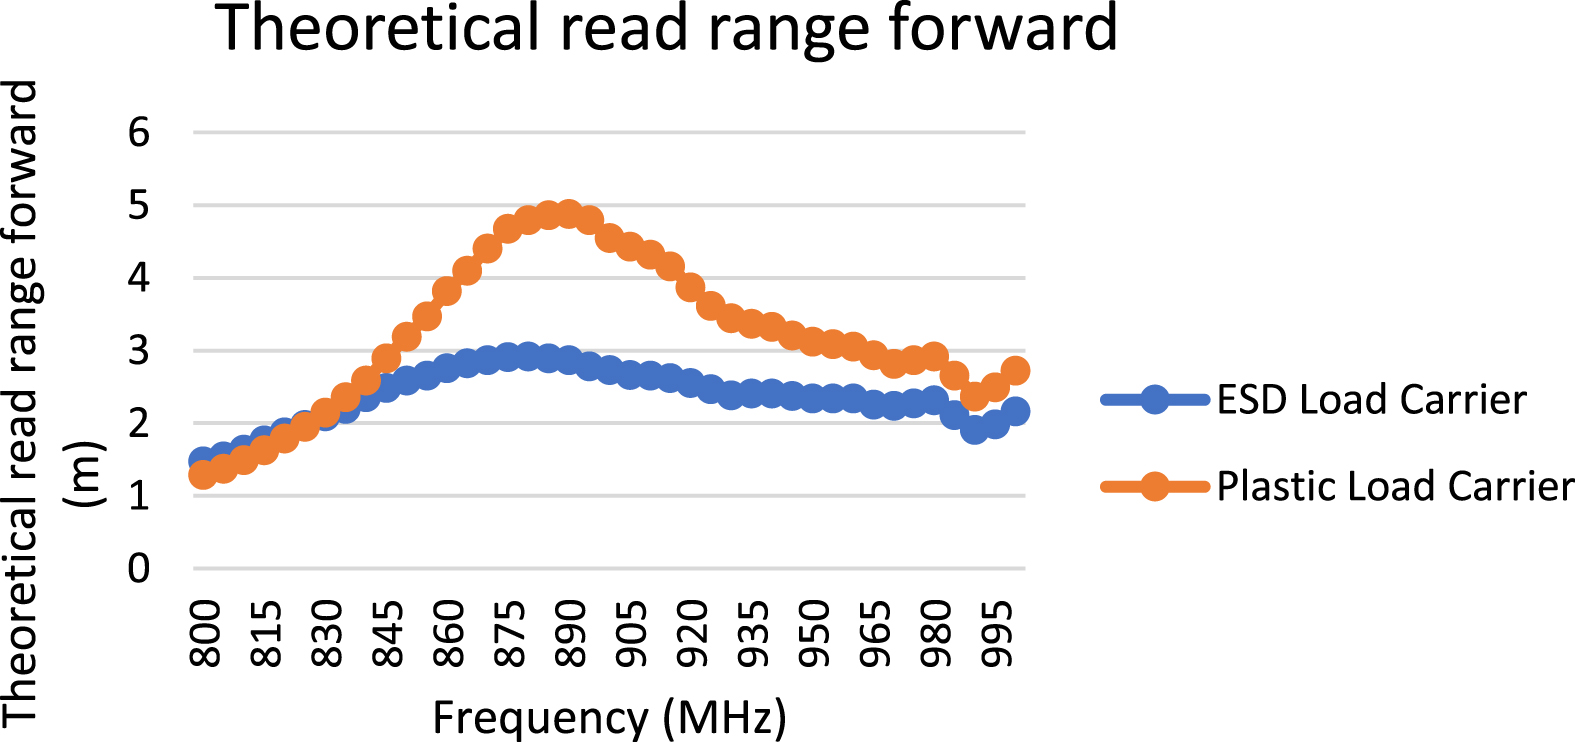
4) The carrier material test is performed in the RFID measurement chamber of the HFT Stuttgart, Germany (see Fig. 11), as described in section 6.2.1. This means that the same RFID label as used for the performance measurement is first attached to an ESD load carrier and placed in the measurement chamber. Then the frequencies (800–1000 MHz) are set and the threshold measurement is started in the Tagformance software. After that, the same RFID label is stuck onto a plastic carrier (neutral carrier material) and the threshold measurement is repeated. Since the load carriers used for the material retrieval are too large for the RFID measurement chamber, two smaller plastic (3215) and ESD (3115) load carriers were used as a substitute. The diagram in Fig. 12 shows the power required to activate the RFID tag. It can be clearly seen that less power is required when the RFID tag is attached to the plastic load carrier than when the load carrier is made of electrically conductive plastic. The power of the backscatter signal is similar for both carrier materials (see Fig. 13), since, as can be seen in the diagram above, different powers were set on the reader. The diagram in Fig. 14 clearly shows that the theoretical reading range for the label on the plastic load carrier is significantly higher than for the label on the ESD load carrier. These test results clearly show that the carrier material of the ESD load carrier is obviously a source of interference. Therefore, the interference source carrier material is eliminated by using the plastic load carrier 6415, which has the same dimensions as the ESD load carrier 6115 and also the label position is exactly the same as in the first performance measurement. As an alternative solution, another RFID tag, which is specially designed for ESD load carriers, could of course also be used. To identify the influence of the source of interference, the performance is measured again as described above. The number of readings has increased significantly with the plastic load carrier and averages 38.8 (see Table 6), which means that the defined performance has been achieved and the procedure can be terminated.
Table 6
Results of the measurement of the number of reads
| Pass | 1 | 2 | 3 | 4 | 5 | Ø |
| ESD load carrier | 10 | 32 | 8 | 8 | 7 | 13 |
| Plastic load carrier | 35 | 29 | 50 | 44 | 36 | 38.8 |
Fig. 11
Plastic load carrier with RFID label in the measurement chamber at the HFT Stuttgart.
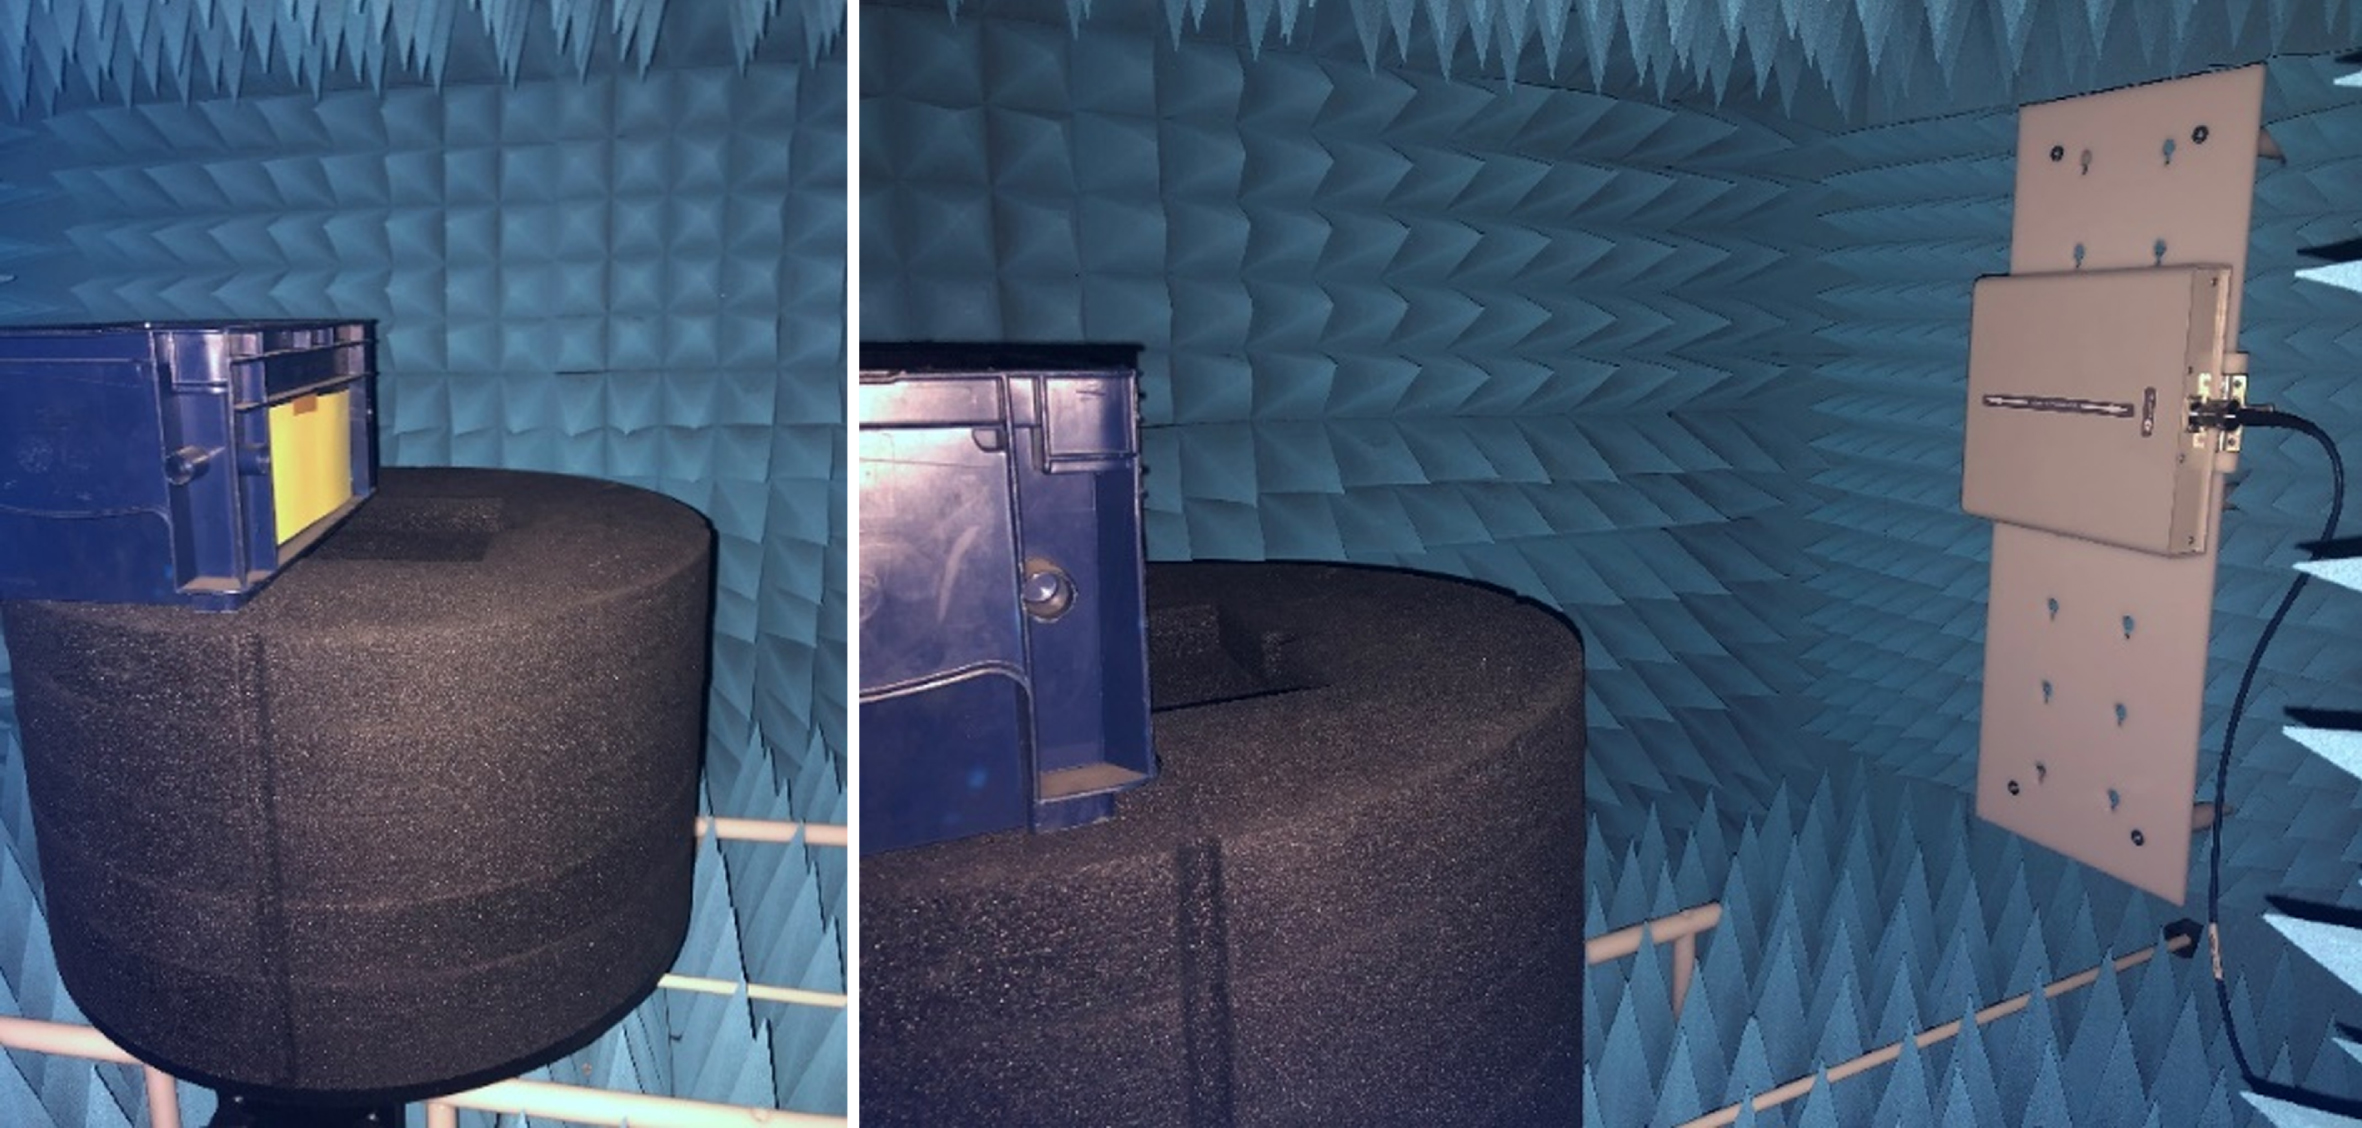
Fig. 12
Transmitted power ESD vs. plastic load carrier.
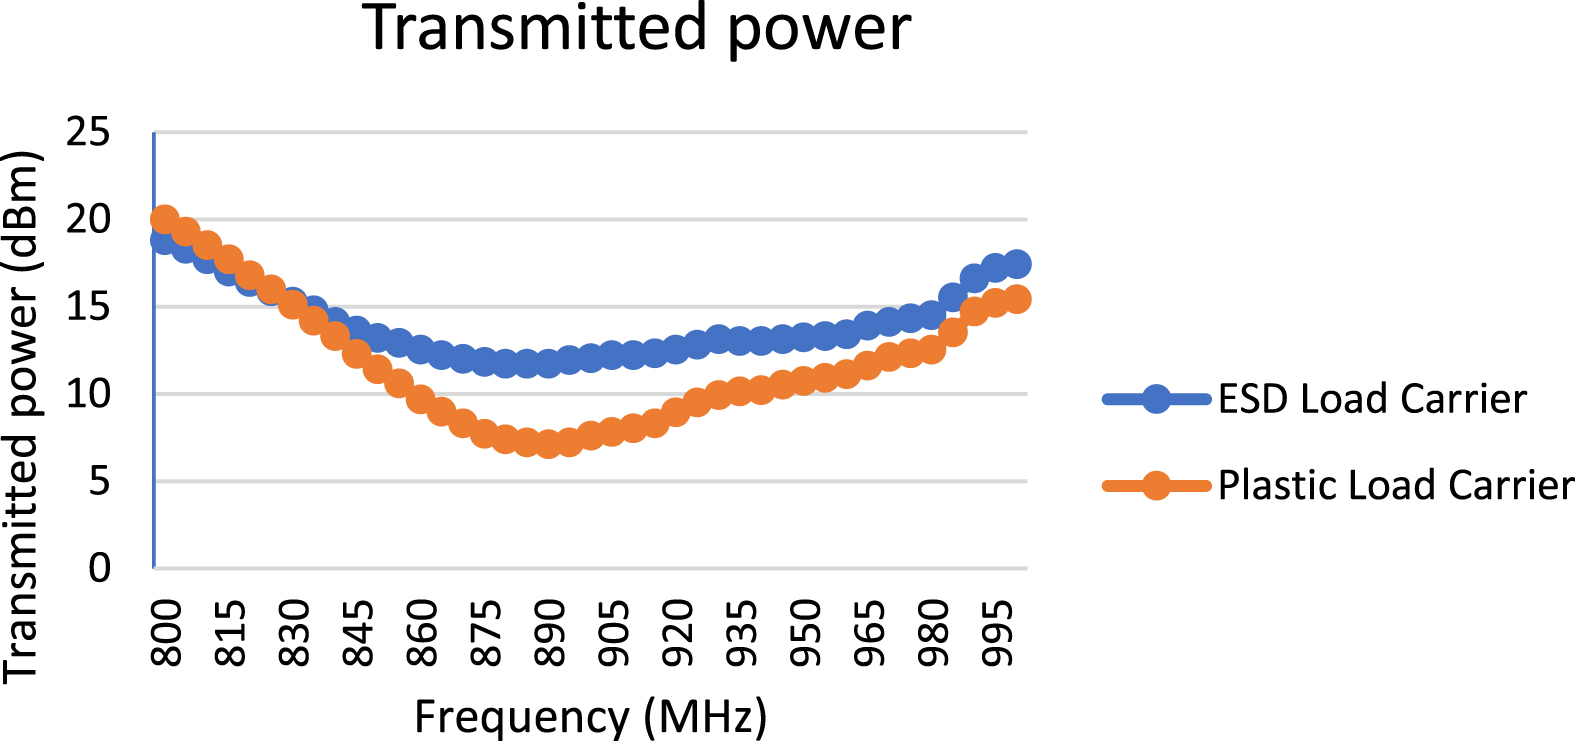
Fig. 13
Backscatter power ESD vs. plastic load carrier.
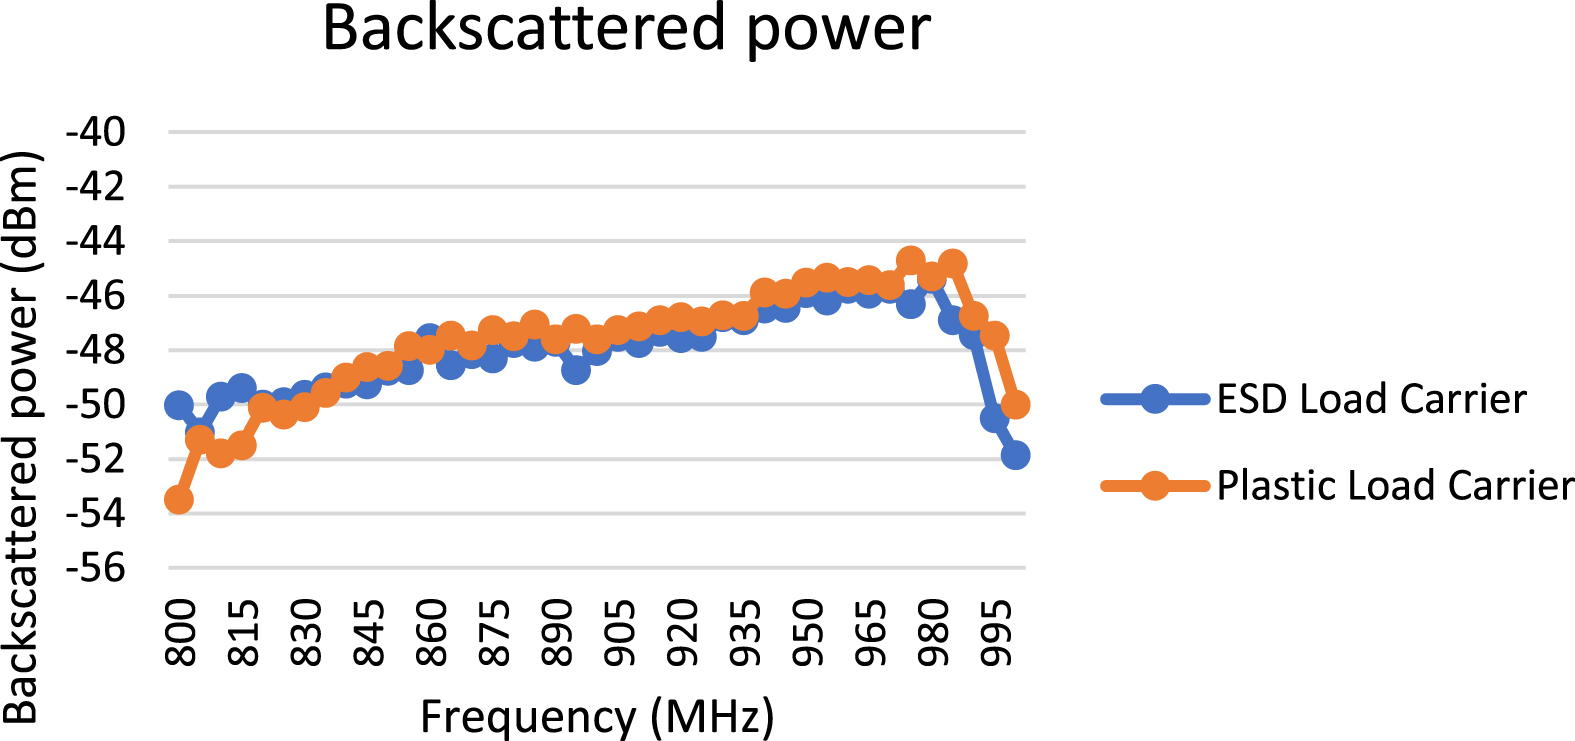
Fig. 14
Theoretical read range forward ESD vs. plastic load carrier.
Conclusion
This verification shows that the interference source carrier material could be clearly identified by this test and that the performance has improved significantly by eliminating the interference source.
6.3.2Verification of the reader interference test
RFID application and setup of the RFID installation
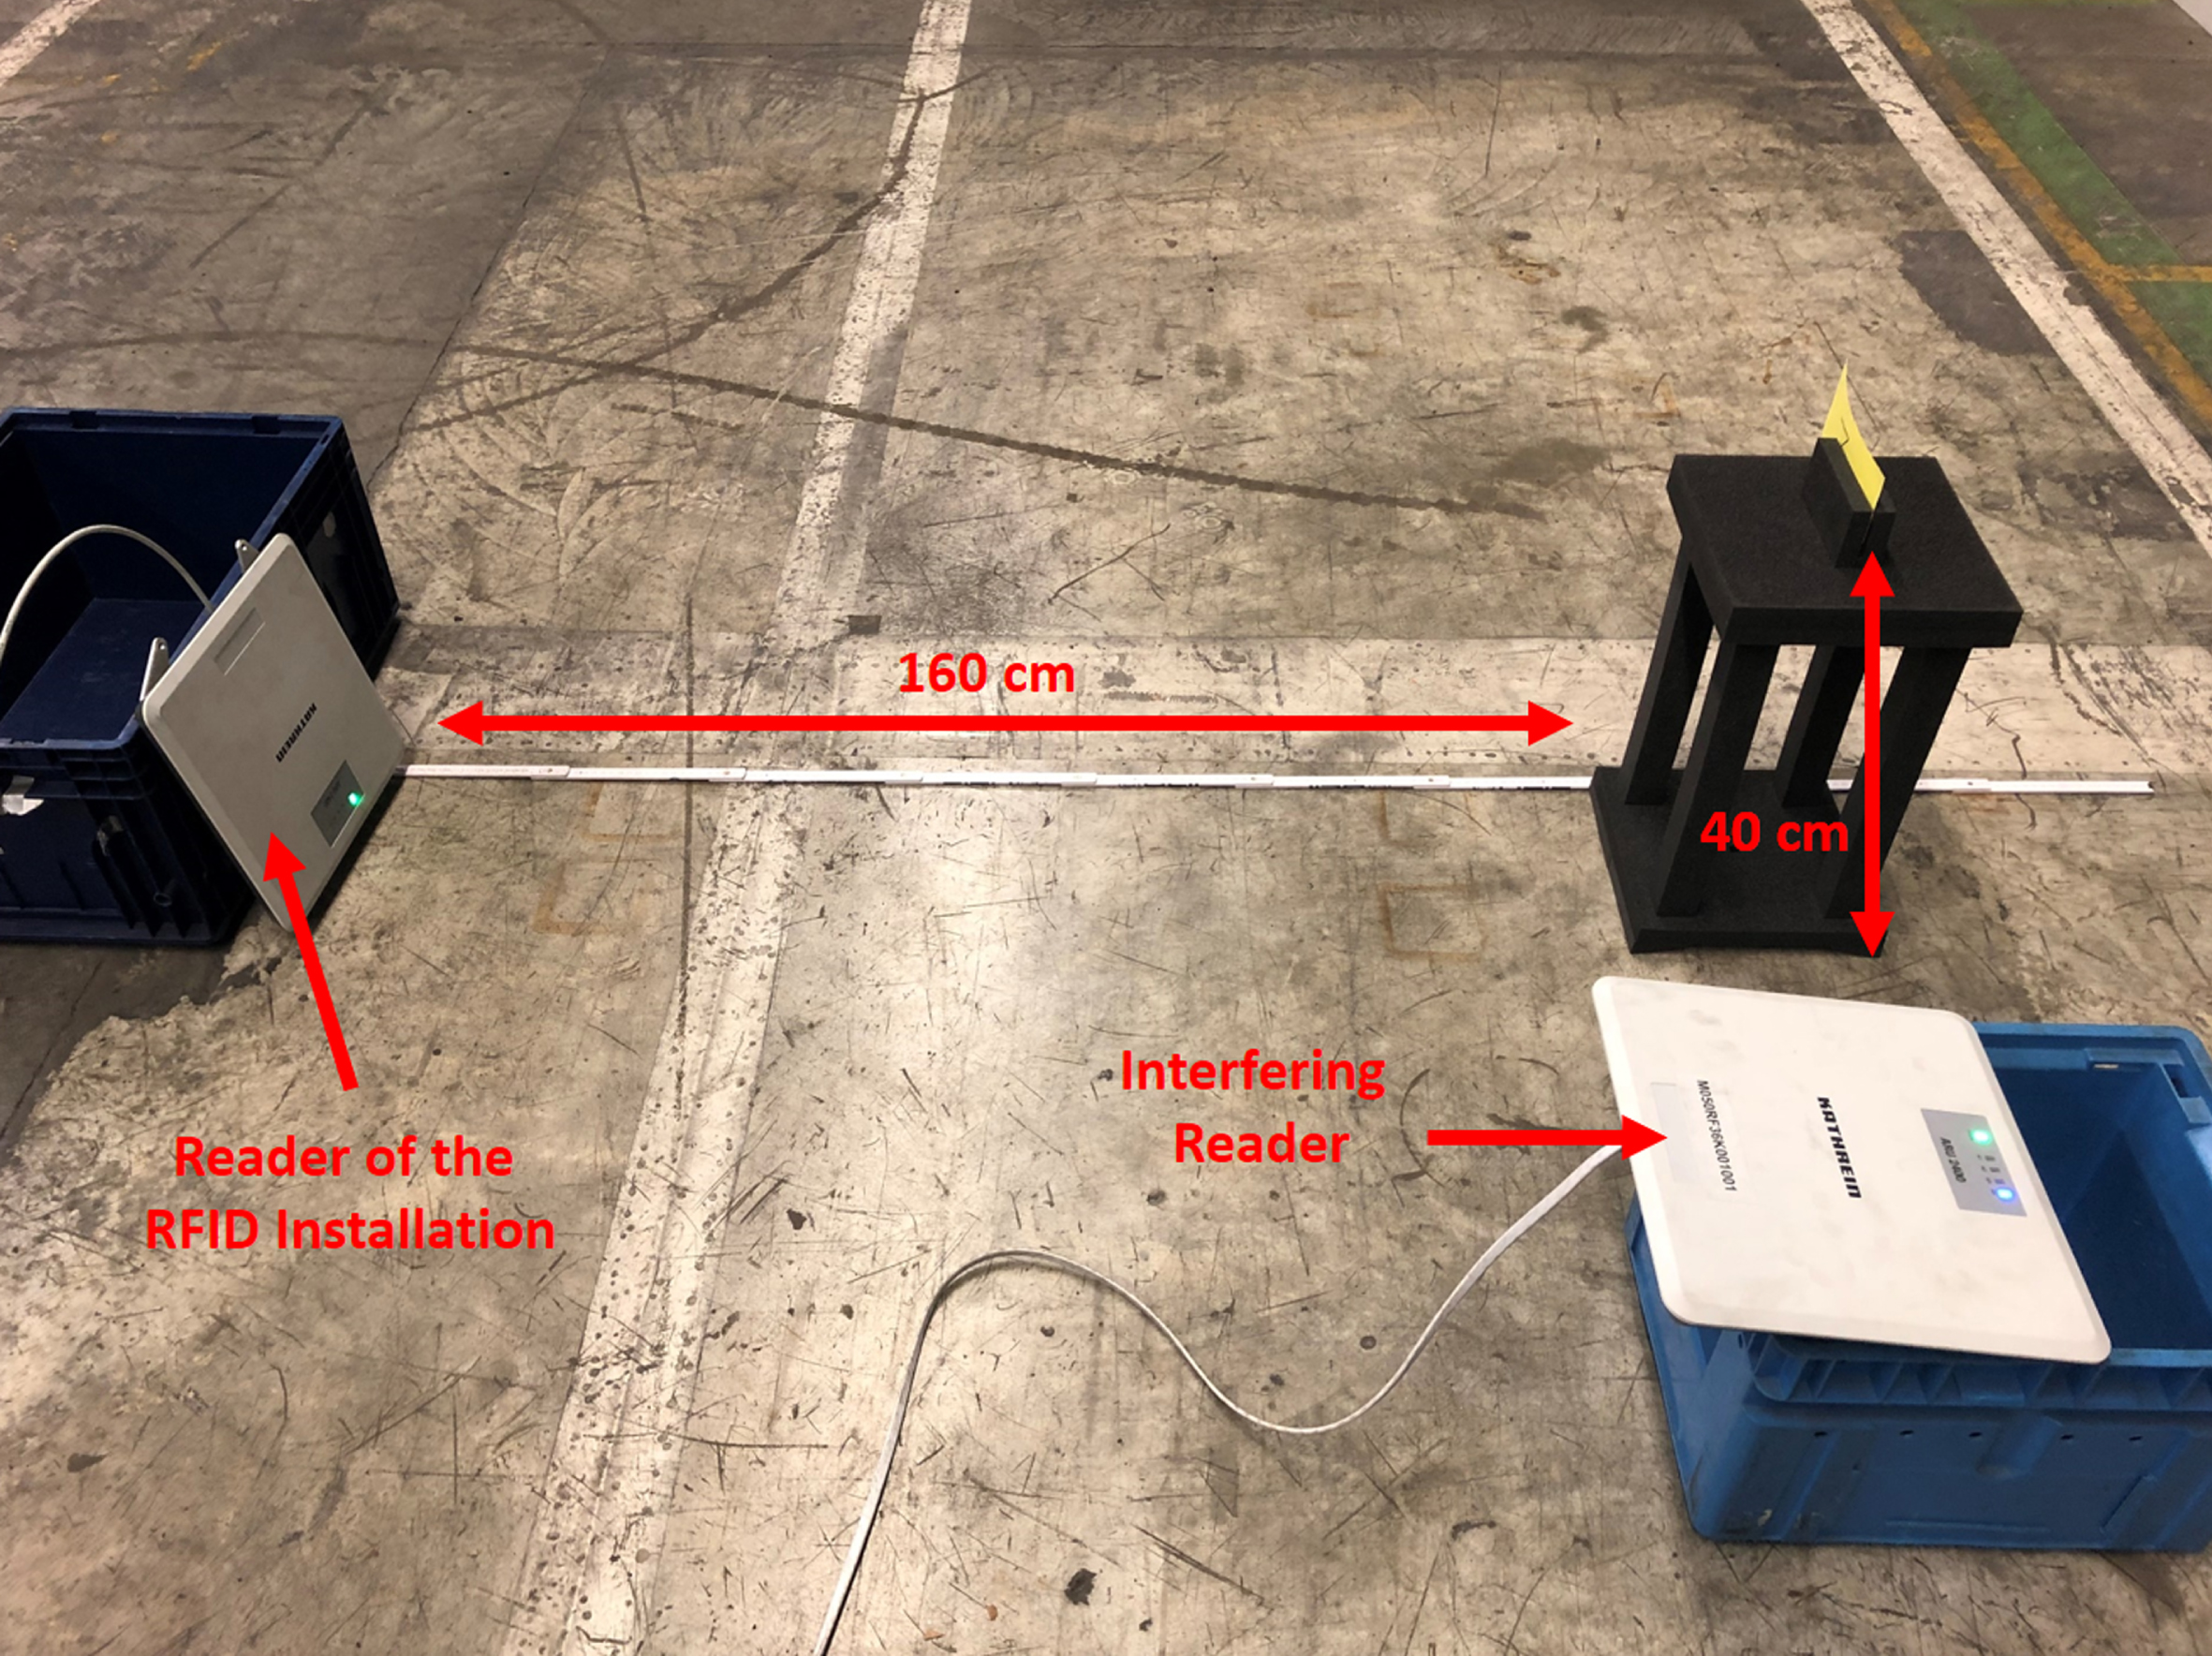
To verify the reader interference test, the RFID installation shown in Fig. 15 is used. This RFID installation consists of an RFID reader (Kathrein ARU 2400) and an RFID tag (Confidex eKanban Single Label) which is placed at a distance of about 160 cm from the reader. The number of readings per second is used as the performance for this RFID installation. An RFID application in the automotive industry, where the distance between RFID reader and tag is approx. 160 cm and the number of readings per second plays an important role, could for example be the case in automatic goods receiving. Here, a reader with external antennas is located on the side or ceiling of the goods receiving area. As soon as a forklift truck with load carriers with RFID tags drives through the gate, the tags are automatically read and the goods are booked in the backend system. The number of readings per second is important here, as the forklift truck is moving and therefore only a certain amount of time is available in which all RFID tags can be read.
Fig. 15
Experimental setup for verification of the reader interference test.
Simulation of the source of interference
The source of interference is simulated by the Kathrein ARU 2400 RFID reader. The reader is placed near the RFID tag in such a way that it cannot read the RFID tag in order to exclude reader-to-tag signal collisions. In practice, this could be a reader of a neighbouring RFID gate or another RFID installation.
Start Trigger
The start trigger could be, for example, the implementation of a new RFID installation as part of a roll-out.
Procedure
1. For this verification, the required performance is defined as at least 8 readings of the RFID tag per second.
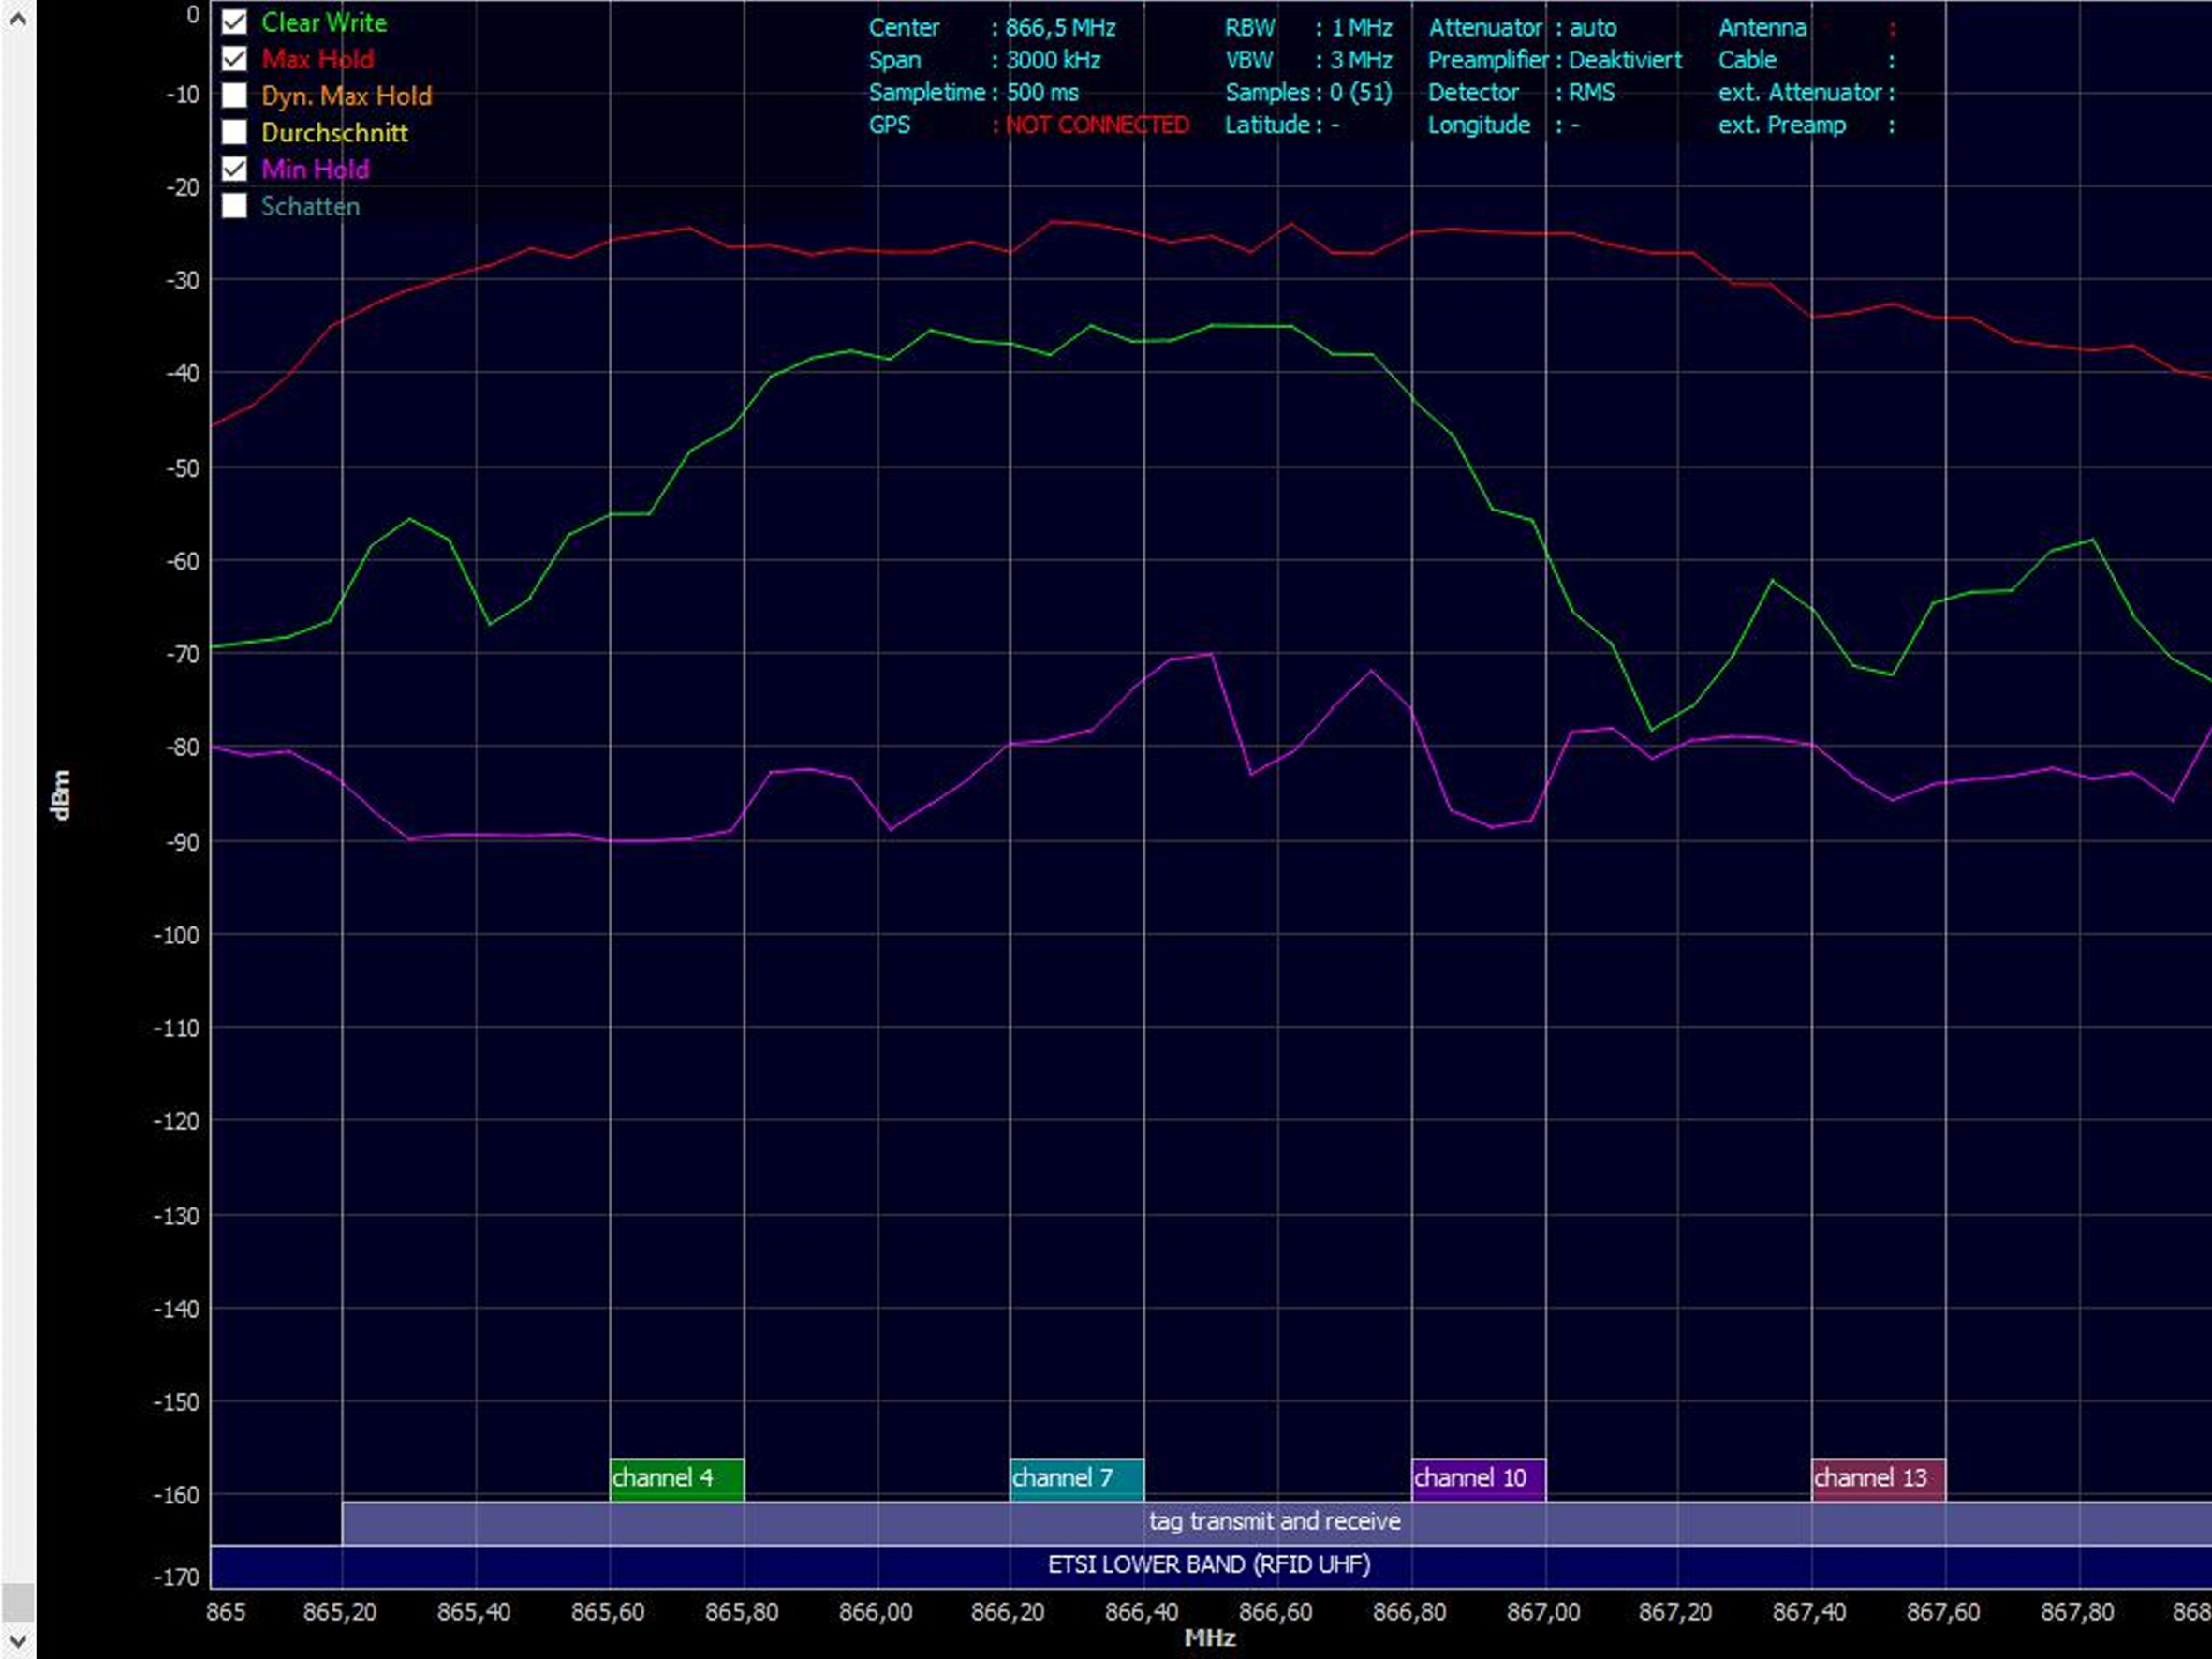
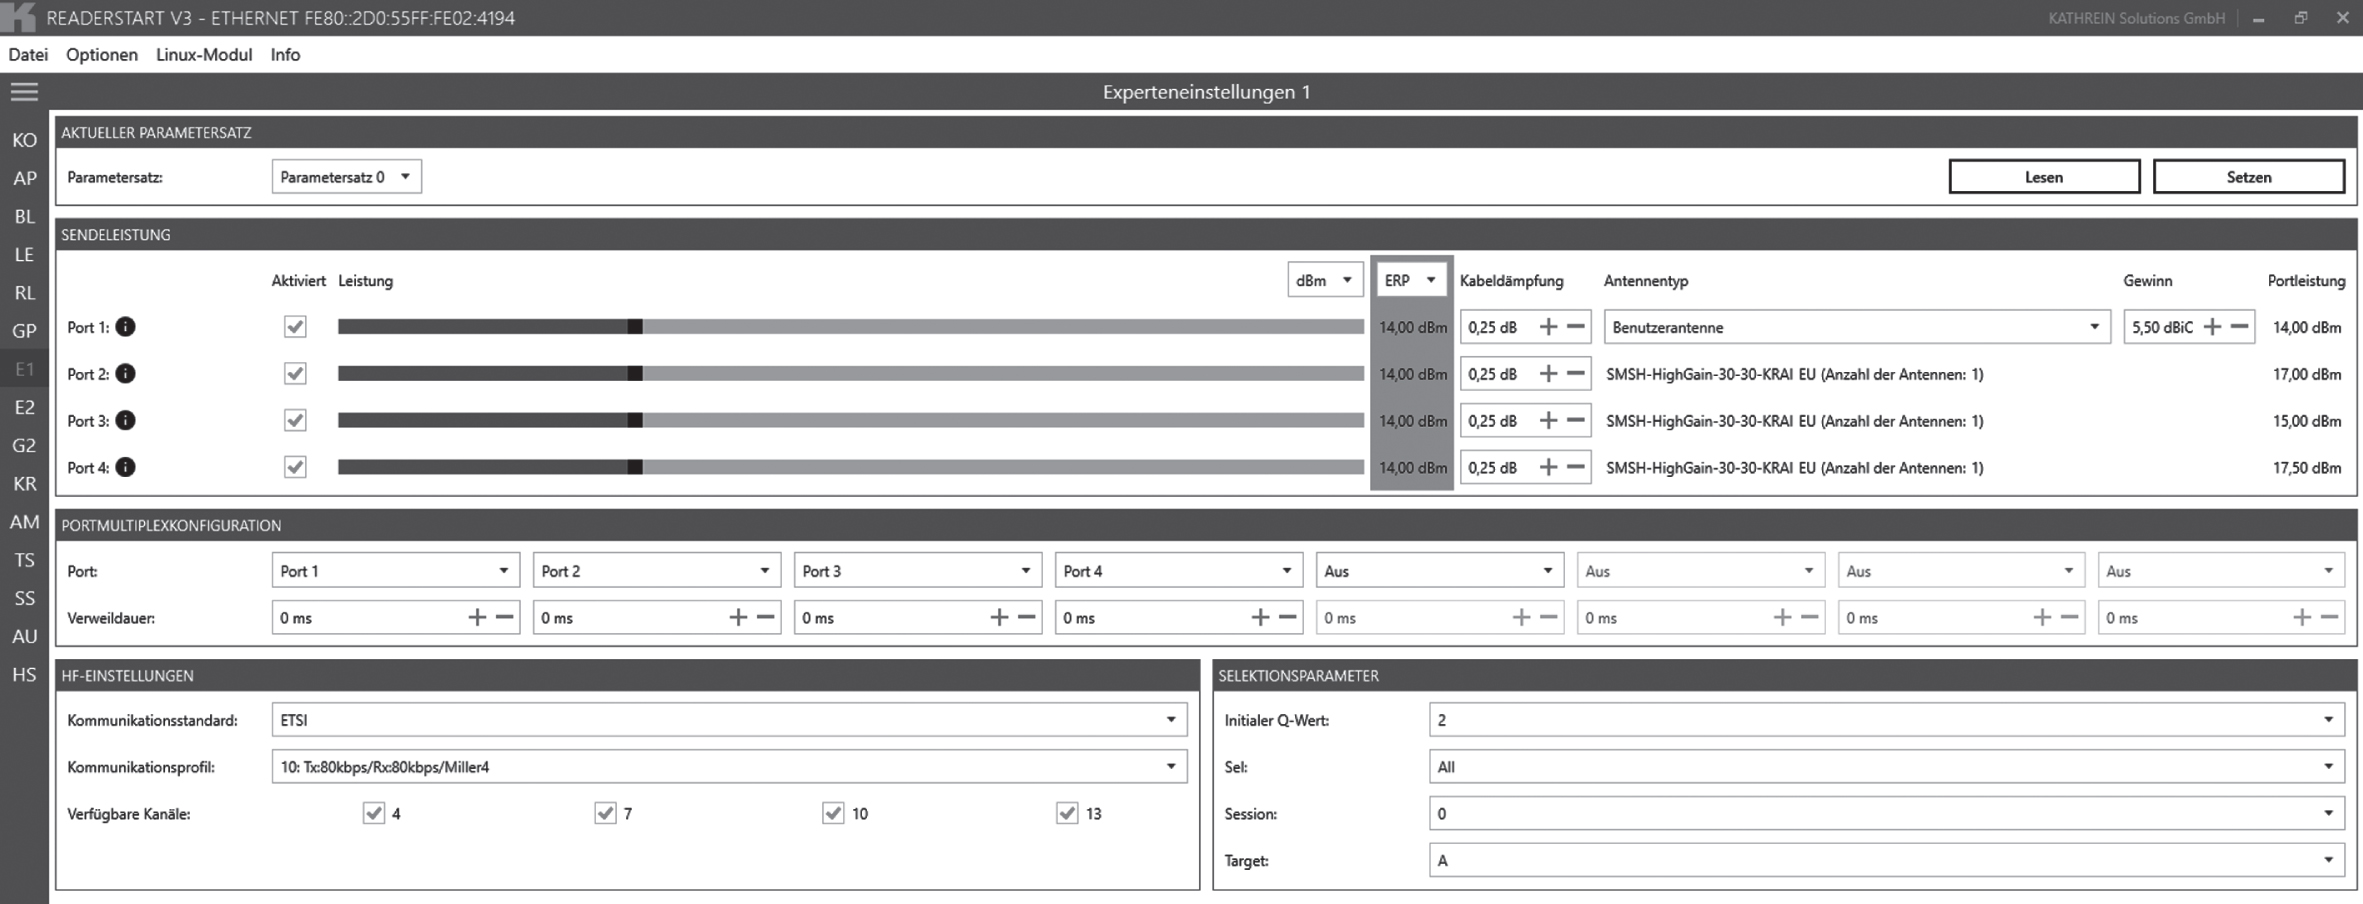
2. To ensure that this verification is not influenced by other radio waves, the RFID interferences in the range of 865.0–868.0 MHz is first measured with the Aaronia SPECTRAN HF-60100 handheld spectrum analyser with UHF antenna. Meanwhile, the two RFID readers are deactivated. The result of this measurement is shown in Fig. 16, which shows that there is no interference from other radio waves. Then both RFID readers are activated and the performance is measured. The RFID readers are configured as shown in Figs. 17 and 18. The performance is measured by recording the readings of the reader of the RFID installation for a little more than 1 minute and then adding up the readings for exactly one minute. This gives a number of reads of 462 per minute and 7.7 per second (see Table 7).
3. Since the measured performance is not sufficient, the questionnaire is filled out in the third step and question 3 is answered with yes. Since reader-to-tag signal collisions have already been ruled out, only the reader interference test needs to be performed next.
4. The test is carried out by first deactivating the RFID reader of the installation. Then the Aaronia SPECTRAN HF-60100 handheld spectrum analyser was configured accordingly and set to the required RFID frequencies 865.0–868.0 MHz and then the frequency sweep measurement was performed. The result of the measurement with the spectrum analyser are shown in Fig. 19. It can be clearly seen that reader interference is present here, as a power of up to approx. –25 dBm was measured. Therefore, the source of interference is eliminated by switching off the interfering reader. Alternatively, a shielding could be installed. To identify the influence on the performance, the number of readings per minute is measured again afterwards. Without the interfering reader, the RFID installation has a number of readings of 553 per minute and 9.2 per second (see Table 7), which is significantly higher and exceeds the defined performance.
Fig. 16
Result of the frequency sweep measurement without active RFID readers.

Fig. 17
Reader settings of the RFID installation reader.
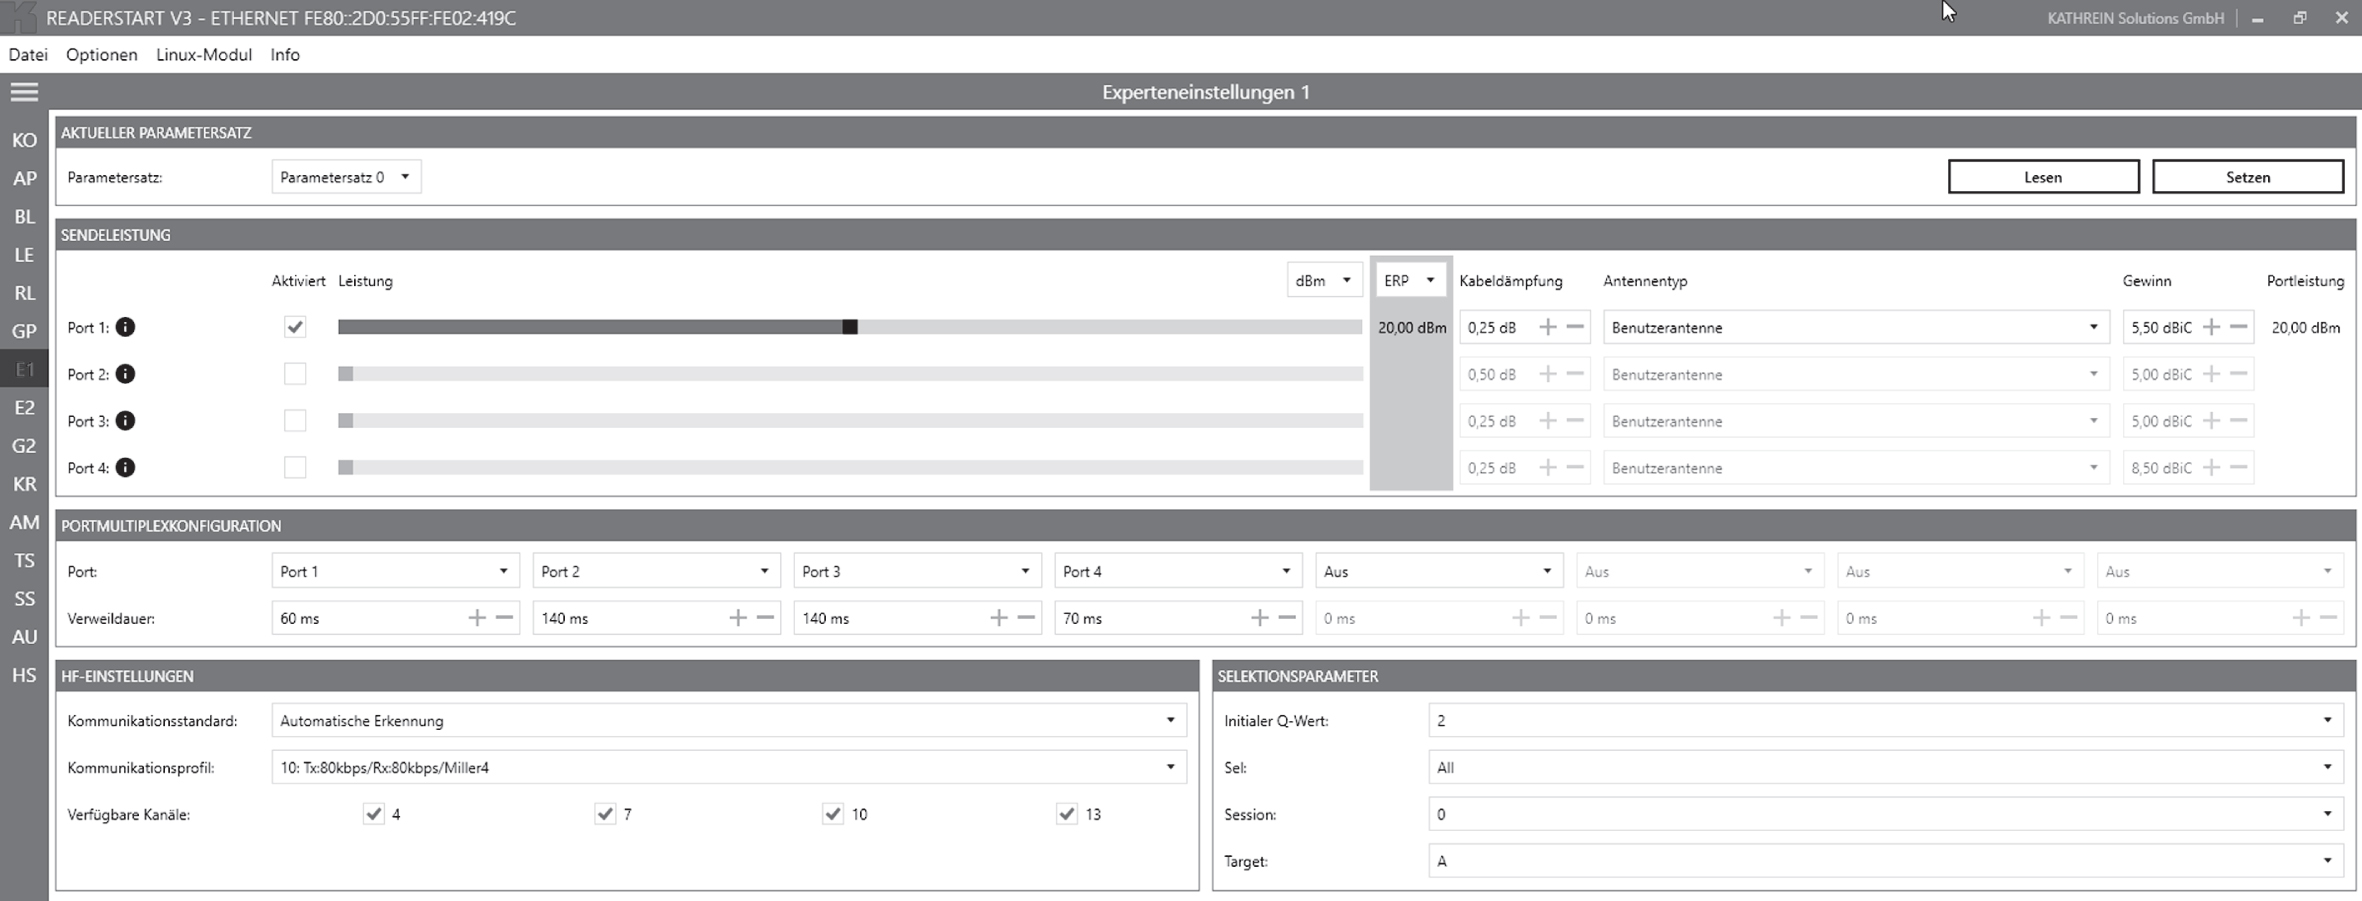
Fig. 18
Reader settings of the interfering reader.
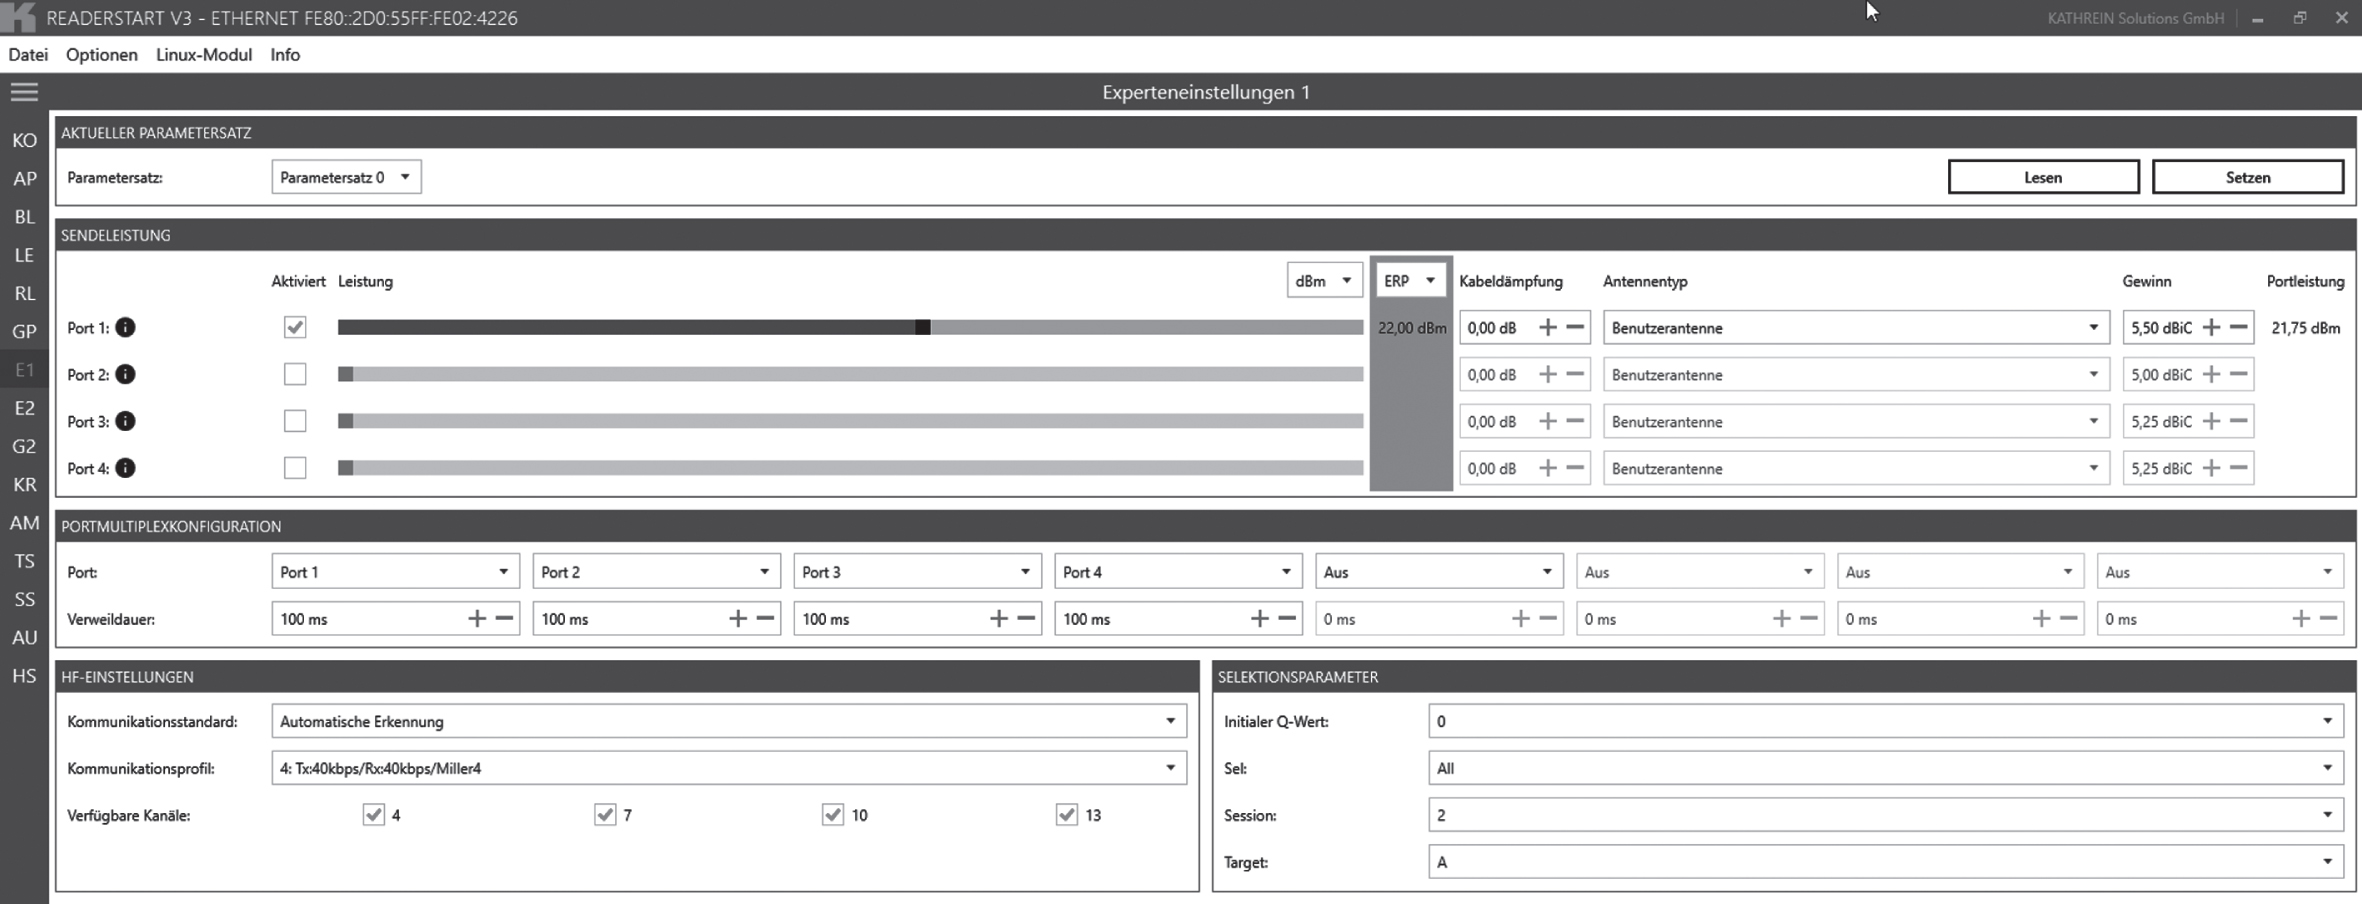
Table 7
Reading rate per minute and per second without and with interfering reader
| Number of reads per minute | Number of reads per second | |
| With interfering reader | 462 | 7.7 |
| Without interfering reader | 553 | 9.2 |
Fig. 19
Result of the frequency sweep measurement with interfering reader.
Conclusion
This verification has shown that the reader interference test can identify the source of reader interference and that switching off the interfering reader has improved performance.
6.3.3Verification of the tag interference test
RFID application and setup of the RFID installation
The tag interference test is verified using the automatic material retrieval with RFID reader on the shelf, which is already described in the verification of the carrier material test (see Section 6.3.1).
Simulation of the source of interference
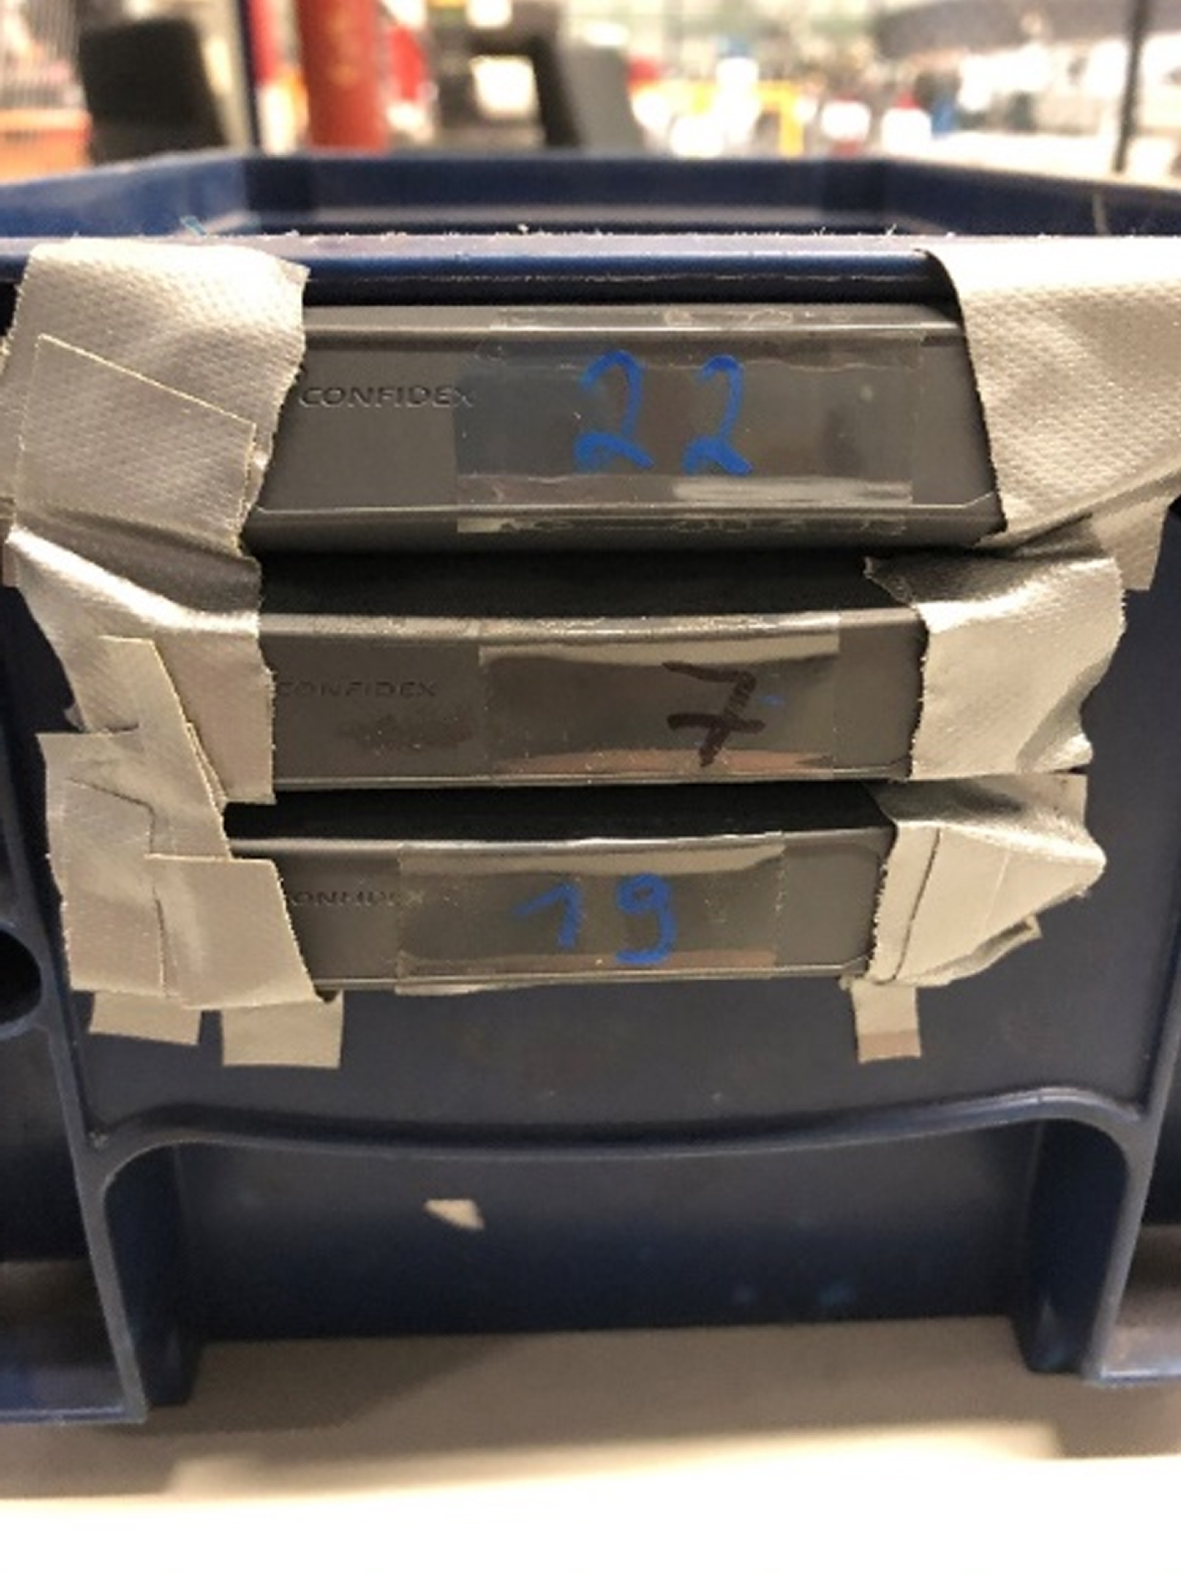
The source of interference is simulated by placing three RFID tags directly next to each other on a load carrier, as shown in Fig. 20. This could happen in practice if several tags are attached to a load carrier for increased process reliability or if, for example, individual components are tagged and these are located very close to each other in a load carrier.
Fig. 20
Attachment of the RFID tags to the load carrier with a distance of 0 cm.
Start Trigger
Start trigger could be that the number of RFID tags or their positioning has been changed.
Procedure
1. The average number of reads per pass and the detection rate are used as the performance of the RFID installation. For this verification, the average number of reads should be at least 20 per pass and the detection rate should be 100 %, which means that the RFID tag must be read on every pass.
2. First, the performance and additionally the RSSI values are measured by pushing the load carrier 5 times through the shelf. The reader settings for this are shown in Fig. 22. The results (see Table 8) show that the tag with the number 7 was not read at all and therefore the performance is not sufficient.
3. The answer to the questionnaire shows that the tag interference test should be carried out.
4. When performing the tag interference test, the RFID tags are now placed 1 cm apart from each other on the load carrier, as shown in Fig. 21, and the performance and RSSI values are measured again. The results in Table 8 show that both the performance and RSSI values have improved and the required performance has been achieved by increasing the distance between the tags.
Table 8
Test results of the interference test
| Average RSSI value | Detection rate | Average number of reads | |
| Tag 7 - distance 0 cm | – | 0 % | 0 |
| Tag 7 - distance 1 cm | –36.9 dBm | 100 % | 25 |
| Tag 19 - distance 0 cm | –36.35 dBm | 100 % | 27 |
| Tag 19 - distance 1 cm | –35.71 dBm | 100 % | 45 |
| Tag 22 - distance 0 cm | –41.96 dBm | 100 % | 23 |
| Tag 22 - distance 1 cm | –38.51 dBm | 100 % | 6 |
Fig. 21
Attachment of the RFID tags to the load carrier with a distance of 1 cm.
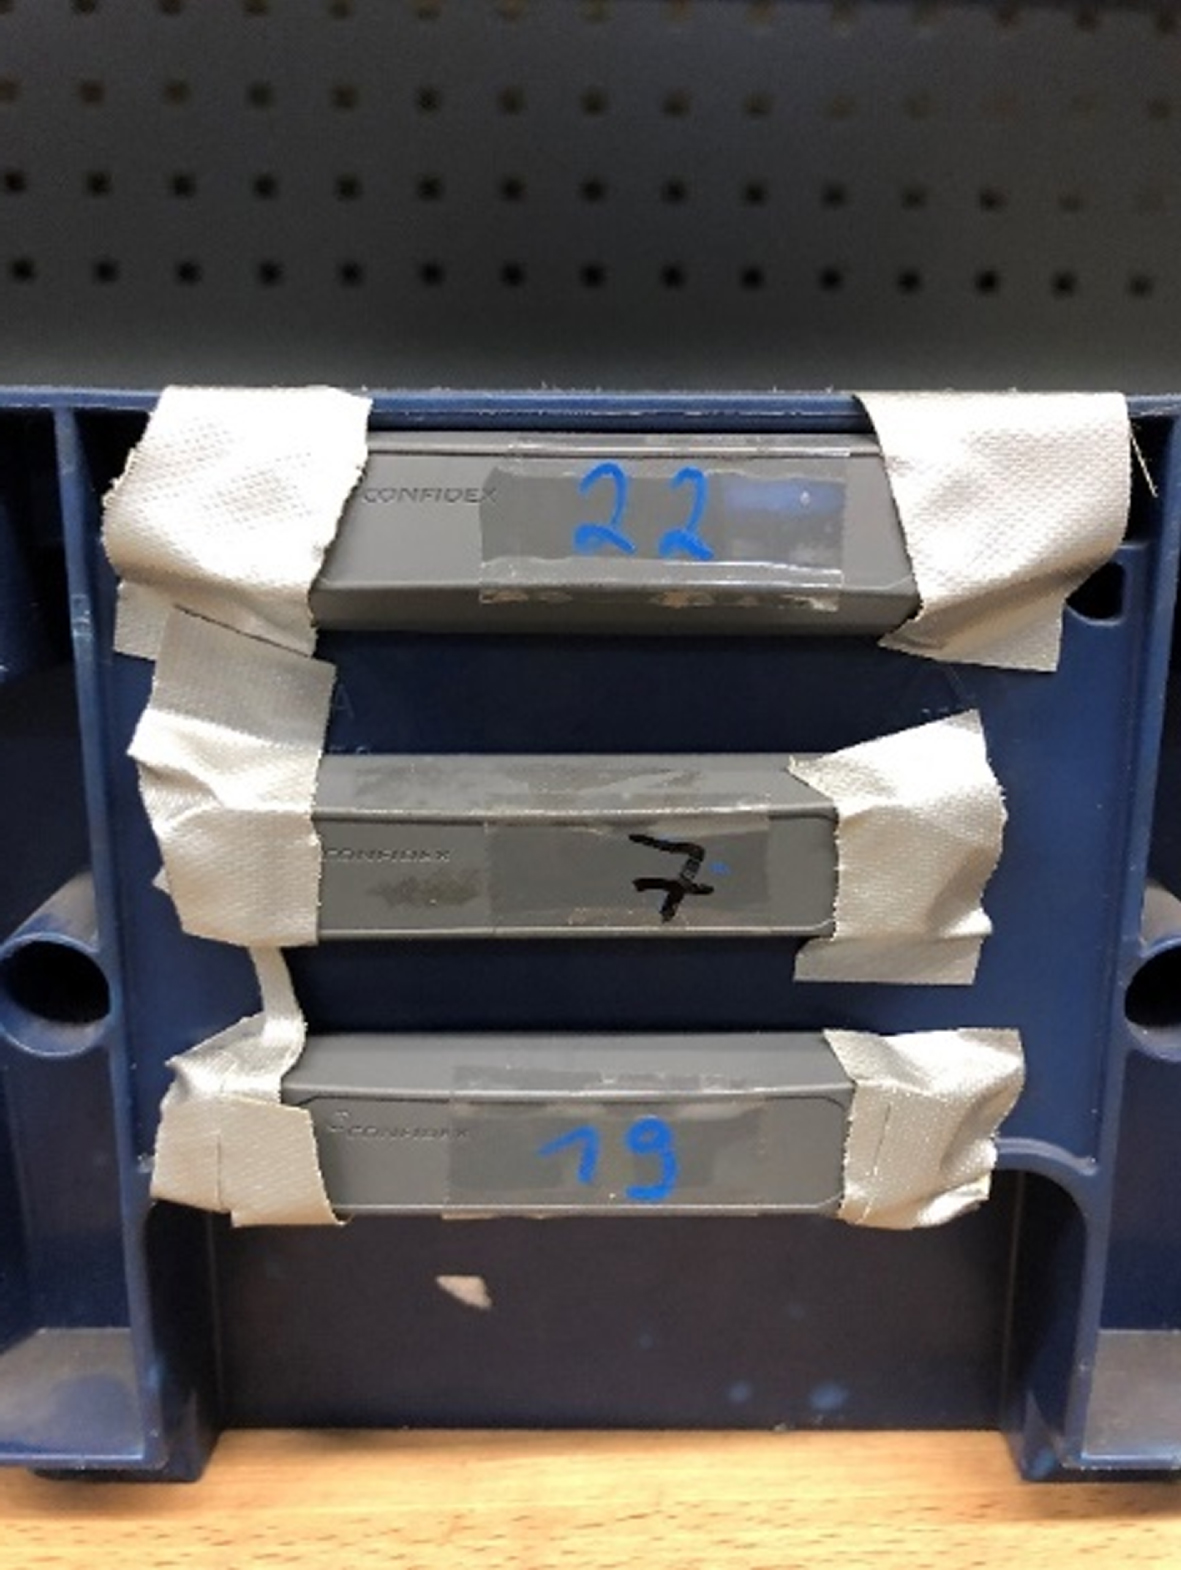
Fig. 22
Reader settings of the RFID installation reader.
Conclusion
The simulated source of interference was identified by the tag interference test and thus this test was successfully verified. The increased distance between the tags has led to a significant improvement in performance of the RFID installation.
6.3.4Verification of the reflection test
RFID application and setup of the RFID installation
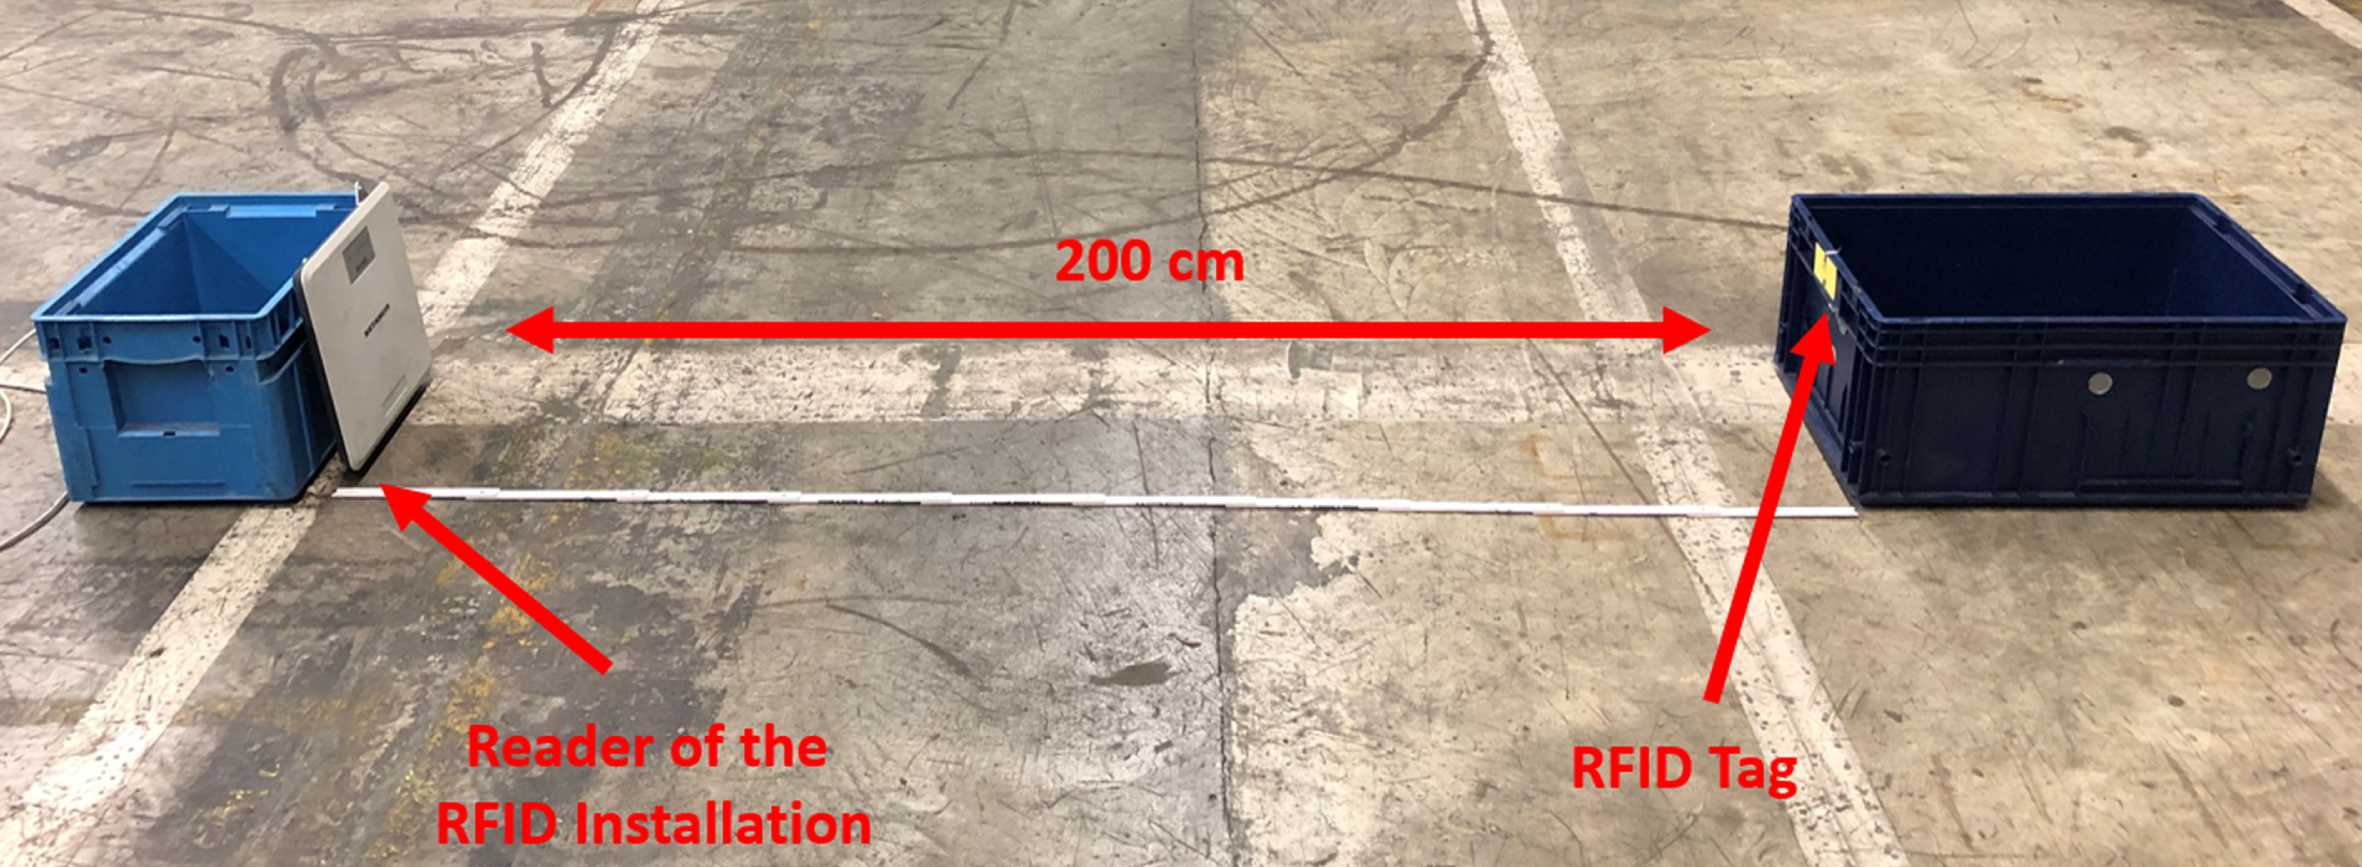
The setup of the RFID installation for the verification of the reflection test is very similar to the one for the verification of the reader interference test and consists of the RFID reader ARU 2400 from Kathrein and an RFID tag (Confidex eKanban Single Label), which is positioned approx. 200 cm away from the reader as shown in Fig. 23. In this RFID installation, performance is measured by range. The range plays an important role, for example, with a very wide RFID gate at the goods receipt, because the RFID tags in the middle of the gate must also be readable.
Fig. 23
Experimental setup for verification of the reflection test without interference source (side view).
Simulation of the source of interference
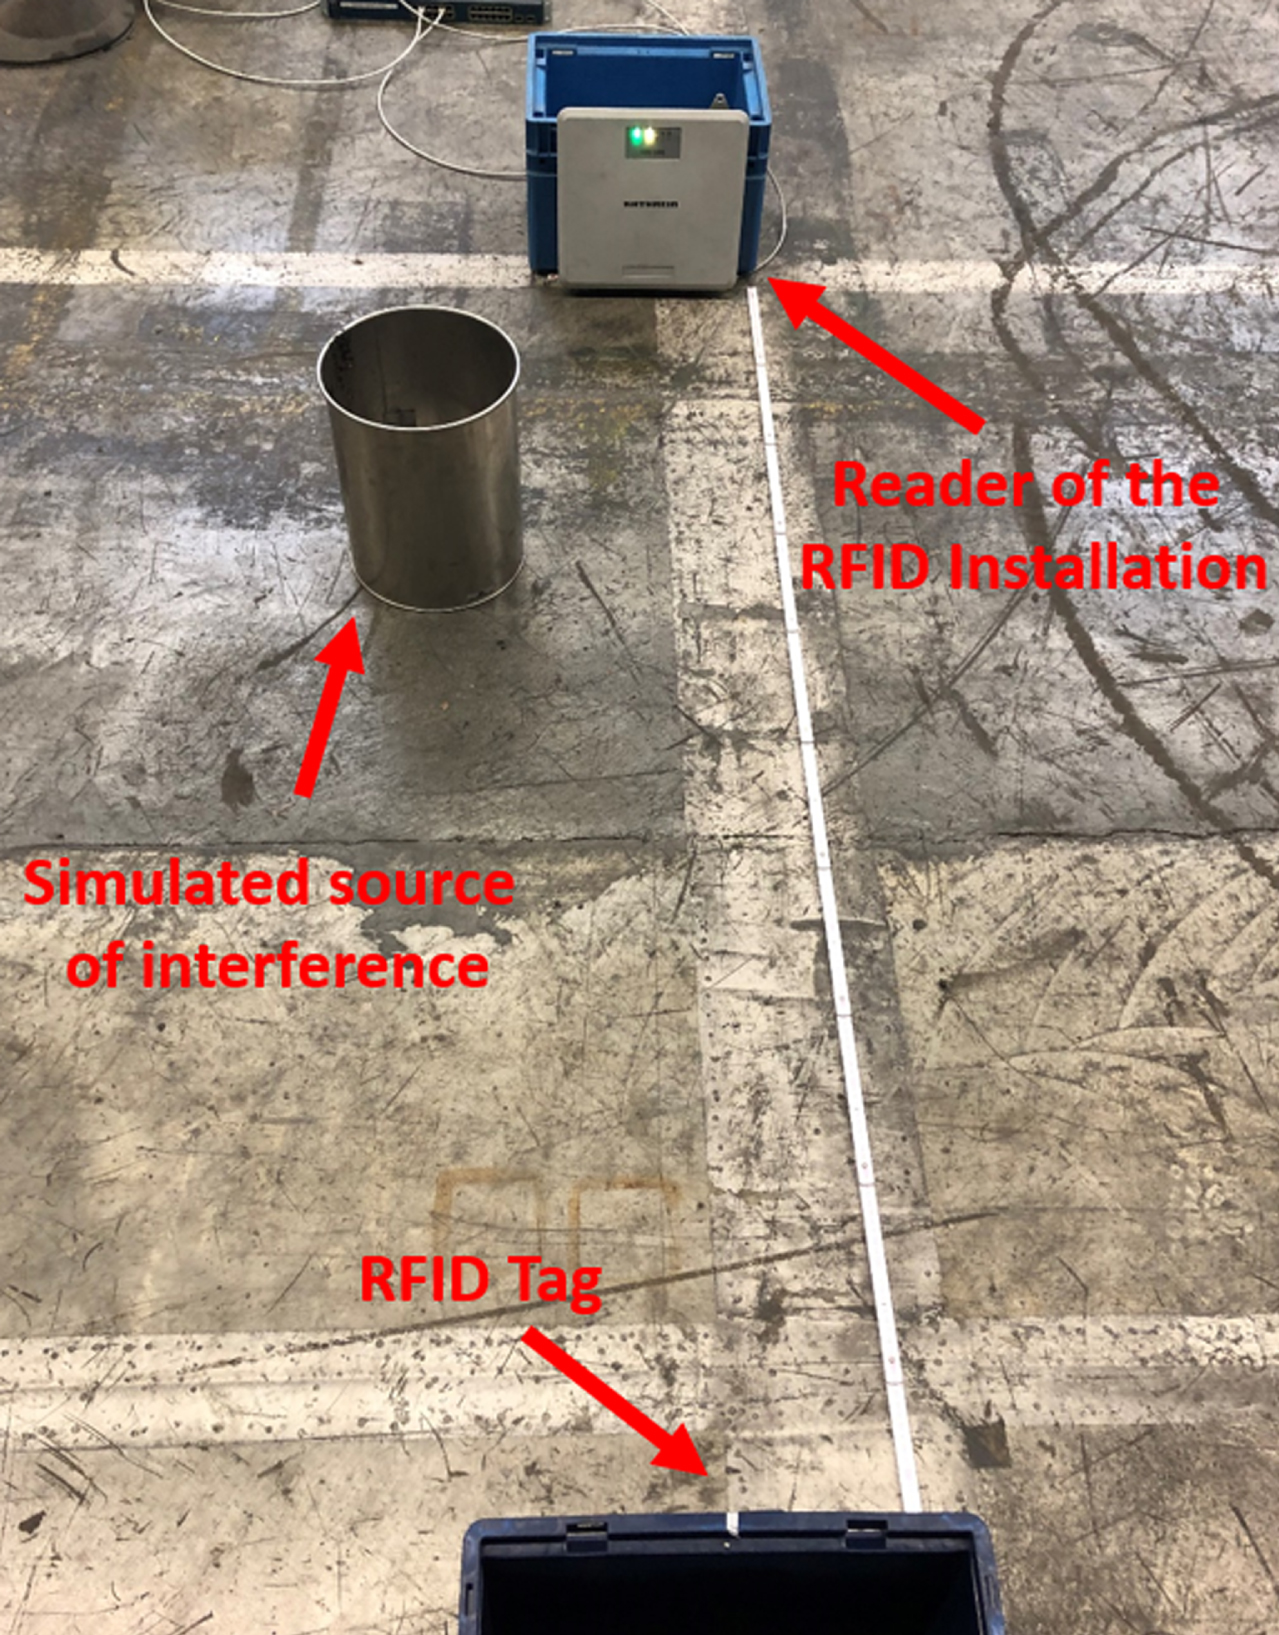
The source of interference is simulated by a metal bin that is placed next to the RFID reader (see Figs. 24 and 25). In practice, this could be a metal post near an RFID gate, for example.
Fig. 24
Experimental setup for the verification of the reflection test with interference source (side view).
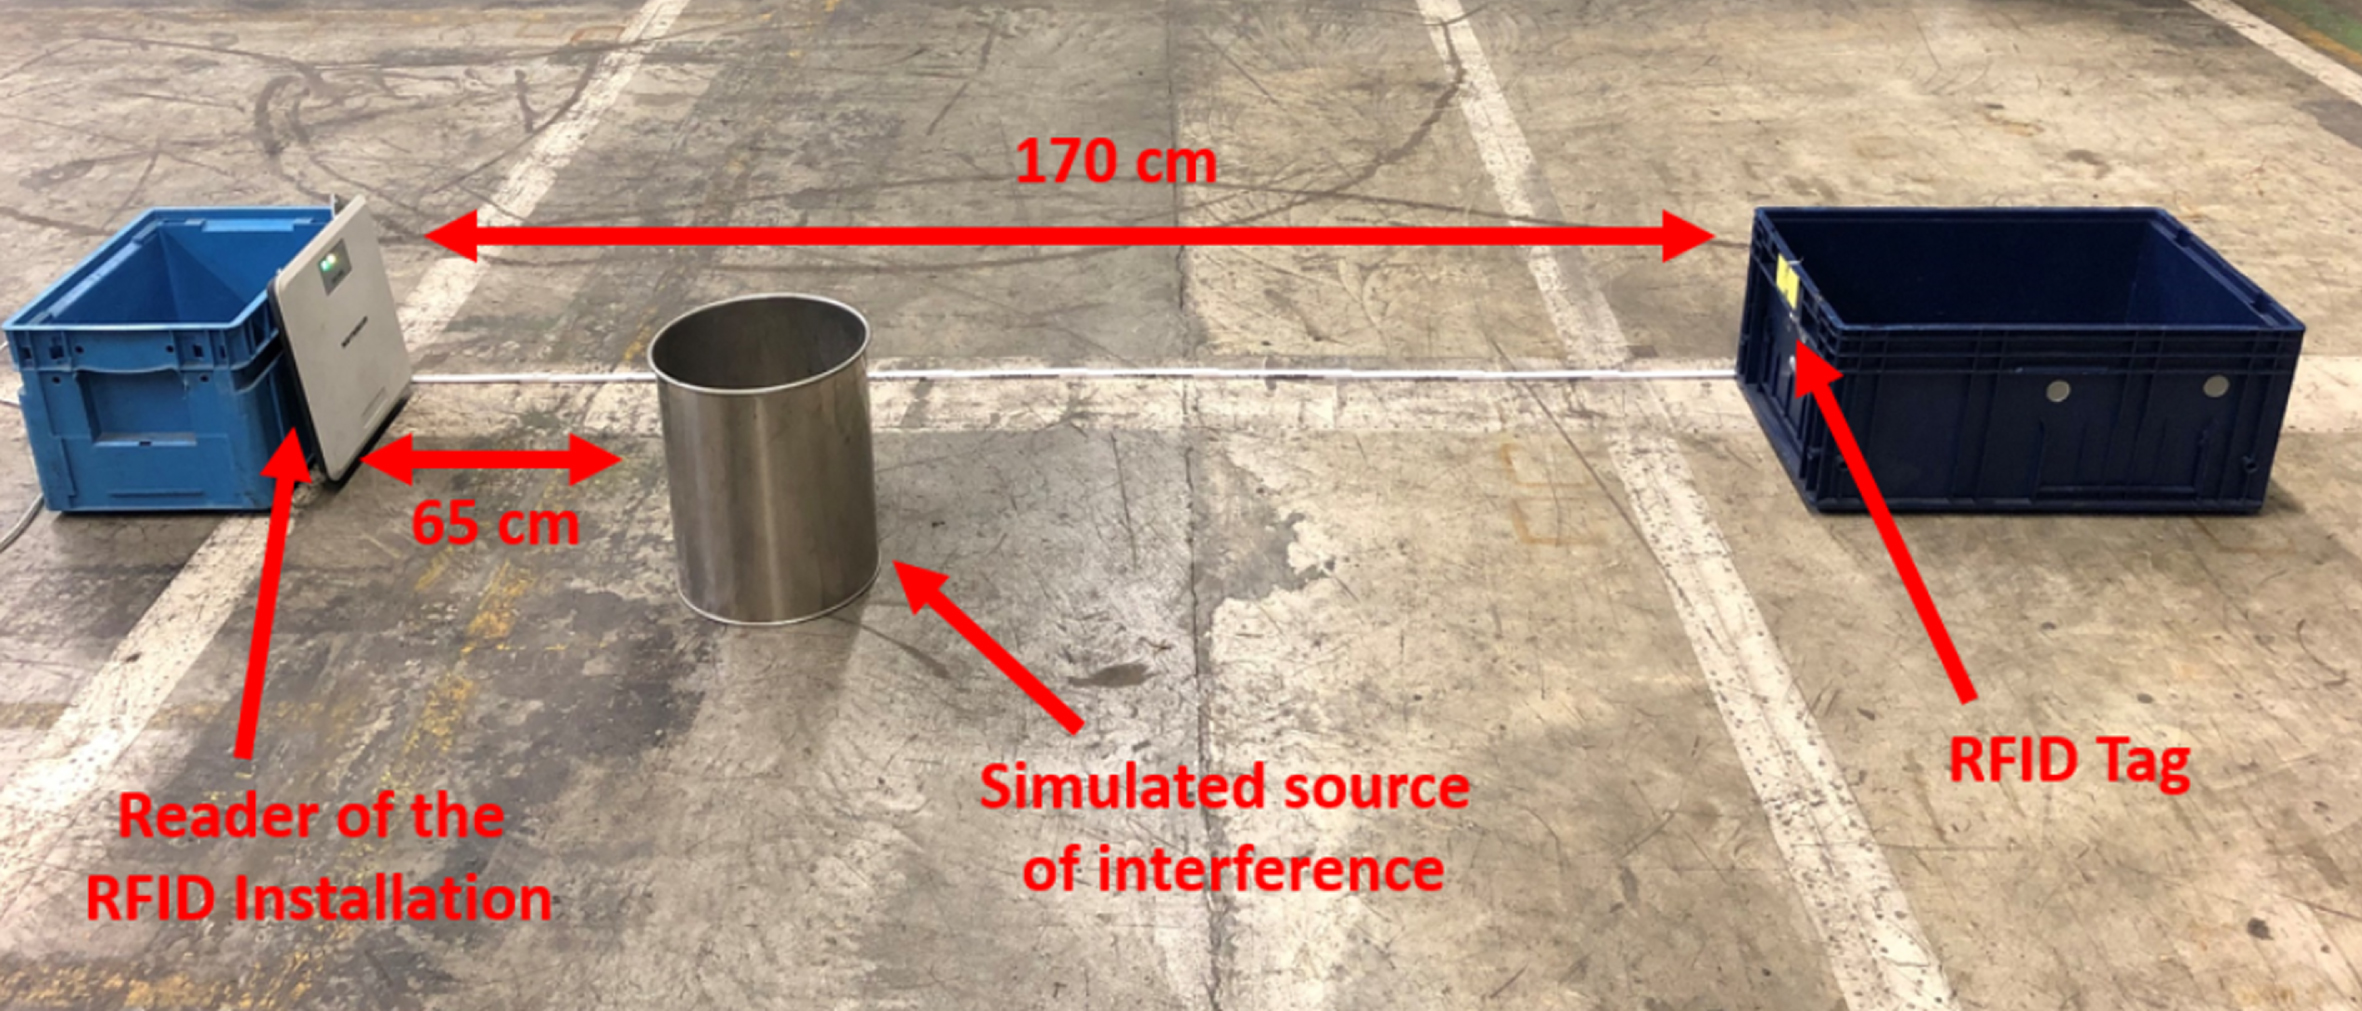
Fig.25
Experimental setup for the verification of the reflection test with interference source (front view)
Start Trigger
The start trigger could be the setup of this RFID installation.
Procedure
1. First, the required performance must be defined. The range of the RFID installation should be at least 190 cm for this verification.
2. First, the performance is measured by moving the RFID tag 5 cm closer and closer to the RFID reader and checking at which range the RFID tag is read continuously. The reader is configured as shown in Fig. 26. The performance measurement showed a maximum range of 170 cm (see Table 9).
3. Answering the questionnaire shows that the reflection test should be carried out due to the metal in the environment.
4. As described in the reflection test, all metallic objects, i.e. the metallic bin, are removed and the performance is measured again. Without the simulated source of interference, the range increased up to 200 cm (see Table 9) and has thus improved significantly, and corresponds to the required performance.
Fig. 26
Reader settings of the RFID installation reader.
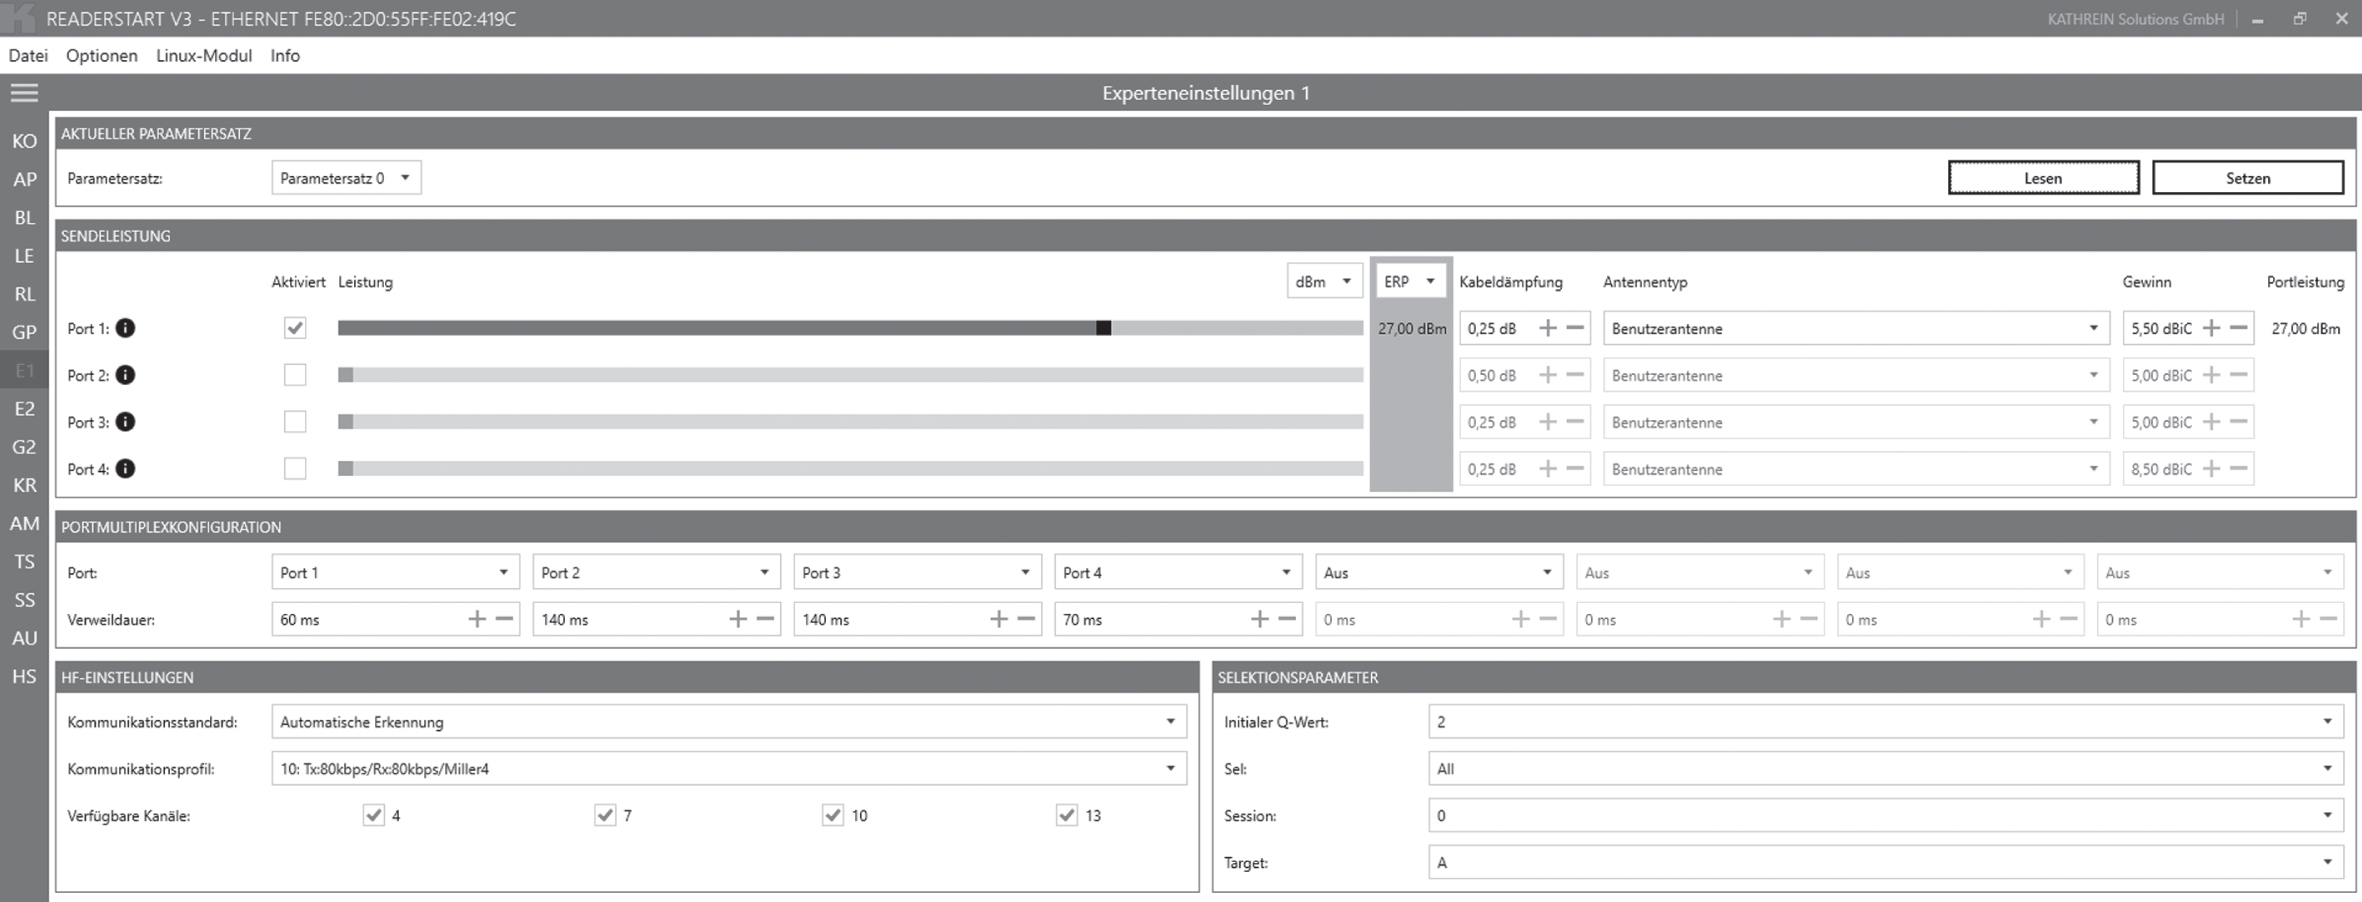
Table 9
Test results –comparison of maximum range with and without source of interference
| Maximum range between reader and tag | |
| With source of interference | 170 cm |
| Without source of interference | 200 cm |
Conclusion
The test results show that the simulated source of interference was identified and the performance (range) of the RFID installation improved significantly by removing the source of interference.
The verifications described in this section have shown that each simulated source of interference was detected and that by eliminating the source of interference, the performance of the respective RFID installation was significantly improved.
7Conclusion
In this paper, a literature review was conducted to identify the known sources of interference and proposed solutions for RFID installations in the automotive industry. These were then classified and summarised in the four categories RFID components, electrical signals, physical environment and environmental influences. Furthermore, a procedure for reducing sources of interference in RFID installations was presented. This procedure has been applied and verified in some RFID installations. The results of the tests carried out show that this procedure has significantly improved the performance of the RFID installations. The information compiled and processed in this paper can be used to build up knowledge in a company that uses RFID and to support the reduction of sources of interference. The reduction of sources of interference leads to better performance, such as higher read rates or longer ranges, which in turn can increase the acceptance and spread of this technology.
Acknowledgments
We would like to thank all those who made the success of this paper possible. Especially we thank Giovanni Romagnoli, Ph.D. from the University of Parma for the support and the supervision and the Mercedes-Benz AG for the funding of the Ph.D. position of one of the authors.
References
1 | Aaronia: Spectran V4 handheld. Data sheet. Retrieved August 31, 2021, from https://downloads.aaronia.com/datasheets/analyzers/V4/Spectran_V4_Datasheet_2020-04-01_V5.pdf##. |
2 | Armata-ID: On-metal UHF RFID Flag tag label. Retrieved March 25, 2021, from https://www.armata.fi/en/rfidtags/319-uhf-rfid-flag-tag-label-aerialm-t-94x26mm.html. |
3 | Armstrong, S. (2013). 6 Factors that affect RFID read range. Retrieved February 17, 2021, from https://www.atlasrfidstore.com/rfid-insider/improve-rfid-read-range. |
4 | atlasRFIDstore: Metal-Mount RFID Tags. Retrieved March 23, 2021, from https://www.atlasrfidstore.com/metalmount-rfid-tags/. |
5 | Azizi, A. ((2019) ) Applications of Artificial Intelligence Techniques in Industry 4.0. Singapore: Springer Singapore (SpringerBriefs in Applied Sciences and Technology). https://dx.doi.org/10.1007/978-981-13-2640-0. |
6 | Brunner, B , Peiffer, F , Finkenzeller, K , Biebl, E. Impact of GSM Interference on passive UHF RFIDs. In: European Conference on Smart Objects, Systems, and Technologies, in Aachen, Germany, 2015, p. 259. |
7 | Cairo, J.-I , Bonache, J , Paredes, F , Martin, F. ((2018) ) Interference sources in congested environments and its effects in UHF-RFID systems: A review. In: IEEE Journal of Radio Frequency Identification, 2: (1), 1–8. DOI: 10.1109/JRFID.2018.2806738. |
8 | Ciftler, B.S , Kadri, A , Guvenc, I. ((2015) ) (2015). Experimental performance evaluation of passiveUHFRFID systems under interference. In: 2015 IEEE International Conference on RFID Technology and Applications (RFID-TA). 2015 IEEE International Conference on RFID Technology and Applications (RFID-TA), Tokyo, Japan: IEEE, 81-86. |
9 | Costa, F , Carvalho, M. , do, S. , Fernandes, J.M , Alves, A.C , Silva, P. ((2017) ) Improving visibility using RFID – the case of a company in the automotive sector. In: Procedia Manufacturing, 13: , 1261–1268. DOI: 10.1016/j.promfg.2017.09.048. |
10 | Ding, H , Yang, N , Wang, G , Han, J , Zhao, J. ((2017) ) (2017). Poster: Bidimensional Relative Localization Leveraging Interference among Passive Tags. In: Per Gunningberg (Hg.): International Conference on Embedded Wireless Systems and Networks (EWSN) 2017. Proceedings: Uppsala, Sweden, Canad a:Junction Publishing, 204–205. |
11 | Ebrahimi-Asl, S , Ghasr, M.T.A , Zawodniok, M.J. ((2017) ) A solution to low read rate problem in RFID scattering networks. In: IEEE Journal of Radio Frequency Identification 1: (2), 176–184. DOI: 10.1109/JRFID.2017.2768546. |
12 | Elewe, A , Hasnan, K , Nawawi, A. (2016) Review of RFID optimal tag coverage algorithms. In: ARPN Journal of Engineering and Applied Sciences. |
13 | Esposito, E , Romagnoli, G , Sandri, S , Villani, L. (2015). Deploying RFID in the fashion and apparel sector: An “in the field” analysis to understand where the technology is going to. In: XX Summer School “F. Turco”, Industrial Mechanical Plants (ING-IND/17). Retrieved November 10, 2020, from https://summerschoolaidi.it/edition-2015/images/Naples2015/proceed/02_romagnoli_02.pdf. |
14 | Fescioglu-Unver, N , Choi, S.H , Sheen, D , Kumara, S. ((2015) ) RFID in production and service systems: Technology, applications and issues. In: Information Systems Frontiers, 17: (6), 1369–1380. DOI: 10.1007/s10796-014-9518-1. |
15 | Finkenzeller, K. (2015). RFID-Handbuch. Grundlagen und praktische Anwendungen von Transpondern, kontaktlosen Chipkarten und NFC. 7., aktualisierte und erweiterte Auflage (Hanser eLibrary). |
16 | GS1. (2018). EPC Radio-Frequency Identity Protocols Generation-2 UHF RFID Standard. 2.1. Aufl. https://www.gs1.org/sites/default/files/docs/epc/gs1-epc-gen2v2-uhf-airinterface_i21_r_2018-09-04.pdf. |
17 | Huang, C.-T , Lo, L.-W , Wang, W.-L , Chen, H.-L. ((2008) ). A study for optimizing the reading rate of RFID tagged cartons in palletizing process. In: 2008 IEEE International Conference on Industrial Engineering and Engineering Management. Singapore, Singapore: IEEE, 1138–1142. |
18 | International Organization for Standardization. (2011). ISO/IEC 18046-1:2011. Test methods for system performance. |
19 | International Organization for Standardization. (2020a). ISO/IEC 18046-2:2020. Test methods for interrogator performance. |
20 | International Organization for Standardization. (2020b). ISO/IEC 18046-3:2020. Test methods for tag performance. |
21 | Kim, D.-Y , Yoon, H.-G , Jang, B.-J , Yook, J.-G. ((2008) ) Interference analysis of UHF RFID systems. In: Progress In Electromagnetics Research B, 4: , 115–126. DOI: 10.2528/PIERB08010607 |
22 | Kim, M , Kim, K. ((2012) ) Automated RFID-based identification system for steel coils. In: Progress In Electromagnetics Research, 131: , 1–17. DOI: 10.2528/PIER12062906. |
23 | Kim, T.-H , Mapa, L , Ramamurthy, D , Goni, F. ((2017) ) Investigating the Effect of Temperature in RFID Technology. In: 2017 ASEE Annual Conference & Exposition Proceedings. 2017 ASEE Annual Conference &Exposition, Columbus, Ohio, 24.06.2017–28.06.2017: ASEE Conferences. |
24 | Kirch, M , Poenicke, O , Richter, K. ((2017) ) RFID in Logistics and Production –Applications, Research and Visions for Smart Logistics Zones, In: Procedia Engineering 178: , 526–533. DOI: 10.1016/j.proeng.2017.01.101. |
25 | Labels & Labeling (2019): Schreiner develops RFID labels for ESD containers. Retrieved March 25, 2021, from https://www.labelsandlabeling.com/news/new-products/schreiner-develops-rfid-labels-esd-containers. |
26 | Lazaro, A , Girbau, D , Villarino, R. ((2009) ) Effects of interferences in UHF RFID systems, Progress In Electromagnetics Research 98: , 425–443. DOI: 10.2528/PIER09101703. |
27 | Le Breton M , Baillet, L , Larose, E , Rey, E , Benech, P , Jongmans, D , Guyoton, F. Outdoor meteorological effects on UHF RFID phase shift: Experimental simulations. In: 2017 IEEE International Conference on RFID (RFID) 2017 IEEE International Conference on RFID (RFID), Phoenix, AZ, USA, 09.05.2017–11.05.2017: IEEE, 103-109. |
28 | Lechner, J , Günthner, W.A. (2016) Messkonzept und Methodik zur Konfiguration und zum Nachweis einer zuverlässigen Identifikation durch UHF-RFID-Installationen [A Measuring concept and Methods for configuring and providing evidence of a reliable Identification from UHF-RFID-Installations]. In Logistics Journal: Proceedings . |
29 | Luh, Y.-P , Liu, Y.-C. ((2011) ) Reading rate improvement for UHF RFID systems with massive tags by the Q parameter, In: Wireless Personal Communications 59: (1):147–157. DOI: 10.1007/s11277-010-0198-y |
30 | Matheus, D , Klumpp, M. Radio Frequency Identification (RFID) in der Logistik. Essen: FOM Hochschule, Institut für Logistik- & Dienstleistungsmanagement (ild) (ild Schriftenreihe Logistikforschung, 4). https://www.econstor.eu/bitstream/10419/74756/1/63401711X.pdf. |
31 | Oxford University Press: Definition of interference. Retrieved July 13, 2021, from https://www.lexico.com/definition/interference. |
32 | Potdar, V , Hayati, P , Chang, E. (2007). Improving RFID Read Rate Reliability by a Systematic Error Detection Approach. In: 2007 1st Annual RFID Eurasia. 2007 1st Annual RFID Eurasia. Istanbul, Turkey, 05.09.2007–06.09.2007: IEEE, 1–5. |
33 | Richter, M. (2013). Nutzenoptimierter RFID-Einsatz in der Logistik. Eine Handlungsempfehlung zur Lokalisierung und Bewertung der Nutzenpotenziale von RFID-Anwendungen. Zugl.: Berlin, Techn. Univ., Diss., 2012. Berlin: Univ.-Verl. der TU Berlin (Schriftenreihe Logistik der Technischen Universität Berlin, 23). |
34 | Sattlegger, K , Denk, U. , (2014). Navigating your way through the RFID jungle. White Pap: Texas Instruments. Retrieved July 14, 2021, from https://www.ti.com/lit/wp/slyy056/slyy056.pdf. |
35 | Segura-Velandia, D , Neal, A , Goodall, P , Conway, P , West, A. (2016). Industrie 4.0 implementations in the automotive industry. In: Y.M. Goh & K. Case (Hg.): Advances in Manufacturing Technology XXX. Amsterdam: IOS Press (Advances in transdisciplinary engineering, v.3). |
36 | Tu, Y.-J , Chi, H , Zhou, W , Kapoor, G , Eryarsoy, E , Piramuthu, S. ((2019) ): Critical Evaluation of RFID Applications in Healthcare. In: Robin Doss, Selwyn Piramuthu & Wei Zhou (Hg.): Future Network Systems and Security. Cham: Springer International Publishing, 240–248. |
37 | Verband der Automobilindustrie (2015a). VDA 4500. Kleinladungsträger (KLT)-System Teil 1. |
38 | Verband der Automobilindustrie (2015b). VDA 4504. Elektrostatisch ableitendes VDA Kleinladungsträger (KLT)- System Teil 1. |
39 | Verband der Automobilindustrie (2015c). VDA 5500. Grundlagen zum RFID-Einsatz in der Automobilindustrie. |
40 | Verein Deutscher Ingenieure (2008). VDI/AIM 4472 Blatt 10 / Part 10. Anforderungen an Transpondersysteme zum Einsatz in der Supply Chain –Testverfahren zur Überpräfung der Leistungsfähigkeit von Transpondersystemen (RFID). Düsseldorf. |
41 | Voyantic Ltd. (2018). Tagformance Pro Measurement System. Manual. |
42 | Wang, J. (2017). Indoor Localization using Augmented UHF RFID System for the Internet-of-Things. Doctoral dissertation, University of Ottawa. School of Electrical Engineering and Computer Science. https://ruor.uottawa.ca/bitstream/10393/36051/3/Wang_Jing_2017_thesis.pdf. |
43 | Windmann, S , Niggemann, O , Ruwe, H , Becker, F. (2017). A novel self-configuration method for RFID systems in industrial production environments. In: 2017 22nd IEEE International Conference on Emerging Technologies and Factory Automation (ETFA). 2017 22nd IEEE International Conference onEmerging Technologies and Factory Automation (ETFA). Limassol, 12.09.2017–15.09.2017: IEEE, 1-5. |
44 | Wyld, D.C. (2005): RFID: The Right Frequency for Government. Washington, DC: IBM Center for The Business of Government. |
45 | Xie, B , Xiong, J , Chen, X , Chai, E , Li, L , Tang, Z , Fang, D. (2019). Tagtag: Material sensing with commodity RFID. In: Raghu K. Ganti, Xiaofan (Fred) Jiang, Gian Pietro Picco & Xia Zhou (Hg.): Proceedings of the 17th Conference on Embedded Networked Sensor Systems–SenSys ’19. the 17th Conference. New York, New York, 10.11.2019–13.11.2019. New York, New York, USA: ACM Press, 338-350. |
46 | Yaacob, M , Daud, S.M , Azizan, A. (2019). A Review of Deterministic Anti-Collision Algorithm of Passive RFID Systems.In: Open International Journal of Informatics (OIJI). |
47 | Zahran, E , Arafa, A , Saleh, H , Dessouky, M.I. ((2016) ) Scientific and technical challenges facing the effective implementation of radio frequency identification (RFID)-based systems, In: International Journal of Computer Networks and Communications Security, 4: , 96–106. |
48 | Zhang, Q , Crisp, M , White, I.H , Penty, R.V. (2014). Power margin reduction in linear passive UHF RFID tag arrays. In: 2014 IEEE RFID Technology and Applications Conference (RFID-TA), IEEE, pp. 306-311. DOI: 10.1109/RFID-TA.2014.6934248. |
49 | Zhenzhong, L , Mrad, N , Xiao, G , Ono, Y , Liu, G , Ban, D. (2011). Effects of Temperature and Humidity on UHF RFID Performance. In: Cansmart Cinde IZFP. |
Notes
1 The VDA (Verband der Automobilindustrie) has specified small load carriers and their properties, such as size and colour, in VDA 4500 (Verband der Automobilindustrie 2015a) and VDA 4504 (Verband der Automobilindustrie 2015b)


