
An AutoML-based approach for automatic traffic incident detection in smart cities
Abstract
In the realm of modern urban mobility, automatic incident detection is a critical element of intelligent transportation systems (ITS), since the ability to promptly identify unexpected events allows for quick implementation of preventive measures and efficient response to the situations as they arise. With the growing availability of traffic data, Machine Learning (ML) has become a vital tool for enhancing traditional incident detection methods. Automated machine-learning (AutoML) techniques present a promising solution by streamlining the machine-learning process; however the application of AutoML for incident detection has not been widely explored in scientific research In this paper, we propose and apply an AutoML-based methodology for traffic incident detection and compare it with state-ofthe-art ML approaches. Our approach integrates data preprocessing with AutoML, and uses Tree-based Pipeline Optimization Tool (TPOT) to refine the process from raw data to prediction. We have tested the efficiency of our approach in two major European cities, Athens and Antwerp. Finally, we present the limitations of our work and outline recommendations for application of AutoML in the incident detection task and potentially in other domains.
1.Introduction
Efficient traffic incident detection in an automatic and prompt manner is paramount in urban traffic management, directly impacting congestion control and road safety. A traffic incident typically refers to any unexpected event that decreases road capacity and leads to congestion. Such incidents disrupt the flow of traffic, impede operations, and are responsible for not only delays but also increased pollution. Consequently, Intelligent Transport Systems (ITS) are increasingly focusing on reducing the impact of such traffic events. Thanks to the surge in available traffic data, Machine Learning has emerged as a powerful tool to improve upon the traditional algorithmic approaches, such as the California #7 Series [1] for detecting these incidents. However, the variable nature of traffic flow makes immediate and precise incident detection challenging. The widespread deployment of traffic sensors on highways has yielded extensive traffic flow data. Common data sources for identifying traffic incidents include stationary detectors like inductive loop detectors, GPS devices, and automatic identification systems such as Radio-Frequency Identification (RFID). Recent advances in machine learning have led to its accelerated adoption in the field of transportation engineering, with popular techniques encompassing artificial neural networks (ANNs), support vector machines (SVMs), isolation forests (IFs), and their various adaptations. While the traditional machine learning techniques have demonstrated utility in interpreting traffic flow data, they often require extensive domain knowledge for feature selection and model tuning, which can be a significant limitation given the variable nature of traffic patterns.
Automated Machine Learning (AutoML) is an emerging area in ML that seeks to automate the ML workflow from data preprocessing to model validation [2] thus enhancing performance and reducing the necessity for constant redesign. AutoML not only automates the meticulous process of discovering and fine-tuning the best-suited machine learning framework for the task at hand but also adapts as the characteristics of data evolve over time. Although setting up AutoML systems may initially demand more computational resources, the trade-off includes a substantial decrease in manual labor and the level of expertise traditionally required to develop high-performing models. Therefore, such automation provides robust AutoML methods that enable people, with either little or no specialized ML knowledge, to integrate ML solutions into data-driven processes. The latter is known as the democratization of ML [2], and it is aligned with the actual purpose of Artificial Intelligence: to learn and act automatically without human intervention [3].
Despite the growing interest in AutoML in many fields, including transportation, a notable research gap exists in its application to traffic incident detection. To our knowledge, there are no comprehensive studies that have specifically tackled the use of AutoML for this purpose. While previous research has demonstrated the potential of AutoML in various domains such as healthcare, finance, and manufacturing [4, 5, 6], its application in the field of traffic management, particularly for incident detection, remains underexplored. This lack of research in applying AutoML to traffic incident detection presents a unique opportunity. The challenge lies in not only adapting AutoML to effectively analyze traffic data but also in validating its applicability across different urban settings. Our paper aims to fill this gap by proposing a novel AutoML-based methodology in detecting traffic incidents. Moreover, we have validated the effectiveness of our proposed approach in two major European cities, in Athens, Greece, and Antwerp, Belgium; however, our methodology is generic and could potentially be replicated or adapted for other urban environments. In doing so, this research contributes to the broader understanding of how AutoML can be utilized in urban traffic systems, potentially leading to more responsive and efficient traffic management solutions.
As far as we are aware, this research represents a novel study aiming to address the automatic incident detection task by employing AutoML methodologies. Specifically, the main contributions of our paper can be summarized in the following:
• Integration of Data Pre-processing Techniques: Recognizing the importance of data quality, we propose a data pre-processing algorithm before employing the AutoML process using TPOT (Tree-based Pipeline Optimization Tool). This integration aims to streamline the model development process, from raw data handling to final prediction.
• Contrast of our AutoML-based approach with General Approach Algorithms: The paper also sets to compare and contrast the performance and efficiency of AutoML frameworks against general machine learning algorithms. This analysis will help to elucidate the benefits and limitations of AutoML in the specific context of traffic incident detection.
• Assessment and comparison of our AutoML methodology across different urban contexts: Last but not least, the paper aims to explore the differences of the proposed automatic approach across two big European cities, Athens and Antwerp.
The rest of the paper is organised as follows: Section 2 provides a short background on AutoML and introduces the problem of automatic incident detection, while presenting related works in the transportation domain. Section 3 describes the proposed methodology. Section 4 presents an overview of the used datasets. Section 5 discusses the experimental results, and finally, Section 6 lists the conclusions and proposes concrete suggestions to data analysts and machine learning engineers for the application of AutoML in relevant domains and/or tasks.
2.Background
2.1Theoretical background on AutoML
AutoML has emerged as a transformative approach in the field of machine learning, aiming to automate the process of model selection and hyperparameter tuning. This section will delve into the general principles and methodologies of AutoML, highlighting its impact on accelerating and simplifying the deployment of machine learning models. AutoML is designed to make the machine learning (ML) process more accessible and automated, enabling experts in specific domains to leverage ML technologies without requiring extensive knowledge or a data analyst’s assistance [4]. At the heart of AutoML lies the challenge of Hyper Parameter Optimization (HPO), which involves the automatic tuning of hyperparameters to enhance the performance of ML systems across tasks like classification, regression, and time series forecasting [4]. Recent advancements in AutoML have expanded its scope to include additional functionalities such as Data Preparation, Feature Engineering, Model Generation and Model Evaluation [4, 5].
In an effort to streamline the machine learning (ML) development process, various systems have been designed to reduce the manual effort needed for specific tasks. For instance, platforms like DeepDive/Snorkel [7] offer comprehensive workflow support that aids in the annotation and management of training data, along with assisting in choosing the right model. Despite these advancements, manual labor remains a significant part of crafting ML solutions. Achieving full automation requires overcoming the current procedural obstacles. To provide a clearer picture of these challenges, we have depicted the complete ML workflow in Fig. 1. This flowchart details each step, highlighting the involvement of domain experts, the extent of manual intervention by data scientists, and the necessary interactions between them [6].
The steps of Data Preparation and Feature Engineering are crucial to setting up the data for use in machine learning (ML) algorithms. Data Preparation encompasses the collection, cleaning, and expansion of the dataset, while Feature Engineering involves the extraction, selection, and formulation of features from the data. During Model Generation, various models are explored to identify the one that predicts outcomes most effectively, using techniques such as k-nearest neighbors (KNN) [8], Support Vector Machines (SVM) [9], Neural Networks (NN), among others. Concurrently, the Model Evaluation step assesses these models against certain criteria, which not only helps in refining the current models but also in developing new ones. The AutoML search process concludes once it meets specified conditions like model performance benchmarks or time constraints.
As described above, AutoML approaches the Model Selection Problem (MSP) as an optimization challenge, aiming to identify the best machine learning (ML) algorithm and its ideal hyper-parameter settings from a predefined selection to optimize an accuracy metric for a specific ML task. The goal of AutoML is to simplify the ML application development process by automating the application of ML algorithms to datasets, thereby relieving users of laborious tasks like hyper-parameter tuning. Despite notable achievements in this area, AutoML is still evolving and is not yet fully developed.
Figure 1.
Flowchart depicting the Machine Learning process, while highlighting points of interaction between domain experts and data scientists, along with bottlenecks [6].
![Flowchart depicting the Machine Learning process, while highlighting points of interaction between domain experts and data scientists, along with bottlenecks [6].](https://ip.ios.semcs.net:443/media/idt/2024/18-2/idt-18-2-idt240231/idt-18-idt240231-g001.jpg)
Regarding AutoML tools, the pioneering approach in simultaneously selecting algorithms and hyper-parameters was Auto-WEKA [10], which applies Bayesian optimization to find the optimal combination of algorithm and settings from 39 algorithms available in WEKA, a comprehensive open-source ML suite. Following this, Komer et al. [11] and Feurer et al. [12] introduced Hyperopt-sklearn and Auto-sklearn, respectively, which automate the selection of ML algorithms and hyper-parameters within the scikit-learn library. Hyperopt-sklearn employs the Hyperopt Python library, using a similar Bayesian optimization method to Auto-WEKA. In contrast, Auto-sklearn records the most effective algorithm and hyper-parameter combinations for past ML tasks and uses meta-learning to inform the starting point of the sequential optimization process.
Recently, Sparks et al. [13] introduced an AutoML method that leverages distributed computing, expanding the computational resources for the automation process. Additionally, Sabharwal et al. [14] created a technique that allocates training data in a cost-effective manner. This method begins by evaluating an algorithm and its hyper-parameters on a small, randomly chosen subset of the dataset and incrementally increases the dataset size for reassessment if the results appear promising. Following that, Olson and Moore [15] developed a system for constructing and fine-tuning ML pipelines for both classification and regression tasks, utilizing genetic programming to create versatile pipelines and to determine the best algorithm for each stage of the pipeline. However, the tool employed, TPOT, does not conduct a thorough examination of all possible hyper-parameter combinations, which means it might overlook some potentially effective configurations.
Lately, Swearingen et al. [16] have introduced ATM, a collaborative tool designed for crafting optimized machine learning (ML) pipelines, with a strong focus on parallelization. This approach allows for distributing and processing individual combinations of algorithms and hyper-parameter settings across a cluster more efficiently. ATM currently utilizes the algorithm base from scikit-learn and concludes its optimization process after a set number of iterations or upon the completion of a time budget specified by the user. In the following year, Mohr et al. [17] developed ML-Plan, a framework that constructs ML pipelines using hierarchical task networks. ML-Plan starts with a predefined selection of preprocessing and classification algorithms and their possible hyper-parameters. However, ML-Plan limits itself to supervised classification tasks, not addressing the supervised regression tasks which have been previously noted as prevalent in the field. From a technical perspective, AutoML attracted a lot of research interest resulting in several AutoML frameworks, including Autokeras [18], FEDOT [19] and TPOT [15]. Additionally, it has been concluded by research focusing on benchmarking several AutoML frameworks [20, 21] that they do not yet outperform humans, however they give encouraging results [22].
In the subsequent sections, we delve into the intricate task of incident detection using machine learning, highlighting the specific challenges and requirements of this domain. Within this context, we employ an AutoML-based methodology developed based on TPOT, that approaches incident detection from both a classification and regression perspective to offer a more holistic understanding of traffic data. TPOT was selected for its robust genetic programming algorithm which excels in discovering high-performing pipelines by simulating evolutionary processes. This feature is particularly beneficial for incident detection where the optimal set of preprocessing and modeling steps can significantly vary across different traffic scenarios. Additionally, TPOT’s parallel computation capabilities allow for efficient processing of vast traffic datasets, a critical factor in timely incident response. The methodology is outlined in detail in Section 3.
2.2Incident detection task using machine learning
Having established the background of AutoML in addition to some applications and technical frameworks, the focus is now shifted to traditional machine learning techniques and their application in traffic incident detection, which has been an area of considerable interest for many years. This section presents various ML techniques that have been successfully applied to detect and predict traffic incidents, such as support vector machines, neural networks, and decision trees. Studies have often focused on the ability of these algorithms to process and analyze large volumes of traffic data to identify patterns that precede incidents.
Figure 2.
A temporal-spatial chart illustrating the usual decrease in roadway capacity due to a temporary event such as a traffic accident [23].
![A temporal-spatial chart illustrating the usual decrease in roadway capacity due to a temporary event such as a traffic accident [23].](https://ip.ios.semcs.net:443/media/idt/2024/18-2/idt-18-2-idt240231/idt-18-idt240231-g002.jpg)
When a traffic incident happens, it triggers a shift from fluid traffic to congestion, causing alterations in vehicle speeds and traffic flow. This shift initiates what’s termed as a ‘shockwave’, which propagates through the traffic, resulting in a queue that forms behind the bottleneck, typically where the incident occurred. This dynamic can often be visualized in a space-time diagram, which illustrates the repeating patterns of speed changes – cycles of speeding up and slowing down – as shown in Fig. 2. For the effective detection or prediction of traffic incidents, it’s important to identify irregularities that signal the emergence of queues both before and after the point of the incident. Integrating time series data from loop sensors with the geographical layout of the road network is essential to monitor these traffic anomalies accurately.
In recent years, research efforts have been proposed to deploy Automatic Incident Detection (AID) Systems onto urban roads, recognizing that detecting incidents automatically and leveraging data within Intelligent Transportation Systems (ITS) can enhance the flow of traffic and diminish congestion and delays. Algorithms for Automatic Incident Detection (AIDA) have undergone extensive research and have been classified in numerous systematic reviews (e.g. [24, 25, 26]). One such review categorizes these algorithms based on their data processing and methods used into four categories: comparative, statistical, artificial intelligence-based and video – image processing algorithms [27].
Table 1
Indicative works in the Automatic Incident Detection domain using Machine Learning algorthims with Loop Detector data
| Algorithm | Data attributes | Indicative works |
|---|---|---|
| BAYESIAN CNN | Occupancy, volume for incident and incident-free conditions, archived data on the type, location, and severity of incidents | [32, 33] |
| SVM | Speed, flow, occupancy and derived features | [34, 35] |
| NEURAL NETWORKS | Volume, speed, occupancy and derived features | [36, 33, 37, 38] |
| ISOLATION FOREST | Volume, speed, occupancy and derived features | [37] |
| LSTM | Volume, speed, occupancy and derived features | [39, 40] |
| GRAPH NEURAL NETWORKS | Volume, speed, occupancy, graph traffic network and derived features | [41, 42, 43] |
Comparative algorithm techniques analyze the variances in traffic flow parameters between two consecutive fixed sensors, computing and contrasting these differences. Meanwhile, statistical methods typically utilize the time-related properties of traffic data to develop models grounded in established statistical theory. Although these conventional methods (comparative and statistical) have historically been popular due to their simplicity and effectiveness in identifying incidents that significantly disrupt traffic flow, there is a trend toward adopting AI-based methods. AI approaches are favored for their adaptability and enhanced performance. Being rooted in data, AI methods can process vast amounts of traffic data to discern underlying patterns [28] and are adept at integrating both the time and space aspects of traffic flow (Pan, Sumalee, Zhong, & Indra-payoong), which is crucial for increasing the precision of incident detection. The majority of research relies on data from Inductive Loop Detectors (ILD) for input into machine learning algorithms, with representative studies summarized in Table 1. Additionally, there’s a rise in research leveraging video data from CCTV cameras; recent systematic reviews reference several studies that showcase the capabilities of video analysis and underscore the efficacy of deep learning methods in the context of incident detection (e.g. [30, 31]).
Domain reviews indicate that while advancements have been made, AI-based and data-driven algorithms for incident detection still face significant challenges, leading to research opportunities. These challenges include: the need for a more extensive collection of historical traffic incident data for model training and evaluation; the creation of balanced datasets with an equal representation of incident and non-incident cases; enhancement of the models’ ability to perform in real-time; and the improvement of methods to capture spatial and temporal dependencies to boost the algorithms’ effectiveness [44].
2.3AutoML in transportation and traffic prediction studies
In the transportation sector, AutoML’s application is still on the rise. This section reviews the current state of research on the use of AutoML for traffic prediction and its role within the transportation domain. It will highlight studies where AutoML has been employed to optimize traffic flow, predict congestion, and improve overall transportation efficiency.
In the transportation area, to the best authors’ knowledge, only four papers have used AutoML methods for TF [45, 46, 47, 48]. The first study carried out by Vlahogianni et al. [47] introduced a meta-modelling approach that employs surrogate modelling alongside a genetic algorithm that follows an island model strategy to optimize both the selection of the algorithm and its hyper-parameter tuning. This AutoML task uses a base of three machine learning methods – Neural Network, Support Vector Machine, and Radial Base Function – to predict average traffic speed over a 5-minute time horizon through regression analysis. Subsequently, Angarita et al. in [45] and [46] utilized Auto-WEKA, an AutoML method that applies sequential model-based bayesian optimisation [49] to identify the most effective ML pipelines. Both these studies benchmarked Auto-WEKA’s performance against the conventional method of manually selecting the best algorithm from a set to predict traffic. Specifically, in the case of [46], the authors focused on forecasting traffic Level of Service (LoS) at a specific freeway location across various time horizons, while in [45], they concentrated on predicting traffic speed for a group of traffic flow (TF) regression problems at both the point and road segment levels in freeway and urban settings. Lastly, in [47], the authors focus on assessing Auto-sklearn’s capability to recommend effective machine learning pipelines for traffic forecasting. This task is framed as a time series (TF) multi-class imbalanced classification problem, examined over various time horizons, spatial scales (both point and road segment), and in different environments (freeway and urban). The study tests three scenarios and findings indicate that Auto-sklearn’s meta-learning component underperforms in handling TF problems, and optimization does not significantly enhance prediction accuracy.
All in all, it is certain that ML algorithms have played a crucial role in developing accurate models for automatic incident detection yet they still face obstacles including steep computational demands and superfluous model data, all while trying to reduce the need for human input. To address these challenges, the use of AutoML algorithms, which feature a pipeline model capable of self-adjusting hyperparameters, offers an encouraging approach. Under this light, our paper aims to contribute to the fast growing field of AutoML by:
1. Developing AutoML-based prediction algorithms for the incident detection task, both from a regression and a classification standpoint;
2. Conducting of a comparison between the proposed methodology for each use case with other baseline methods; and finally,
3. Analysing and assessing the models proposed as part of this research between different urban contexts
Last but not least, to the best of our knowledge, this study is the first one aiming to tackle the challenging problem of automatic incident detection using AutoML techniques.
Figure 3.
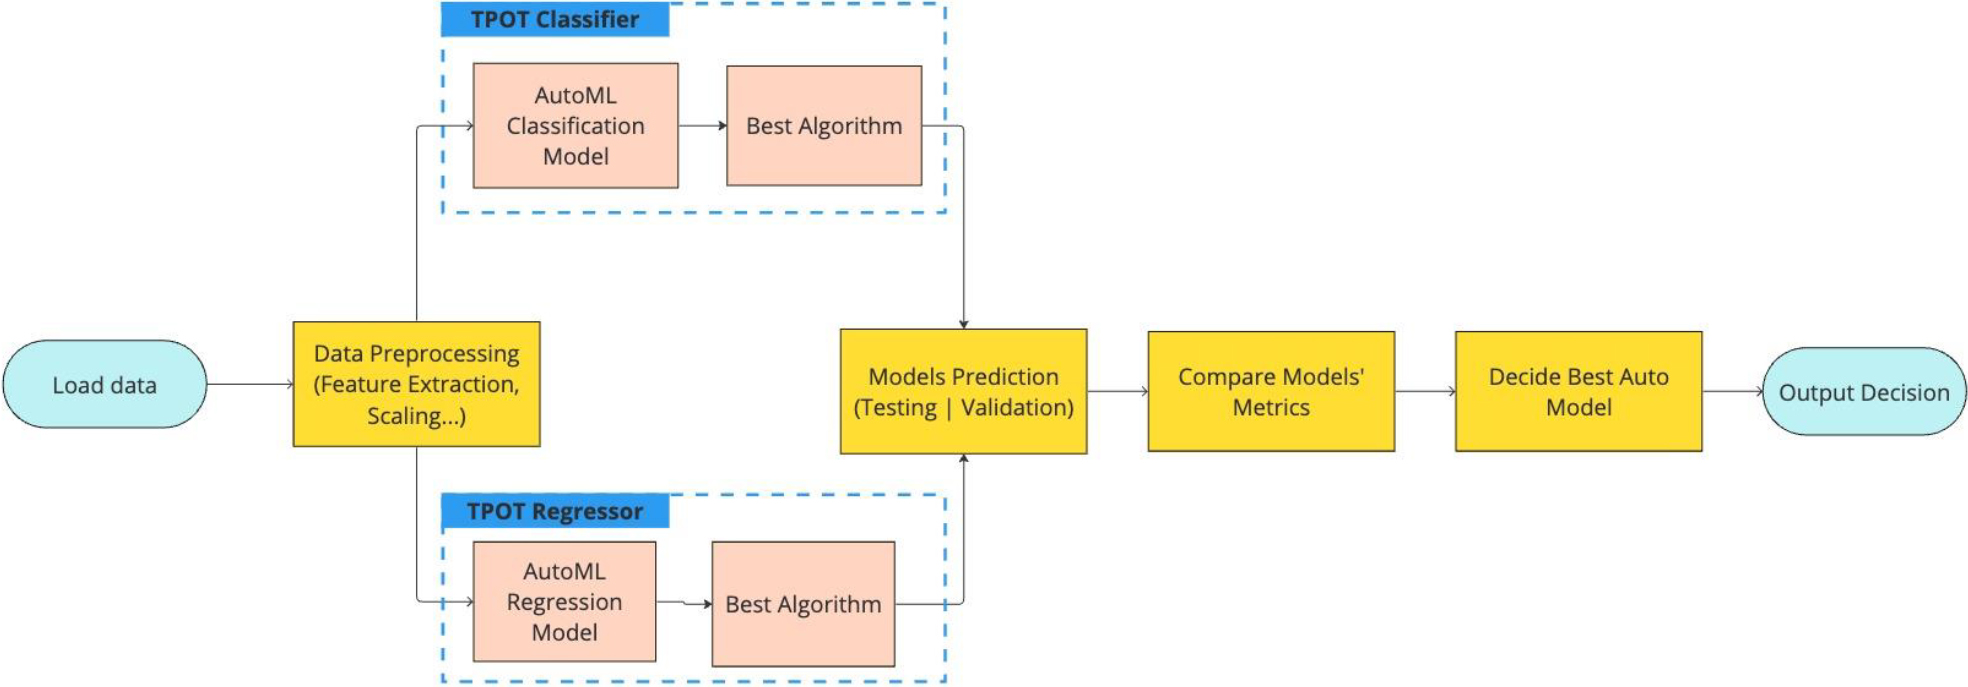
The methodology flowchart as proposed.
3.Proposed methodology
This paper involves developing a methodology for automatic incident detection with the goal of identifying unplanned non-recurring events promptly and thus enabling a safer and more reliable Intelligent Transport Management system. The methodology flowchart, depicted in Fig. 3, illustrates the general workflow of the present study. Initially, the process commences with data ingestion, followed by a thorough data-preprocessing stage to make the dataset suitable for model deployment. Subsequently, an AutoML framework TPOT, is used as the foundation of our approach for model development and selection.
During the prediction phase, the data is divided into two sets: one for testing and the other for validation with unseen data. TPOT is deployed for crafting an effective machine learning model leveraging the training data, focusing on the problem from a regression and a classification perspective. After training and evaluating both the TPOT Classifier and TPOT Regressor, we compare their performance metrics to determine the most effective model for deployment. However, the benefits of utilizing TPOT extend beyond this initial selection phase.
AutoML systems like TPOT offer dynamic model updating, which can be crucial as traffic data evolves over time. This allows for continuous retraining and model refinement without the need to start the process anew, ensuring that the incident detection system can adapt to new patterns or changes in traffic flow. Furthermore, the ongoing use of AutoML provides an operational advantage in terms of parameter fine-tuning. TPOT, with its genetic programming-based optimization, can iteratively explore the parameter space to fine-tune the model as more data becomes available or as traffic conditions change, a process that is more resource-efficient and potentially more effective than manual tuning efforts. Lastly, the implementation of AutoML for ongoing model management allows for the incorporation of online learning techniques, where the model can be updated in real time with new data. This is particularly relevant for incident detection, where the timeliness of model updates can significantly impact the system’s performance and reliability. Therefore, while the model selected via TPOT may be fixed during a specific period, our methodology is designed to facilitate model evolution, allowing for ongoing improvements and the incorporation of new data, which is a significant benefit over a static algorithmic approach.
Figure 4.
Overview of the modelling phase in detail.
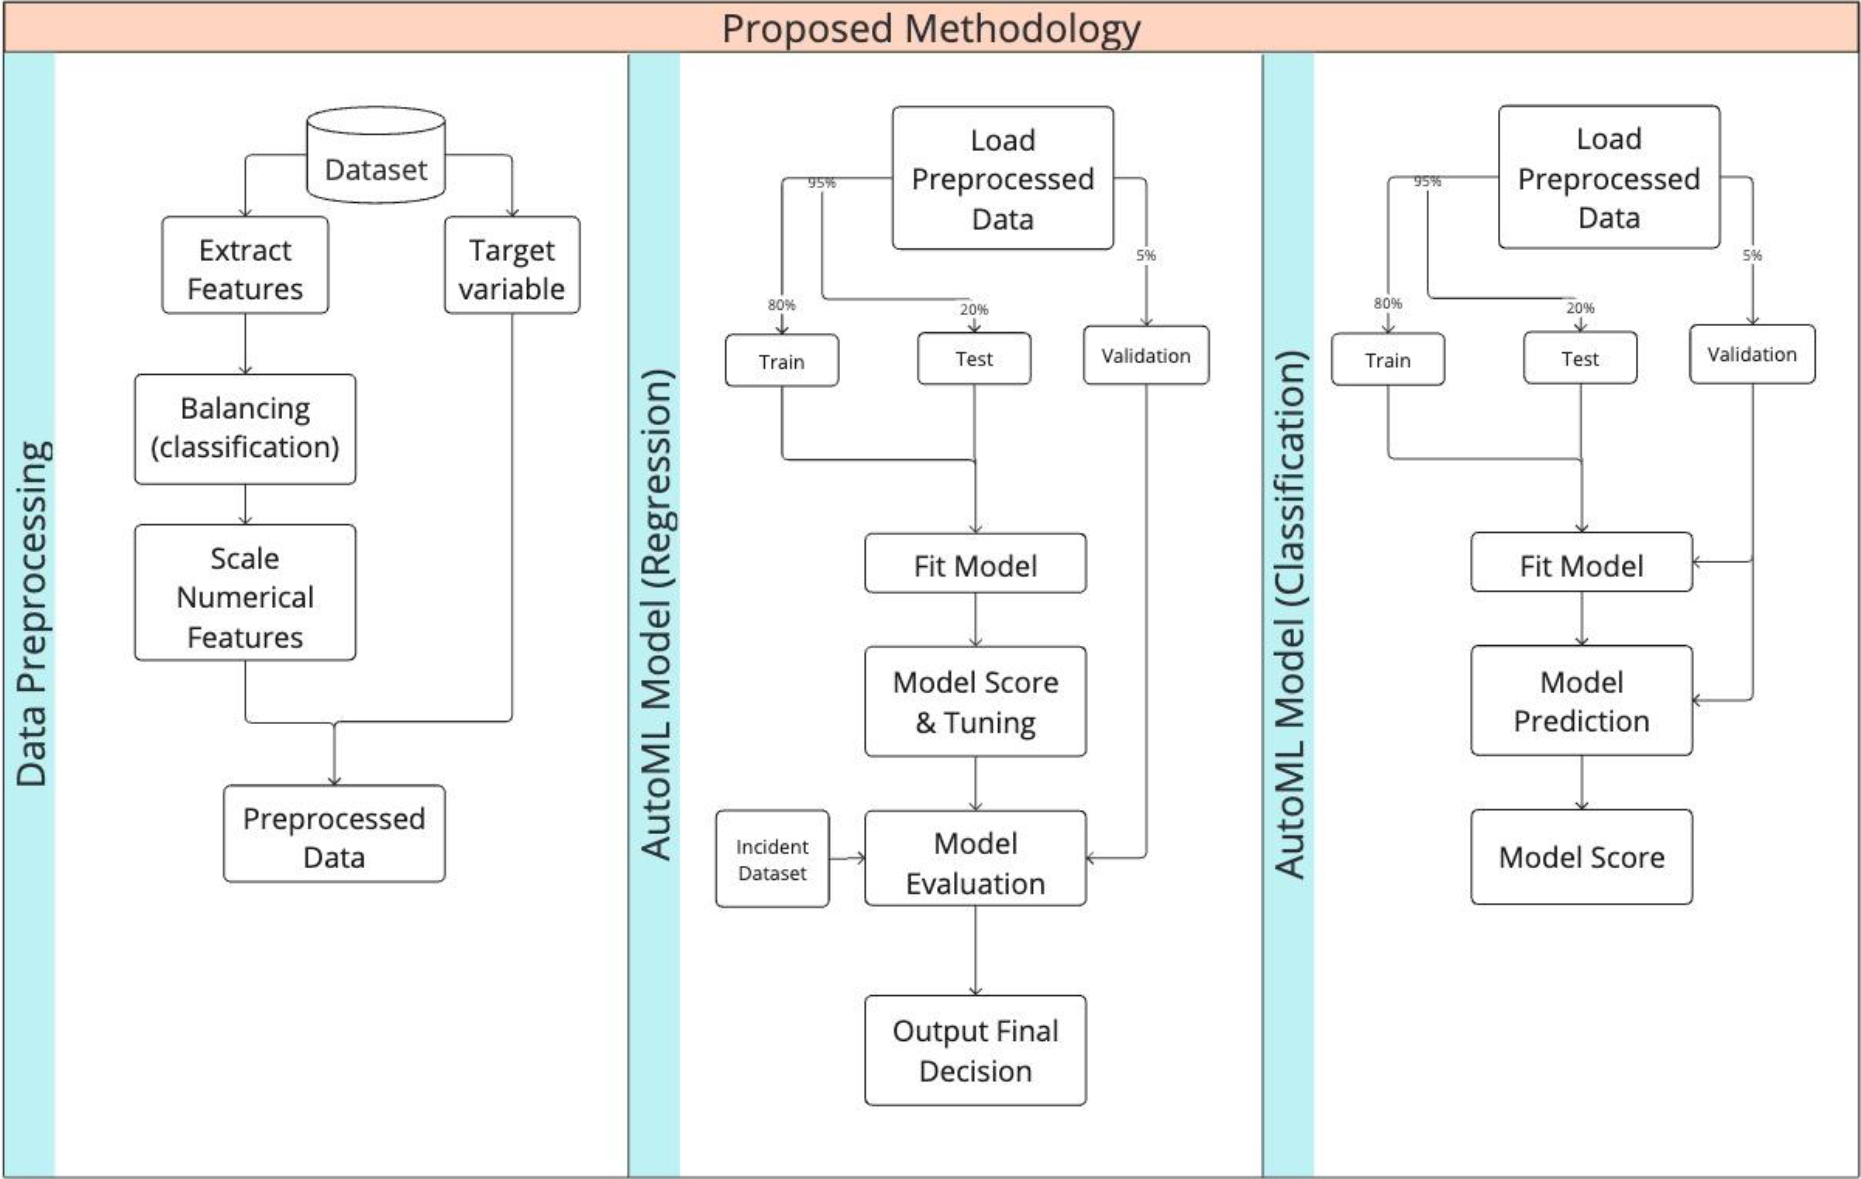
It is important to highlight that in this work, the data-preprocessing step – which includes feature extraction, data sampling, and balancing – is carried out before training the models. This pre-processing is integral to both models’ capability; however, a decision has been taken for pre-processing to be executed independently to guarantee compatibility, ensure uniformity across models, and ultimately, amplify their efficiency. A detailed diagram, as shown in Fig. 4, provides an in-depth view of the modeling phase, illustrating the intricate steps involved in the training of both the classification and regression models, thus highlighting the dual approach of tackling automatic incident detection task.
3.1Data preprocessing
The proposed methodology includes data preprocessing to prepare the loop detector dataset, which contains traffic variables such as speed, occupancy and flow as a time series, for modeling. This process aims to ensure the reliability and accuracy of our models in predicting unplanned incidents. The preprocessing primarily involves feature extraction, normalization, and balancing, whenever needed. Normalization adjusts numerical features to a uniform scale, which is vital for machine learning models that depend on measuring distances. Data balancing is carried out to prevent a skew towards the more prevalent class, as this can lead to suboptimal detection of the less common class. There is considerable evidence from many studies showing that both normalization and data balancing can greatly enhance outcomes across a range of applications, e.g. [50, 51]. Algorithms 1 and 2 describe the steps of preparing the dataset at hand for modeling by performing data preprocessing for classification and regression task accordingly This leads to a pre-processed dataset that is suitable for use in either classification or regression models.
| Algorithm 1: Data Pre-processing for classification task |
|---|
| Input: dataset (D), output target incidents (T) |
Output: Pre-processed dataset (PD)
|
| Algorithm 2: Data Pre-processing for regression task |
Input: dataset (D) Output: Preprocessed dataset (PD)
|
![Example pipeline automated by TPOT [52].](https://ip.ios.semcs.net:443/media/idt/2024/18-2/idt-18-2-idt240231/idt-18-idt240231-g005.jpg)
3.2TPOT models
Our approach uses TPOT to apply various machine learning strategies and optimization algorithms to grasp and adjust to the data patterns, thereby improving the precision and effectiveness of the incident detection. The models are designed to evolve and refine their predictions based on data, aiming to reduce the time and resources needed for forecasting incidents. Central to our approach is the Tree-based Pipeline Optimization Tool (TPOT), an intuitive machine learning library that simplifies the development process, using genetic programming. TPOT’s automation extends through various stages of the machine learning workflow, including data pre-processing, model selection, hyperparameter tuning, and ultimately, deployment, all with minimal coding requirements. TPOT is an open-source project on GitHub11 and an example pipeline is illustrated in Fig. 5.
In this research, the power of the TPOT library for constructing and evaluating ML models to predict incidents is demonstrated. For both the classification and regression models, a wide range of advanced ML algorithms have been evaluated automatically. To assess the model’s generalization ability, the dataset was divided into three subsets. A portion of 5% was reserved for validation to simulate the model’s performance on unseen data. The remaining 95% was then divided into the 80% training set and 15% testing set to ensure the model was trained on a diverse and sufficient dataset. An automated process was employed for selecting the best algorithm and it is provided in the form of pseudocode below as Algorithm 3, which outlines the essential steps for selecting the best model overall, which is based on a comparison of precision, recall and F1score.
| Algorithm 3: Best Overall Model Selection in our Methodology |
|---|
| Input: Pre-processed dataset (PD), TPOT Classifier and TPOT Regressor models |
Output: Best Auto Predictive Detection Model (bAutoD)
|
4.Case studies
In the following section, we present case studies from two distinct urban contexts, Athens, the capital of Greece, and Antwerp, a major city in Belgium, which validate the efficacy of our methodology within distinct urban environments. Athens provides a complex case with its dense urban network and the inherent challenges of a historic metropolis, while Antwerp offers a contrasting scenario with its strategic significance as a port city and its different network intricacies. In Athens, we explore the application in a critical urban corridor, whereas in Antwerp, the focus shifts to a pivotal route encompassing the city’s port and major motorways. As part of this section, we detail the study area and the datasets utilized.
4.1Athens
Figure 6.
The network of Athens study area.
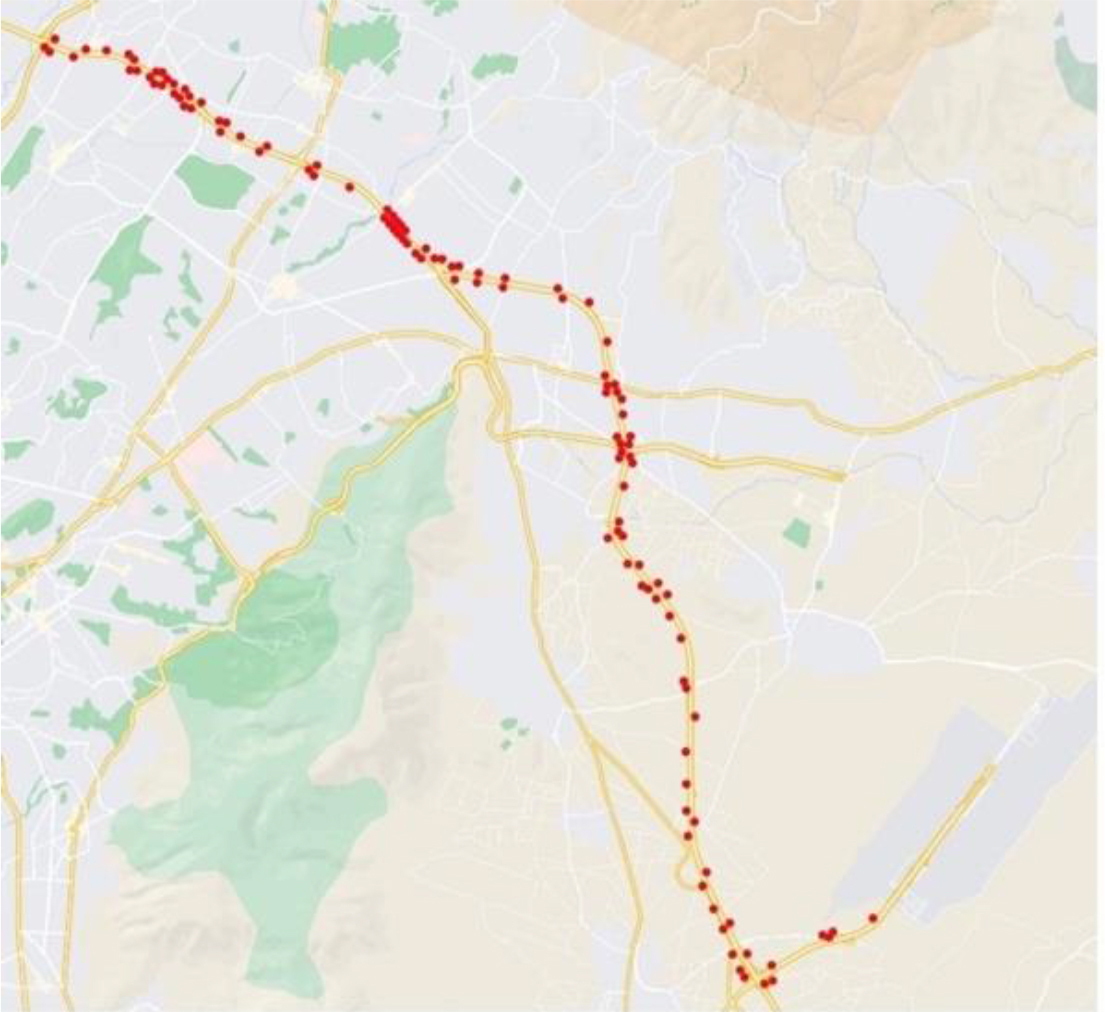
A corridor extending along 70 km and constituting the ring road of a metropolitan area extending from the airport to a populated suburb has been used as study area in our experiments. The road network model developed in the Aimsun Simulation Software [53] is approximately 30 km long and involves 569 sections and 181 nodes and is depicted in Fig. 6.
Data was collected from 591 loop detectors from October 2020 to September 2021. Among these, only 196 detectors were deemed reliable for use in our experiments. Out of the 26,331,086 total readings taken at one-minute intervals during the selected timeframe, various filters were applied. These filters excluded data from detectors missing in the station aggregation file, removed outliers in flow reliability, corrected flow-occupancy-speed discrepancies, discarded detectors with over 50% missing values (NaNs), filtered out constant readings over time, eliminated isolated values, and corrected for uncharacteristic profiles. To address missing or unreliable data, which affected around 35% of the readings, several imputation methods were employed, including polynomial, time-based k-nearest neighbor (KNN), free-flow speed, spatial KNN, PPCA-based, and weekday-based imputation. Given the low reliability of the loop detectors’ occupancy and speed data, flow was the variable chosen for use in the experiments.
Beyond the Inductive Loop Detectors dataset, which records network attributes such as speed, occupancy, and flow, we also utilize a critical dataset of labeled incidents supplied by the highway authority in our area of study. This dataset is essential to our research as it contains 34,652 recorded incidents across 34 features. It is invaluable for gauging our models’ performance since it provides a benchmark of actual events, or “ground truth,” for comparison. Utilizing this dataset allows us to verify the precision and reliability of our incident detection methods, thereby guiding us to make well-founded choices and ensuring the predictions that are obtained are of high quality. The feature columns of this dataset include information regarding ‘timestamp’, ‘source’, ‘start_time’, ‘end_time’, ‘direction’, ‘intersection’, ‘toll_station’, ‘branch’, ‘position_(pk)’, ‘type’, ‘subcategory’, ‘outcome’, ‘deaths’, ‘injured’, ‘queue_start_time’, ‘queue_end_time’, ‘queue_length_cars’, ‘queue_length_time’, ‘weather’ among others. During an exploratory data analysis, certain discrepancies in the dataset were discovered, particularly regarding incidents that were recorded but did not noticeably affect traffic flow. To maintain the integrity of our experiments, we’ve instituted a filtering process to exclude these anomalies, thus preserving the uniformity of the loop detector data for analysis. Noteworthy findings include:
• Two particular sections of the highway were found to have the most incidents, with counts of 13,829 and 13,757 respectively. Given that these incidents predominantly occurred on the main segments of the highway, our analysis will specifically concentrate on these areas.
• The incident data was refined to consider only instances of Traffic Congestion and Traffic Accidents, aligning with the primary interests of our research.
• Additionally, we refined the incident data based on the length of the resulting traffic queue. After consulting with stakeholders, we lowered the queue length criterion from 200 meters to 50 meters, acknowledging their expertise and the rarity of 200-meter queues on this particular highway under normal circumstances, even when incidents occur.
Post-filtering, the refined dataset largely derives from the closed-circuit television (CCTV) system, containing a total of 1,786 recorded incidents for the two main highway sections, with 763 incidents coinciding with the traffic measurement period. After cleansing and refining the dataset, we reformatted it for use with our algorithms. The data was arranged in 5-minute intervals, with rows indicating time stamps, columns representing loop sensor IDs, and matrix values set to 1 for timestamps and locations with an incident, and 0 where no incident occurred.
Figure 7.
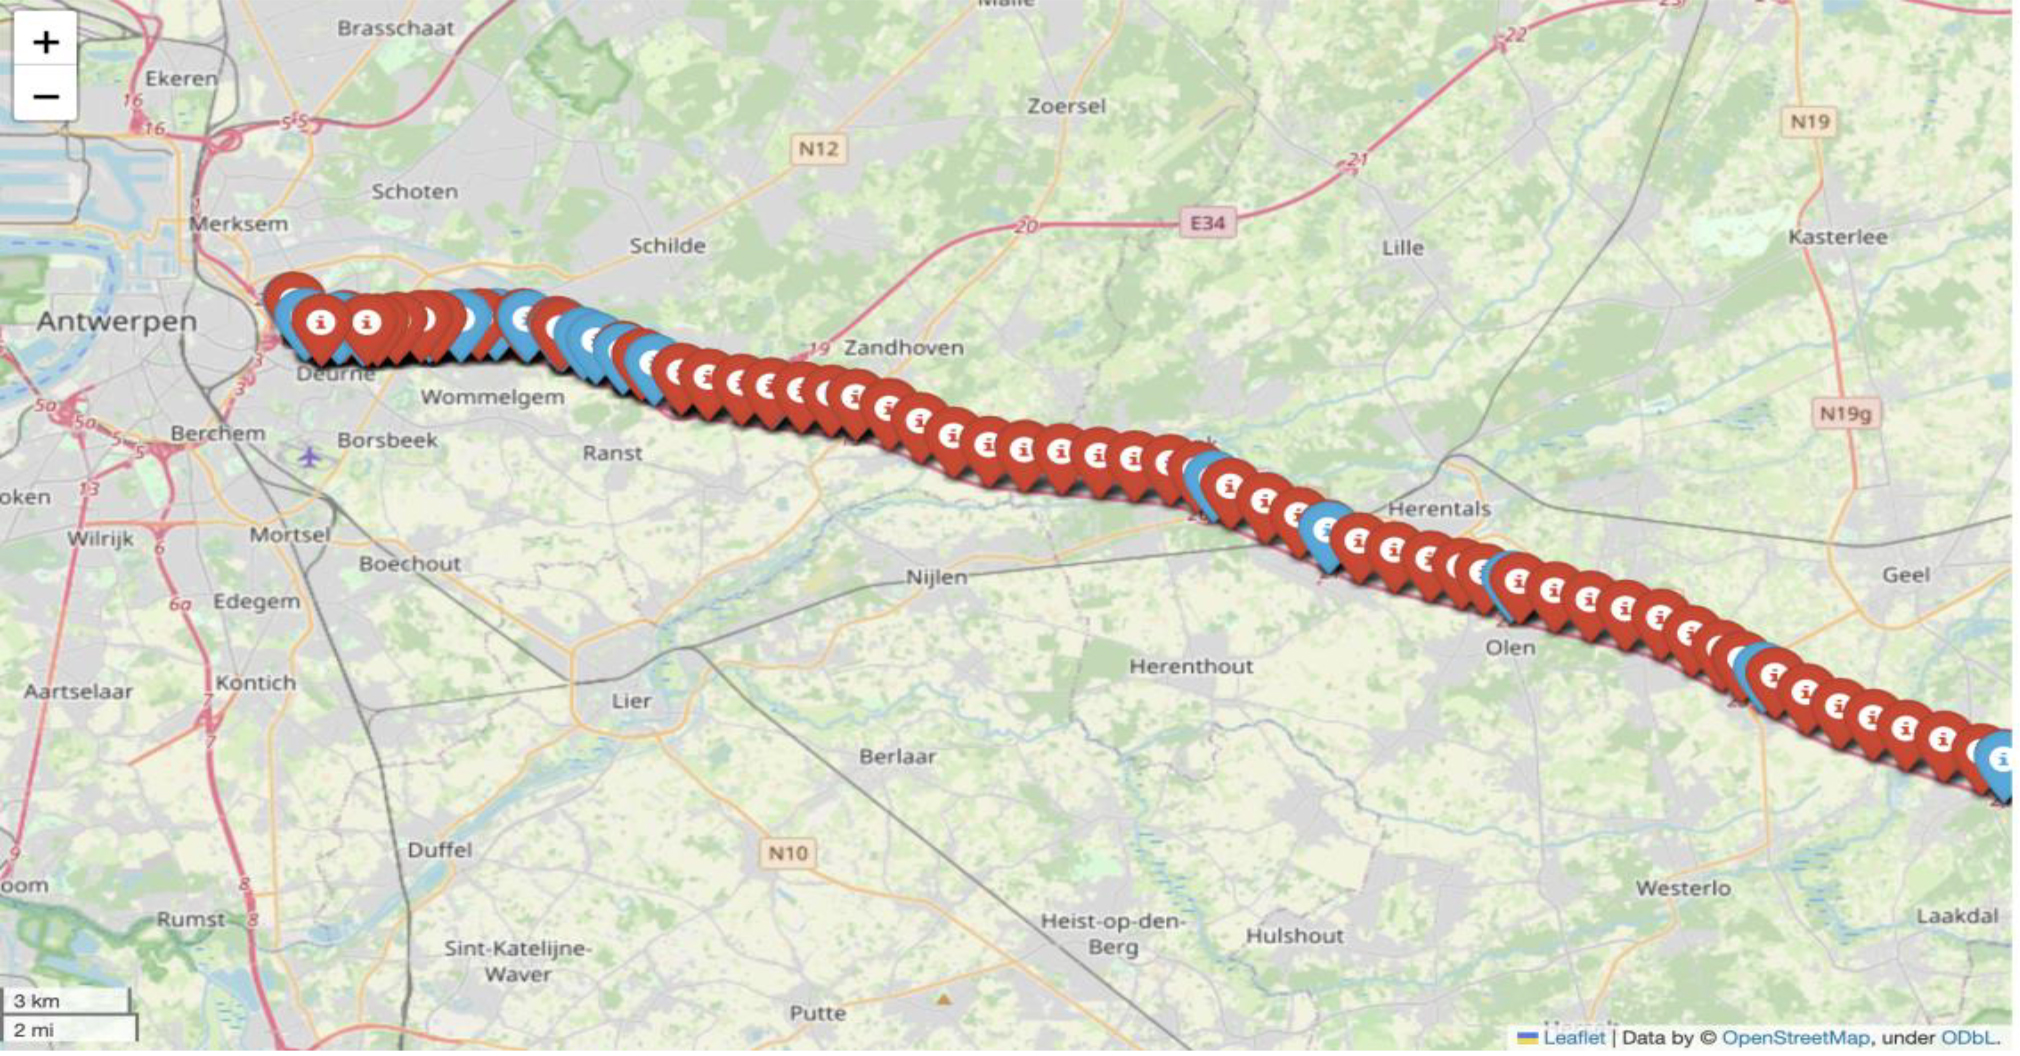
Locations of loop detectors in Antwerp study area.
4.2Antwerp
For the city of Antwerp, there is a multitude of inductive loop detectors available which provide one-minute readings regarding the network conditions, however, the area which has been deemed suitable to be used as a test bed of our incident detection task represents the corridor between the port of Antwerp and Eindhout including E313 motorway in both directions. This area includes 103 nodes in Direction 1 and 164 nodes in Direction 2 and in Fig. 7 the locations of the sensors are depicted on a map.
The traffic data for E313 highway collected by loop detectors include the number of vehicles and the average speed, occupancy and flow, in addition to other traffic measurements, such as statusDescription, faultDescription and regularity, for 5 different vehicle classes/categories, aggregated per minute and the location of the measurement points. Loop detector data from 267 units was gathered from end of October 2022 to end of August 2023 The analysis of raw data yielded acceptable results in terms of quality of detectors’ measurements, where one can observe some data gaps around May-June 2023 and a couple of missing days in Oct-Nov 2022. There are seven detectors that do not provide consistent readings over the whole period and those have been excluded from the analysis. In the pre-processing phase of our analysis, we employed a meticulous filtering and cleaning process to ensure the integrity and quality of the data. Initially, we identified and rectified any anomalies in the data, such as outliers or incomplete records. Subsequently, to streamline the dataset for more coherent analysis, we aggregated the different vehicle categories into a single, consolidated attribute. This means that we only kept the sum of vehicleFlowRate and the average of the speed, in addition to the supplementary attributes mentioned above. This aggregation enables a more generalized assessment of traffic patterns while maintaining the robustness of the data. Moreover, several other cleaning processes have been employed, as described in the Athens’ case study above in Section 5.1. After cleaning, aggregation and filtering the resulting data show acceptable reliability scores (overall above 0.4 in a scale from 0 to 1, where 1 is the highest reliability), and then it was necessary to transform the loop detector data and split in three distinct datasets, for speed, flow and occupancy respectively. Moreover, resampling of the dataset every 5 minutes has been performed.
Together with the loop detector dataset which contain information of the traffic characteristics, we have managed to acquire an Excel file with details for the incidents which had been registered in E313 Antwerp highway. The labelled incidents dataset includes 5774 incident occurrences in total, spanning from 2011-04-26 11:29:19.647 until 2023-08-29 13:29:52.907 and more specifically for our case and the dates selected (2022-10-27 to 2023-08-29), it contains 526 incidents for 2023 and 136 incidents for 2022. This dataset contains the following fields: segment_id, incident_id, registration_time, duration, direction and location of the incident (kmpt1 and kmpt2). Based on the start timestamp and duration of the incidents specified in the relative columns of the dataset, we have mapped these timestamps to the corresponding start and end time. However, it is impossible to perform further filtering of this dataset based on its impact in traffic or severity from the information available. Thus, all the incidents reported in the dataset are kept in the evaluation dataset. Finally, the filtered incidents dataset has been transformed in 5-minute intervals where rows refer to timestamps and columns were the ids of the segments and the values of the matrix were 1 if this location and time corresponds to an incident occurrence, or 0 otherwise.
5.Results and analysis
This section presents the data preparation process and the results obtained with the experimental set-up described in the previous section for both case studies. In both metropolitan contexts, Athens and Antwerp, our approach was benchmarked against established baseline methodologies. Moreover the limitations of our methodology are presented as part of this section.
5.1Data preparation process
The loop detector datasets need to be prepared in order to be fed to the pipeline described in Section 4. First of all, data cleaning is performed and the respective features are extracted. Moreover, the loop detector datasets for both case studies suffer from imbalance issues, as the majority of samples belong to the Normal class. The challenge of working with imbalanced datasets is that most machine learning techniques will ignore, and in turn have poor performance on, the minority class, although it is the performance on the minority class that is mostly important. To address this issue, the Synthetic Minority Oversampling Technique (SMOTE) [54] and Tomek link [55] is frequently employed. In our experiments, we have chosen to combine SMOTE with Tomek links technique, as it has been shown that this method is much superior compared with that of using only one of the two. To mitigate this issue, the Synthetic Minority Oversampling Technique (SMOTE) [54] and Tomek link [55] are often used. In our experiments, we opted to integrate SMOTE with the Tomek links method, as this combination has proven to be substantially more effective than utilizing either approach independently [56, 57]. Afterward, the data were normalized by the Robust Scaler, which scales the features using statistics that are robust to outliers. Table 2 summarizes the steps involved in the data-preprocessing process used in this research.
Table 2
Preprocessing operations applied in the loop detector datasets
| Preprocessing operation | Details |
|---|---|
| Data cleaning | A series of filters was applied to the data to:
|
| Resampling | Resampling to 5-minute intervals. |
| Features extraction | The following features have been extracted for the classification task: Traffic_Variables*1, Upstream and downstream Traffic_Variables for adjacent detectors, Mean upstream and downstream Traffic_Variables of detector [5, 10, 15] minutes before, Mean upstream and downstream Traffic_Variables of detector [5, 10, 15] minutes after, Mean upstream and downstream Traffic_Variables of adjacent detectors [5, 10, 15] minutes before, Mean upstream and downstream Traffic_Variables of adjacent detectors [5, 10, 15] minutes after, time_of_day, day_of_week, is_weekend, is_holiday. For the regression task, the same set of features have been extracted, with the exception of: Mean upstream and downstream Traffic_Variables of detector [5, 10, 15] minutes after and Mean upstream and downstream Traffic_Variables of adjacent detectors [5, 10, 15] minutes after. *1{Flow} for Athens case study; {Flow, Occupancy, Speed} for Antwerp case study. |
| Data balancing*2 | SMOTE with Tomek Link. *2Only used for the classification task |
| Normalization | Robust Scaler. |
Regarding the processing of the target dataset, the labelled incidents’ dataset, as it has thoroughly been described per case study in Section 5, we would like to acknowledge that there are certain limitations in our methodology, particularly in terms of data filtering and the intrinsic constraints of the data collected. First, it’s possible that not all incidents were captured and logged in the dataset. Despite indications that incidents were manually recorded, primarily through CCTV surveillance, there’s still a risk of missing some occurrences. Second, the exact timing of the recorded incidents might not be accurate. An incident that happens at a given moment might be recorded with a delay, affecting the assessment of our algorithms’ performance. Lastly, our filtering process is not exempt from potential errors. Despite basing our criteria on stakeholder expertise and the nature of the data, it’s conceivable that some significant incidents could have been inadvertently excluded from our analysis.
5.2AutoML classification and regression validation models
The scoring function was used to evaluate multiple machine-learning algorithms using predefined metrics, including recall, precision, and F1 score. These metrics can be defined and calculated as follows [58]:
The precision of an automatic incident detection algorithm is the ratio of correctly predicted positive observations (incidents) to the total predicted positive observations (incidents)
(1)
The recall is the ratio of correctly predicted positive observations to all observations in the actual class. Recall is also commonly referred to as the detection rate. The Recall metric measures the model’s ability to accurately identify all positive cases. A model will be judged as correctly detecting an incident if an alert was raised at any point during an incident.
(2)
The F1 Score is a metric that combines precision and recall into a single value by taking their weighted average. It considers both false positives and false negatives in its calculation. While it may not be as straightforward to perceive, the F1 Score is often a better measure than accuracy, particularly when dealing with datasets that have an unequal distribution of classes.
(3)
These standard performance metrics have been widely utilized in the Machine Learning domain due to their effectiveness in assessing algorithm performance [59]. It should be acknowledged that there exists a interconnecting relationship among these metrics, whereby an enhancement in one may lead to a degradation in another [60].
5.3Results for the case studies
In this subsection, the comparison between our Automated Machine Learning approach and baseline ML methods are presented for each case study, Athens and Antwerp.
Table 3
Comparison of our approach with baseline methods – Athens
| Algorithm | Precision | Recall | F1-score |
|---|---|---|---|
| AutoML (per timestamp) | 0.83 | 0.62 | 0.71 |
| Isolation Forest (per timestamp) | 0.012 | 0.44 | 0.023 |
| AIMSUN (per timestamp) | 0.08 | 0.50 | 0.14 |
5.3.1Athens
For the use case of Athens, the results are depicted in Table 3. We have made the decision to compare the outcome of our methodology with an Unsupervised method (Isolation Forest) and a data driven AIMSUN algorithm [61].
The algorithm which has been selected as the optimal from our methodology is the following:
LinearSVR(GradientBoostingRegressor(input_matrix, alpha
Regarding the two baseline approaches, Isolation Forests are generally used in an unsupervised manner and only require a few conditions to separate anomalies from normal observations when compared to other methods which use basic distance and density measures. There are several works in the field of AID which use Isolation Forests, including [37]. Their low linear time complexity and small memory requirements aid in eliminating major computational cost of distance calculation in all distance and density-based methods and can perform well in a multi-dimensional feature space.
Aimsun’s baseline has been built upon the assumption that incident detection can be regarded as a transformation of individual timeseries to a space where the distance between structural outliers is magnified independently on each input variables, aiming to create a with a methodology that is able to cope with current limitations in the area by being trained in an unsupervised way (i.e., independently of having labelled datasets), working independently on different timeseries (e.g., traffic flow, or speed, or occupancy) and working without the need of close sensor-pairs. According to [62], two types of anomalies or outliers can be distinguished: distributional outliers and structural outliers. Road traffic incidents belong to the latter category, whose detection is not equally easy for all traffic variables. For example, road traffic occupancy usually offers easier incident detection than traffic flow. Similarly, occupancy difference between sensor-pairs offers an easier detection than single-sensor occupancy. Preliminary results of this work have been presented in the MFTS symposium22 beginning of December, 2022.
Table 4
Comparison of our approach with baseline ML methods – Antwerp
| Algorithm | Precision | Recall | F1-score |
|---|---|---|---|
| AutoML (per timestamp) | 0.77 | 0.52 | 0.54 |
| SVM (per timestamp) | 0.62 | 0.96 | 0.753 |
| Autoencoder (per timestamp) | 0.03 | 0.48 | 0.056 |
5.3.2Antwerp
For the use case of Antwerp, the results are depicted in Table 4. A decision to compare the outcome of our methodology with a Supervised method (Support Vector Machine) and a Generative Neural Network (AutoEncoder).
The pipeline which has been selected as the optimal from our methodology is the following:
Pipeline(steps
Regarding the two baseline approaches, support vector machine (SVM) is a supervised approach which is constructed from a unique learning algorithm that extracts training vectors that lie closest to the class boundary and makes use of them to construct a decision boundary that optimally separates the different classes of data) [9]. Results from various studies have shown that SVM offers a lower misclassification rate, higher correct detection rate, lower false alarm rate and slightly faster detection time than other models in traffic incident detection [63]. An Autoencoder is a generative unsupervised deep learning algorithm used for reconstructing high-dimensional input data using a neural network with a narrow bottleneck layer in the middle which contains the latent representation of the input data. It consists of an Encoder and a Decoder. The Autoencoder accepts high-dimensional input data, compress it down to the latent-space representation in the bottleneck hidden layer; the Decoder takes the latent representation of the data as an input to reconstruct the original input data. Therefore, Autoencoders have been used for Anomaly Detection tasks (for instance [64, 65]), by comparing the output from the Decoder and the input to the Network and using a threshold, either manually set or learnt from the data itself. If the loss value exceeds the threshold, then the instance is categorised or classified as an anomaly.
5.4Discussion of results and comparison between different urban environments
The results of our experiments show variability among the different techniques applied, underscoring the necessity for more in-depth research. It is pertinent to note that the labeled incidents were limited to the network’s visible areas, which has a significant impact on the false positive rate. It remains uncertain whether false positives are attributable to incidents that were undetected by the data provider (hence, an incident did occur but was not labeled) or if they are genuinely incorrect predictions by the algorithm. Additionally, it is important to bear in mind that the dataset used for evaluation was structured into five-minute intervals for algorithmic processing. Consequently, in calculating precision, a true positive is only recognized when an event is detected at the precise timestamp it was recorded.
In this light, among the algorithms tested, for the Athens dataset, we observe significant performance superiority of our approach compared to the baseline methods. On the other hand, while the Isolation Forest algorithm demonstrated a satisfactory recall, its precision was notably poor, leading to a substantial quantity of false positives that adversely affected the resulting F1-score. Aimsun’s model, despite displaying relatively low performance on a per-timestamp basis, showed improved outcomes when evaluated on an event-based approach, considering a 15-minute window around the labeled incident. Within this framework, our analysis for the month of May 2021 identified 11 out of 15 events, achieving a recall rate of 73%. This level of recall is deemed satisfactory for the detection of non-recurrent events.
For the Antwerp dataset, among the algorithms tested, the Support Vector Machine (SVM) emerged as the most effective technique, showing both high precision and recall. These results are consistent with the findings reported in the literature, which indicate that SVM tends to excel in scenarios where a labeled incidents dataset is used, due to its supervised learning characteristics [66, 27]. Nonetheless, it’s important to consider that this method may be prone to overfitting and could potentially lack the ability to generalize to new, unseen data. On the other hand, the Autoencoder achieved high levels of recall but did not perform as well with regards to the precision metric
All in all, one of the limitation of our analysis in both cases is the fact that these techniques are bound to produce a high number of false positives as shown by the precision results, thus the concept of false positives is hard to really assess in the incident detection task due to possible blind spots in the network which remain undetected. It is evident that each city presented unique challenges and outcomes in incident detection. In Athens, our approach outperformed baseline methods in terms of all the established metrics. Conversely, in Antwerp, the SVM algorithm was superior in terms of F1-score and recall, but at the same time, our approach outperformed it regarding precision metric. The Autoencoder, while achieving high recall, fell short on precision and, like in Athens, the discernment of false positives was complicated by potential blind spots in data coverage. These variations underscore the necessity for tailored algorithmic strategies and the consideration of local data specificities in incident detection across different urban environments.
Lastly, It is important to recognize that while AutoML aims to streamline and optimize the model selection and training process, it does not negate the value of understanding specific ML techniques’ performance in targeted applications. Our comparison seeks to highlight how our AutoML-powered approach stand against manually tuned and selected models in the specific domain of incident detection using loop detector data, emphasizing the efficacy, adaptability, and performance in real-world scenarios.
However, we acknowledge that our evaluation primarily focuses on conventional metrics such as precision, recall, and F1-score. While these metrics provide valuable insights into the models’ performance in detecting incidents accurately, they do not fully encapsulate the operational context within which these detection models are deployed. Factors such as the mean time to detect an incident, the speed of propagation of detected incidents, and the practical implications of false positives and false negatives on traffic management and response strategies are not directly addressed in this paper.
5.5Limitations
Our research acknowledges certain constraints, particularly in data collection and processing. Limitations arise from the manual registration of incidents by operators, potentially leading to omissions or timing inaccuracies in the dataset. Consequently, such discrepancies can significantly skew the performance evaluation of our algorithms. The filtering process specifically for the Athens labelled incidents’ dataset is susceptible to errors, and despite being informed by stakeholder operator expertise, the risk of overlooking significant incidents cannot be ignored. Additionally, the decision to format the evaluation dataset in 5-minute intervals may seriously have affected the precision metric, as it requires the detection of events at their exact recorded timestamps.
Moreover, our analysis is contingent upon the quality of the input datasets and their respective reliability, and more specifically on the measurements of the detectors, and the accuracy and completeness of incident reporting, the basis of our evaluation. False positives within our model outcomes may not solely represent algorithmic inaccuracies but could also reflect events unlabelled due to visibility issues within the network’s coverage. The reliance on a single data source, CCTV footage, limits our ability to comprehensively capture all incidents, suggesting that incorporating diverse data types could enhance detection and reduce false positives. The challenge of accurately determining false positives due to potential network blind spots is recognized and underscores the need for a multifaceted approach in future research to mitigate such issues. One way to decrease the false alerts generated is to incorporate various types of data, such as CCTV cameras which is also the vision of our work for the future, to train the algorithms. Despite the abundance of available data and the advanced capabilities of machine learning algorithms, only a limited number of studies have effectively utilized the combination of multiple data sources, as stated by the review conducted by Kashinath et al. [67].
Lastly, we recognizethat our paper’s scope is limited by its focus on immediate detection metrics (precision, recall and f1-score), which, while crucial, do not encompass the broader operational implications of deploying such technologies in real-world traffic management systems. As such, we propose that future work should extend beyond traditional performance metrics to evaluate AutoML and other ML techniques within the context of their downstream applications. Specifically, research should explore the operational impact of these detection technologies, including their effect on mean time to detect incidents, the propagation speed of detected incidents through traffic networks, and their integration into comprehensive traffic management strategies. Such an approach will provide a more holistic understanding of the value and limitations of AutoML and other ML techniques in traffic incident detection, guiding both technological development and strategic implementation in this critical domain.
6.Conclusions
This study presented a novel automated approach designed to enhance predictive quality in automatic traffic incident detection using Automated Machine Learning (AutoML). Our proposed system minimizes human intervention by utilizing AutoML algorithms to dynamically optimize prediction models regarding the early detection of incidents. The reduced need for manual model construction allows data analysts to focus on case-specific requirements and interpretive tasks. This paper delved into the benefits of AutoML in traffic incident detection, while a comparative analysis was conducted to determine how AutoML results differ from traditional baseline ML approaches in both Athens and Antwerp use cases, and the experimental results have affirmed the efficacy and superior performance of our methodology.
Incorporating AutoML into the automatic incident detection process presents an opportunity to significantly enhance predictive accuracy and operational efficiency. Based on our conducted work, in addition to the lessons learnt and gaps identified, we hereby shortly present our recommendations for data scientists and/or machine learning engineers interested in applying AutoML in the domain of transportation and specificallty incident detection. The selection of an appropriate AutoML platform should be meticulously aligned with the specific demands of the task, while preprocessing and ensuring the quality of data form the foundation for reliable model training, while special attention must be given to the challenge posed by imbalanced datasets encountered in this task. Furthermore, the AutoML system must be capable of conducting extensive model experimentation and hyperparameter optimization to ascertain the most suitable predictive model. Feature engineering and selection, facilitated by AutoML, can uncover influential predictors that may otherwise be overlooked. An open issue in the field of AutoML is the fact that most algorithms focus on solving a specific task at hand. Thus, a future direction could be that a high-quality AutoML system should have the capability of lifelong learning, i.e., it should be able to: (1) efficiently learn new data and (2) remember old knowledge [68], thus adapting to new patterns and anomalies as they emerge, ensuring the model remains current and accurate over time. Additionally, scalability and performance considerations ensure that the system can grow and respond swiftly as data volume escalates. Last but not least, seamless integration with existing systems is vital to facilitate smooth operations and sustain the flow of insights derived from the AutoML-powered incident detection system.
As AutoML continues to refine its automated processes, its capacity for customization and integration of domain-specific constraints is expected to expand, offering vast potential in predictive analytics. Future work is set to explore integrating advanced feature-engineering techniques and domain knowledge to further enhance the model’s performance within the context of incident detection and extend the set of performance metrics beyond the traditional ones, with the goal of enhancing the set of guidelines already provided for its future application in this critical domain. This paper contributes to the field of intelligent traffic systems by demonstrating the efficacy of AutoML in improving urban traffic management, while the findings underscore the versatility and effectiveness of AutoML in incident detection, setting the stage for its application as a transformative tool in urban centers worldwide.
Notes
Acknowledgments
This work is funded by the European Union’s Horizon 2020 project FRONTIER (“Next generation traffic management for empowering CAVs integration, cross-stakeholders collaboration and proactive multi-modal network optimization”) under grant agreement No 955317. The work presented here reflects only the authors’ view and the European Commission is not responsible for any use that may be made of the information it contains.
References
[1] | Balke KN. An evaluation of existing incident detection algorithms. TRID, (1993) . |
[2] | Hutter F, Kotthoff L, Vanschoren J, editors. Automated Machine Learning: Methods, Systems, Challenges. Springer; (2018) . |
[3] | Song H, Triguero I, Ozcan E. A review on the self and dual interactions between machine learning and optimisation. Prog Artif Intell. (2019) ; 1-23. |
[4] | Hutter F, Kotthoff L, Vanschoren J. Automated Machine Learning: Methods, Systems, Challenges. Springer International Publishing, (2019) . |
[5] | He X, Zhao K, Chu X. AutoML: A survey of the state-of-the-art. Knowl-Based Syst. (2021) ; 212: : 106622. |
[6] | Karmaker SK, Mahadi HM, Smith MJ, Xu L, Zhai C, Veeramachaneni K. AutoML to Date and Beyond: Challenges and Opportunities. ACM Comput Surv. (2022) ; 54: (8): Article 175. |
[7] | Ratner A, Bach SH, Ehrenberg H, Fries J, Wu S, Ré C. Snorkel: Rapid training data creation with weak supervision. VLDB J. (2020) ; 29: (2): 709-730. |
[8] | Altman N. An introduction to kernel and nearest-neighbor nonparametric regression. Am Stat. (1992) ; 46: (3): 175-185. |
[9] | Cortes C, Vapnik V. Support-vector networks. Mach Learn. (1995) ; 20: (3): 273-297. |
[10] | Thornton C, Hutter F, Hoos H, Leyton-Brown K. Auto-WEKA. In: Proceedings of the 19th International Conference on Knowledge Discovery and Data Mining; (2013) ; 847-855. |
[11] | Komer B, Bergstra J, Eliasmith C. Hyperopt-sklearn: automatic hyperparameter configuration for scikit-learn. In: Proceedings of SciPy; (2014) ; pp. 33-39. |
[12] | Feurer M, Klein A, Eggensperger K, Springenberg J, Blum M, Hutter F. Efficient and robust automated machine learning. Adv Neural Inf Process Syst. (2015) ; 28: : 2962-2970. |
[13] | Sparks E, Talwalkar A, Haas D, Franklin M, Jordan M, Kraska T. Automating model search for large scale machine learning. In: Proceedings of System-on-Chip Conference; (2015) ; pp. 368-380. |
[14] | Sabharwal A, Samulowitz H, Tesauro G. Selecting near-optimal learners via incremental data allocation. In: Proceedings of the Thirtieth Conference on Artificial Intelligence; (2016) ; pp. 2007-2015. |
[15] | Olson RS, Bartley N, Urbanowicz RJ, Moore JH. Evaluation of a tree-based pipeline optimization tool for automating data science. In: Proceedings of the Genetic and Evolutionary Computation Conference 2016; New York; (2016) . |
[16] | Swearingen T, Drevo W, Cyphers B, Cuesta-Infante A, Ross A, Veeramachaneni K. ATM: a distributed, collaborative, scalable system for automated machine learning. In: 2017 IEEE International Conference on Big Data; (2017) . pp. 151-162. |
[17] | Mohr F, Wever M, Hüllermeier E. ML-Plan: automated machine learning via hierarchical planning. Mach Learn. (2018) ; 107: (8): 1495-1515. |
[18] | Jin H, Song Q, Hu X. Auto-keras: an efficient neural architecture search system. In: Proceedings of the 25th ACM SIGKDD International Conference on Knowledge Discovery & Data Mining; (2019) . pp. 1946-1956. |
[19] | Nikitin NEA. Automated evolutionary approach for the design of composite machine learning pipelines. Future Gen Comput Syst. (2022) ; 127: : 109-125. |
[20] | Gijsbers P, LeDell E, Thomas J, Poirier S, Bischl B, Vanschoren J. An open source AutoML benchmark. arXiv. (2019) . |
[21] | Zöller M, Huber M. Benchmark and survey of automated machine learning frameworks. J Artif Intell Res. (2021) ; 70: : 409-472. |
[22] | Fikardos M, Lepenioti K, Bousdekis A, Bosani E, Apostolou D, Mentzas G. An Automated Machine Learning Framework for Predictive Analytics in Quality Control. In: Advances in Production Management Systems. Smart Manufacturing and Logistics Systems: Turning Ideas into Action. APMS 2022. IFIP Advances in Information and Communication Technology; (2022) ; 663. |
[23] | Dion FRH, Kang Y. Comparison of delay estimates at under-saturated and over-saturated pre-timed signalized intersections. Transp Res Part B Methodol. (2004) ; 38: (2): 99-122. |
[24] | Hireche S, Dennai A. Machine Learning Techniques for Road Traffic Automatic Incident Detection Systems: A Review. In: Hatti M, editor. ICAIRES 2019. Springer Nature Switzerland AG 2020. LNNS 102; (2020) . pp. 60-69. |
[25] | Li L, Lin Y, Du B, Yang F, Ran B. Real-time traffic incident detection based on a hybrid deep learning model. Transportmetrica A: Transp Sci. (2022) ; 18: (1s): 78-98. |
[26] | Evans J, Rhys AV. Improving road incident detection algorithm performance with contextual data. (2020) . |
[27] | ElSahly O, Abdelfatah A. Systematic Review of Traffic Incident Detection Algorithms. Sustainability. (2022) ; 14: : 14859. |
[28] | Huang T, Wang S, Sharma A. Highway crash detection and risk estimation using deep learning. Accid Anal Prev. (2020) ; 135: : 105392. |
[29] | Pan TL, Sumalee A, Zhong RX, Indra-payoong N. Short-Term Traffic State Prediction Based on Temporal – Spatial Correlation. IEEE Trans Intell Transp Syst. (2014) ; 14: (3): 1242-1254. |
[30] | Ma X, Tao Z, Wang Y, Yu H, Wang Y. Long short-term memory neural network for traffic speed prediction using remote microwave sensor data. Transp Res Part C Emerg Technol. (2015) ; 54: : 187-197. |
[31] | Nayak R, Pati CU, Das KS. A comprehensive review on deep learning-based methods for video anomaly detection. Image Vis Comput. (2021) ; 106. |
[32] | Liu G, Jin H, Li J, Hu X, Lia J. A Bayesian deep learning method for freeway incident detection with uncertainty quantification. Accid Anal Prev. (2022) ; 176. |
[33] | Zhu L, Guo F, Krishnan R, Polak JW. The Use of Convolutional Neural Networks for Traffic Incident Detection at a Network Level. Technical Report. (2018) . |
[34] | Li D, Hu JCX, Zhou J. Learning to detect traffic incidents from data based on tree augmented naive Bayesian classifiers. Discrete Dyn Nat Soc. (2017) ; 2017: : 1-9. |
[35] | Dardor M, Chlyah M, Boumhidi J. Incident detection in signalized urban roads based on genetic algorithm and support vector machine. In: Proceedings of the 2018 International Conference on Intelligent Systems and Computer Vision, Fez, Morocco, IEEE; (2018) . |
[36] | Shang Q, Feng L, Gao S. A Hybrid Method for Traffic Incident Detection Using Random Forest-Recursive Feature Elimination and Long Short-Term Memory Network With Bayesian Optimization Algorithm. IEEE Access. (2020) ; PP(99). |
[37] | Zhu L, Wang B, Yan Y, Guo S, Tian G. A novel traffic accident detection method with comprehensive traffic flow features extraction. Signal Image Video Process. (2022) . |
[38] | Yijing H, Wei W, He Y, Qihong W, Kaiming X. Intelligent algorithms for incident detection and management in smart transportation systems. Comput Electr Eng. (2023) ; 110: : 108839. |
[39] | Cui Z, Ke R, Wang Y. Deep Stacked Bidirectional and Unidirectional LSTM Recurrent Neural Network for Network-wide Traffic Speed Prediction. In: 6th International Workshop on Urban Computing (UrbComp 2017); (2018) . |
[40] | Zhu W, Wu J, Fu T, Wang J, Zhang J, Shangguan Q. Dynamic prediction of traffic incident duration on urban expressways: a deep learning approach based on LSTM and MLP. J Intell Connect Veh. (2021) . |
[41] | Zhou Z, Wang Y, Xie X, Chen L, Liu H. RiskOracle: A minute-level citywide traffic accident forecasting framework. In: Proceedings of the AAAI Conference on Artificial Intelligence. (2020) ; 34: (1): 1258-1265. |
[42] | Yu L, Du B, Hu X, Sun L, Han L, Lv W. Deep spatio-temporal graph convolutional network for traffic accident prediction. Neurocomputing. (2021) ; 423: : 135-147. |
[43] | Wang B, Lin Y, Guo S, Wan H. GSNet: learning spatial-temporal correlations from geographical and semantic aspects for traffic accident risk forecasting. In: Proceedings of the AAAI Conference on Artificial Intelligence. (2021) ; 35: (5): 4402-4409. |
[44] | Akhtar M, Moridpour S. A Review of Traffic Congestion Prediction Using Artificial Intelligence. J Adv Transp. (2021) . |
[45] | Angarita-Zapata J, Masegosa A, Triguero I. Evaluating automated machine learning on supervised regression traffic forecasting problems. In: Computational Intelligence in Emerging Technologies for Engineering Applications. (2020) ; 872: : 187-204. |
[46] | Angarita-Zapata J, Triguero I, Masegosa A. A preliminary study on automatic algorithm selection for short-term traffic forecasting. In: IDC 2018. (2018) ; 798: : 204-214. |
[47] | Vlahogianni EI. Optimization of traffic forecasting: intelligent surrogate modeling. Transp Res Part C Emerg Technol. (2015) ; 55: : 14-23. |
[48] | Angarita-Zapata J, Masegosa A, Triguero I. General-Purpose Automated Machine Learning for Transportation: A Case Study of Auto-sklearn for Traffic Forecasting. In: Information Processing and Management of Uncertainty in Knowledge-Based Systems. (2020) ; 1238. |
[49] | Hutter F, Hoos HH, Leyton-Brown K. Sequential model-based optimization for general algorithm configuration. In: Coello CAC, editor. LION 2011; LNCS. (2011) ; 6683: : 507-523. |
[50] | Qian G, Liu J. A comparative study of deep learning-based fault diagnosis methods for rotating machines in nuclear power plants. Ann Nucl Energy. (2022) ; 178: : 109334. |
[51] | Gain U, Hotti V. Low-code AutoML-augmented data pipeline–a review and experiments. J Phys Conf Ser. (2021) ; 1828: : 012015. |
[52] | Le TT, Fu W, Moore JH. Scaling tree-based automated machine learning to biomedical big data with a feature set selector. Bioinformatics. (2020) ; 36: (1): 250-256. |
[53] | Aimsun. Aimsun Next 23 User’s Manual, Aimsun Next Version 230.0. Barcelona; (2023) . |
[54] | Chawla NV, Bowyer KW, Hall LO, Kegelmeyer WP. SMOTE: Synthetic Minority Over-sampling Technique. J Artif Intell Res. (2002) . |
[55] | Tomek I. Two Modifications of CNN. IEEE Trans Syst Man Cybern. (1976) ; 6: (11): 769-772. |
[56] | Zeng M, Zou B, Wei F, Liu X, Wang L. Effective prediction of three common diseases by combining SMOTE with Tomek links technique for imbalanced medical data. Appl Intell. (2016) . |
[57] | Swana EF, Doorsamy W, Bokoro P. Tomek Link and SMOTE Approaches for Machine Fault Classification with an Imbalanced Dataset. Sensors. (2022) . |
[58] | Simeone O. A Brief Introduction to Machine Learning for Engineers. Found Trends Signal Process. (2018) ; 200-431. |
[59] | Zhou J, Gandomi A, Chen F, Holzinger A. Evaluating the Quality of Machine Learning Explanations: A Survey on Methods and Metrics. Electronics. (2021) ; 10: (5): 593. |
[60] | Ghosh B, Smith DP. Customization of automatic incident detection algorithms for signalized urban arterials. J Intell Transp Syst. (2014) ; 18: (4): 426-441. |
[61] | Torrent-Fontbona F, Dominguez M, Fernandez J, Casas J. Towards Efficient Incident Detection in Real-time Traffic Management. In: 4th Symposium on Management of Future Motorway and Urban Traffic Systems (MFTS). Dresden; (2023) . |
[62] | Herrmann M, Scheipl F. A Geometric Perspective on Functional Outlier Detection. Stats. (2021) ; 4: (4): 971-1011. |
[63] | Yuan F, Cheu RL. Incident detection using support vector machines. Transp Res Part C Emerg Technol. (2003) ; 11: (3-4): 309-328. |
[64] | Kopčan J, Škvarek O, Klimo M. Anomaly detection using Autoencoders and Deep Convolution Generative Adversarial Networks. Transp Res Procedia. (2021) ; (55): 1296-1303. |
[65] | Ashraf J, Bakhshi AD, Moustafa N, Khurshid H, Javed A, Beheshti A. Novel deep learning-enabled LSTM autoencoder architecture for discovering anomalous events from intelligent transportation systems. IEEE Trans Intell Transp Syst. (2021) ; 22: (7): 4507-4518. |
[66] | Yuan FCR. Incident Detection Using Support Vector Machines. Transp Res Part C Emerg Technol. (2003) ; 11: : 309-328. |
[67] | Kashinath S, Mostafa S, Mustapha A, Mahdin H, Lim DMM, Mohammed M, Al-rimy B, Fudzee MF, Yang T. Review of data fusion methods for Real-time and Multi-Sensor Traffic Flow Analysis. IEEE Access. (2021) . |
[68] | He X, Zhao K, Chu X. AutoML: A survey of the state-of-the-art. Knowl-Based Syst. (2021) ; 212: : 106622. |


