
Data analytics methods to measure service quality: A systematic review
Abstract
The volume of user generated content (UGC) regarding the quality of provided services has increased exponentially. Meanwhile, research on how to leverage this data using data-driven methods to systematically measure service quality is rather limited. Several works have employed Data Analytics (DA) techniques on UGC and shown that using such data to measure service quality is promising and efficient. The purpose of this study is to provide insights into the studies which use Data Analytics techniques to measure service quality in different sectors, identify gaps in the literature and propose future directions. This study performs a systematic literature review (SLR) of Data Analytics (DA) techniques to measure service quality in various sectors. This paper focuses on the type of data, the approaches used, and the evaluation techniques found in these studies. The study derives a new categorization of the Data Analytics methods used in measuring service quality, distinguishes the most used data sources and provides insights regarding methods and data sources used per industry. Finally, the paper concludes by identifying gaps in the literature and proposes future research directions aiming to provide practitioners and academia with guidance on implementing DA for service quality assessment, complementary to traditional survey-based methods.
1.Introduction
Service Quality is considered one of the most critical success factors in an organization’s effort to differentiate itself from its competitors [1]. The key to sustainable competitive advantage lies in delivering high quality service which will, in turn, result in satisfied customers and users of the service [2]. According to the definition of [3], service quality is “the discrepancy between consumers’ perceptions of services offered by a particular firm and their expectations about firms offering such services”. Thus, it plays an essential role in achieving important goals, including developing trust, improving satisfaction, and cultivating loyalty [4]. Being considered one of the most debated topics in the service marketing literature, there is one thing the researchers appear to agree on: perceptions of service quality are based on multiple dimensions, even though there is no general agreement as to the nature or content of the dimensions [5].
Interest in the measurement of service quality is understandably high and the delivery of higher levels of service quality is the strategy that is increasingly being offered as a key to service providers’ efforts to position themselves more efficiently in the marketplace [6]. Although there is no general agreement on one particular model as the measurement of service quality perception, there are some efficient models offered by researchers during decades of study in this area. SERVQUAL [7] and SERVPERF [8] are the most used and famous models in service quality but recently scientists focused more on hierarchical-multilevel structure for service quality perception. However, these survey-based self-report measures are prone to many kinds of response bias, such as acquiescence bias, social desirability bias and conventional method variances [9]. For example, [9] commented that “self-reports are a fallible source of data, and minor changes in question-wording, question format, or question context can result in major changes in the obtained results.” Therefore, scientists have recently turned their attention to the abundance of user generated online content.
Online reviews are posted by consumers who have purchased and used a product, and they include consumers’ experiences, evaluations, and opinions. [10]. Thus, they constitute rich, complex bundles of information that reflect travellers’ experiences and evaluations of products. Moreover, with more and more people using social media to express their opinion on various matters including their experience and perceived satisfaction for services, products and policies, Twitter, Facebook, and other platforms provide relevant stakeholders an opportunity to collect and analyse data on the quality of the respective service without the need for rigorous preparation required in surveys [11].
Over the years, the growth of data analytics has permeated various domains, revolutionizing the way organizations derive insights and make informed decisions. Every piece of information shared on social media and online review platforms carries an emotion, sentiment or feeling and can carry some hidden information related to the perceived service quality of the related service. By harnessing the power of data, businesses can now delve deeper into customer feedback, reviews, and social media sentiments to gain valuable insights into their service offerings. Through advanced analytics techniques such as natural language processing and sentiment analysis, organizations can uncover patterns, trends, and customer preferences that were once elusive. This enables them to identify areas for improvement, optimize their service delivery, and ultimately enhance customer satisfaction.
Hence, more and more stakeholders are focusing on leveraging and analyzing social media and online reviews, as well as domain-specific data, to detect the emotional and conversational patterns and thus, measure the satisfaction of the people using the service in the respective domain as well as the reasons behind it. Last but not least, machine learning [12], opinion mining [13] and big data technologies [14] made it possible to analyze huge datasets from various sources and to develop highly accurate models. For all the afore-mentioned reasons, we have witnessed a fast-growing trend of approaches exploiting new sources of data, such as social media data and reviews, using Data Analytics and Machine Learning techniques, instead of, or complementary to, traditional methods, such as questionnaire surveys, models, and grounded theory.
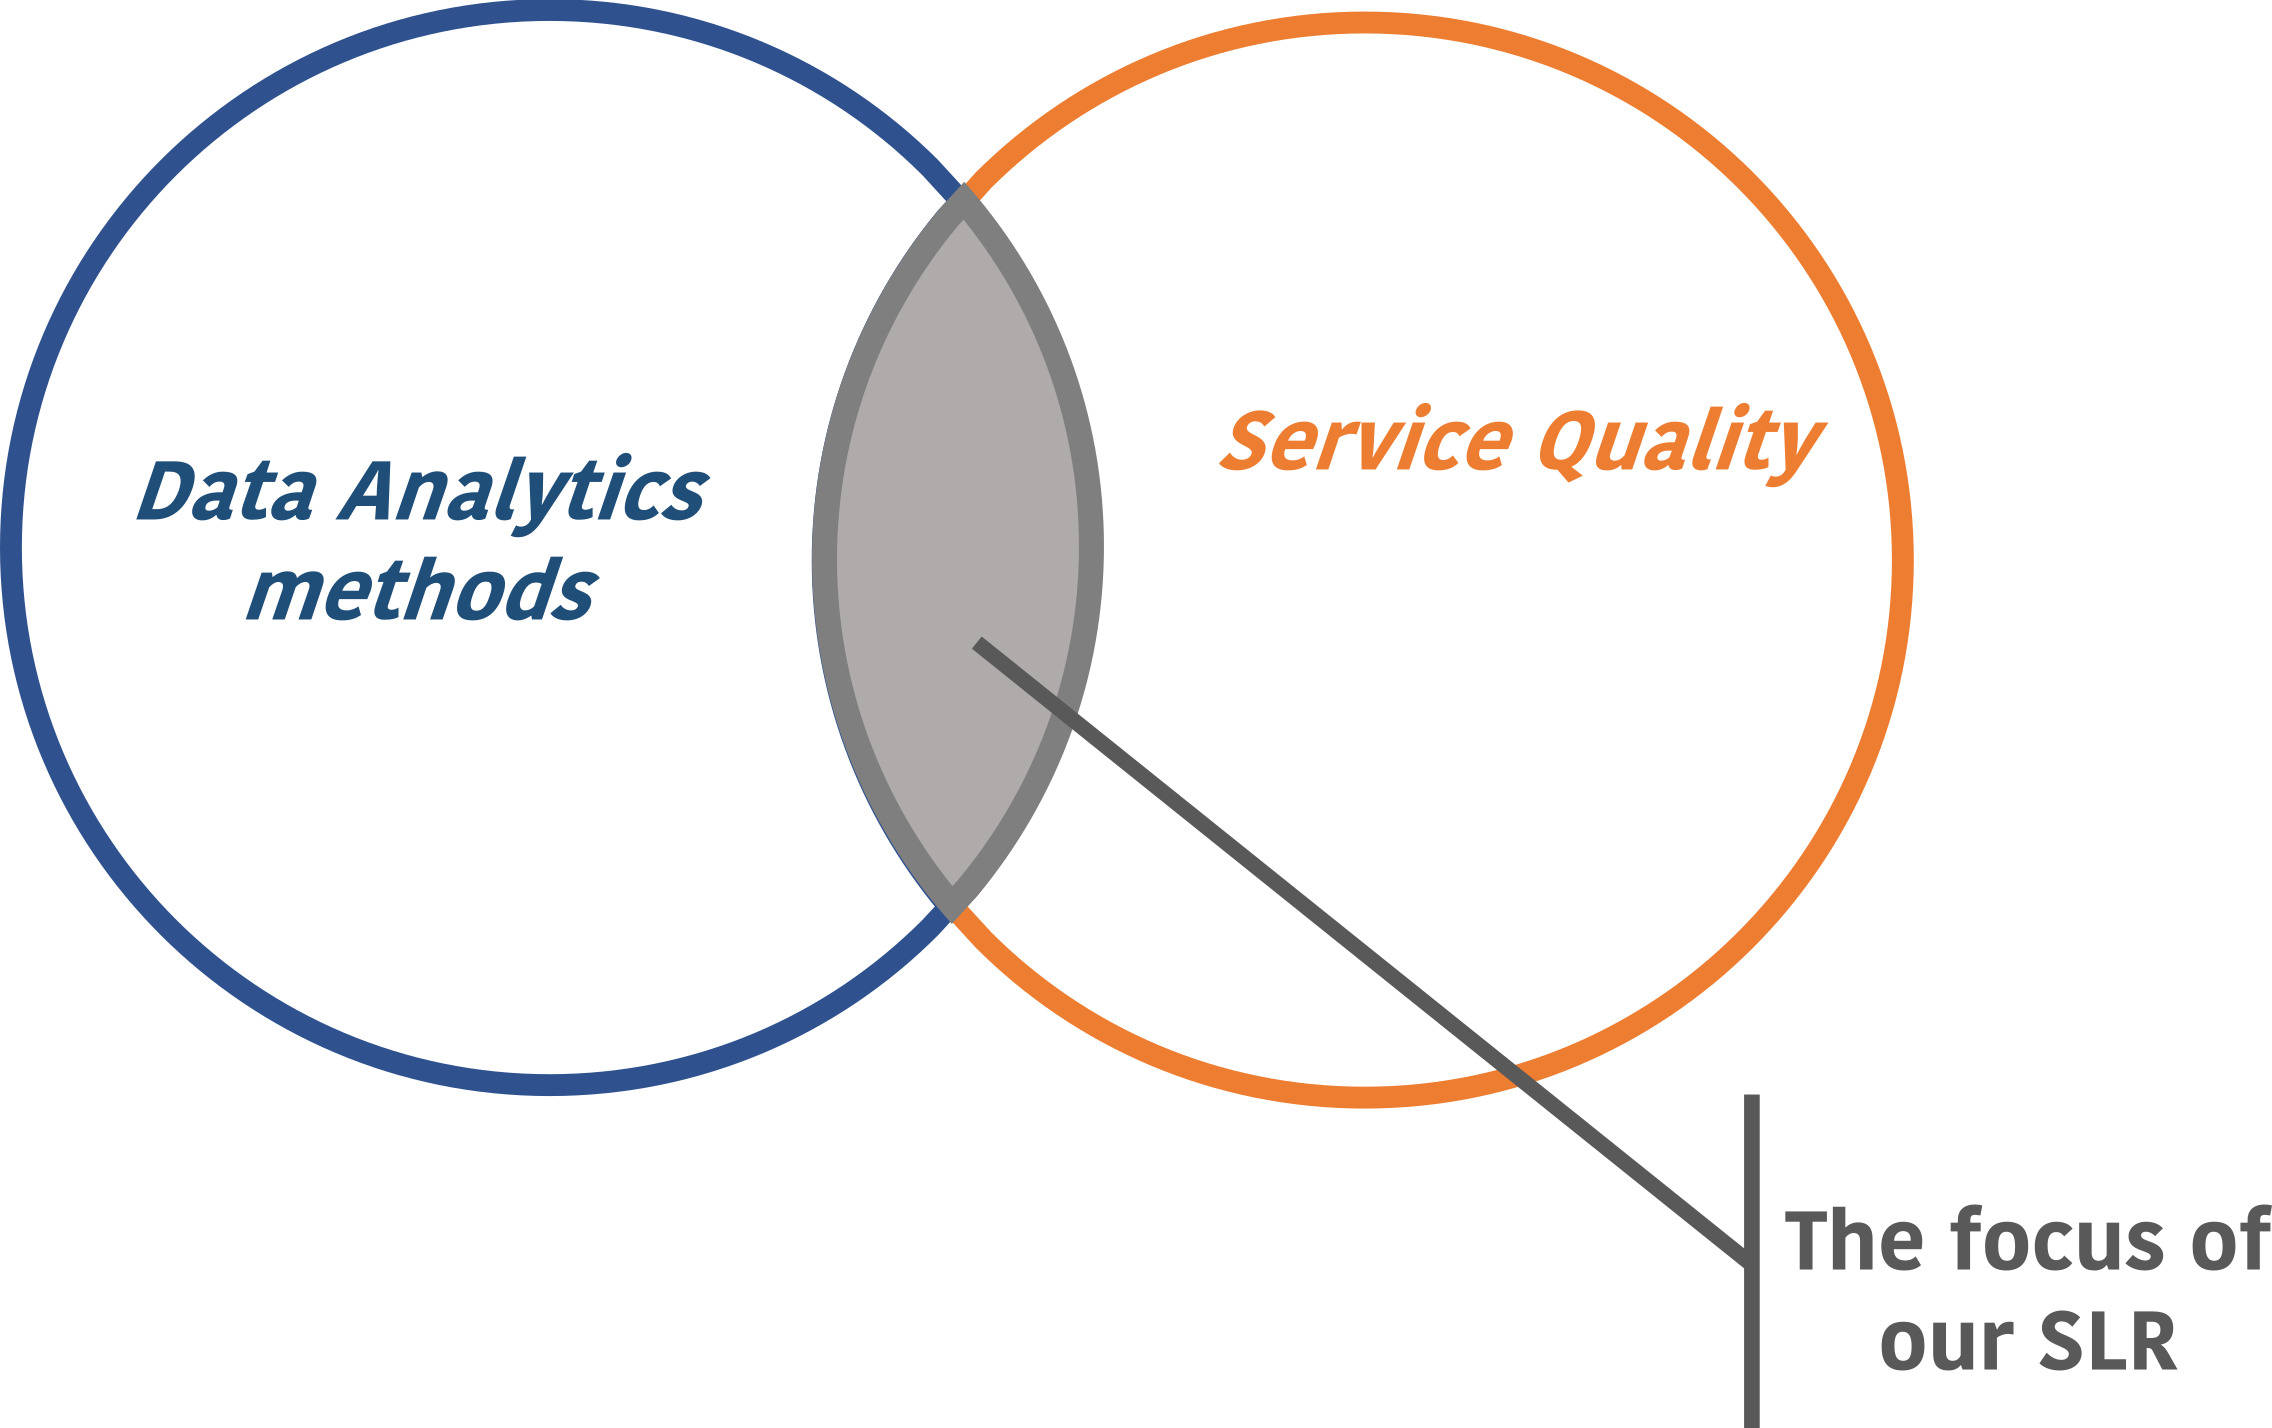
In this paper, we aim to systematize available research results and provide a framework for understanding and interpreting approaches which use Data Analytics methods to assess perceived service quality in various domains. Our review examined papers of the last years, having deduced after vigorous and detailed analysis that relevant studies within the defined scope of our work commence at year 2013, and focused on the intersection of the following domains: 1. Data Analytics, and 2. Service Quality. This means that we do not include in our analysis work related with the assessment of the Service Quality without the use of Data Analytics methods and tools (Fig. 1).
Figure 1.
The focus of our systematic literature review (SLR).
Although, there are several literature review papers about perceived service quality, using traditional methods, to the best of our knowledge this paper is the first that targets a systematic literature review on the use of Data Analytics methods to measure the above. The objectives of our work are: (i) to investigate the existing literature regarding measuring the service quality using Data Analytics methods, instead of, or in combination with, traditional methods; (ii) to list and highlight emerging trends with respect to the research methods, algorithms and tools, the various data sources used and the evaluation of the results obtained (iii) to synthesize the literature review in order to identify the existing research challenges; (iv) to outline directions for future research.
The rest of the paper is organized as follows: Section 2 presents the methodology that we followed for the literature review, while Section 3 describes the analysis of the reviewed papers. Section 4 outlines directions for future research work, while Section 5 concludes the paper.
2.Methodology
In this Section, we outline the methodology of the literature review which is based on [15]. This methodology has been widely used in literature reviews for big data analytics, operational research and management science [16, 17, 18], while similar methodologies have been followed in other domains [19, 20].
In order to identify the relevant studies for the review, we chose bibliographic databases that cover the majority of journals and conference papers published in the field of big data analytics, machine learning and computer science in general. We selected the following bibliographic databases as relevant: Google Scholar, ACM, IEEE, ScienceDirect, SpringerLink, Emerald, Ebsco, Web of Science, and Proquest. To retrieve the relevant papers, we carried out searches in these databases by combining keywords from the following two sets: SET_1
We limited our search space to include only journals, books and conferences publications. We exclude any grey literature like white papers and blog posts because their quality may vary and can affect the validity of our results.
More specifically, we follow the procedure described below:
• We select the papers to be reviewed according to the criteria of the literature review methodology (Section 2).
• We classify the reviewed papers per application domain in order to show the application domains that have gathered the most and the least interest, as well as the categories of methods that have been used (Section 3.1).
• We perform a classification of the identified papers based on the source of the data used in each to distinguish differences in the processing of the data and the methods chosen in each category (Section 3.2).
• We classify the identified methods for Big Data analytics used in the research papers in 5 categories: Probabilistic Models, Machine Learning/Data Mining, Statistical Analysis, Network Analytics, Logic-based Models (Section 3.3).
• Since most of the reviewed research works utilize combinations of methods (instead of a single method), we identify the categories of methods and their combinations in the literature For each category of methods and for each identified combination, we extensively discuss how they have been used in the context of analytics in the related papers, the problems that they solved, while we identified the key contributions (Section 3.3).
• We categorise the evaluation techniques used in the research papers in four categories: Quantitative, Qualitative, Mixed and No evaluation and we discuss the methods used in each (Section 3.4).
• Based on the literature review, we conclude in a synthesis, in which we also discuss the existing research challenges and potential directions for future research, while outlining the limitations of our SLR (Section 4).
Figure 2.
Overview of the paper identification process.
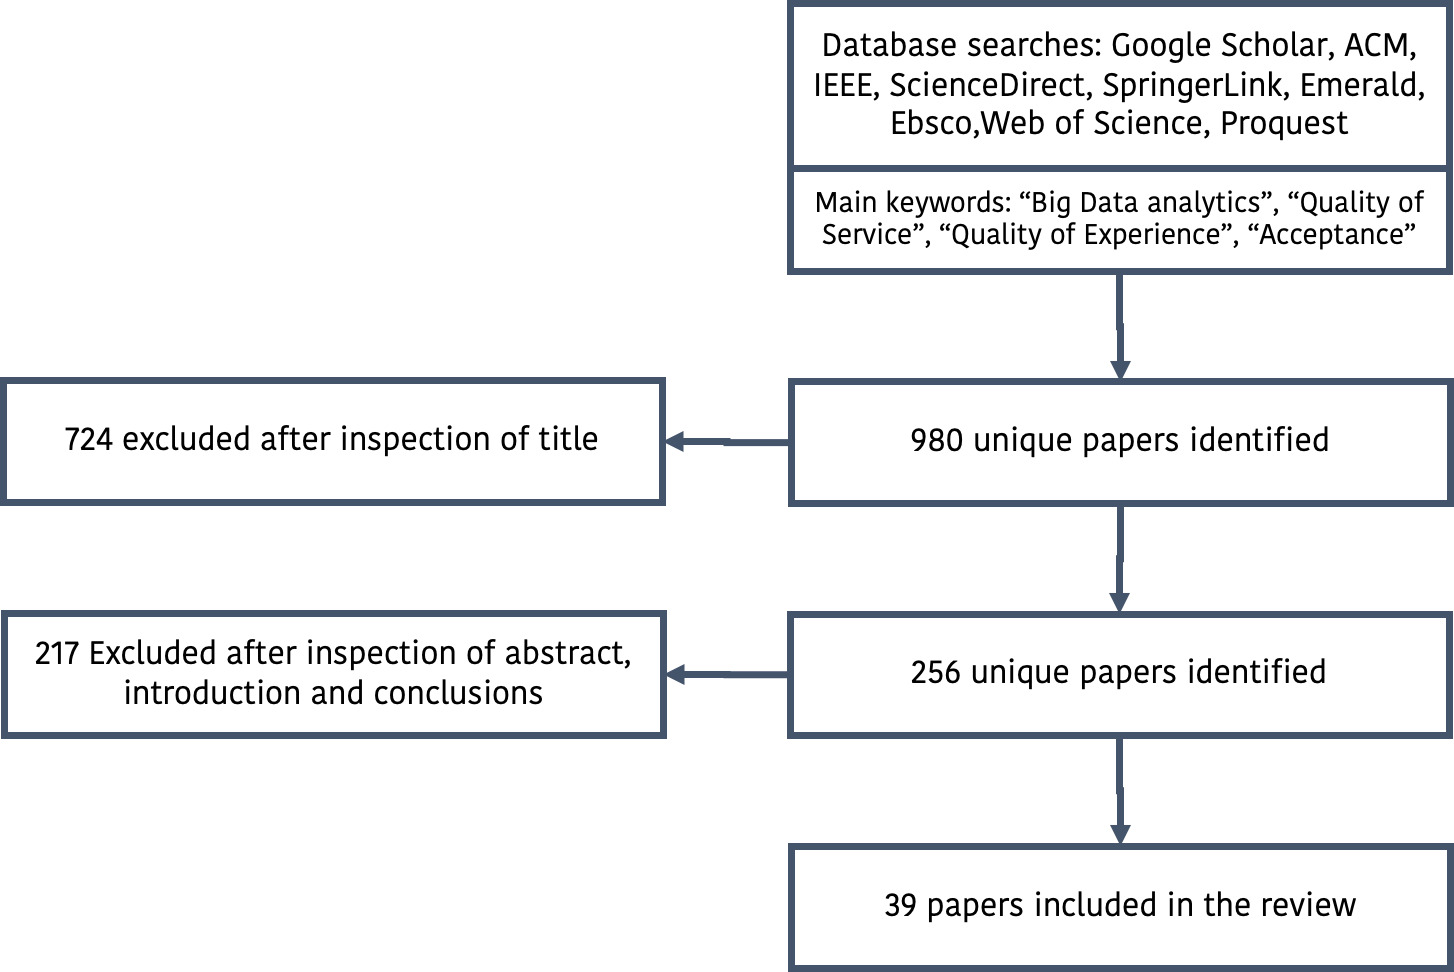
The identification and selection of documents is conducted in three phases in order to filter out the relevant documents. The number of papers identified in each phase is shown in Fig. 2. For the first phase, we queried the scientific databases to find papers that contain the query in their full record, including the full text of the publication, without any other constraints. The first phase of our search resulted in 980 papers. We found that there is almost an exponential growth of the use of the term “Data Analytics” with respect to assessing perceived service quality in various sectors in publications throughout the last years. This trend outlines an increasing research interest and contributes to the argumentation of the need for this literature review.
Since the first phase of the search includes works that do not necessarily contribute to the field of assessment of service quality with Big Data Analytics methods, we conducted a second phase in order to search for research works with the query term in their metadata, i.e. title, abstract, keywords or other metadata of their record. The second phase resulted in 256 papers, as shown in Fig. 2. However, several papers refer to the terms without contributing to the field. For example, in some cases, they exist in introductory paragraphs (as background information), but the methodology used is not using Data Analytics techniques, but traditional methods instead.
Therefore, the third phase of our search aimed at examining more in-depth the content of these papers. To this end, it is conducted according to the following inclusion criteria: (i) The papers contribute to the field of interest; (ii) the publication date is between January 2013 and March 2021; (iii) the publication type is scientific journal, conference, or book chapter. The third phase resulted in 39 papers, which are the works examined in the scope of this systematic review.
Figure 3.
The distribution of the third phase’s papers throughout the years.
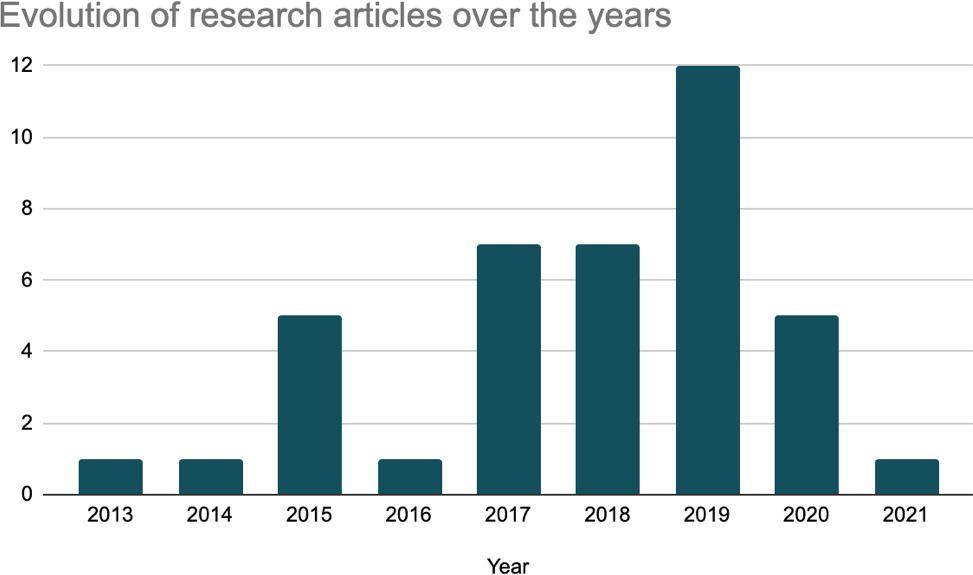
The distribution of the number of papers with respect to years is shown in Fig. 3. This trend shows that there is also an increasing trend in publications contributing to the research field. It should be noted that no journal or conference gathers specifically related research work. The publications examined exist in several different journals and conference proceedings from various research fields as shown in Fig. 3.
3.Analysis of reviewed papers
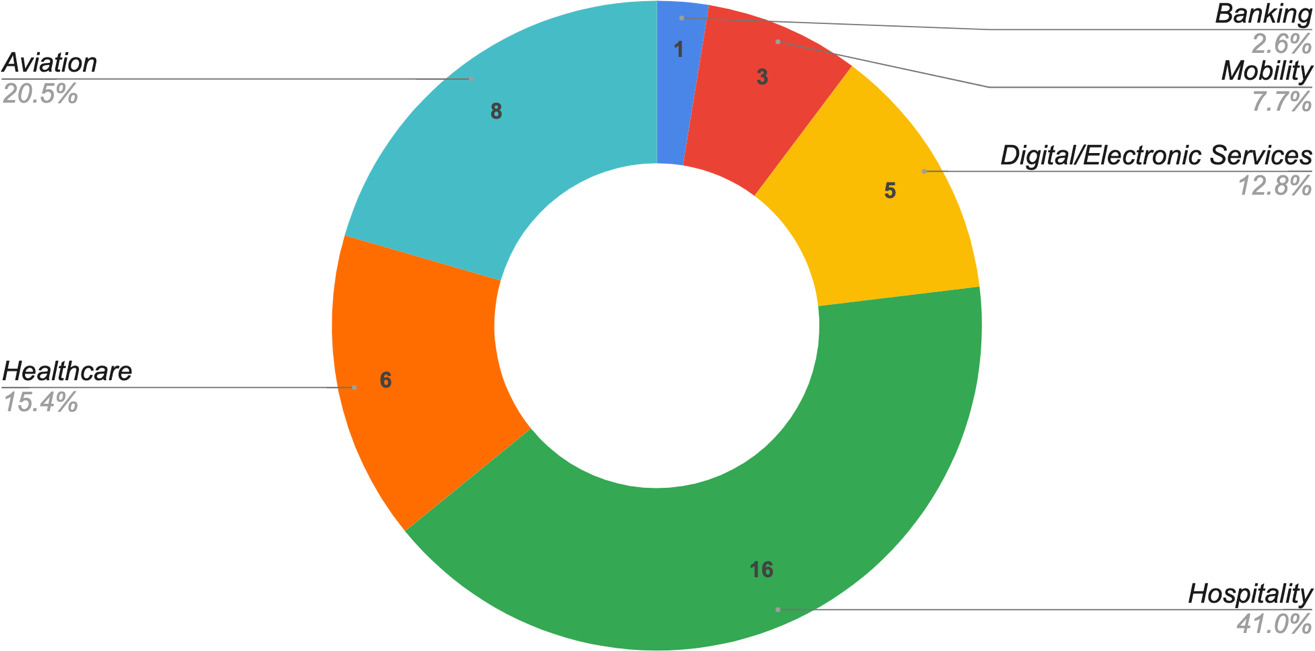
The analysis of the papers led to some interesting results. In this section, we present our findings, starting with an in-depth analysis per industry domain as depicted in Fig. 4, followed by an analysis per source and proceeding with the most prevalent methods and tools.
Figure 4.
Distribution of research works per industry domain.
3.1Analysis per industry domain
3.1.1Healthcare
The high quality of service delivery is the key to success in the healthcare industry [21]. The concept of quality in health care services has emerged more intensely as an increase in treatment cost and variations in clinical procedures. A quality medical system consists of the assurances of the continuum of care, not only for therapeutic services but for the promotion of health services and anticipation [22]. Improvements in the delivery of service quality have been recognized as the main concern by policy-makers and governments of several countries [23]. Due to an increase in the competition, it is highly essential for providers to monitor and deliver efficient and quality medical services to the patients [21].
In the context of our literature review, data driven methods have been employed in various works in order to measure the service quality of healthcare domain, by deriving sentiments [24, 25, 26, 27] as well as detecting factors-dimensions which influence the service quality (e.g. [24] propose a systematic method to assign tweets into each of the SERVQUAL dimensions, while [27] identify hospital service quality factors and overtime trends automatically from online health communities.) Finally, [28] deliver forecasts and correlations for future healthcare activities, and provides data-driven conclusions regarding service quality, while examining historical health data.
The data used to derive sentiments, forecasts and dimensions in the context of service quality in healthcare are mostly unstructured textual data (Twitter [24], online portals [26, 29, 27]), one includes structured domain data [28] and one research work entails the multimodal fusion from both unstructured (text and image) and structured data (ratings) [25].
3.1.2Mobility
Many studies have investigated opinions regarding transportation services, but most of them used a traditional survey [30]. These surveys have revealed many complaints about public transportation schedules, making a reasonable schedule, which is helpful for satisfaction and service. Due to the limitations of these traditional methods and the abundance of user-generated content on the web, Natural language processing (NLP) techniques present an opportunity to understand people’s opinions regarding public transportation [30].
In the context of our review, Data Analytics methods have been employed in various works, including sentiment analysis [31, 30], keyword extraction [32, 30], clustering [31] and co-occurrence analysis [30]. Moreover, in two works the gap between quality of service and perceived quality of experience is bridged, which is achieved by visualizing both aspects in the same timeline [31, 32].
The data used to measure service quality in transportation are unstructured textual data (online reviews [30]) as well as both unstructured (twitter) and structured (data from agencies) [32, 31].
3.1.3Aviation
According to ACI (2016), the quality of airport services is crucial in achieving passenger satisfaction and consequently effects their future intention to use the airport again [33]. Therefore, airport management needs first to understand passenger expectations about the services needed and their characteristics and build its improvement plans accordingly [34]. For research conducted to measure service quality, the process usually follows traditional approaches that utilize questionnaires distributed to a representative sample of passengers at the target airport. For instance, Airports Council International (ACI) is one of the main organizations that conducts an evaluation process for 390 airports in 92 different countries around the world. The ACI evaluation program is known as Airport Service Quality program (ACI-ASQ) and their evaluation is based on surveys of passengers, which are repeated four times a year.
In the context of our review, Data Analytics methods have been employed in various works, including mapping to the 23 ACI-ASQ dimensions [35, 36, 37], sentiment classification per dimension [35, 36, 38], sentiment analysis [39], topic modeling [37, 40], keyword extraction [40, 41, 42], relationship between factors and service quality [38, 41, 42], and CONCOR analysis [41, 42].
The data used to derive conclusions regarding service quality in aviation domain are mainly online reviews [41, 39, 42, 40, 37] and Twitter [36, 35].
3.1.4Digital and electronic services
In the field of digital and e-services, as service providers want to boost the efficiency and quality to reach more users to utilize these services, a prime challenge in developing these services with high quality to meet users’ expectation becomes a must. Quality plays a major role to keep up a trust between service providers and users. [43] proposes eight main quality dimensions to examine the perspective of service providers and service users for government services, namely, personalization, usability, performance, web design, security, user involvement, satisfaction and loyalty.
Most papers in our review employ topic modeling [44, 45, 46] and sentiment analysis [44, 46, 47, 48] as well as network analytics to visualize relationships between derived topics [45], while using as basis SERVQUAL dimensions [44, 48].
The data used to derive conclusions regarding service quality in the digital and electronics services domain are mainly online reviews [44, 47, 46] and Twitter [45, 48].
3.1.5Hospitality
Hotel guest experience and satisfaction have long been a topic of interest because it is widely recognized that they contribute to customer loyalty, repeat purchases, favourable word-of-mouth, and ultimately higher profitability [49]. Service quality is a unique measure adopted by the hospitality sector to enhance profit margins by increasing the numbers of satisfied customers. Within the ambit of Service quality concept, the SERVQUAL scale plays a crucial role as it has been recognized as the mostly recognized and adopted scale to measure the differences between customers’ expectations and perceptions [50]. Most existing studies primarily relied upon conventional research techniques such as consumer surveys or focus group interviews to gauge what leads to guest satisfaction.
Data Analytics methods have been employed in various works, notably sentiment analysis [51, 52, 53, 54, 55, 56, 57, 58, 59, 60], topics extraction [58, 61, 59, 62, 63, 55, 64, 65], prediction [61], relationships between factors and customer satisfaction [58, 54, 60, 64], word co-occurrence and network visualisation [63]. Finally, attributes were mapped to dimensions from frameworks such as SERVPERF [52] and HOLSERV [66].
Finally, all the works analyzed as part of this research use data deriving from online review websites (e.g. Expedia, TripAdvisor, Yelp…).
3.1.6Banking
As the retail banking institutions are becoming more customer centric, their focus on service quality is increasing. Established service quality frameworks such as SERVQUAL, SERVPERF and RATER, have been applied in the banking sector since the 1990s ( [67, 68] and others). While these models are widely accepted, they are expensive because of the need for replication across bank branches [69].
[69] derives sentiment and classifies the reviews in dimensions which are then mapped to RATER dimensions. Finally, they investigate the impact of each dimension on satisfaction. The data that are used to assess the service quality of banks are reviews for three private banks in India (both the text and the relevant ratings).
3.2Analysis per data source
3.2.1Data pre-processing
From the literature review of the selected papers, it is evident that the vast majority use textual information from social media or online reviews/blogs, and the methodology used for the pre-processing steps before the data analysis is similar, to a great extent. Analysis of the pre-processing stages mentioned in all the works mentioned as part of our literature review have revealed many similarities among the data manipulation from the moment the data are extracted until the data are fed in the data analytics methods which are employed as part of each research work. Figure 5 depicts the most common steps as well as methods used in the pre-processing stage for textual data.
Figure 5.
Summary of common steps in the pre-processing stage for textual data.
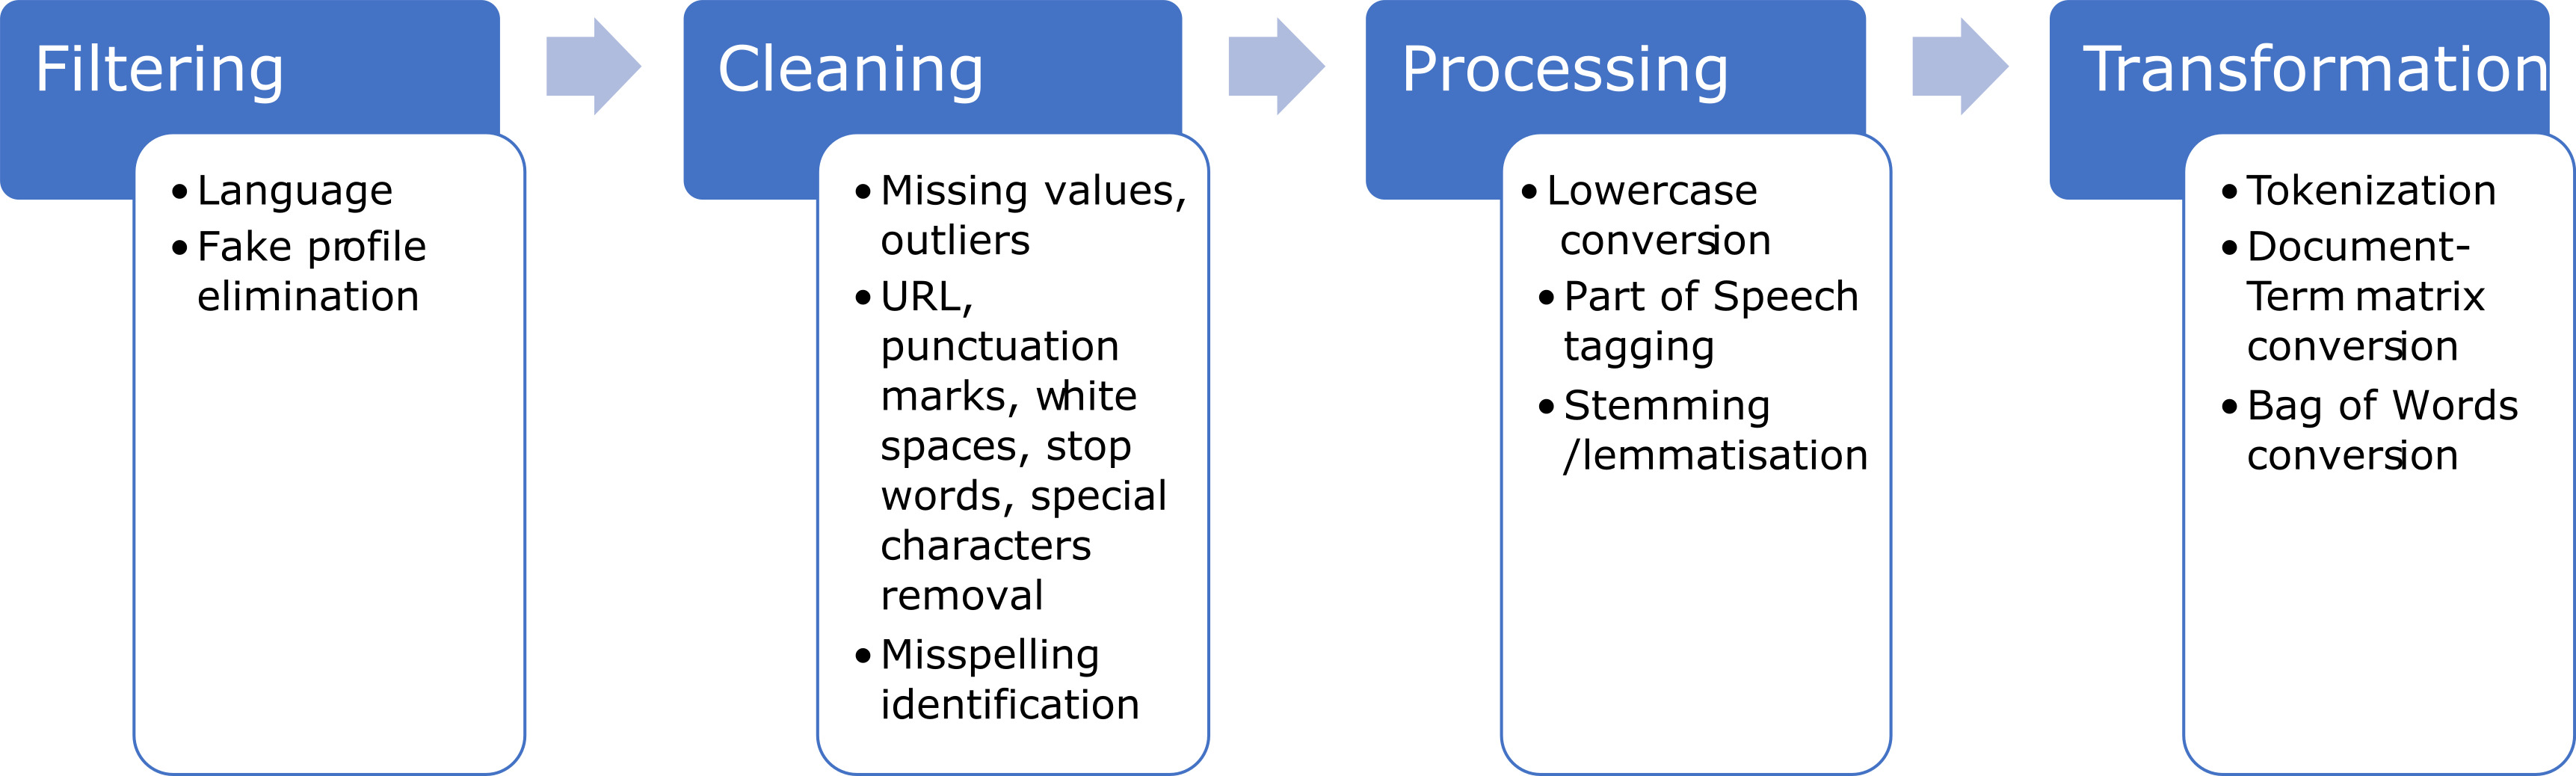
Besides using text as a form of unstructured data, one of the review papers has provided extensive research on the combined use of both text and image to perform multimodal features fusion analysis. More specifically, to extract the deep features from visual cues using CNN, it was essential to pre-process the images so that it meets the specific requirements. First, the images were resized to a particular dimension configured in the image input layer of the pre-trained CNN. Then the mean of an image is subtracted from an input image to normalize them. The image intensities are normalized within a [0, 255] region [25].
Last but not least, the combination of text data as well as domain specific data is used in two of the examined works. [32] exploits twitter data together with structured data from agencies (specifically, a bike sharing app) regarding service performance, whereas [31] uses data from three different sources: General Transit Feed Specification (GTFS) files for train schedules, the official alert system for the Metropolitan Transportation Authority (MTA) service which controls the Metro North Railroad and social media (Twitter). In both cases, after extracting the data, the filtering, extraction, and matching steps are necessary before proceeding with further analysis.
Table 1
Summary of data sources, type of data and number of data entries arranged by year
| Year | Ref | Data sources | Data classification | Type of data | Number of data entries |
|---|---|---|---|---|---|
| 2013 | [52] | Online reviews (various) | Both | Text, ratings | 70,103 reviews |
| 2014 | [59] | Online reviews (TripAdvisor)) | Unstructured | Text | Not applicable |
| 2015 | [58] | Online reviews (Expedia) | Both | Text, ratings | 60,648 reviews |
| 2015 | [53] | Online reviews (Yahoo blogs, Wetch) | Unstructured | Text | 1,364 reviews |
| 2015 | [54] | Online reviews (Tripadvisor) | Both | Text, ratings | 2,510 reviews |
| 2015 | [27] | Online portals (Naver, Daum) | Unstructured | Text | 173,748 messages |
| 2015 | [47] | Online reviews (public portal) | Unstructured | Text | 120 reviews |
| 2016 | [28] | Healthcare structured data | Structured | Domain specific data | Not available |
| 2017 | [39] | Online reviews (Skytrax) | Unstructured | Text | 895 sentences |
| 2017 | [56] | Online Reviews (TripAdvisor) | Unstructured | Text | Not applicable |
| 2017 | [55] | Online Reviews (TripAdvisor) | Unstructured | Text | Not applicable |
| 2017 | [29] | Comments from private hospital | Unstructured | Text | 2,018 positive reviews 1,394 negative reviews |
| 2017 | [64] | Online reviews (TripAdvisor)) | Both | Text, ratings | 266,544 reviews |
| 2017 | [46] | Online reviews (Tokopedia) | Unstructured | Text | 9,896 reviews |
| 2018 | [37] | Online reviews (Google reviews) | Both | Text, rating | 42,137 reviews |
| 2018 | [44] | Online reviews | Both | Text, Ratings | 74,775 reviews |
| 2018 | [57] | Online reviews (TripAdvisor) | Unstructured | Text | 143 reviews |
| 2018 | [69] | Online reviews (bankbazaar.com) | Both | Text, ratings | 5,905 reviews |
| 2018 | [65] | Online reviews (Foody) | Unstructured | Text | 575 reviews in Vietnamese, 440 reviews in English |
| 2018 | [51] | Online reviews (OpinRank) | Unstructured | Text | 259,000 reviews |
| 2018 | [48] | Unstructured | Text | 410,309 tweets | |
| 2019 | [35] | Unstructured | Text | 34,528 tweets | |
| 2019 | [36] | Unstructured | Text | 464,205 tweets | |
| 2019 | [42] | Online reviews (Skytrax) | Both | Text, ratings | 62,249 reviews |
| 2019 | [40] | Online reviews (TripAdvisor) | Both | Text, ratings | 557,208 reviews |
| 2019 | [32] | Twitter & city service providers data | Both | Text, domain specific | Not available |
| 2019 | [61] | Online reviews (TripAdvisor)) | Both | Text, Ratings | 17,024 reviews |
| 2019 | [62] | Online reviews (Traveloka) | Unstructured | Text | 1187 reviews |
| 2019 | [63] | Online reviews (3 online travel agencies in China) | Unstructured | Text | 47,000 from Ctrip, 51,000 from Tuniu, and 67,000 from Tongcheng |
| 2019 | [60] | Online reviews (TripAdvisor)) | Both | Text, ratings and user profile | 127,629 reviews |
| 2019 | [30] | Online reviews (Dazhong-Dianping Shanghai Station (DSS) website) | Unstructured | Text | 26,397 reviews |
| 2019 | [66] | Online reviews (Traveloka) | Unstructured | Text | 513 reviews |
| 2019 | [38] | Unstructured | Text | 792,858 tweets | |
| 2020 | [31] | Twitter, Yelp reviews, data from agencies | Both | Text, Domain specific data | Yelp Reviews: 399, Twitter: 965,789 |
| 2020 | [45] | Unstructured | Text | 400,242 tweets | |
| 2020 | [41] | Online reviews (Skytrax) | Both | Text, ratings | 1,693 reviews |
| 2020 | [25] | Online reviews (Yelp) | Both | Text, Images, Ratings | 55,738 reviews with 34,039 photos |
| 2020 | [25] | Online reviews (Iwantgreatcare.org) | Unstructured | Text | 47,499 reviews |
| 2021 | [24] | Unstructured | Text | 50,716 tweets |
Table 1 summarizes the data sources, the type of data (structured, unstructured or both) and the number of data entries used for analysis in each research work.
As it is evident from Table 1, the majority (23) of the reviewed works make use of unstructured data (most notably Twitter and textual online reviews), 15 use both structured and unstructured data (in most cases, online reviews which include text and rating information), whereas only one of the analyzed works employ only structured data. That fact depicts the recent trend which has motivated researchers and practitioners to adopt data analytics methods to extract insightful information from large data collections from user generated content, which is in most cases textual data.
3.3Approaches and methods
As we mentioned previously, depending on the scope of each research work, the domain and the data source, different methods and techniques are applied to derive the assessment of the perceived service quality. In this section, we present the approached methods that we have identified in the reviewed papers and propose a classification of these identified methods.
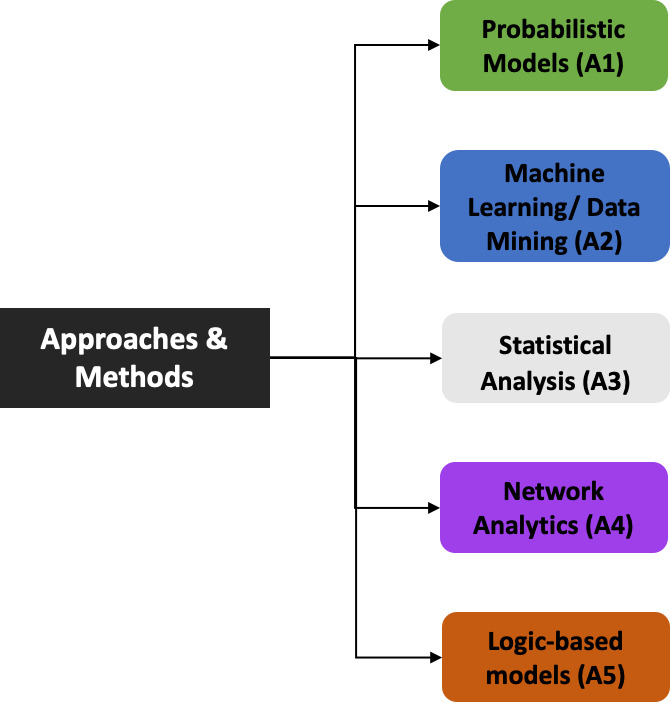
Figure 6 depicts the classification of the methods for data analytics that we have identified in the reviewed papers. We classified these methods in five categories: Probabilistic Models (A1), Machine Learning/Data Mining (A2), Statistical Analysis (A3), Network Analytics (A4), and Logic-based Models (A5) based on the methods employed in the reviewed works. In the remaining part of this section, a detailed discussion is presented for each of these categories in addition to the classification of the reviewed papers into these categories as well as their cross-section, as illustrated in Table 2.
Table 2
Classification of reviewed works in categories of methods used
| Categories of methods | References | Count | |
|---|---|---|---|
| A1 | Probabilistic Methods | – | 0 |
| A2 | Machine learning/data mining | [24, 35, 36, 39, 25, 32, 59, 62, 26, 30, 66, 56, 57, 55, 29, 53, 27, 51, 47, 48] | 20 |
| A1 | Probabilistic methods ANDMachine learning/data mining | [31] | 1 |
| A3 | Statistical Analysis | [28] | 1 |
| A2 | Machine learning/data mining ANDStatistical analysis | [44, 60, 54, 40, 69, 64, 65, 58, 52, 37, 61, 38] | 11 |
| A4 | Network analysis | – | 0 |
| A2 | Machine learning/data mining ANDNetwork analysis | [63] | 1 |
| A2 | Machine Learning/data mining ANDStatistical analysis ANDNetwork analysis | [42, 45, 41] | 3 |
| A5 | Logic-based models | – | 0 |
| A2 | Machine Learning/data mining ANDLogic-based Models | [46] | 1 |
Figure 6.
Classification of the methods used in the reviewed works.
In this section, we further discuss the methods that have been used in the literature, with an emphasis on the methods used for service quality measurement, which is the focus of our work. Since the boundaries among these categories are not always clear, in the beginning of each subsection we provide the definitions according to which we classified the methods that we found in the literature.
3.3.1Machine learning/data mining
Machine learning refers to algorithms that rely on models and inference based upon data processing without using explicit instructions [70]. Machine learning algorithms build a mathematical model of sample data, known as “training data”, in order to make predictions or decisions without being explicitly programmed to perform the task. It has been considered as a subset of artificial intelligence. Data mining is the process of discovering patterns in large data sets with the aim to extract information and transform it into a comprehensible structure for further use [71]. Since machine learning and data mining are terms that are closely interrelated [69], we treat them as one category of methods. Essentially, using machine learning and data mining techniques, we can build algorithms to extract data and see important hidden information from them. More precisely, in data analytics use when measuring the perceived service quality we seek information regarding sentiments, topics and aspects with regard to the perceived satisfaction of users.
As it can be seen in Table 2, Machine Learning and Data Mining in general has been widely used in the context of measuring perceived service quality using data analytics. Particularly, the vast majority of the reviewed papers deal with sentiment analysis and topic modelling.
Sentiment Analysis (SA) is one of the recent techniques used to extract and analyze emotional and sentiment statements in a text [72]. It is also referred to as emotional polarity computation as it is used to detect the sentiments and categorize them based on their polarity [73]. The used polarities can be positive, neutral or negative. Sentiment analysis (SA) is related to the extraction and analysis of emotional and sentimental statements in a text. In this case, traditional machine learning techniques on n-grams, parts of speech, and other bag of words features able to be applied when the data is labelled. Knowledge-based method that was introduced by is another method in using labelled data. Both of these methods rely on crowdsourcing.
Especially for sentiment analysis, there are three methods extensively used in the literature:
1. Lexicon-based approach is an unsupervised learning in that it does not need prior training for mining data. Most researchers create their own lexicon to improve the performance.
2. Learn-based approach uses ML algorithms and linguistic features. It is a classification algorithm which trains labelled document over corpus so that the features can be recognized for classifying the sentiment. This approach can be supervised, semi-supervised or unsupervised. Supervised methods need large number of labelled training data which makes them expensive while unsupervised methods do not need labelled data and are therefore easy to apply for unlabelled data.
3. The hybrid approach combines both lexicon-based and learn-based approaches. It is very common with sentiment lexicons and plays a crucial role in most methods. It applies the lexicon-based approach for sentiment score and then these scored documents represent the training data for the learn-based part. It uses a lexicon or learning symbiosis to attain the best of both worlds-stability and readability from a carefully designed lexicon, while the high accuracy from a powerful supervised algorithm.
Based on the results of this review study, most of the approaches use Machine Learning methods, fewer use Lexicon-Based approaches and even fewer employ a hybrid approach to achieve better accuracy. Moreover, there are 3 studies which employ commercial tools (i.e., Semantria, Theysay, Twinword, Lexalytics) and some which use pretrained open-source tools (i.e. VADER) in order to perform sentiment analysis. The extensive analysis of the reviewed works based on the type of the approach (Machine Learning, Lexicon-Based, Mixed, Other), the tools used as well as the accuracy obtained can be found here.
The reason why most researchers have chosen the ML approach is the accuracy of the results obtained and the possibility to use different algorithms to fine-tune their model. On the other hand, it requires a large number of labeled data, since it is a supervised approach, thus it requires manual classification from domain experts, as indicated in many studies. One of the advantages of lexicon-based approach is that it is an unsupervised learning in that it does not need prior training for mining data. Some researchers have created their own lexicon in order to improve the performance, whereas others have used already available lexicons (i.e. ANEW, AFINN, HowNet). Finally, the hybrid approach has been shown to demonstrate high accuracy and stability inherited from lexicon-based approach and ML approach respectively, therefore, we expect to see more works favoring this approach in the future.
Another technique widely used in the reviewed research works is Topic Modelling. This is principally used in our context to identify dimensions of perceived service quality or context of discussion and topics. Topic Modelling is one of the unsupervised techniques used to perform text clustering in large document collections. It is a statistical model that helps to search a group of keywords or topics for a text. It assumes that each document consists of a group of topics or keywords. Each topic or keyword in the text consists of a collection of words [74]. It is a form of opinion mining that can obtain recurring patterns of words in a textual document. Topic Modelling is one type of probabilistic generative model that is used for discovering the hidden semantic structures in a text body, and for annotating documents based on its topics, which can be used to organize, search, and summarize the whole texts. All topic models have the basic assumption in which each document contains a mixture of topics/keywords, and each topic/keyword contains a collection of words [75].
Based on the results of this review study, LDA is an unsupervised learning approach that is applied in most studies due to lack of labelled training data. Unsupervised learning is normally used for finding hidden patterns of data to improve the performance of the model. Unsupervised learning approach can be conducted when (1) there are no labels on training data; (2) the data cannot be labelled manually, or it is expensive to do so; and (3) most of the supervised learning algorithms fail to fit well with the underlying distribution of the data renders [74]. In this study, the first and the second criteria are matched so, in principle, LDA is used by most works. However, if a big and good quality labelled training data would be provided, potentially it does not constitute the first choice. We can witness the above observations in studies where a manual segmentation of the topics is done using keywords to define each aspect of the service quality measurement or using a dictionary. Lastly, in some cases, network analytics are also employed to group topic clusters and visualize them. The extensive analysis of the reviewed works based on the techniques used to perform Topic Modelling, the tools used as well as the accuracy obtained can be found here.
3.3.2Statistical analysis
Statistical analysis is a branch of mathematics dealing with data collection, organization, analysis, interpretation, and presentation [76]. Statistical analysis deals with all aspects of data, including the planning of data collection in terms of the design of surveys and experiments studies, and solves problems related to a statistical population or a statistical model process [76].
Statistical Analysis algorithms have been widely used in analytics during the last years. However, their exploitation in the context of measuring service quality using data analytics is rather scarce. In our case, statistical analysis is used to extract information from data and using it to predict trends and examine relationships between factors impacting a target variable. We found that only one paper relies solely on these algorithms [28]. In this paper, answers to several QoS questions and recent healthcare trends are presented by employing three analytical studies (descriptive, predictive, and prescriptive). Some of the methods used are regression forecasting, ranking and correlations.
3.3.3Combination of methods
As seen in Table 2, there are various combinations of the aforementioned categories of methods.
Statistical analysis with machine learning/data mining
One predominant category is the combination of Statistical Analysis with Machine Learning/Data mining algorithms and techniques. [37] demonstrate that user-generated online contents can be used for assessing airport service quality, by applying sentiment analysis and topic modeling technique to Google Maps reviews. Moreover, using statistical methods they validate that the sentiment scores computed from the textual reviews are very good predictors of the associated Google star ratings. In the same domain, [38] perform classification per SERVQUAL service quality dimension and derive the sentiment for each dimension. Then, they use multiple regression in order to find the relationships between sentiment score and Air Quality Rating (AQR) score derived from an official report (DOT report). [40] utilize online reviews to identify factors that influence service quality from topic modeling of unstructured data, more precisely by using Structural Topic Models (STM), an extension to Latent Dirichlet Allocation (LDA) that allows the incorporation of document level covariates, on airline passengers’ online reviews. [58] aim to explore the utility of big data analytics to better understand important hospitality issues, namely the relationship between hotel guest experience and satisfaction. Specifically, this study applies a text analytical approach to a large quantity of consumer reviews to deconstruct hotel guest experience using text mining techniques, e.g., word frequency analysis, and examine its association with satisfaction ratings using the ANOVA and linear regression methodology.
[44] aim to extract the dimensions of service quality from reviews on the leading price comparison engine in Italy, using weakly supervised topic models, as well as to evaluate the topics’ impact using multiple regression to analyze the relationship between SERVQUAL dimensions and customer evaluations. [61] propose a hybrid method for online reviews analysis through multi-criteria decision-making, text mining and predictive learning techniques to find the relative importance of factors affecting travelers’ decision-making in hospitality industry. More specifically, they use Self-Organizing Map (SOM) for cluster analysis, Latent Dirichlet Analysis (LDA) technique for analyzing textual reviews, Technique for Order of Preference by Similarity to Ideal Solution (TOPSIS) for ranking hotel features, and Neuro-Fuzzy technique to reveal the customer satisfaction level and in order to validate the effectiveness of their methods, they employ Neural Network (NN), Support Vector Regression (SVR), and Multiple Linear Regression (MLR) techniques for comparison. [60] aim to provide a full picture of the role of technical attributes of online textual reviews (polarity, subjectivity, diversity, readability…) and bridge the technical aspects of customer reviews with their indications of overall satisfaction with hotels. They calculate both subjectivity and polarity measurements based on the Stanford Natural Language Toolkit (NLTK) with a naïve Bayes classifier and finally they conduct a multivariate linear regression analysis to measure the impact of the technical attributes of reviews on the final satisfaction of the review.
[69] aim to analyze user reviews to better understand the correlation between RATER dimension sentiment scores and user customer satisfaction in the banking sector and predict the rating, through a developed logistic regression model and by using lexicon-based sentiment analysis. [64]identify the key dimensions of customer service voiced by hotel visitors using Latent Dirichlet Analysis (LDA) for the textual data and for the numeric data they perform statistical analysis (regression analysis, ANOVA, perceptual mapping) to deduce the importance of multidimensional variables on the previously identified dimensions. [54] applied a text mining approach using PASW Modeler to identify patterns in guest hotel comments and categorize them under several dimensions, which are then statistically analyzed to derive the correlations between them and the average rating of each hotel. [52] use sentiment analysis to decompose user reviews into five dimensions to measure hotel service quality. Those dimensions are then incorporated into multiple regression models to examine their effect in shaping users’ overall evaluation and content generating behavior.
As it is evident from the above, most research works which employ a combination of these two methods aim to, firstly, derive the dimensions/topics and the sentiment per dimension/topic (using Machine Learning/Data Mining methods) and then, using the results obtained and by employing Statistical Analysis, they attempt to understand the relationship between each of the identified dimensions and the overall perceived service quality. This approach is prevalent in most works.
Machine learning/data mining with probabilistic models
We have identified one study which combine the methods of Machine Learning/Data Mining and Probabilistic Models. A probabilistic model quantifies the uncertainty by integrating first-principle knowledge with data in order to capture the dynamics in a distribution over model predictions for state transitions between samples in a batch run [77]. In this sense, this category includes models that represent uncertain causal relationships. More specifically in our case, probabilistic models are used to model quantitative KPIs regarding service quality.
[31] presents an application of a framework that aids in visually evaluating the quality of a city service against the quality of the experience using that service. More specifically, they use Markov Chain models and Discrete Events Simulation to calculate QoS metrics for Citibike’s reliability, and NLP techniques on Twitter and Yelp reviews, specifically sentiment analysis (polarity and sentiment identification) and topic modelling.
Machine learning/data mining with network analytics
With the rise of online social media, network analytics provide unprecedented opportunities to analyze not only the contents and multimedia (e.g. tweets, reviews) but also to explore the relationships (so-called edges in the theory) among the users (so-called nodes). Network topology refers to a layout of the nodes and the edges and its visualization uncovers patterns in interactions among users [78]. In the review, network analytics are used in the context of online social media (e.g. Twitter) in order to extract information for the relationships in the social network and in the context of semantic network analysis, as a method for visual text analytics to support knowledge building, analytical reasoning and explorative analysis [79].
[63] combine methods from the Machine Learning/Data Mining and Network Analytics to identify themes and compare differences in online travel reviews. A semantic association analysis as part of opinion mining was applied to extract thematic words and construct a semantic association network from reviews obtained from three major online travel agencies in China.
Moreover, there are two studies which combine techniques from Machine Learning/Data Mining and Statistical Analysis with Network Analytics. [42] aim to enhance the customer’s experience, satisfaction, and recommendation by qualitatively and quantitatively analyzing the reviews of airline passengers, by extracting keywords by text mining and grouping them using the CONCOR social network analysis. In addition, the study conducted three consecutive linear regression analyses to understand the relationship between evaluation factors, customer satisfaction, and recommendations presented on the customer review website. [41] applies semantic network analysis through text mining, as part of the qualitative analysis method of reviews on Skytrax, and linear regression analysis was conducted using SPSS as part of the quantitative analysis method, in the context of the airline industry.
Machine learning/data mining with logic-based models
Finally, there is one research work which combines Machine Learning/Data Mining methods with Logic-based models. Logic-based models are hypothesized descriptions of the chain of causes and effects leading to an outcome of interest. In the context of the information systems, they may include rule-based systems and representation of expert knowledge. [46] combined methods from the Machine Learning/ Data Mining and Logic-based models to classify aspect and sentiment using supervised ML algorithms (Support Vector Machines and Naïve Bayes Classifier). Before this classification, rule-based approach is applied to define patterns and rules for each aspect based on the observation of labeled training data.
Table 3 illustrates the categorization of applied methods and approaches in relation to the various data sources used as part of the research papers, namely Twitter, reviews, and domain specific data.
Table 3
Categorization of methods in relation to the data source
| Source | Data type | Methods | References | Count |
|---|---|---|---|---|
| Unstructured | A2 | [24, 35, 36, 48] | 4 | |
| A2 | [38] | 1 | ||
| A2 | [45] | 1 | ||
| Reviews | Unstructured | A2 | [39, 59, 62, 26, 30, 66, 57, 56, 55, 29, 53, 27, 65, 51, 47] | 15 |
| A2 | [63] | 1 | ||
| A2 | [46] | 1 | ||
| Unstructured and structured | A2 | [37, 40, 58, 44, 60, 69, 54, 52, 64] | 9 | |
| A2 | [25, 61] | 2 | ||
| A2 | [42, 41] | 2 | ||
| Twitter with domain specific data | Unstructured and structured | A2 | [32] | 1 |
| A1 | [31] | 1 | ||
| Domain specific data | Structured | A3 | [28] | 1 |
Table 4
Classification of reviewed works based on the type of the evaluation employed
| Type of evaluation | References | Count | |
|---|---|---|---|
| A1 | Quantitative methods | [35, 36, 45, 41, 42, 40, 25, 58, 44, 61, 59, 26, 62, 30, 66, 57, 69, 56, 55, 29, 53, 64, 54, 27, 65, 52, 46, 51, 47] | 29 |
| A2 | No evaluation | [24, 31, 28, 32, 63, 48] | 6 |
| A3 | Qualitative methods | [39, 38] | 2 |
| A4 | Mixed methods | [60, 37] | 2 |
Figure 7.
Employed evaluation methodologies and number of studies.
From the categorisation as explained in Table 3, we can deduce that works which process only unstructured textual data either from Twitter or online reviews, mainly use either Machine Learning/ Data Mining methods or the later combined with other methods (such as Statistical Analysis and Network Analytics), whereas works which leverage both unstructured and structured data mostly combine statistical analysis in order to derive the dependence of the variables in the perceived service quality and Data Mining techniques in order to capture the sentiment and the topics in the relevant reviews.
3.4Evaluation
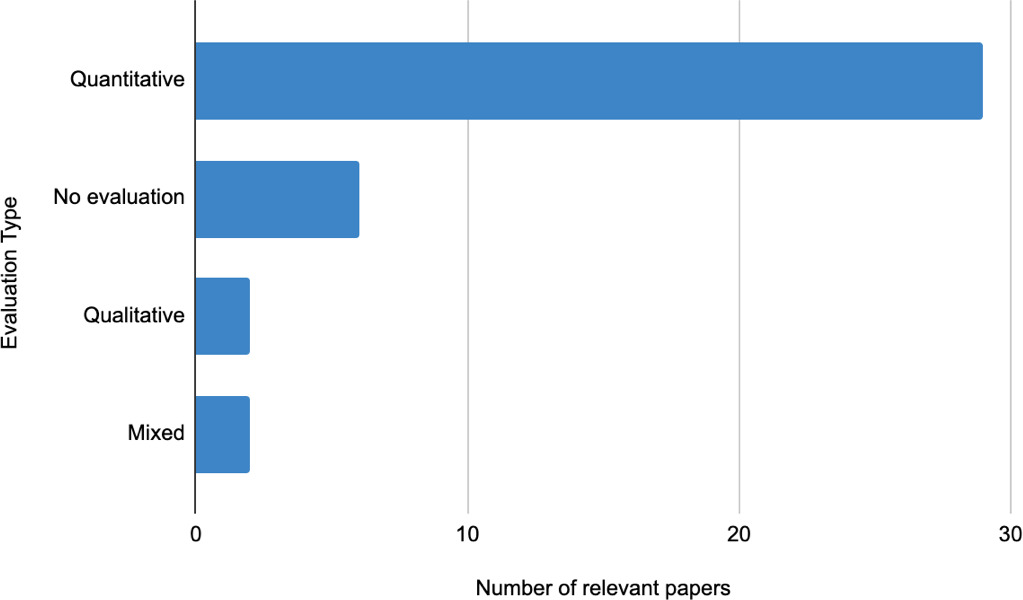
Figure 7 summarizes the evaluation methodology employed by the reviewed papers. Quantitative methodologies, being the predominant method, are based on the analysis of the collected data (text, quantitative data, questionnaires) using statistical methods, whereas qualitative methodologies rely on comparison with relevant surveys, literature, and established frameworks. Of all the studies, 74.3% employed only quantitative methodologies. Last, the use of only qualitative methodologies is used in 15.4% of the studies, two of the studies uses a mixed evaluation method and the rest (5.1%) do not employ any type of evaluation.
As indicated from Table 4, the vast majority employ quantitative methods to evaluate the achieved performance. Some of these include precision, recall, accuracy, F1-score, confusion matrix, ROC, PRC, kappa, error matrix and Jaccard coefficient and are mostly applied in the research papers which employ Machine Learning/Data Mining techniques. Moreover, R square, VIF scores for predictors in regression models and multiple regression analysis (ANOVA,
Perplexity and coherence are also used as measures to evaluate the performance of topic modelling in most of the works which deal with topic extraction and identification. Perplexity is one of the common examples of intrinsic evaluation to evaluate the performance of the topic model technique. Since it was found that perplexity may not yield human interpretable topics [80], researchers have then introduced topic coherence measures – a qualitative approach to automatically discover the coherence of a topic [81, 82]. The higher the topic coherence score, the more the semantically meaningful topic is generated [83].
Regarding the qualitative methods employed in the research papers, those include a comparison between the results obtained and empirical results or results obtained with traditional methods (a recent survey conducted by DKMA (2013) on 30,000 passengers of the 15 world’s largest airports [39]). Moreover, [38] compare the results from the social media analysis with the official service quality report from the Department of Transportation (DOT) Air Consumer Report and found that the proposed service quality metrics from social media are valid and can be used to estimate the service quality. Finally, two other works include both approaches (quantitative and qualitative). [37] use comparisons of sentiment score from Google reviews with respective star rating, using Spearman’s rank correlation, and comparison between categories of ASQ with clusters of topics identified by LDA. Moreover, [60] conduct an additional analysis to ensure the robustness of empirical results with alternative measurement of control variables and alternative model specifications and present the results.
The rest of the papers as indicated in Table 4, do not use any type of evaluation, while few of them have developed a use-case application instead (e.g., [28])
4.Research gaps and future directions
Our research has certain limitations that should be acknowledged. Firstly, the scope of our work focuses specifically on the intersection of data analytics and quality of service. As a result, we exclude studies that aim to measure service quality without utilizing data analytics techniques. This deliberate exclusion helps to maintain the focus and relevance of our findings within the specified context. Secondly, our review includes literature compiled until the year 2021, which means that more recent developments and advancements in the field may not be accounted for. It is essential for future research to consider the latest developments to gain a comprehensive understanding of the subject. Lastly, given that our investigation represents the first relevant work in this specific domain to our knowledge, we were unable to compare our results with any existing systematic literature reviews. Further studies should aim to replicate and build upon our research to provide a more robust and comparative analysis of the topic.
Some of the commonalities identified in the literature are that all of the reviewed research works are addressed to similar stakeholders (mostly managers and operators and fewer to users of the service), the vast majority use user-generated online content (either social media or reviews websites) in the English language, and most do not perform any kind of spatiotemporal analysis, but view the data as a whole without taking into account any geographic and/or time information associated with it.
To contribute to further advancements in the use of Big Data Analytics in measuring service quality across various domains, our research goes beyond a mere review and synthesis of existing literature and aims to address the challenges and gaps that emerge. By synthesizing these challenges, we aim to shed light on the areas that require further attention and exploration. Moreover, we go beyond the scope of existing research to outline potential directions for future investigations in this field that can enhance the effectiveness and accuracy of service quality measurement through Big Data Analytics. Our intention is to provide researchers and practitioners with valuable insights and a roadmap to guide their future endeavors, fostering continuous progress and improvement in this domain.
4.1Data interpretation as part of the methodology
4.1.1Visualisation
Because of the way the human brain processes information, visualizing large amounts of complex data using charts or dashboards is essential. Data visualization is a way to convey concepts in a universal manner and to identify relationships and patterns, pinpoint emerging trends and draw conclusions from information deriving from a multitude of sources. Data visualization can also assist stakeholders in identifying areas that need attention or improvement, can help clarify which factors influence customer behavior and can help in predicting future quality of service based on these factors over time. According to our literature review, there is only one paper [28] that proposes an implementation of a graphical user interface, which can read health data and provide means for analysts to run experiments and analyze health data. Moreover, in two studies, the visualization step in an integral part of the methodology; in [32] emporal visualizations are created to analyze and evaluate a snowstorm case study of New York’s Metro North Railroad train system, whereas in [31] depicts the reliability of Citibike application with a sentiment and emotion analysis of users over time, in the same timeline. Last but not least, few works depict the results from their analysis in a graphical manner, even though they do not propose a dashboard or web application for stakeholders, e.g. [63, 30, 66, 47, 48]. A suggestion for a future direction would be the close collaboration of a selected group of stakeholders with the researchers, so that the impact of the conducted work is evaluated from the stakeholders’ perspective as well as the provision of respective tools (for instance, an admin dashboard) to a selected group of stakeholders so that they can monitor the perceived service quality in a timely and customisable fashion.
Proposition: Providing a visual dashboard and/or application to the respective stakeholders would help them in understanding the issues which need improvement, thus aiding to the service quality being upgraded.
4.1.2Context of discussion
Context analysis of text helps analysts understand why people feel the way they do. Without this insight, it’s hard to know what actions the respective stakeholders or managers should take. Through capturing the context of discussion, data analysts and others can make better-informed decisions and recommendations, whatever their goals. From the literature, we deduce that only 25% of the studies focus on analyzing the context of discussion. Moreover, this analysis is not extensive and in depth, but still reveals some of the discussion topics and themes emerging from the data. The techniques used to capture the context of discussion in the reviewed papers are: 1. Topic modelling and clustering, including the works of [31, 45, 37, 40, 44, 61, 26, 59, 64, 30]. 2. Factor analysis[58]. 3. Keyness of words for each identified dimension[24].
Proposition: More Data-Driven techniques should be applied in order to capture the context of discussions in relation to measuring service quality.
4.2Representation of different segments of the market
4.2.1Multitude of languages
The majority of research efforts are devoted to English-language data, while a great share of information is available in other languages. With the growth of the Internet around the world, users write comments in different languages. Performing analysis in only single language increases the risks of missing essential information in texts written in other languages. In the case of the reviewed papers, only few exploit text in other languages, more specifically: combination of English and Arabic [36], Italian [44], Chinese [30, 63, 53], Turkish [29], combination of Vietnamese and English [65], Indonesian [46].
Proposition: The use of data including languages other than English would promote the understanding of perceived service quality in various parts of the world and in underrepresented market segments.
4.2.2Geographic distribution
From the conducted review, we have not identified any no work taking into account a global geo-spatial distribution of data. Only the work of [28] compares the trends of QoS in relevance with health habits across the US, and provides insights by comparing different states. Geo analytics combines traditional analytics with location-based information to provide greater context and perspective about the data being studied. Geo-location and other spatial information can expand intelligence by providing a new axis on which to discover insights, which can be useful for stakeholders.
Proposition: The analysis considering the geographic distribution of data would enable a more detailed understanding of segments of the market where perceived service quality fluctuates.
4.3Standardisation and quality assurance
4.3.1Performance indicators part of an established framework
From the examined works, there are few which base their analysis on a well-established and accepted framework. The frameworks which are used as reference for the relevant dimensions are: 1. SERVQUAL [24, 44, 26, 48, 38]. 2. ASQ for the aviation industry [37, 35, 36] 3. SERVPERF [69, 52]. 4. HOLSERV plus [66].
Proposition: A way to address the uncertainty of the obtained results is to combine the data-driven approach with a well-established framework.
4.3.2Multitude of data sources
Table 5
Summary of identified gaps in literature and research propositions
| High level challenges | Future directions | Recommendations |
|---|---|---|
| Data interpretation aspart of the methodology | Visualisation | Providing a visual dashboard and/or application to the respective stakeholders would help them in understanding the issues which need improvement, thus aiding to the service quality being upgraded. |
| Context of discussion | More Data-Driven techniques should be applied in order to capture the context of discussions in relation to measuring service quality. | |
| Representation of different market segments | Multitude of languages | The use of data including languages other than English would promote the understanding of perceived service quality in various parts of the world and in underrepresented market segments. |
| Geographic Distribution | The analysis considering the geographic distribution of data would enable a more detailed understanding of segments of the market where perceived service quality fluctuates. | |
| Standardization and quality assurance | Performance indicators part of an established framework | A way to address the uncertainty of the obtained results is to combine the data-driven approach with a well-established framework. |
| Multitude of data sources | In order to reveal the big picture, there is the need to use multiple data sources as input to assess the respective service quality. | |
| Representation of service quality over time | Analysis over time | Assessing the service quality can benefit from integrating the aspect of time and the analysis over time. |
| Seasonality patterns | Seasonality should be considered when measuring service quality. | |
| Representation of service quality across domains | Common representation of objective and perceived service quality | Representing objective service quality factors together with the perceived service quality can shed light into their dependencies and help stakeholders understand their relationship better. |
| Domain adaptation | Domain adaptation is a promising approach for cross-domain measurement of perceived service quality. |
Further research is needed towards the direction of combining data from different sources in order to assess accurately the service quality. To this end, the combined use of structured domain-specific data with unstructured textual and visual information can complement each other and help provide hidden patterns and convey the bigger picture of the factors which influence service quality to the stakeholders. Moreover, one of the limitations mentioned in the majority of the examined research works is the fact that Twitter users are not representative of the society. Some even suggest that other popular social media websites such as Facebook and Instagram, or blogs and review sites, should be included platforms to cross-validate the findings of their studies and provide a more complete image of the perceived service quality.
Proposition: In order to reveal the big picture, there is the need to use multiple data sources as input to assess the respective service quality.
4.4Representation of service quality over time
4.4.1Analysis over time
Time is an important dimension which has not been exploited, except for six research papers. Moreover, the data has not been analysed in depth towards this direction, only exposing a few interesting outcomes from the analysis. The works which take into account time as an axis for their analysis are the following: [31, 32, 37, 28, 40, 27, 48].
Proposition: the service quality can benefit from integrating the aspect of time and the analysis over time.
4.4.2Seasonality patterns
In many cases, service offerings are highly dependent on seasonal variations and, as such, obtaining and analysing a large sample containing several monthly observations would be able to demonstrate how service quality dimensions fluctuate across a time continuum.
[40] in their work present the temporal variations in service quality dimensions, which is exhibited upon the dominance of some topics in specific time periods, for instance during periods of high loads for airlines (summer and Christmas), they notice that the topic “Delays” is prevalent in the textual data. This dimension should be further exploited by future works since the analysis in that level better captures the current service provisioning conditions than the variations exhibited on online reviews and social media data, which signifies that customer preferences change not only over time, but there may be similarities in recurring time periods.
Proposition: Seasonality should be considered when measuring service quality.
4.5Representation of service quality across domains
4.5.1Common representation of objective and perceived service quality
In the vast majority of cases, the perceived service quality is analysed and assessed in a standalone manner without taking into account from quantitative metrics, such as Key Performance Indicators of the provided service. It is thus proposed as a research direction to create a framework to explore, analyse, and assess the perceived service jointly with the objective metrics of quality of a service. Two of the examined works attempt to bridge this gap: [32] proposes a framework that can use multiple data sources to analyse a disruption both from a qualitative and a quantitative perspective, [31] proposes a framework which joins hard metrics with opinion mining in respect to a city service.
Proposition: Representing objective service quality factors together with the perceived service quality can shed light into their dependencies and help stakeholders understand their relationship better.
4.5.2Domain adaptation
Domain adaptation is a fundamental problem in Machine Learning, yet it has started getting attention quite recently. It is a relatively new topic that is still constantly attracting attention, though the need to apply domain adaptation is prevalent in many real-world problems [84]. Domain adaptation is a sub-discipline of machine learning which deals with scenarios in which a model trained on a source distribution is used in the context of a different (but related) target distribution. In general, domain adaptation uses labeled data in one or more source domains to solve new tasks in a target domain [85]. Despite its recent popularity, we have not identified any relevant work in this review. With the growing number of reviews and microblogging which concern various fields, the need to extract information using a unified framework across domains becomes more and more critical and domain adaptation is a way to accomplish this.
Proposition: Domain adaptation is a promising approach for cross-domain measurement of perceived service quality.
5.Conclusion
Data analytics for measuring perceived service quality is an evolving and dynamic field that has garnered significant interest from researchers and practitioners alike. With the ever-increasing availability of vast amounts of data on the internet, numerous research works are dedicated to contributing to this domain, empowering stakeholders such as management and policymakers to extract meaningful insights regarding the quality of their services. In this systematic literature review, we thoroughly examined the existing body of literature on data analytics methods employed in measuring perceived service quality across various domains. Through our analysis, we not only identified the prevailing research gaps but also delineated promising directions for future investigations, depicted in Table 5 in the form of research propositions.
Our review has unequivocally demonstrated that measuring service quality is a crucial advancement that harnesses the immense potential of the data generated from microblogging sites and businesses, thereby enhancing decision-making processes and operational efficiency. However, it is important to note that the current utilization of data analytics in measuring service quality remains somewhat limited to specific application domains. This review specifically focuses on works that explicitly incorporate data analytics methods for measuring service quality and do not take into account traditional methods.
Research on how to use user generated data to measure and evaluate service quality in service industry is still scant, yet this review has provided insights into several notable research works which attempt to extend the traditional research methods, such as surveys (i.e., SERVQUAL, ASQ) by developing alternative approaches to evaluate service quality on different domains using data analytics methods. This is expected to become much more common and understood by a wide variety of managers, since capturing business value from data requires quick action on real-time events and monitoring of the service quality nowadays is crucial for a flourishing business. Moreover, if the data analytics take into account important aspects such as spatiotemporal fluctuations, visualisations for the end-users as well as representation of different market segments, we expect that the added value of this approach will be much more significant compared to traditional survey methods.
In conclusion, our systematic literature review not only provides valuable insights into the current state of research on data analytics methods for measuring perceived service quality but also paves the way for future advancements in this domain. By filling existing research gaps and proposing new directions, this review contributes to the ongoing progression of leveraging data analytics to effectively evaluate and enhance service quality in a wide range of industries.
Funding
This work is partly funded by the European Union’s Horizon 2020 project METICOS “A Platform for Monitoring and Prediction of Social Impact and Acceptability of Modern Border Control Technology” (Grant agreement No 883075). The work presented here reflects only the authors’ view and the European Commission is not responsible for any use that may be made of the information it contains.
References
[1] | Ladhari R. A review of twenty years of SERVQUAL research. International Journal of Quality and Service Sciences. (2009) ; 1: (2): 172-198. |
[2] | Shemwell D, Yavas U, Bilgin Wuhrer FZ. Customer-service provider relationships: An empirical test of a model of service quality, satisfaction and relationship-oriented outcomes. International Journal of Service Industry Management. (1998) ; 7: (2): 155-168. |
[3] | Parasuraman A, Zeithaml VA, Malhotra A. SERVQUAL: A multiple item scale for measuring consumer perceptions of service quality. Journal of Retailing. (1988) ; 64: (1): 12-40. |
[4] | Kao TWD, Lin WT. The relationship between perceived e-service quality and brand equity: A simultaneous equations system approach. Computers in Human Behavior. (2016) : 208-219. |
[5] | Brady M, Cronin J Jr. Some New Thoughts on Conceptualizing Perceived Service Quality: A Hierarchical Approach. Journal of Marketing – J MARKETING. (2001) ; 61: : 34-49. |
[6] | Cronin JJ, Taylor S. Measuring Service Quality – A Reexamination And Extension. Journal of Marketing. (1992) ; 56: : 55-68. |
[7] | Parasuraman AP, Zeithaml VA, Berry LL. SERVQUAL: A multiple-item Scale for measuring consumer perceptions of service quality. Journal of Retailing. (1988) . |
[8] | Cronin JJJ, Taylor SA. SERVPERF versus SERVQUAL: Reconciling performance-based and perceptions-minus-expectations measurement of service quality. Journal of Marketing. (1994) : 125-131. |
[9] | Schwarz N. Self-reports: how the questions shape the answers. American Psychologist. (1999) ; 54: (2): 93. |
[10] | Litvin SW, Goldsmith RE, Pan B. Electronic word-of-mouth in hospitality and tourism management. Tourism Management. (2008) ; 29: (3): 458-468. |
[11] | De Silva D. Evidence scan: Measuring patient experience. (2013) . |
[12] | Mohri M, Rostamizadeh A, Talwalkar A. Foundations of Machine Learning. MIT Press; (2018) . |
[13] | Saad S, Saberi B. Sentiment Analysis or Opinion Mining: A Review. International Journal on Advanced Science Engineering and Information Technology. (2017) . |
[14] | Zomaya lY, Sakr S. Handbook of Big Data Technologies. Springer; (2017) . |
[15] | Tranfield D, Denyer D, Smart P. Towards a Methodology for Developing Evidence: Informed Management Knowledge by Means of Systematic Review. British Journal of Management. (2003) ; 14: : 207-222. |
[16] | Barbosa MW, Vicente ADLC, Ladeira MB, Oliveira MPVD. Managing supply chain resources with big data analytics: A systematic review. International Journal of Logistics Research and Applications. (2018) ; 21: (3): 177-200. |
[17] | Nguyen T, Li Z, Spiegler V, Ieromonachou P, Lin Y. Big data analytics in supply chain management: A state-of-the-art literature review. Computers & Operations Research. (2018) : 254-264. |
[18] | Inamdar Z, Narwane RRVS. Asystematic literature review with bibliometric analysis of big data analytics adoption from period 2014 to 2018. Journal of Enterprise Information Management. (2019) ; 34: (1): 101-139. |
[19] | Duan Y, Edwards JS, Dwivedi YK. Artificial intelligence for decision making in the era of Big Data – evolution, challenges and research agenda. International Journal of Information Management. (2019) ; 48: : 63-71. |
[20] | Senyo PK, Liu K, Effah J. Digital business ecosystem: Literature review and a framework for future research International. Journal of Information Management. (2019) ; 47: : 52-64. |
[21] | Meesala A, Paul J. Service quality, consumer satisfaction and loyalty in hospitals: thinking for the future. J Retail Consum Serv. (2018) ; 40: : 261-269. |
[22] | Sajid M, Baig M. Quality of health care: an absolute necessity for public satisfaction. Int J Health Care Qual Assur. (2007) ; 20: : 545-548. |
[23] | Danielson B, al. e. Development of indicators of the quality of radiotherapy for localized prostate cancer. Radiother Oncol. (2011) ; 99: : 29-36. |
[24] | Lee HJ, Lee M, Lee H, Cruz RA. Mining service quality feedback from social media: A computational analytics method. Government Information Quarterly. (2021) ; 38: (2): 101571. |
[25] | Shah AM, Yan X, Shah SAA, Mamirkulova G. Mining patient opinion to evaluate the service quality in healthcare: a deep-learning approach. Journal of Ambient Intelligence and Humanized Computing volume. (2020) ; 11: : 2925-2942. |
[26] | Shah AM, Yan X, Tariq S, Khan S. istening to the patient voice: using a sentic computing model to evaluate physicians’ healthcare service quality for strategic planning in hospitals. Qual Quant. (2021) ; 55: : 173-201. |
[27] | Jung Y, Hur C, Jung D, Kim M. Identifying key hospital service quality factors in online health communities. J Med Internet Res. (2015) ; 17: (4). |
[28] | Batarseh FA, Latif EA. Assessing the Quality of Service Using Big Data Analytics: With Application to Healthcare. Big Data Research. (2016) ; 4: : 13-24. |
[29] | Ceyhan M, Orhan Z, Domnori E. Health service quality measurement from patient reviewsin Turkish by opinion mining. In: CMBEBIH 2017. Singapore: Springer Nature; (2017) . pp. 649-653. |
[30] | Liu Y, Li Y, Li W. Natural language processing approach for appraisal of passenger satisfaction and service quality of public transportation. IET Intelligent Transport Systems. (2019) ; 13: (11): 1701-1707. |
[31] | Svartzman GG, Ramirez-Marquez JE, Barker K. Social media analytics to connect system performability and quality of experience, with an application to Citibike. Computers & Industrial Engineering. (2020) ; 139. |
[32] | Svartzman GG, Marquez JER. Listen to the people! comparing perceived and documented disruptions in public transportation, through quantitative quality of experience, the case study of NYC. In: 2019 IEEE International Conference on Systems, Man and Cybernetics (SMC). Bari, Italy: IEEE; (2019) . pp. 947-952. |
[33] | Prentice C, Kadan M. The role of airport service quality in airport and destination choice. Journal of Retailing and Consumer Services. (2019) . |
[34] | Bezerra G, Gomes CF. Antecedents and consequences of passenger satisfaction with the airport. Journal of Air Transport Management Volume. (2020) ; 83: . |
[35] | Martin-Domingo L, Martín JC, Mandsberg G. Social media as a resource for sentiment analysis of Airport Service Quality (ASQ). Journal of Air Transport Management. (2019) ; 78: : 106-115. |
[36] | Barakat H, Yeniterzi R, Martín-Domingo L. Applying deep learning models to twitter data to detect airport service quality. Journal of Air Transport Management. (2021) ; 91: : 102003. |
[37] | Lee K, Yu C. Assessment of airport service quality: A complementary approach to measure perceived service quality based on Google reviews. Journal of Air Transport Management. (2018) ; 71: : 28-44. |
[38] | Tian X, He W, Tang C, Li L, Xu H, Selover D. A new approach of social media analytics to predict service quality: evidence from the airline industry. Journal of Enterprise Information Management. (2019) ; 33: (1). |
[39] | Gitto S, Mancuso P. Improving airport services using sentiment analysis of the websites. Tourism Management Perspectives. (2017) ; 22: : 132-136. |
[40] | Korfiatis N, Stamolampros P, Kourouthanassis P, Sagiadinos V. Measuring service quality from unstructured data: A topic modeling application on airline passengers’ online reviews. Expert Systems with Applications. (2019) ; 116: : 472-486. |
[41] | Shadiyar A, Ban HJ, Kim HS. Extracting Key Drivers of Air Passenger’s Experience and Satisfaction through Online Review Analysis. Sustainability. (2020) ; 12: (21): 9188. |
[42] | Ban HJ, Kim HS. Understanding Customer Experience and Satisfaction through Airline Passengers’ Online Review. Sustainability. (2019) ; 11: (5): 4066. |
[43] | AlBalushi TH. E-Services Quality: A Perspective of Service Providers and Service Users. In: Kang K. E-Service. Intechopen; (2020) . |
[44] | Palese B, Usai A. The relative importance of service quality dimensions in E-commerce experiences. International Journal of Information Management. (2018) ; 40: : 132-140. |
[45] | Kar AK. What Affects Usage Satisfaction in Mobile Payments? Modelling User Generated Content to Develop the “Digital Service Usage Satisfaction Model”. Inf Syst Front. (2020) . |
[46] | Fachrina Z, Widyantoro DH. Aspect-Sentiment Classification in Opinion Mining using the Combination of Rule-Based and Machine Learning. In: 2017 International Conference on Data and Software Engineering (ICoDSE). (2017) . |
[47] | Tilahun T, Sharma DP. Design and Development of E-Governance Model for Service Quality Enhancement. Journal of Data Analysis and Information Processing. (2015) ; 3: (3). |
[48] | He W, Tian X, Hung A, Akula V, Zhang W. Measuring and comparing service quality metrics through social media analytics: a case study. Information Systems and e-Business Management. (2018) : 579-600. |
[49] | Oh H, Parks S. Customer satisfaction and service quality: a critical review of the literature and research implications for the hospitality industry. Hospitality Research Journal. (1997) : 35-64. |
[50] | LonashreeSanasam, Pradhan BB, Samal A. Service quality in hospitality industry: a systematic review of models. Review of Business and Technology Research. (2019) ; 15: : 179-186. |
[51] | Zvarevashe K, Olugbara OO. A Framework for Sentiment Analysis with Opinion Mining of Hotel Reviews. In: 2018 Conference on Information Communications Technology and Society (ICTAS). IEEE; (2018) . |
[52] | Duan W, Cao Q, Yu Y, Levy S. Mining Online User-Generated Content: Using Sentiment Analysis Technique to Study Hotel Service Quality. In: 46th Hawaii International Conference on System Sciences. IEEE; (2013) . pp. 3119-3128. |
[53] | Chiu C, Chiu NH, Sung RJ, Hsieh PY. Opinion mining of hotel customer-generated contents in Chinese weblogs. Current Issues in Tourism. (2015) ; 18: (5): 477-495. |
[54] | Berezina K, Bilgihan A, Cobanoglu C, Okumus F. Understanding Satisfied and Dissatisfied Hotel Customers: Text Mining of Online Hotel Reviews. Journal of Hospitality Marketing & Management. (2016) ; 25: (1): 1-24. |
[55] | Prameswari P, Surjandari I, Laoh E. Opinion Mining from Online Reviews in Bali Tourist Area. In: 2017 3rd International Conference on Science in Information Technology (ICSITech). IEEE; (2017) . |
[56] | Putri NAS, Alamsyah A. Opinion mining of tripadvisor review towards five-star hotels in bandung city. e-Proceeding of Management. (2017) : 572. |
[57] | Gupta S, Jain S, Gupta S. Opinion mining for hotel rating through reviews using decision tree classification method. International Journal of Advanced Research in Computer Science. (2018) ; 9: (2). |
[58] | Xiang Z, Schwartz Z, Gerdes JH Jr, Uysala M. What can big data and text analytics tell us about hotel guest experience and satisfaction?. International Journal of Hospitality Management. (2015) ; 44: : 120-130. |
[59] | Chinsha TC, Shibily J. Aspect based Opinion Mining from Restaurant Reviews. International Journal of Computer Applications. (2014) . |
[60] | Zhao Y, Xu X, Wang M. Predicting overall customer satisfaction: Big data evidence from hotel online textual reviews. International Journal of Hospitality Management. (2019) : 111-121. |
[61] | Nilashi M, Mardani A, Liao H, Ahmadi H, Manaf AA, Almukadi WA. A Hybrid Method with TOPSIS and Machine Learning Techniques for Sustainable Development of Green Hotels Considering Online Reviews. Sustainability. (2019) ; 11: (21): 6013. |
[62] | Annisa R, Surjandari I, Zulkarnain Z. Opinion Mining on Mandalika Hotel Reviews Using Latent Dirichlet Allocation. Procedia Computer Science. (2019) ; 161: : 739-746. |
[63] | Hou Z, Cui F, Meng Y, Lian T, Yu C. Opinion mining from online travel reviews: A comparative analysis of Chinese major OTAs using semantic association analysis. Tourism Management. (2019) : 276-289. |
[64] | Guo Y, Barnes SJ, Jia Q. Mining meaning from online ratings and reviews: Tourist satisfaction analysis using latent dirichlet allocation. Tourism Management. (2017) : 467-483. |
[65] | Thuy NTT, Bach NX, Phuong TM. Cross-Language Aspect Extraction for Opinion Mining. In: 2018 10TH INTERNATIONAL CONFERENCE ON KNOWLEDGE AND SYSTEMS ENGINEERING (KSE). IEEE; (2018) . |
[66] | Rus AMM, Annisa R, Surjandari I, Zulkarnain. Measuring Hotel Service Quality in Borobudur Temple Using Opinion Mining. In: 2019 16th International Conference on Service Systems and Service Management (ICSSSM). (2019) . pp. 1-5. |
[67] | Cronin JJJ, Taylor SA. SERVPERF versus SERVQUAL: reconciling performance-based and perceptions-minus-expectations measurement of service quality. Journal of Marketing. (1994) : 125-131. |
[68] | Kant R, Jaiswal D. The impact of perceived service quality dimensions on customer satisfaction: an empirical study on public sector banks in India. International Journal of Bank Marketing. (2017) : 411-430. |
[69] | Chakrabarti S, Trehan D, Makhija M. Assessment of service quality using text mining – evidence from private sector banks in India. International Journal of Bank Marketing. (2018) . |
[70] | Nasrabadi NM. Pattern recognition and machine learning. Journal of Electronic Imaging. (2007) : 049901. |
[71] | Chakrabarti S, Ester M, Fayyad U, Gehrke J, Han J, Morishita S, et al. Data mining curriculum: A proposal (Version 1.0). In: Intensive Working Group of ACM SIGKDD Curriculum Committee. (2006) . p. 140. |
[72] | Ravi K, Ravi V. A survey on opinion mining and sentiment analysis: tasks, approaches and applications. Knowl Based Syst. (2015) ; 89: : 14-46. |
[73] | Bakshi RK, et al. Opinion mining and sentiment analysis. In: 2016 3rd International Conference on Computing for Sustainable Global Development (INDIACom). IEEE; (2016) . |
[74] | Ying SY, Keikhosrokiani P, Asl MP. Comparison of Data Analytic Techniques for a Spatial Opinion Mining in Literary Works: A Review Paper. In: Saeed F, Mohammed F, Al-Nahari A. Innovative Systems for Intelligent Health Informatics (IRICT 2020). Lecture Notes on Data Engineering and Communications Technologies, vol 72. Springer; (2021) . pp. 523-535. |
[75] | Kumar SA, et al. Computational intelligence for data analytics. Recent Advances in Computational Intelligence. Springer. (2019) : 27-43. |
[76] | Romijn JW. Philosophy of statistics. Stanford Encyclopedia of Philosophy. (2014) . |
[77] | Martinez EC, Cristaldi MD, Grau RJ. Design of dynamic experiments in modeling for optimization of batch processes. Industrial & Engineering Chemistry Research. (2009) ; 48: (7): 3453-3465. |
[78] | Tabbassum S, Pereira FSF, Fernandes S, Gama J. Social network analysis: An overview. Wiley Interdisciplinary Reviews: Data Mining and Knowledge Discovery. (2018) ; 8: (5). |
[79] | Drieger P. Semantic Network Analysis as a Method for Visual Text Analytics. Procedia – Social and Behavioral Sciences. (2013) : 4-17. |
[80] | Chang J, et al. Reading tea leaves: how humans interpret topic models. In: Advances in Neural Information Processing Systems. (2009) . |
[81] | Aletras N, Stevenson M. Evaluating topic coherence using distributional semantics. In: Proceedings of the 10th International Conference on Computational Semantics (IWCS 2013) – Long Papers (2013). (2013) . |
[82] | Lau JH, Newman D, Baldwin T. Machine reading tea leaves: automatically evaluating topic coherence and topic model quality. In: Proceedings of the 14th Conference of the European Chapter of the Association for Computational Linguistics. (2014) . |
[83] | Stevens K, et al. Exploring topic coherence over many models and many topics. In: Proceedings of the 2012 Joint Conference on Empirical Methods in Natural Language Processing and Computational Natural Language Learning. (2012) . |
[84] | Jiang J. A Literature Survey on Domain Adaptation of Statistical Classifiers. (2008) ; Available from: http://sifaka.cs.uiuc.edu/jiang4/domainadaptation/survey. |
[85] | Kouw WM, Loog M. An introduction to domain adaptation and transfer learning. arXiv preprint. (2018) . |

