
On the domain aided performance boosting technique for deep predictive networks: A COVID-19 scenario
Abstract
Deep learning models are one of the widely used techniques for forecasting time series data in various applications. It has already been established that the Recurrent Neural Networks (RNN) such as the Long Short-Term Memory (LSTM), Gated Recurrent Units (GRU), etc., perform well in analyzing sequence data for accurate time-series predictions. But, these specialized recurrent architectures suffer from certain drawbacks due to their computational complexity and also their dependency on short term historical data. Hence, there is a scope for further improvement. This paper analyzes the effects of various optimizers and hyper-parameter tuning, on the precision and time efficiency of different deep neural architectures. The analysis has been conducted on COVID-19 pandemic data. Since Convolutional Neural Networks (CNN) are known for their super-human ability in identifying patterns from images, the time-series data has been transformed into a slope-information domain for analyzing the slope patterns over time. The domain patterns have been projected on a 2D plane for further analysis using a restricted recursive CNN (RRCNN) algorithm. The experimental results reveal that the proposed methodology reduces the error over benchmarked sequence models by almost 20% and further reduces the training time by nearly 50%. The prediction models considered in this study have been evaluated using Root Mean Squared Error (RMSE), Mean Absolute Error (MAE), and Mean Absolute Percentage Error (MAPE%).
1.Introduction
EALTH officials of China reported to the World Health Organization (WHO) [1] about a viral pneumonia outbreak in December’2019. The outbreak started spreading from the Wuhan city in Hubei province of China. A novel viral strain with a possible zoonotic origin could be traced back to a Hunan seafood market in China [2]. The centre of Evidence-based Medicines published an article [3] stating that the very first Corona like viral strain was first discovered in 1968. The article was published in Nature in the same year [4].
Researchers [5] have claimed that it has been possible to phylogenetically trace back the COVID-19 variant of the Corona like viral strain to a SARS-like bat virus. The human-to-human viral transmission is facilitated through a close contact with an infected individual. They [5] have further claimed to have identified a couple of strains (
Transmission of similar novel viral strains such as the COVID-19 with no potential antidotes can infect and kill millions all over the world. In this context, Artificial Intelligence (AI) may prove to be an useful tool in appropriate contingency planning and can help in quick recovery if approximate estimations of the ensuing disruptions can be evaluated in advance. Owing to the urgency of the COVID-19 pandemic scenario, the data related to the spread of the pandemic have been considered for analysis in the current study.
Studies [10] have been conducted across the globe on the viral characteristics, transmissions possibilities, risk factors, clinical manifestations, radiological findings, prevention strategies etc. They have explored the potential of AI [11] to find superior and cost effective alternatives over the traditional approaches to fight such pandemics. Experiments have also been conducted for efficiently screening, tracking and predicting the pandemic impact by using advanced technologies such as the Internet of Things (IOT), Big Data analytics, 5G telecommunication networks, AI, Blockchain [12] etc.
Insufficient healthcare infrastructure in handling large scale infection have prompted the essence of AI empowerment for effective prevention. Phone based web-survey [13] and other applications (“Symptoma” etc.) [14] have been developed to collect basic travel information along with any recognized symptoms like fever, cough, shortness of breath, diarrhea, pneumonia etc. These applications were able to classify the data into high, moderate and low-risk groups so that the subjects may be accordingly intervened to take precautionary measures. Governments, social policies and healthcare systems were not prepared to handle a pandemic (COVID-19) in such a large scale [15]. Besides, research [16] in business development testifies that any impact on supply chains has subsequent effect on business operations which in turn can bring down the world economy.
From the time of a contagious agent detection, till the commercial availability of vaccines, “Quarantine” and “Social distancing” remains the one and only inevitable solution for saving human lives. Unfortunately, this solution apparently comes with its own set of disadvantages. It can potentially lead to an all round disruption across all fronts of human operations. In this background, redemption can only be achieved through good and timely decision making and formulation of winning strategies. Solid understanding of the present situations and probable future impacts can help in better decision making at an early stage.
Working in the same direction, a group has employed a LSTM [17] network which was already pre-trained on the 2003 SARS data. The model was using an MSE based loss function with an Adam optimizer. The algorithm was able to predict a peak nearing 95k. Another group of researchers [18] investigated the transmission dynamics using CNN and few RNN variants like LSTM and GRU to predict the trend of the pandemic upto one day in advance. However, these models defeat the basic idea of providing an adequate time window for contingency planning as the model outcomes are unable to predict the daily scenarios in the longer term.
A problem statement has been selected for the current study to develop a COVID-19 pandemic prediction model for daily forecasting over a longer term. In this context, a notable work [19] on the transformation of 2D sensor data to the visual domain, was able to achieve a higher classification accuracy by over 10% compared to the conventional methods. The present work also explores a domain transfer technique to enhance the accuracy of the deep predictive models in pandemic forecasting.
Better decisions taken in a timely manner coupled with well-thought strategies, lead to higher chances of revival in the long run. In this background, the contributions of this paper are as follows:
1. To study the correlations between the rate of spread of the COVID-19 pandemic and the native population density and climatic parameters have been analyzed for efficient feature selection.
2. To develop LSTM and GRU models for pandemic forecasting. These models have been further improved with hyperparameter tuning and suitable optimizer configurations.
3. To develop a performance boosting technique based on domain transformation for improving the performance of deep predictive networks. This can enable the application of CNN models on a 2D slope-information plane for more efficient data analysis in resource constrained environments. Further, a problem specific restricted-recursive-CNN (RRCNN) has been applied for time series prediction of pandemic data.
4. To develop an effective methodology for helping in strategic decision making at the onset of future pandemic scenarios.
The rest of the paper is organized as follows. Section 2 presents the related work done towards the development of AI based algorithms for analysis of COVID-19 transmission data and other environmental time series data analysis. The proposed approach has been discussed in Section 3. The experimental investigations and the results have been discussed in Section 4 while the Section 5 concludes the paper.
2.Related work
Different LSTM, GRU based algorithms have been employed for time series analysis as a part of various environmental research work. But, these specialized recurrent architectures involve heavy computation and require higher training times. This section reviews some of the related attempts made towards the study of sequenced, non-stationary data. These environmental studies (COVID-19 crisis etc.) can be highly benefited from the current research. The current work also presents similar techniques which have improved the performance of recurrent predictive networks by using CNN to analyze related 2D image patterns. The proposed methodology is helpful for the analysis of COVID-19 transmission analysis and for other naturally occurring time series data.
2.1LSTM for COVID-19 transmission analysis
LSTM [17] have been used in effectively predicting the COVID-19 transmission dynamics. The recurrent nets are known for their ability to store short term memory of the previous data sequences through recursive neural connections. These LSTM variants have been utilized to learn the interrelationships between any parametric variations to estimate the future transmission dynamics. However, on the downside, the data obtained from the natural surroundings are non-stationary in nature. These are therefore unpredictable and difficult to model. The recurrent neural architectures fail to effectively learn the embedded characteristic features of such non-stationary data. So, a more detailed analysis of the gradually changing slope information can be extracted from such data for more accurate estimations.
2.2LSTM, GRU networks for stock price prediction
Stock market indexes are guided by a number of complicated financial indicators. Researchers have explored LSTM [20] for predicting the stock prices of Nifty 50 by analyzing the historical data of the previous five years. Based on the data collected on multiple financial indicators, the system was able to predict the opening and closing stock prices with reasonable accuracy. Similar attempts have also been made using linear regressions and time series models [21] for predicting rice price volatility in the Sri Lankan market. Projection of the same market indicators on a 2D or a 3D plane and analyzing with CNN based counterparts could possibly reduce the error in predictions.
2.3LSTM networks for wind speed forecasting
Wind speed have been considered as a potential renewable form of energy since centuries. With the wind power gaining more popularity in many countries as a renewable energy source, it is important to find an effective way to harness the power of wind speed for generating electricity. In this context, LSTM networks [22] have been applied to learn from the historical climatic data. A proposed LSTM based model was able to predict the wind speed of Wind Atlas for South Africa (WASA) with reasonable accuracy. If the same data is analyzed based on the changing slopes of the historical climate, then the study might lead to further reduction of the error in estimation.
2.4LSTM networks for sea surface temperature prediction
Global warming has been a serious concern of contemporary scientific interest over the past couple of centuries. Sea surface temperatures (SST) is one of the most important phenomenon having profound effects on global climate. Deep LSTM networks [23] have been proposed to predict daily SST. Researchers have claimed the proposed LSTM based model to be highly promising for short and mid term predictions.
2.5LSTM for photo-voltaic energy prediction
Photo-voltaic (PV) systems convert sunlight into usable source of electricity. PV cells are embedded into power networks all over UK. The output of PV is dependent on local climatic parameters. Researchers have employed LSTM networks [24] to study the dependencies between various climatic conditions and PV energy metrics for a seamless electric grid. LSTM networks have been useful in forecasting the temporal variations of PV power metrics with reasonable accuracy.
2.6GRU for tropical cyclone prediction
Tropical cyclones have devastating effect on life and environment. Meteorologists have analyzed the historical data trends to predict upcoming cyclones, path trajectories, probable damages etc. GRU [25] based networks have been proposed to predict tropical cyclone trajectories as a temporal function of varying climatic parameters. However, the path trajectories of the cyclones also depend on the previous slopes of the path curves in addition to the influence of external climatic parameters. Hence, the use of similar methodology involving CNN networks may yield more accurate results.
2.7Statistical approaches for time series prediction
Various Machine Learning and ARIMA based models [26] have been developed to predict from time series data. The proposed models have proved to be useful in finding meaningful information from large complex datasets with reasonable accuracy.
The present study may have substantial contribution in further enhancing the accuracy of these models by augmenting the non-stationary data with the respective inherent slope patterns. Though, much work have not been done in image domain analysis of time series data, the following subsection (H) highlights a notable work on data transformation to visual domain.
2.8Domain transformation of data for higher accuracy
Transferring learnable features to another domain have yielded better results in cases where the features are not easily interpretable. CNN networks have been well acclaimed [27, 28, 29, 30, 31] for their super-human abilities in analyzing images. The data was transformed [19] from a domain not suitable for learning to a different domain on which CNN networks could be trained. An improvement in classification accuracy was achieved over conventional classification methods by a margin of 10%.
2.9Assisted learning approaches using sparse Bayesian
Assisted learning techniques have been applied using Sparse Bayesian Learning (SBL) [32]. It was possible to achieve less than 6% NMAE in traffic state estimation by applying appropriate kernel matrices based on spatio-temporal correlations, and further pruned using Kalman filters.
3.Methodology
The efficiency of an algorithm depends on the correct selection of features and the data model. In the current scenario, data related to the COVID-19 pandemic have been acquired from various authentic sources and have been further analyzed using AI algorithms.
3.1Deep learning based prediction models for COVID-19 transmission
Deep neural networks have been utilized for analyzing different types of data acquired from various sources. Pearson correlation coefficient [33] have been considered for analyzing the inter-relationship between the different components of the data and discard irrelevant components. The historical data related to the pandemic have been analyzed to predict the data trends for the future. Such predicted results can be particularly useful for decision makers in taking appropriate decisions.
Figure 1.
Recursive LSTM architecture.
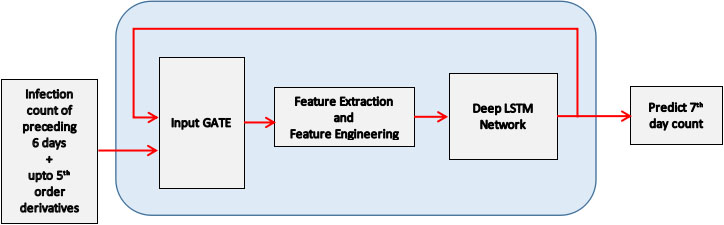
Figure 2.
Recursive GRU architecture.
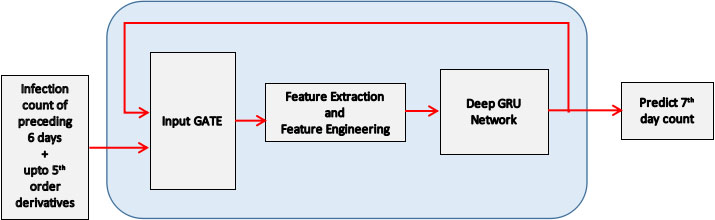
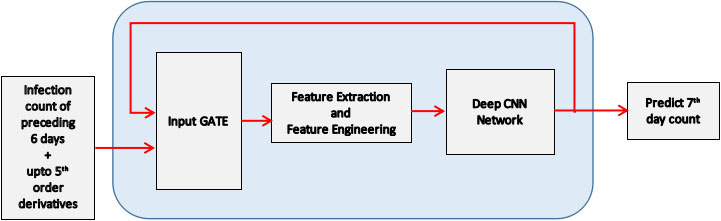
Figure 3.
Recursive CNN architecture.
Traditional artificial neural networks are capable of learning from labeled datasets with a fixed feature size but these traditional feed forward networks suffer from forgetfulness with respect to the data trends learned in the past. RNNs are uniquely designed sequence modelling algorithms with recursive feedback loops that takes the output of the previous time-step to the input of the current time step. RNNs are capable of taking decisions influenced by the past data trends. Specialized recurrent networks such as LSTM [34] and GRU have been selected for analyzing the COVID-19 pandemic datasets to predict the future consequences.
A spatio-temporal LSTM (ST-LSTM) architecture comprising of two LSTM layers having 50 neurons each, with return sequences and 20% dropout have been considered in the present study. The first two ST-LSTM layers with return sequences are followed by a third, non-recurrent ST-LSTM layer consisting of 50 neurons with 20% dropout. The third layer connects to a fully-connected dense layer with a single output neuron. The ST-LSTM architecture can accept the infected count data of the last six days along with upto fifth order derivatives i.e. slope information of the pandemic trend over the last six days to predict the pandemic spread for the following day. A recursive ST-LSTM architecture can pick the predicted data from the previous time steps and recursively feed back to the input of the network for the upcoming prediction step and so on. Figure 1 represents the proposed recursive deep ST-LSTM network.
GRU [35] are a type of advanced RNN with specialized gating mechanisms but has fewer parameters compared to a traditional LSTM architecture. A spatio-temporal GRU (ST-GRU) architecture is comprised of two GRU layers having 50 neurons each with hyperbolic tangent (tanh) activation function and 20% dropout, and return sequences with sigmoid activation function without any dropouts. The first two ST-GRU layers with return sequences are followed by a third, non-recurrent ST-GRU layer consisting of 50 neurons with a softmax activation and 20% dropout. It is connected to a fully-connected dense layer with a single output neuron. The ST-GRU architecture (Fig. 2) can accept the infected count data of the last six days along with upto fifth order derivatives of the pandemic trend to predict the spread for the next day. A similar recursive architecture can accept the predicted data from the previous time steps and recursively feed back to the network for the upcoming prediction steps.
Another family of neural networks, CNN [36], have been acclaimed for their adeptness in pattern analysis. The temporal pandemic data can be transformed into an image pattern by projecting on a 2D plane. A CNN architecture comprising of four convolution layers (9-36-36-81) with a fixed kernel size 6, followed by a fully-connected flattened dense layer having 360 neurons at 10% dropout. The flattened dense layer fully connects to a single output neuron. The CNN model under consideration accepts the infected count of the last six days along with upto fifth order derivatives of the pandemic trend to recursively predict the pandemic spread on a future timeline. Figure 3 represents the recursive deep CNN network under consideration.
3.2Data augmentation to a learnable domain
In the background of the COVID-19 pandemic, the rate of spread in a geographical location depends on the number of people infected. Additionally, the rate of spread of pandemic also depends on other regional parameters such as climatic factors, population density, elderly ratio etc. Pandemic trend datasets having similar characteristics as the COVID-19 are non-stationary in nature due to the temporal variations of one or more of these related characteristics.
Considering the temporal spread of pandemic, let the data be represented by a hypothetical equation
The slope information obtained from the pandemic data along the temporal axis (t) have been augmented for transformation from a less learnable temporal domain to a learning efficient derivative domain for analyzing the domain spectral patterns.
In the present scenario, since the contagious agent is transmittable, higher the population density in a particular region, greater will be the chances of a pandemic spread. Also, due to the genetic variations between the male and female, their individual immunity levels vary greatly. So, sex ratio of a region can also bring about a big difference in the rate of spread of the pandemic. Similar decline of the immunity levels affect both males and females with age and therefore the elderly dependency ratio can impact the spread as well. Additionally, since the pandemic is caused due to a bio-agent, the infectivity as well as the life span of the contagion may vary with the change in climate across the globe. Therefore, historical weather data have also been acquired to investigate any patterns in the pandemic data due to climate change.
3.3Algorithm optimization
Training any deep neural network is data dependent and the training efficiency relies largely on the training time and the resources used for training. The performance and efficiency of a trained neural network is an optimization problem. There are several hyperparameters based on the individual mathematical formulations and the respective deep learning algorithms can be optimized accordingly. In the current study, optimizers such as the Stochastic gradient descent (SGD), AdaGrad, AdaDelta, RMSProp and Adam have been employed along with a suitable choice of hyperparameters such as the learning rate (LR), decay rate, momentum, regularization, hidden layer size, number of hidden layers etc.
4.Results and discussions
This section discusses the results obtained from initial data analysis and the outcome obtained by processing the acquired datasets using machine learning and deep learning algorithms.
4.1Data collection and pre-processing
Data collected from the different sources [40, 41, 42, 43, 44, 45, 46, 47] comprised of inconsistencies such as missing values and noisy spikes. Since the actual population data, infected count, weather data etc., do not have random fluctuations in reality, the data has been smoothened using a moving average filter of length 3.
Figure 4.
Comparative time series prediction accuracy (100% – MAPE%) of LSTM and GRU.
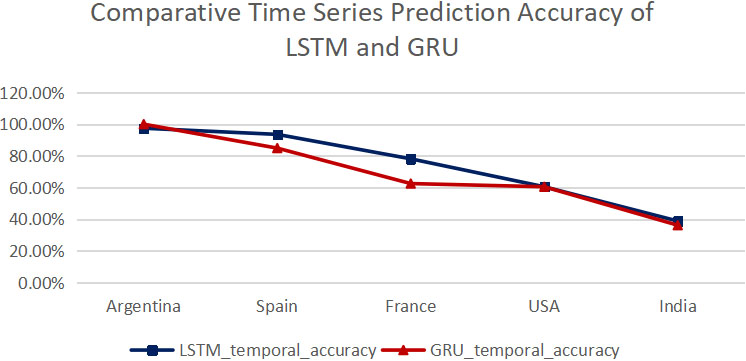
Sequence models like LSTM and GRU are generally used for analyzing time sequence data. Following the same idea, initially, vanilla LSTM and vanilla GRU networks have been employed to analyze the pandemic spreads. These specialized recurrent networks are good at retaining information from historical data. The vanilla networks performed well for countries where the temporal rate of progression of the pandemic is uniform. However, for countries where the underlying features suffered from variations of the embedded characteristics, the prediction accuracy was on the decline for both LSTM and GRU vanilla networks. Figure 4 shows a comparative study of the declining prediction accuracy for several countries using the LSTM and GRU networks.
Figure 5.
Domain converted of time series data.
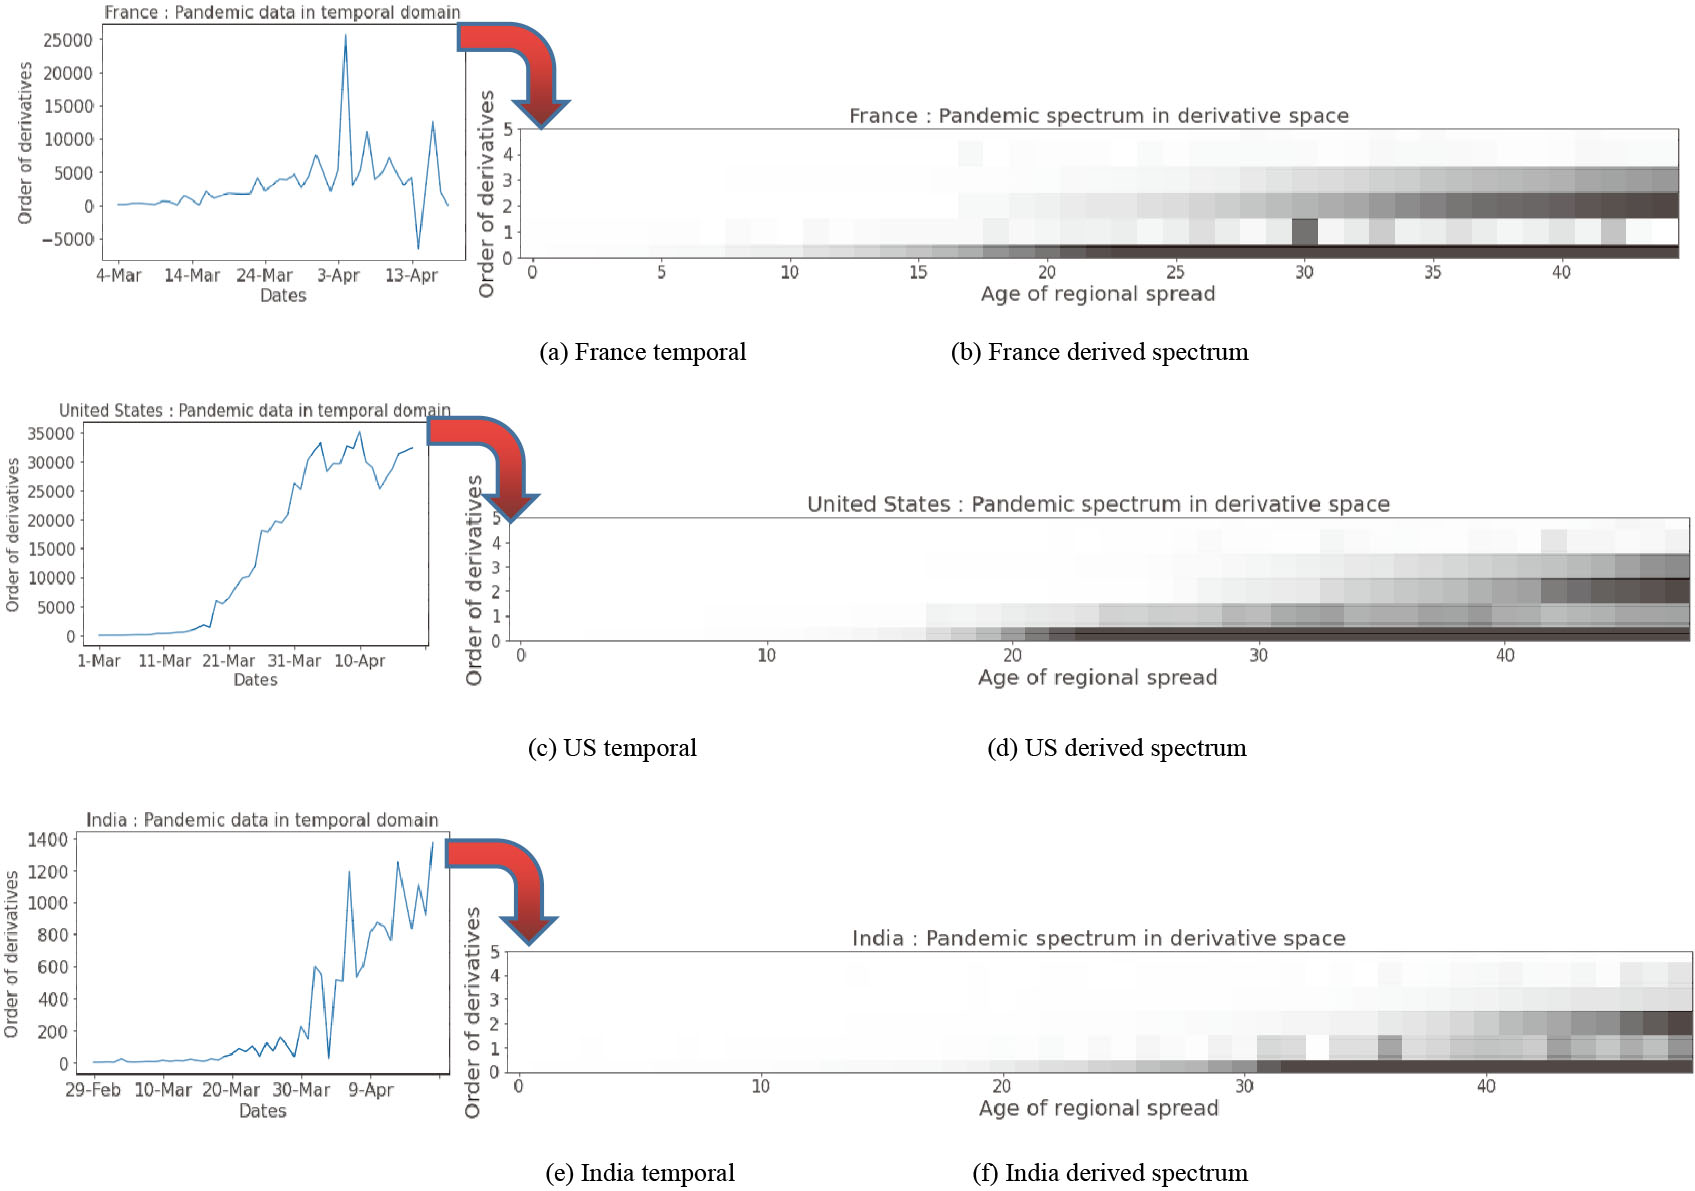
4.2Domain transformation for augmented learning
Since the rate of spread of infection is related to the multiple regional parameters, the daily infection count and the derivatives of the data trend has been derived upto the fifth order to capture the slope variations for further analysis.
Figure 5 shows the domain converted time series data in a derivative domain. The domain transformation in Fig. 5 illustrates how the embedded characteristic features of the pandemic data changes over time. The spectral trends of the preceding six days (Fig. 5) would be analyzed using ST-LSTM, ST-GRU and CNN networks to predict the seventh day infection count which in turn is fed through a recursive loop to the input for the upcoming eighth day and so on. The most optimum performance of the proposed data model can be obtained for short term prediction (upto 2 weeks in advance). Based on the distribution of the pandemic spread, a combination of high, moderate and low impact countries have been selected for data analysis, prediction and validation of the results.
4.3Correlation study
The correlation data in Table 1 shows that in the months from January to April, 2020, the highest temperature in the epicentric regions of India varied from 19
Table 1
Correlation with weather parameters
| Pearson coeff | Temperature | Dew point | Humidity | Wind speed | Pressure | ||||||||||
|---|---|---|---|---|---|---|---|---|---|---|---|---|---|---|---|
| Max | Avg | Min | Max | Avg | Min | Max | Avg | Min | Max | Avg | Min | Max | Avg | Min | |
| Spain | 0.09 | 0.17 | 0.08 | 0.11 | 0.11 | 0.18 | 0.04 | 0.03 | |||||||
| France | 0.41 | 0.32 | 0.07 | 0.13 | 0.19 | 0.25 | |||||||||
| India | 0.79 | 0.76 | 0.66 | 0.34 | 0.32 | 0.23 |
|
| 0.00 | 0.00 | 0.00 | ||||
| Argentina | 0.00 | 0.06 | 0.35 | 0.32 | 0.37 | ||||||||||
Table 2
Optimizer comparison for CNN, ST-LSTM and ST-GRU networks (data of Spain)
| Optimize | CNN | ST-LSTM | ST-GRU | ||||||||||||
|---|---|---|---|---|---|---|---|---|---|---|---|---|---|---|---|
| LR | rho | RMSE | MAE | MAPE in % | LR | rho | RMSE | MAE | MAPE in % | LR | rho | RMSE | MAE | MAPE in % | |
| adam | 0.1 | NA | 47972.3 | 33491.87 | 24.9 | 0.001 | NA | 15694.56 | 14431.13 | 10.74 | 0.1 | NA | 39867.41 | 36540.8 | 27.20 |
| rmsProp | 0.001 | 0.9 | 136594.6 | 69623.47 | 52.04 | 0.001 | 0.9 | 20707.29 | 18903.53 | 14.07 | 0.1 | 0.95 | 35501.47 | 331111.1 | 22.58 |
| adadelta | 0.001 | 0.9 | 6590.28 | 5287.67 | 3.94 | 2 | 0.97 | 10018.65 | 7285.93 | 5.42 | 2 | 0.97 | 30972.14 | 20648.6 | 21.32 |
| adagrad | 0.1 | NA | 144322.04 | 91079.05 | 6.11 | 0.1 | NA | 36775.98 | 33732.87 | 25.11 | 2 | NA | 48592.82 | 44170 | 32.87 |
| adamax | 0.001 | NA | 68669.71 | 42180.6 | 31.99 | 0.1 | NA | 8527.26 | 7991.33 | 5.95 | 0.1 | NA | 34287.55 | 31417.4 | 23.38 |
4.4Algorithm optimization
The proposed CNN, ST-LSTM and ST-GRU algorithms have been optimized using multiple optimizers as presented in Table 2 (data of Spain).
Analyzing the quantitative outcomes in Table 2, it can be observed that each algorithm performs relatively better under some specific optimizer configurations. These configurations have been used for further processing.
4.5Predictions with best optimizer configurations
The algorithms with their individual best optimizer configurations have been employed to study the pandemic spread. Figure 6 shows a qualitative analysis of the CNN, ST-LSTM and ST-GRU prediction accuracies (100% – MAPE%) for some of the selected countries. Experimental evidences (Table 3) show that the proposed methodologies using CNN algorithms give the best results.
The recurrent neural architectures such as the ST-LSTM, ST-GRU retain short term memories of the past trends of the data and the error encountered in these predictions depend on the past experiences. The transmission dynamics of the pandemic being a real life scenario are extremely complicated and changes with time depending on different parametric variations. Therefore studying the past trends using these algorithms, achieved slightly higher prediction errors compared to the more efficient RRCNN which could analyze the latent features embedded in the spectral patterns.
CNN based architectures being comparatively more computation efficient, analyzes the spectral patterns corresponding to the rate of change of these variations over time. It is experimentally observed that the accuracy of these algorithms increased when the first derivative of the pandemic data was added to the data model. Higher order derivatives (upto 5
4.6Restricted recursive CNN
CNN network had been most successful in analyzing the changes in the slopes of different characteristics in the pandemic patterns. However, certain predicted changes in slopes resulted in negative slopes for the transmission dynamics. In reality, the cumulative number of infected can never decrease. Hence, a Restricted Recursive CNN (RRCNN) architecture has been proposed where the predicted values of the network is controlled within an allowed limit. In the present study, the predictions made by the RRCNN is limited to non-negative values only. Over a couple of tests, it is observed that this modified version of the CNN model can minimize the overall error in estimation.
4.7Critical analysis
In the current study, the selection of the most suitable algorithm for the prediction model has also been based on the time of training required for achieving the maximum accuracy. The LSTM and the GRU networks are
Figure 6.
Comparison of RRCNN, ST-LSTM, ST-GRU and CNN predictions across countries [legends: training data (black), validation data (red), predicted data (blue)].
![Comparison of RRCNN, ST-LSTM, ST-GRU and CNN predictions across countries [legends: training data (black), validation data (red), predicted data (blue)].](https://ip.ios.semcs.net:443/media/idt/2022/16-1/idt-16-1-idt200167/idt-16-idt200167-g06a.jpg)
Figure 6.
Continued.
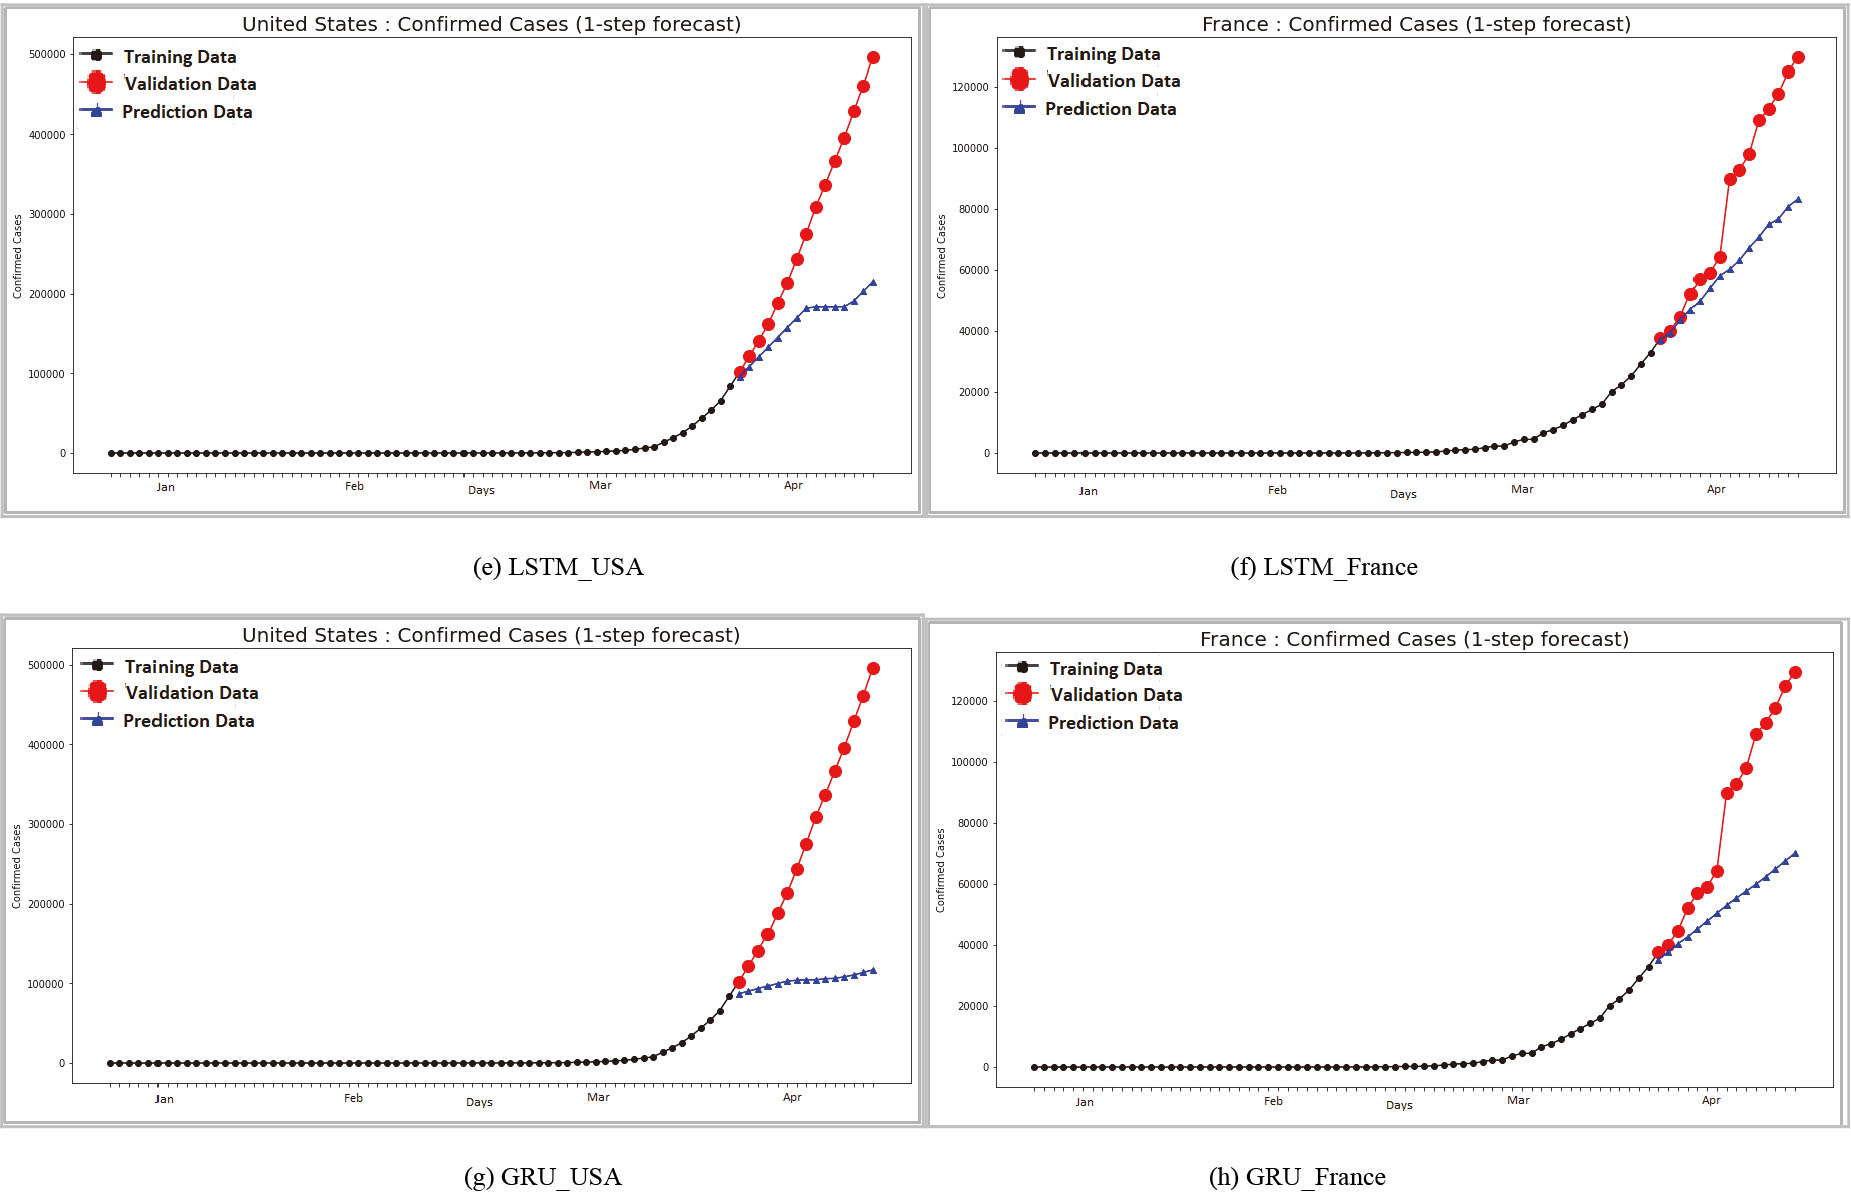
Table 3
| a: Prediction horizon with Error (MAPE%) | ||||
|---|---|---|---|---|
| Prediction horizon | Data | CNN | LSTM | GRU |
| 2 weeks | Spain | 2.13 | 5.42 | 10.40 |
| France | 17.76 | 26.30 | 35.72 | |
| Argentina | 3.07 | 3.6 | 3.41 | |
| USA | 18.67 | 42.11 | 71.94 | |
| India | 37.72 | 61.48 | 63.37 | |
| 10 days | Spain | 1.24 | 3.43 | 12.44 |
| France | 9.51 | 19.05 | 33.44 | |
| Argentina | 3.63 | 4.00 | 4.52 | |
| USA | 21.07 | 33.29 | 50.65 | |
| India | 32.43 | 49.61 | 50.67 | |
| 5 days | Spain | 1.48 | 4.44 | 10.39 |
| France | 7.80 | 6.06 | 17.16 | |
| Argentina | 3.83 | 2.52 | 2.80 | |
| USA | 9.00 | 19.56 | 35.75 | |
| India | 23.67 | 29.79 | 30.09 | |
| 1 day | Spain | 0.32 | 0.12 | 5.28 |
| France | 3.08 | 2.01 | 6.09 | |
| Argentina | 5.92 | 0.27 | 1.38 | |
| USA | 1.38 | 8.59 | 18.90 | |
| India | 6.72 | 2.91 | 2.91 | |
| b: Accuracy (100% – MAPE%) comparison | |||||
|---|---|---|---|---|---|
| Country data | LSTM (%) accuracy | ST-LSTM (%) accuracy | GRU (%) accuracy | ST-GRU (%) accuracy | CNN (%) accuracy |
| Argentina | 97.42 | 96.40 | 99.97 | 96.59 | 96.93 |
| Spain | 93.52 | 94.58 | 84.84 | 89.60 | 97.87 |
| France | 78.08 | 73.70 | 62.44 | 64.28 | 82.24 |
| USA | 60.43 | 57.89 | 60.43 | 28.06 | 81.33 |
| India | 38.77 | 38.52 | 36.14 | 36.63 | 62.58 |
Figure 7a.
Comparative accuracy (100% – MAPE%).
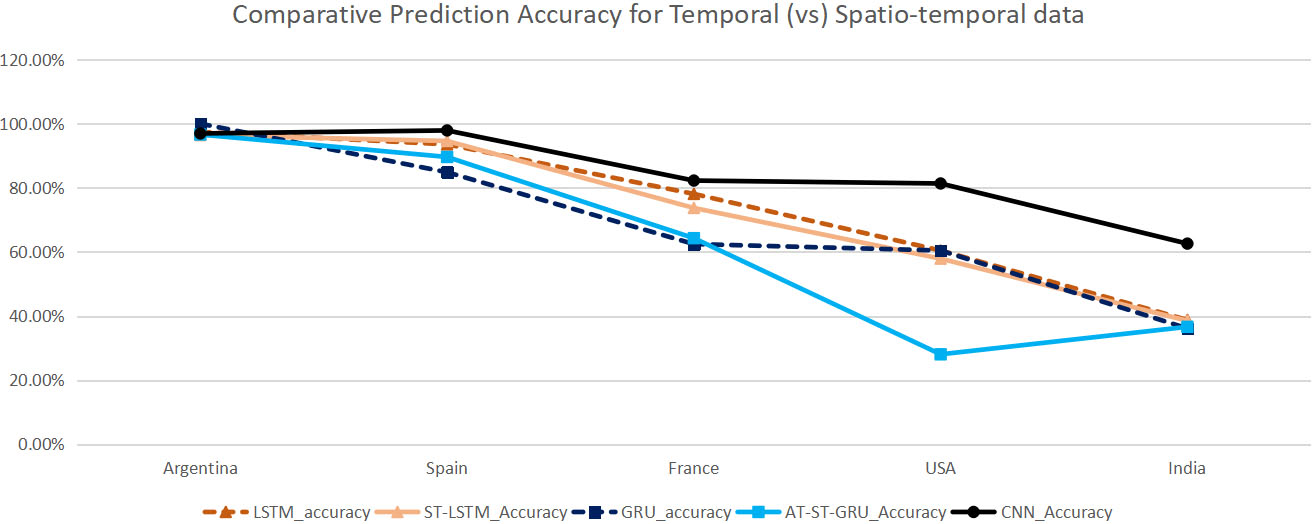
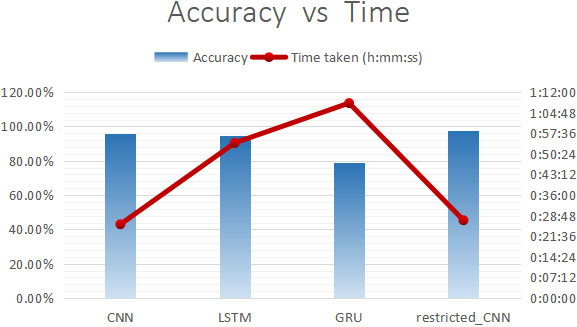
Figure 7a.
Efficiency plot.
computationally expensive owing to the complexity of the mathematical formulations of their respective cell states.
On the contrary, CNN networks are computationally much cheaper and are capable of analyzing complex image patterns in lesser time. Table 3 quantitatively compares the prediction accuracies (100% – MAPE%) achieved by the chosen algorithms. It can be observed from the given results that the RRCNN model has achieved the closest estimation of the transmission dynamics on an average in comparison to the other models. The prediction accuracies for the chosen algorithms have been plotted under the Fig. 7.
As per the existing literature, RNN variants such as an LSTM or a GRU based prediction model has given far better predictions in analyzing time sequenced data. The same has been corroborated by various scientists that the short term memory preserved in the LSTM and GRU cell states help these networks in generating predictions under the influence of recently observed data trends. On the other hand, CNN networks have been reported to perform extremely well on image patterns due to the presence of convolution kernels which can particularly focus on smaller regions within the image and relay the edge related information for a specific spatial distribution through sampling layers.
The models have been trained on the pandemic data and the prediction of the trained models were validated against the following 1 day’s pandemic count. Table 3a compares the validation and predicted errors (MAPE%). As per literature, the LSTM model performs best (lowest error) compared to the other algorithms on the validation data i.e. in predicting 1 day following the training data. However, as the prediction horizon increases, changes in the embedded characteristics causes variations of the transmission dynamics. The LSTM and the GRU algorithms gradually end up with higher prediction errors over larger intervals. However, the CNN algorithms could be observed to analyze the changes in the embedded patterns reasonably well and achieved lower prediction error in the longer term. Table 3b compares the experimental results of regular vanilla LSTM and GRU with the proposed methodology using ST-LSTM, ST-GRU and CNN algorithms. As per experimental observations, the CNN algorithm was able to outperform the LSTM and GRU variants.
In the present scenario, the pandemic data has been acquired as a time sequenced data as in Fig. 8. Now, let the original time sequenced data be represented by
Figure 8.
Sequence to pattern.
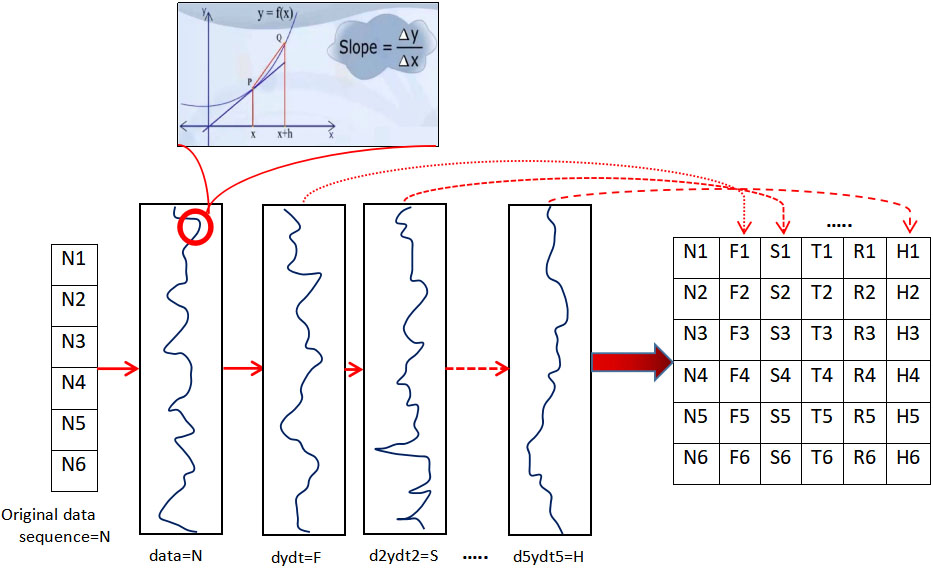
Depending on their individual computational capacity, each algorithm has its own time requirements for analyzing and training depending on the size of the training data. For the current study, each of the chosen algorithms were exposed to a bootstrapped training dataset consisting of 10k records. Figure 7 shows a comparative study of the accuracy (100% – MAPE%) achieved on the given training dataset against the training time necessities of the respective algorithms.
The histograms in Fig. 7b represent the highest percentage accuracy that could be achieved by an individual algorithm while a plotted line drawn over the histograms demonstrates the respective time efficiencies. It can also be inferred from Fig. 7b, that the CNN based algorithms have the maximum computational capacity and are capable of handling large training datasets in almost 60% lesser time taken by GRU units and nearly 50% lesser time consumed by LSTM cells.
Optimizers such as Adam, Rmsprop, Adadelta, Adagrad and Adamax have been utilized for optimizing the hyperparameters for maximum accuracy with minimum effort. Structurally, the LSTM and GRU models have been tuned for the optimum number of recurrent layers, dense layers with fully connected units, the allowable dropouts and activation functions at each layer. Similarly, the CNN based algorithm have been fine tuned for the most optimum number of Convolutional layers, count of filters, size of kernels, stride size of the filters, max-pooling layers, dense layers with fully connected units, the allowable dropouts and activation at each layer.
The stochastic gradient descent (SGD) is the most commonly used optimizer where a learning rate can be optimized for evaluating the optimum step-size for adjusting the internal neural weights. A momentum hyperparameter accelerates or dampens the vanilla gradient descent in the relevant directions. However, a fixed step-size limits the overall efficiency leading to the essence of more advanced optimizers.
A computationally efficient Adam optimizer built on the adaptive estimation of moments have been utilized for fine tuning the decay rates upto the first and second order moments. A modified version of the Adam optimizer, i.e. an Adamax, known for occasionally delivering superior outcomes over Adam have also been tested in the current scenario. Another prominent Rmsprop optimizer has been utilized for computing a square-root of the moving average of the gradients and then divide the gradient with the square root to control the step-size of the oscillations more precisely along the entire training process. A different adaptive gradient descent optimizer, AdaGrad, takes an initial learning rate and suitably adapts it based on the frequency of the parameter updates during the training process. Each of these optimizers achieved limited accuracy improvements on the chosen algorithms. However, one of the main reasons behind the limitations could be related to the continual decay of the learning rates throughout the training. To overcome the limitations, a more robust AdaDelta optimizer have been utilized for limiting the change of learning rates upto a small window of gradient updates immediately preceding adaptation instance. Since the rate of change of the variations of the different factors influencing the pandemic spread changes with time, the imposed restriction upto the immediately preceding time window proved to be most effective.
5.Conclusion
The research work mainly focuses on devising a domain transformation aided performance boosting mechanism in a resource constrained environment for non-stationary data analysis. COVID-19 transmission has been observed to bear unique relations with temperature and humidity within a specified limit. The daily infection count when transformed to a derivative spectrum through higher order derivatives, substantially enhanced the prediction accuracy of the models. The recursive data model was accurate and generic in providing short term future predictions upto a couple of weeks with reasonable accuracy. Similar approach could be undertaken for all time series predictive analytics in future for enhancing the prediction accuracies with smaller volume of training data. The prediction accuracy can be further studied using different hybrid models which forms the future scope of this work.
References
[1] | [online] Who.int. Pneumonia of unknown cause – China. (2020) . Available from: https://www.who.int/csr/don/05-january-2020-pneumonia-of-unkown-cause-china/en/. |
[2] | [online] En.wikipedia.org. COVID-19 pandemic – Wikipedia. (2020) . Available from: https://en.wikipedia.org/wiki/COVID-19_pandemic. |
[3] | [online] The Centre for Evidence-Based Medicine. Coronaviruses – a general introduction – The Centre for Evidence-Based Medicine. (2020) . Available from: https://www.cebm.net/covid-19/coronaviruses-a-general-introduction/. |
[4] | Almeida J, et al. Virology: Coronaviruses. Nature. (1968) ; 220: (5168): 650–650. |
[5] | Shereen MA, Khan S, Kazmi A, Bashir N, Siddique R. COVID-19 infection: Emergence, transmission, and characteristics of human coronaviruses. Journal of Advanced Research. (2020) Jul 1; 24: : 91–8. |
[6] | Goldsmith CS, Tatti KM, Ksiazek TG, Rollin PE, Comer JA, Lee WW, Rota PA, Bankamp B, Bellini WJ, Zaki SR. Ultrastructural characterization of SARS coronavirus. Emerging Infectious Diseases. (2004) Feb; 10: (2): 320. |
[7] | Chang CK, Hou MH, Chang CF, Hsiao CD, Huang TH. The SARS coronavirus nucleocapsid protein – forms and functions. Antiviral Research. (2014) Mar 1; 103: : 39–50. |
[8] | Belouzard S, Millet JK, Licitra BN, Whittaker GR. Mechanisms of coronavirus cell entry mediated by the viral spike protein. Viruses. (2012) Jun; 4: (6): 1011–33. |
[9] | Fehr AR, Perlman S. Coronaviruses: an overview of their replication and pathogenesis. Coronaviruses. (2015) : 1–23. |
[10] | Harapan H, Itoh N, Yufika A, Winardi W, Keam S, Te H, Megawati D, Hayati Z, Wagner AL, Mudatsir M. Coronavirus disease 2019 (COVID-19): A literature review. Journal of Infection and Public Health. (2020) May 1; 13: (5): 667–73. |
[11] | Vaishya R, Javaid M, Khan IH, Haleem A. Artificial Intelligence (AI) applications for COVID-19 pandemic. Diabetes & Metabolic Syndrome: Clinical Research & Reviews. (2020) Jul 1; 14: (4): 337–9. |
[12] | Ting DS, Carin L, Dzau V, Wong TY. Digital technology and COVID-19. Nature Medicine. (2020) Apr; 26: (4): 459–61. |
[13] | Rao AS, Vazquez JA. Identification of COVID-19 can be quicker through artificial intelligence framework using a mobile phone – based survey when cities and towns are under quarantine. Infection Control & Hospital Epidemiology. (2020) Jul; 41: (7): 826–30. |
[14] | Martin A, Nateqi J, Gruarin S, Munsch N, Abdarahmane I, Zobel M, Knapp B. An artificial intelligence-based first-line defence against COVID-19: Digitally screening citizens for risks via a chatbot. Scientific Reports. (2020) Nov 4; 10: (1): 1–7. |
[15] | Boccaletti S, Ditto W, Mindlin G, Atangana A. Modeling and forecasting of epidemic spreading: The case of Covid-19 and beyond. Chaos, Solitons, and Fractals. (2020) Jun; 135: : 109794. |
[16] | Ivanov D. Predicting the impacts of epidemic outbreaks on global supply chains: A simulation-based analysis on the coronavirus outbreak (COVID-19/SARS-CoV-2) case. Transportation Research Part E: Logistics and Transportation Review. (2020) Apr 1; 136: : 101922. |
[17] | Tomar A, Gupta N. Prediction for the spread of COVID-19 in India and effectiveness of preventive measures. Science of The Total Environment. (2020) Aug 1; 728: : 138762. |
[18] | Huang CJ, Chen YH, Ma Y, Kuo PH. Multiple-input deep convolutional neural network model for covid-19 forecasting in china. MedRxiv. (2020) Jan 1. |
[19] | Singh MS, Pondenkandath V, Zhou B, Lukowicz P, Liwickit M. Transforming sensor data to the image domain for deep learning – An application to footstep detection. In 2017 International Joint Conference on Neural Networks (IJCNN). IEEE. (2017) May 14. pp. 2665–2672. |
[20] | Roondiwala M, Patel H, Varma S. Predicting stock prices using LSTM. International Journal of Science and Research (IJSR). (2017) ; 6: (4): 1754–1756. |
[21] | Hathurusingha C, Abdelhamid N, Airehrour D. Forecasting Models Based on Data Analytics for Predicting Rice Price Volatility: A Case Study of the Sri Lankan Rice Market. Journal of Information & Knowledge Management. (2019) Mar 21; 18: (01): 1950006. |
[22] | Wu YX, Wu QB, Zhu JQ. Data-driven wind speed forecasting using deep feature extraction and LSTM. IET Renewable Power Generation. (2019) Aug 29; 13: (12): 2062–9. |
[23] | Xiao C, Chen N, Hu C, Wang K, Gong J, Chen Z. Short and mid-term sea surface temperature prediction using time-series satellite data and LSTM-AdaBoost combination approach. Remote Sensing of Environment. (2019) Nov 1; 233: : 111358. |
[24] | Arshi S, Zhang L, Strachan R. Prediction using LSTM networks. In 2019 International Joint Conference on Neural Networks (IJCNN). IEEE. (2019) Jul 14. pp. 1–8. |
[25] | Dong P, Lian J, Zhang Y. A novel data-driven approach for tropical cyclone tracks prediction based on Granger causality and GRU. In 2019 IEEE International Conference on Service Operations and Logistics, and Informatics (SOLI). IEEE. (2019) Nov 6. pp. 70–75. |
[26] | Babu CN, Sure P. Partitioning and interpolation based hybrid ARIMA – ANN model for time series forecasting. Sādhanā. (2016) Jul; 41: (7): 695–706. |
[27] | Linsley JW, Linsley DA, Lamstein J, Ryan G, Shah K, Castello NA, Oza V, Kalra J, Wang S, Tokuno Z, Javaherian A. Superhuman cell death detection with biomarker-optimized neural networks. Science Advances. (2021) Dec 10; 7: (50): eabf8142. |
[28] | Shin HC, Roth HR, Gao M, Lu L, Xu Z, Nogues I, Yao J, Mollura D, Summers RM. Deep convolutional neural networks for computer-aided detection: CNN architectures, dataset characteristics and transfer learning. IEEE Transactions on Medical Imaging. (2016) Feb 11; 35: (5): 1285–98. |
[29] | Shi F, Wang J, Shi J, Wu Z, Wang Q, Tang Z, He K, Shi Y, Shen D. Review of artificial intelligence techniques in imaging data acquisition, segmentation, and diagnosis for COVID-19. IEEE Reviews in Biomedical Engineering. (2020) Apr 16; 14: : 4–15. |
[30] | Helwan A, El-Fakhri G, Sasani H, Uzun Ozsahin D. Deep networks in identifying CT brain hemorrhage. Journal of Intelligent & Fuzzy Systems. (2018) Jan 1; 35: (2): 2215–28. |
[31] | Cao Y, Xu Z, Feng J, Jin C, Han X, Wu H, Shi H. Longitudinal assessment of COVID-19 using a deep learning-based quantitative CT pipeline: Illustration of two cases. Radiology: Cardiothoracic Imaging. (2020) Mar 23; 2: (2): e200082. |
[32] | Babu CN, Sure P, Bhuma CM. Sparse Bayesian learning assisted approaches for road network traffic state estimation. IEEE Transactions on Intelligent Transportation Systems. (2020) Feb 7; 22: (3): 1733–41. |
[33] | Archdeacon TJ. Correlation and regression analysis: A historian’s guide. Univ of Wisconsin Press; (1994) . |
[34] | Coto-Jiménez M, Goddard-Close J. LSTM deep neural networks postfiltering for enhancing synthetic voices. International Journal of Pattern Recognition and Artificial Intelligence. (2018) Jan 14; 32: (01): 1860008. |
[35] | Sachin S, Tripathi A, Mahajan N, Aggarwal S, Nagrath P. Sentiment analysis using gated recurrent neural networks. SN Computer Science. (2020) Mar; 1: (2): 1–3. |
[36] | O’Shea K, Nash R. An introduction to convolutional neural networks. arXiv preprint arXiv:1511.08458. (2015) Nov 26. |
[37] | [online] RMS Error. (2020) . Available from: http://statweb.stanford.edu/∼susan/courses/s60/split/node60.html. |
[38] | Fürnkranz, et al. Mean Absolute Error. Encyclopedia of Machine Learning. (2011) : 652–652. |
[39] | Khair U, Fahmi H, Al Hakim S, Rahim R. Forecasting error calculation with mean absolute deviation and mean absolute percentage error. In Journal of Physics: Conference Series. IOP Publishing. Vol. 930, No. 1, (2017) Dec 1. p. 012002. |
[40] | [online] Historical Estimates Of World Population. The United States Census Bureau. (2020) . Available from: https://www.census.gov/data/tables/time-series/demo/International-programs/historical-est-worldpop.html. |
[41] | [online] Population, female (% of total population) |
[42] | [online] Dependency Ratios – The World Factbook – Central Intelligence Agency. (2020) . Available from: https://www.cia.gov/library/publications/the-world-factbook/fields/342.html#AF. |
[43] | [online] World Population Prospects – Population Division – United Nations. (2020) . Available from: https://population.un.org/wpp/. |
[44] | [online] Countries By Sex Ratio 2019 – Statisticstimes.Com. (2020) . Available from: http://statisticstimes.com/demographics/countries-by-sex-ratio.php. |
[45] | Wenham C, Smith J, Morgan R. COVID-19: The gendered impacts of the outbreak. The Lancet. (2020) ; 395: (10227): 846–848. |
[46] | [online] World Demographics 2020 (Population, Age, Sex, Trends) – Worldometer. (2020) . Available from: https://www.worldometers.info/demographics/world-demographics/. |
[47] | [online] World Population by Country. Worldpopulationreview.com. (2020) . Available from: https://worldpopulationreview.com. |


