
Quantified Products: Case Studies, Features and their Design Implications
Abstract
In many industrial sectors, the current digitalization trend resulted in new products and services that exploit the potential of built-in sensors, actuators, and control systems. The business models related to these products and services usually are data-driven and integrated into digital ecosystems. Quantified products (QP) are a new product category that exploits data of individual product instances and fleets of instances. A quantified product is a product whose instances collect data about themselves that can be measured or, by design, leave traces of data. The QP design has to consider what dependencies exist between the actual product, services related to the product, and the digital ecosystem of the services. By investigating three industrial case studies, the paper contributes to a better understanding of typical features of QP and the implications of these features for the design of products and services. For this purpose, we combine the analysis of features of QP potentially affecting design with an analysis of dependencies between features. The main contributions of the work are (1) three case studies describing QP design and development, (2) a set of recurring features of QPs derived from the cases, and (3) a feature model capturing design dependencies of these features.
1Introduction
In many industrial areas, the last decade has been characterized by substantial efforts to digitize business further and operational processes, products, and services. The resulting digital transformation of enterprises, industry, and service sectors has resulted in innovative products and services that build upon new digital technologies, for example, cyber-physical systems (Horvath and Gerritsen, 2012), machine learning (Russell, 2010), smart systems (Fortino et al., 2015), visual analytics (Keim et al., 2008) and high-speed near real-time data transfer on mobile networks (5G) (Farahani et al., 2017). Innovative products and services require new kinds of business models, many of them exploiting data from product operations and data-driven services (Hansen and Bøgh, 2021). Examples are product-as-a-service, functionality-on-demand or pay-per-use for physical products (Alaluss et al., 2022). In this context, the specific focus of this paper is on innovations related to physical products as data sources and the basis of new data-driven services. Many physical products, like manufacturing machinery, medical devices, vehicles, traffic systems, or household devices, are equipped with control units, sensors, and actuators that capture and provide access to relevant data.
In earlier work, we introduced the concept of “quantified products” (Sandkuhl, 2022): a quantified product (QP) is a product whose instances collect data about themselves that can be measured, or, by design, leave traces of data (cf. Section 3.1). QPs have certain technological features and enable new business models that can be considered as a sub-category of smart connected products (see Section 3). An example of a quantified product that attracted much research are quantified vehicles (Kaiser et al., 2021) who collect data about the technical status and performance of the vehicle in conjunction with driver activity and even the vehicle’s environment.
QP’s design, development and operation has been found to include three tightly inter-related aspects: physical product, data-driven services, and ecosystem management (Sandkuhl et al., 2022). The physical product is the device, machine, vehicle or any other tangible product that provides and collects data. Data-driven services are processing the data for internal purposes of the enterprise developing or operating the QP and for services offered by external parties. An ecosystem is a group of enterprises or actors that share and offer data and services for mutual benefits, usually also by sharing a platform. This paper aims to contribute to a better understanding of the dependencies between product, service, and ecosystem when it comes to design decisions. When designing a physical product, decisions have to be made what features and functionalities the product should provide. Features and functionalities typically depend on customer requirements, application scenarios, operation and production requirements. In the context of a quantified product, the requirements resulting from data-driven services and possibly the ecosystems these services are integrated in also require certain features and affect design decisions. The research question for this paper is: In the context of QP development, what are relevant features to consider during design and what dependencies between these features must be taken into account?
For this purpose, we combine the analysis of features of QP potentially affecting design with an analysis of QP case studies for validating the suitability and pertinence of the features. Main contributions of this paper are (1) three case studies illustrating QP design and development, (2) a set of features of QPs derived from the cases and (3) a feature model showing design dependencies between these features.
Section 2 describes our research approach. Section 3 covers the theoretical background and related work. Section 4 presents the first industrial case study to motivate our work and to identify features affecting QP design. The validation of the features is the subject of Section 5 and the feature model visualizing dependencies are described in Section 6. Section 8 draws conclusions.
2Research Method
Designing and evaluating technological and methodical support for quantified product design and development is the long-term objective of a research project that forms the frame for work presented in this paper. The overall research project follows the paradigm of design science research (Hevner et al., 2004). The five stages of design science research are problem explication, requirement definition, design and development of the design artefact, demonstration, and evaluation. This paper concerns the requirement analysis and first steps toward designing the envisioned artefact, a methodology integrating the life-cycles of a physical product, data-driven services and ecosystem services. This paper builds on previous research on QP life-cycle management (Sandkuhl et al., 2022) and addresses the research question presented in the introduction.
The research approach used is a combination of literature study, descriptive case study and conceptual modelling. The motivation for using case studies as empirical basis is the lack of scientific work on quantified products. In previous work (Sandkuhl et al., 2022), we conducted a literature analysis on the state of research on QP design and development with the conclusion that hardly any work exists in the field. An additional literature search in Scopus and IEEE Xplore when preparing this paper confirmed this finding (see Section 3.1) and is summarized in Section 3. Thus, we had to explore the practice of QP implementation in enterprises active in this field, i.e. in case studies of real-world environments designing and developing QP. Based on the research question presented in the introduction, we identified industrial case studies suitable to shed light on QP development.
The analysis of the first case study follows the intention to investigate what features in this case were relevant to QP design. The identified features were examined from the perspective if they potentially could also be applicable in other QP application domains and cases, i.e. the intention was to capture candidates for general QP features. In the next step, two more case studies are used to validate the identified features and lead to a second version of the set of features. By modelling the identified features with the technique of feature modelling, we intend to structure them and to contribute to finding dependencies between features. According to Yin (1998), the case studies in this paper are exploratory, as they are used to explore development approaches and design features of QP.
3Background and Related Work
This section summarizes the theoretical background from variability modelling (Section 3.2) and data-driven services and ecosystems (Section 3.3). Furthermore, an overview of the existing work in the field of QP is given in Section 3.1.
3.1Quantified Products (QP)
3.1.1Related Work and Literature Analysis
Work on QP is related to various research streams of the past years with a focus on turning data into value. Service sectors start to “collect data on everything” (Mayer-Schönberger and Cukier, 2013) to achieve automation and increased efficiency. Smart connected products (SCP) are not only a category of IoT products but also represent a business model category characterized by IT- and data-based services (Porter and Heppelmann, 2014). In individual lifestyle, the term Quantified Self (Swan, 2013) is used when people collect physical and bio-metric data to “quantify” their life. The term quantified vehicle adapts this idea for the automotive industry as a complete ecosystem for using data for data-driven services (Kaiser, 2022).
To identify additional related work, we performed a literature analysis in Scopus and IEEE Xplore. The fulltext search for the keyword “quantified product” in Scopus returned 37 hits. 31 papers were from chemistry, biology or physics and used the term QP for the quantification of volume, weight or costs of products or chemical reactions, and thus, are not relevant for our research.
Dadvandipour and Oliaei (2018) use the term QP only in the abstract without mentioning or explaining it in the research paper. Persad et al. (2011) also use the term QP but as part of the composite term “quantified product demand”, i.e. with focus on quantified demand. Similarly, Campbell (1998) uses QP as part of quantified product improvement. Both are not relevant for our work.
The only relevant papers found in Scopus are our own previous work (Sandkuhl et al., 2022; Sandkuhl, 2022) and a paper about product modularization (Lennartsson et al., 2022) referring to our work as part of future work discussion.
In IEEE Xplore, the search returned 9 results, but all of them were not relevant because they use “quantified product” as part of composite terms, such as quantified product requirement (Ebert and Riegg, 1991), quantified product metrics (Baisch et al., 1995) or quantified product feature matrix (John et al., 2006).
3.1.2Definition of the Term
Products are often equipped with sensors, e.g. for capturing geographic positions, energy consumption, usage profiles or other information pertinent to operation and maintenance of the product. Such products also collect additional data, which could be of interest for third parties. For instance, suppliers want to know how their components are used in the field (Farahani et al., 2017). In case of cars, insurance companies want to know how the insured person drives and traffic planners, how roads are used by vehicles (Kong et al., 2018).
For the definition of the term quantified product, we differentiate between product data traditionally captured during product life-cycle management (PLM) and data collected by manufactured individual copies of a product, which we refer to as product instances: “A Quantified Product is a product whose instances collect data about themselves that can be measured, or, by design, leave traces of data, including operational, physical, behavioural, or environmental information for the purpose of data analysis and (optional) data sharing and services” (Sandkuhl, 2022).
Often enterprises quantify the products by (a) collecting data not only from a single device but the entire fleet of products operating in the field, (b) using this data for monitoring and real-time control in a management system for the fleet, and (c) offering aggregated data on marketplaces.
Implementation of QP is accompanied by substantial changes in the companies’ PLM of QP, as different kinds of products and their life-cycles have to be coordinated:
• The actual physical product,
• Services built upon data from connected physical products and services exploiting data from a complete fleet of products,
• Data-driven services using the fleet data for ecosystem services, possibly in combination with other services.
3.2Variability Modelling and Feature Models
The general purpose of variability modelling is to analyse and capture variants and potential configurations of complex systems in model-based representations to be used in system development and application processes. A substantial part of the research on variability modelling has its origin in work on software product lines and generative programming (Czarnecki et al., 2002). Complex software and information systems usually offer a large set of functions and features to their users, but cause a challenge to their developers: how to restrict the systems’ complexity to achieve maintainability and at the same time provide high flexibility for the users with many possible variants in different application contexts? Variability modelling offers a contribution to control the number of variants of systems by capturing and visualizing commonalities and dependencies between features and between the components providing feature implementations.
Variability modelling has been frequently used for more than 20 years in the field of complex software systems, embedded systems and technical systems. Among the established variability modelling approaches, feature models are considered as particularly suitable for QPs. A feature is a “distinctive and user-visible aspect, quality, or characteristic of a software system or systems” (Kang et al., 1990). The purpose of a feature model is to capture, structure and visualize the commonality and variability of a domain or a set of products. Commonalities are the properties of products shared among all the products in a set, placing the products in the same category or family. Variability are the elements of the products that differentiate and show the configuration options, choices and variation points that are possible between variants of the product, aimed to satisfy customer needs and requirements. The variability and commonality are modelled as features and organized into a hierarchy of features and sub-features, sometimes called feature tree, in the feature model. The hierarchy and other properties of the feature model are visualized in a feature diagram. Feature diagrams express the relation between features with the relation types mandatory, optional, alternative, required and mutually-exclusive.
Fig. 1
Comparison of Kang’s visual notation and the notation used in this paper.
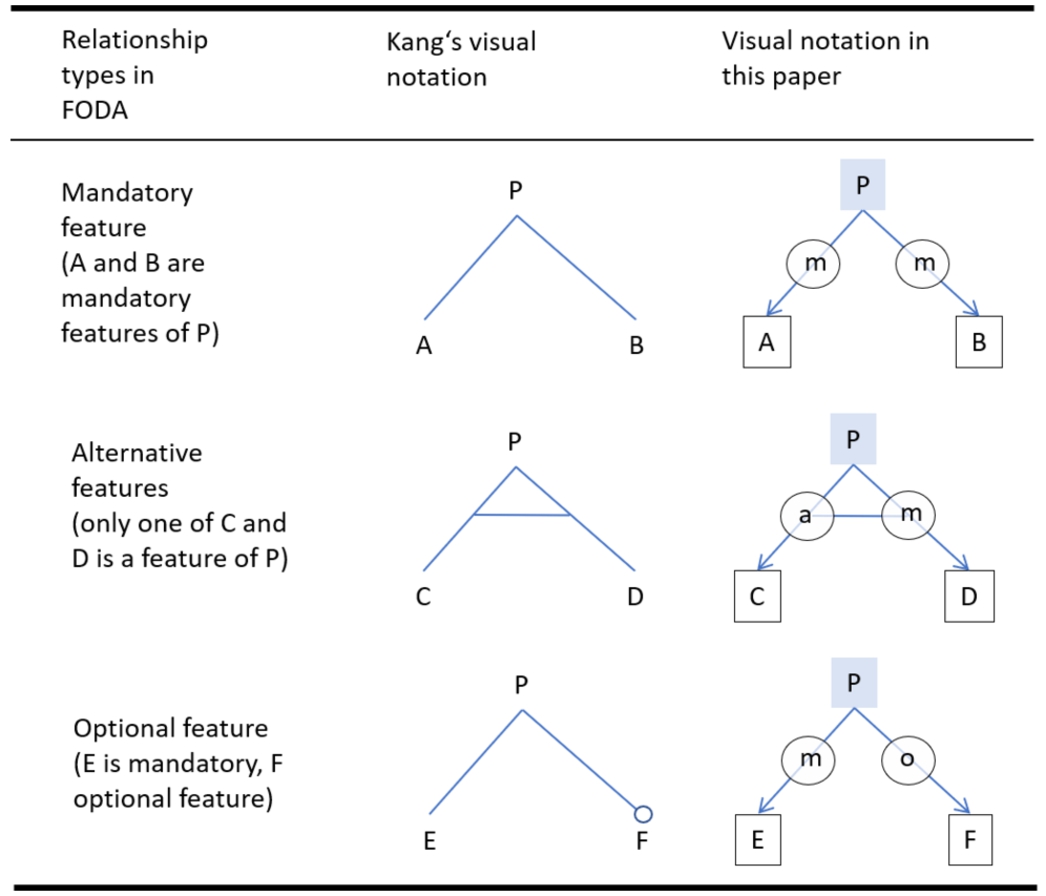
Different methodical approaches in the field and the exact syntax of feature diagrams were analysed and compared in Thörn and Sandkuhl (2009) and an overview to methods for feature model development is provided in Li et al. (2020). Both papers show that feature modelling notations and approaches mostly were specialized for certain application fields, i.e. there is no generally accepted feature model development method. In our work, we use the meta-model of Kang’s approach (Kang et al., 1990), but adapted the visual notation slightly. The reason for adapting the visual notation is that the practitioners in the use cases presented in Sections 4 to 6 had problems to remember the meaning of different relations before the changes were made. Figure 1 shows the differences in the two visual notations.
3.3Data-Driven Services and Ecosystems
In general, the exploitation of data and data analysis functionality is expected to create new ways for growth and competitive advantage in many industrial and service sectors (Davenport and Harris, 2017). The growing availability of data opens opportunities for the implementation of entirely new services (Manyika et al., 2011), data-driven digital business models and options for data analytics and visualization (Hartmann et al., 2016). In the context of quantified products, both, data generated by instances of products or by the entire product fleet, can be exploited using data-driven services. This includes sensor data and other operational that have their own value on data marketplaces and for data-focused business models. From the QP instance or fleet, the data is transmitted to a data-driven service, for example via an IoT platform. Data marketplaces provide an infrastructure for trading data and data-related services, i.e. data-driven services often use or operate on data marketplaces. Data marketplaces are expected to have high impact on data-related business activities that transform the data economy (Spiekermann, 2019). A digital ecosystem “is an interdependent group of enterprises, people and/or things that share standardized digital platforms for a mutually beneficial purpose” (Gartner Group, 2017). Data marketplaces, providers of data-driven services and operators of QP can be considered as members of a data-driven service ecosystems using context and sensor data originating from QPs in an integrated manner for enabling new business models. Such ecosystems and their operational models are shaped by organizations involved in infrastructure provision, service delivery and platform operation and their mutual relationships.
4Case Study A: Robot Lawn Mower
4.1Case Study Description
The first case study (Case A) that was the basis for exploring features of QP is related to a research project conducted with a producer of garden and outdoor products for both, the consumer and business market (robotic and conventional lawn mowers, various sizes and types of chainsaws, garden tractors, watering systems, trimmers, and other devices). The business line “outdoor products” was the main partner in this research project that focused on the shift from products without connectivity to the Internet to smart and networked ones (QPs). The core objective of the business line was to develop an ecosystem of products and services that extends the conventional (physical) product lines and offers a common application architecture and service infrastructure. The ecosystem is meant to include different profit centres of the business line with their services and products, as well as product and services from external companies.
Fig. 2
Simplified IT and service architecture of Case A. As the figure is part of the case study data, we kept the original way of depicting the architecture, which uses a visualization similar to UML package diagrams. The figure shows different layers (e.g. ecosystem services, domain-specific services, etc.) of the architecture with their modules and the dependencies between the layers. This shows the overall structure and organization of the architecture.
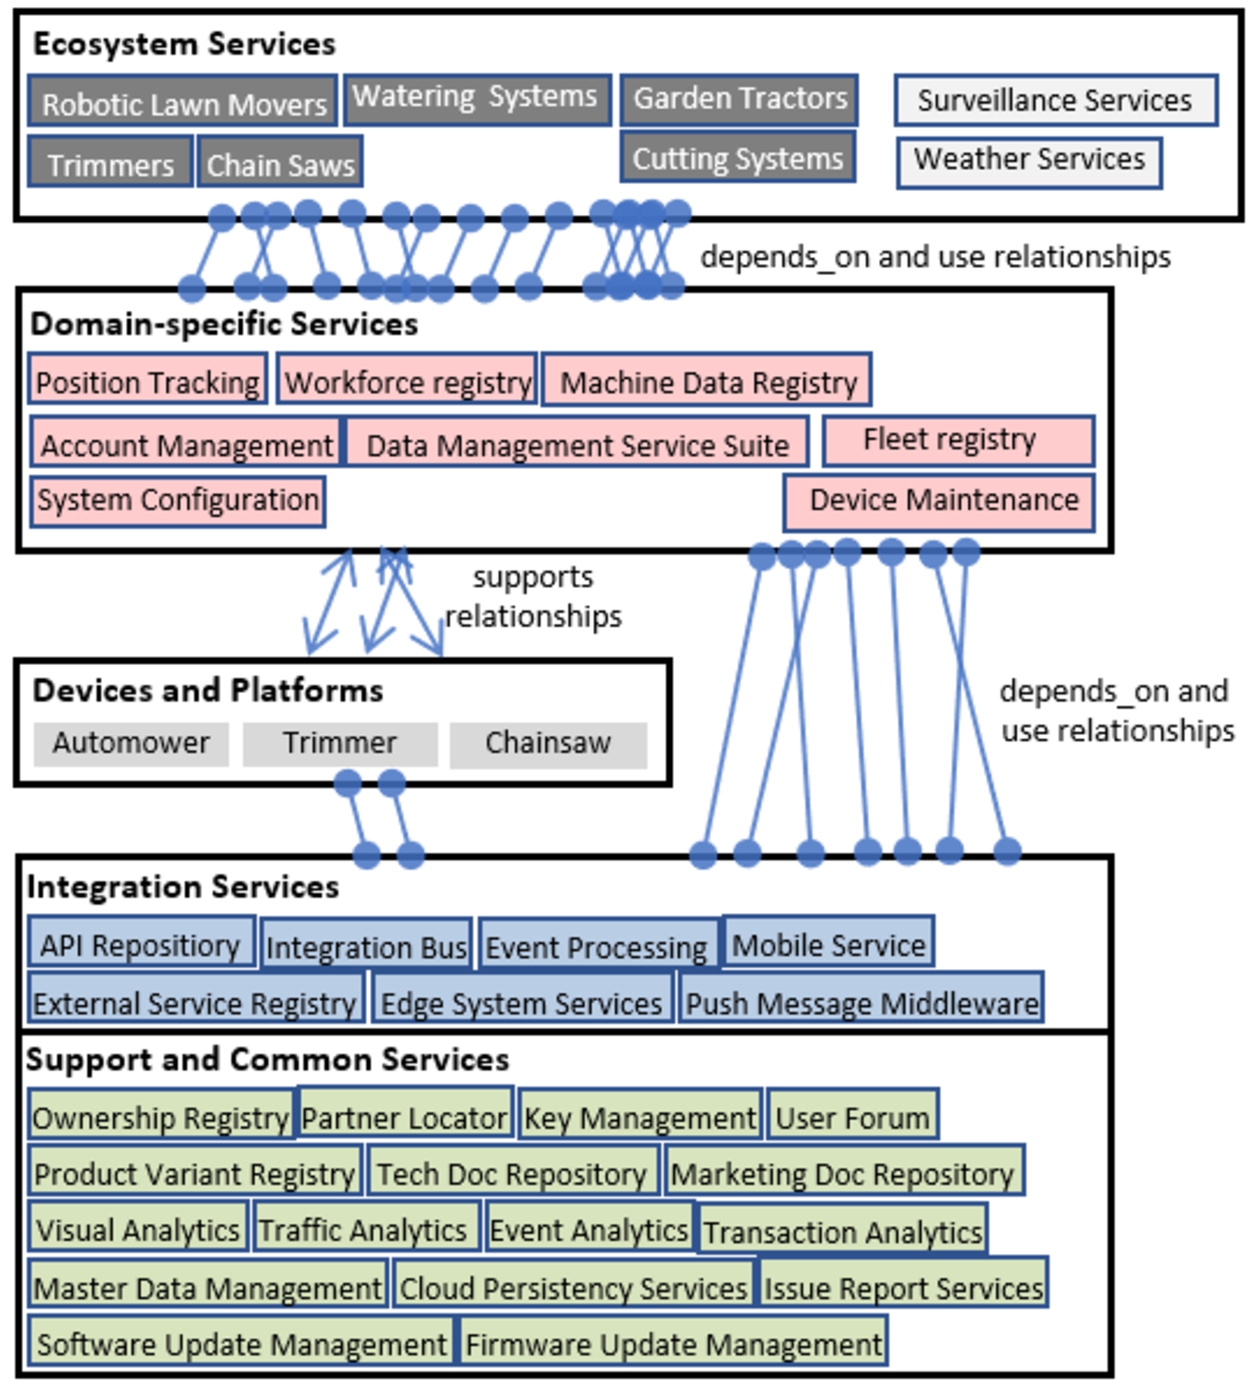
The products of the business line in most cases have built-in electronic components implementing and networking and communication capabilities; these components connect to a common services architecture and infrastructure (see Fig. 2). The embedded electronic systems and infrastructure services primarily are controlling the mechatronic components in the product, but also used for collecting data when the product is in operation. The data includes, e.g. status of mechatronic components, performance data and service information, or information from the product’s operational environment. The tight integration with the service infrastructure allows for usage statistics, information about maintenance requirements, license information or location data to the vendor’s back-office and/or to the product owner.
The QPs in focus of our investigation is the robotic lawn mower (RLM). RLMs are connected via a wireless connection to a base station installed at the point of operation. The base station in turn is connected to the Internet and the service infrastructure of the case company for providing software updates, license information and other services to the RLM. When installed at end-consumers, the RLM also provides operation data to the base station (see Table 1 for examples). When installed at business customers, e.g. garden service providers or housing companies, RLMs often are operated as a fleet of robotic mowers, often in combination with additional products, such as trimmers or garden tractors. Fleet management functionality also offers the possibility to equip workers with devices that capture their working hours and routes. The case company provides fleet management services and the required data collection through a cloud-based platform for their business customers. Examples for services included in fleet management are operating, supervising and planning garden and park maintenance.
Table 1
Data collected by the QP robotic lawn mower.
| Attribute | Accuracy/Resolution | Description |
| GPS coordinate | 16 ft accuracy, recorded every minute | Position of the mower robot |
| Start and end of charging | Day, hour, minute, seconds | Charging duration |
| Start and end of operation | Day, hour, minute, seconds | Operation time |
| Battery level | Recorded every 10 seconds | Battery level development |
| Speed of the mower | in km/h, recorded every 10 seconds | Speed differs based on quality requirements of the cutting |
| Rotation speed of cutting device | Rotations/second with same energy supply | Basis for calculation resistance of grass type |
| Vertical and horizontal position | Recorded every 10 seconds | Basis for calculation of “pollution” of grass area |
| External temperature | Recorded every 30 minutes | Basis for control if device is used in conditions not permitted |
| External humidity level | Recorded every 30 minutes | Basis for control if device is used in conditions not permitted |
As most of the garden products require similar networking and communication functions, the QP development process included planning, design and implementation of reusable components, services and infrastructure features for both, the QP and fleet management back-office. In this context, an essential design step was the alignment between different product lines in terms of communication and networking functionality, common services, and service registry and provision. The resulting IT and service architecture is depicted in Fig. 1. The infrastructure services are labelled support and common services. Another design step concerned the definition of integration services and domain-specific services as part of the ecosystem architecture. Integration services provide a kind of middleware for fleets of devices, like RLMs, with service registry, event processing, push message services, API and pathways to common services and other integration possibilities. Using the integration services, services for specific domains, such as workforce management, account management or fleet management, were implemented. Ecosystem services provide data processing or information supply to other services in the ecosystem using the domain-specific and common services.
As for the data-driven services, there are device-level services (e.g. theft protection of RLM for end consumer) and fleet-level services (e.g. fleet management for housing companies), and additional shared services for other divisions of the enterprise. This creates an enterprise-internal ecosystem approach.
4.2Feature Identification
4.2.1Procedure for Feature Identification
For the feature identification, we used a procedural approach with four steps that is depicted in Fig. 3:
• Scoping: the objective of scoping is to exactly define the application field or system under consideration. The scope of the feature model specifies the boundaries of the feature model, i.e. what parts of a system or product are included and what parts are not.
• Feature identification: this step has the task to identify and elaborate the actual features essential to the scope defined in the first step. It includes
– enumerating what features, i.e. distinctive user-visible characteristics (see Section 3.2), the system or product under consideration offers. This information can be obtained from product documentation, interviews with product managers or workshops with relevant stakeholders in enterprises
– developing each feature with a short text or reference to the product documentation to make it explicit
– document if a feature is always available in a product (mandatory) or optional
• feature data analysis: the task of this step is to capture for all identified features what data is required to realize each feature. This information helps to identify dependencies between features and required functionality and components for the implementation.
• Feature dependency analysis: the objective of this task is to identify and document the dependencies between the features. This includes what features are prerequisites for what other features, if features are alternatives to each other and what features require the same data. The latter indicates potential dependencies implied by components implementing the features
Fig. 3
Procedural approach for feature identification.
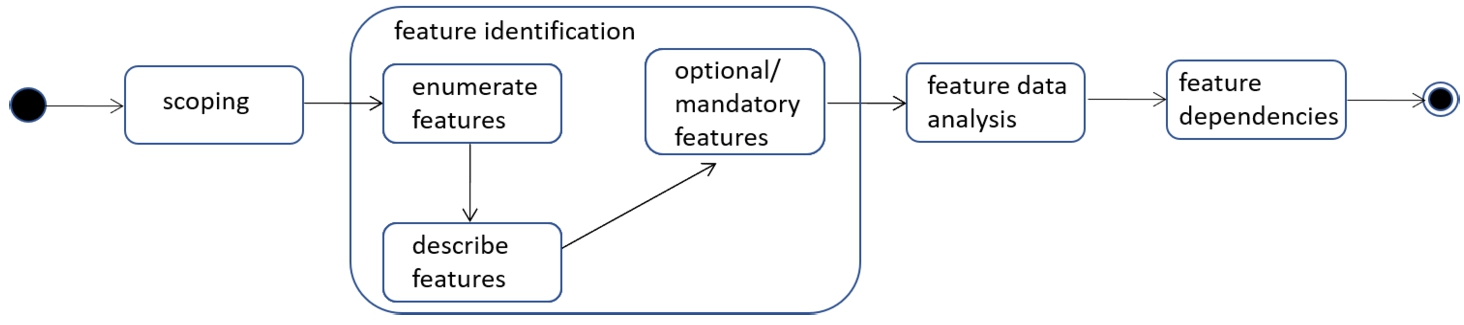
Table 2 provides definitions of important terms used when describing the feature identification procedure.
Table 2
Definition of terms in the context of feature identification.
| Term | Definition |
| Feature | A set F of features characterize every quantified product. Each feature is a distinct user-visible characteristic of the QP. The set |
| Feature dependency | Two types of dependency are distinguished. A feature is an alternative to another feature if the two features are elements of the same set in |
| Feature data | For each feature exists a set of data required to implement the feature. Data is captured in type/value pairs called attributes. |
| QP variant | The features of a QP characterize each variant product of the QP, i.e. variants differ from each other by the set of features they offer. There are no two variants with the same set of features. Every variant offers all features included in |
This approach is based on the work of Kang et al. (1990) on feature modelling and, for the first steps, refinements inspired by a procedural approach by Noy and McGuinness (2001) for ontology development exploiting the similarities between concept identification in ontologies and feature identification in feature model development.
4.2.2Feature Identification in the Case Study
Following the procedural approach described in the previous section and using the material in the RLM case, we started by defining the scope. The scope is the features of the QP (i.e. the RLM) offered to the product’s users. The “users” in this case are the enterprise-internal managers of the QP and the external end-consumers and business customer groups expected to use the QP, data from the QP or services built upon QP data. In feature identification, these features were written down with their names and a short description of their meaning.
In feature data analysis, we have to differentiate between data collected during operation of individual product instances (device-level services), and data-driven services on aggregation level across all instances (fleet-level services). Device-level services address the target groups of operators or owners of the device, whereas fleet-level services also encompass data-driven services for third parties. The latter often abstract from the device-level and offer aggregations, combination or selection of data. On device-level, information can be captured regarding the actual device (like battery level, energy consumption of certain components, mowing speed) and regarding the “context” of the device (like temperature, weather conditions or the terrain). The context information also is of interest on fleet level and for some third-party services.
In the last step, we documented the dependencies between features visible in the previous steps and the inter-relations between implicated by data. Table 3 summarizes the identified features on device-level, fleet-level and data-driven service level.
Table 3
Identifiedfeatures of QP.
| Device-level | Fleet-level | Service-level |
| Access to real-time information of individual device [RTID] | Access to real-time information aggregated for fleet [RTF] | Definition of services tailored to application domain |
| Recording of information during operations [RDOP] | Recording of fleet information during operations [RFOP] | Fleet and device-level visualization of recorded data |
| Configure what information to be captured (real-time or recorded) [CDIC] | Configure fleet information to be captured (real-time or recorded) [CFIC] | Fleet and device-level visualization of real-time data |
| Modify sensors on device [MSD] | Access to context information aggregated for fleet [ACIF] | Fleet and device-level visualization of context data |
| Access to context information [ACID] | Recording of context information [RCIF] | Provision of real-time information from specified devices or fleets for a specified set of features |
| Recording of context information [RCID] | Provision of real-time information from specified devices for a defined set of features [PDIF] | Provision of historic information from specified devices or fleets for a specified set of features |
Table 4
Relevance of data for different feature levels in Case A.
| Feature | |||
| Attribute (from Table1) | Device level | Fleet level | Service level |
| GPS coordinate | yes | yes | yes |
| Start and end of charging | yes | yes | no |
| Start and end of operation | yes | yes | yes |
| Battery level | yes | yes | no |
| Speed of the mower | yes | yes | no |
| Rotation speed of cutting device | yes | yes | no |
| Vertical and horizontal position | no | yes | no |
| External temperature | no | yes | yes |
| External humidity level | no | yes | yes |
Table 4 shows the relevance of the data collected by the RBL (see Table 1) for the features on different levels as implemented in Case A. If the data is directly used for realizing a feature, we marked this as “yes”. Data about the technical status (e.g. battery status, speed, rotation) is highly relevant for the device level. Data about the context (temperature and humidity) and performance (operation time) are relevant for the service level. All data is relevant for the fleet level, as fleet operators are interested in both, technical device status, performance and context.
5Case Study B: Air Conditioning and Clean-Room Technologies
The content of this section is the description of a second industrial QP case. The main purpose is to validate the QP features resulting from case study A, modify the set of features if required, and investigate the implications of the feature set on QP design. Section 5.1 contains a brief introduction to case study B; Section 5.2 focuses on validation of the features.
5.1Case Study Description
The industrial application field of the second QP case study (Case B) are air conditioning technologies (ACT), which are also used for implementing clean-rooms. The company under consideration, a medium-sized enterprise from the North of Germany, designs, constructs, installs, operates and maintains large ACT facilities. For the purpose of energy optimization and as a precondition for predictive maintenance, more sensors and control systems have to be installed in ACT facilities and connected to a data network. The resulting Internet-of-Things solutions provide the basis for offering new business services, as, for example, in the area of energy optimization. Inspections of ACT facilities in public buildings, shopping centres and hospitals revealed significant deviations of the expected (planned) energy consumption and the real consumption. The case company decided for the installation of additional sensors in air handling units to analyse the reasons for this over-consumption. The direct and indirect operational processes of air handling units cannot be managed in an optimal and energy-efficient way without processing of substantial amounts of data in an intelligent way.
The QP in case study B is supposed to provide diagnosis support for the energy consumption and potential optimizations in air handling units and also for the operation and maintenance processes of the case study company. This requires processing of substantial amounts of time-series data from different sources in each ACT facility under supervision. The technical solution for QP operation has to be integrated with the case company’s work processes and organizational structures to support new types of business services.
ACT facilities combine various technical devices into a control flow that together provide the required AC functionality. Devices typically included in AC facilities are heating or cooling elements, ventilators, air filters, recuperators and humidifiers. Some devices, like ventilators or recuperators, are already equipped with sensors for capturing relevant data, like, e.g. energy consumption, temperature, or revolutions; other devices usually have no sensors or do not provide the required information and have to be equipped with additional sensors. On facility-level, the data collected is evaluated to determine energy consumption, operational anomalies or error situations.
AC facilities can be categorized according to their intended behaviour and functionality. The categories often correspond to the kind of building they were designed for and are installed in. Relevant ACT groups for the case company are manufacturing buildings, hospitals, shopping malls and university of high school buildings. For all AC facilities in a certain group, evaluation of the collected information on facility-level is expected to be relevant in planning and operations of future facilities, for example, for dimension planning, i.e. determining on the required performance level.
5.2Feature Identification
When identifying the features required in case study B, we followed the same steps as for case study A (Section 4.2). Comparing the two cases, the first observation is that the features in Case B also can be sorted into levels, but the levels have to be named differently if we follow the terminology used by the companies in their different application domains: the device-level in Case A corresponds to the facility-level in Case B. Furthermore, the fleet-level in Case A corresponds to the group-level in Case B. To normalize the terminology in an application-independent way, we propose to use “product instance level” (instead of device or facility) and “product class level” (instead of fleet or group). On product instance level and on product class-level, all features from case study A also are relevant for case study B, which is illustrated in Tables 5 and 6. On service level, the comparison is not yet possible as the implementation in Case B is ongoing.
Table 5
Product instance-level feature comparison.
| ID in Table2 | Feature | Application in Case A | Application in Case B |
| RTID | Access to real-time information of individual device | GPS position of RLM for anti-theft protection | Energy consumption of ventilation for anomaly detection |
| RDOP | Recording of information during operations | Energy consumption and other values for predictive maintenance | Air flow, temperatures and other values for predictive maintenance |
| CDIC | Configure what information to be captured (real-time or recorded) | Adapt to differences of customer types | Adapt to differences of ACT type |
| MSD | Modify sensors on device | Finer granularity for professional product group | Lower resolution for ACT with modern control units |
| ACID | Access to context information | Temperature, weather, terrain | Outdoor temperature |
| RCID | Recording of context information | Analysis of energy consumption of ACT in different terrains | Analysis of energy consumption of ACT in outdoor temperature conditions |
Table 6
Product class level feature comparison.
| ID in Table2 | Feature | Application example in Case A | Application example in Case B |
| RTIF | Access to real-time information aggregated for all instances | Visualization of geographic distribution of automowers and trajectories | Visualization of operational state of facilities (normal, error, unknown, …) |
| RFOP | Recording of product class information during operations | Average downtime of product instances and causes for productivity analysis | Differences of energy consumption depending on application domain of product |
| CFIC | Configure product class information to be captured (real-time or recorded) | Adapt to differences of customer types | Adapt to differences of ACT type |
| ACIF | Access to context information for product class | Development of service offerings for specific terrains | Development of configuration variations for changed utilization conditions |
| RCIF | Recording of context information | Terrain differences for instances in fleet and effect on productivity | Outdoor temperature differences and effect on energy consumption depending on ACT configuration |
6Implications of Features on QP design
The implementation of a feature requires distinct technical functionality on product instance or product class level. On product instance level, the implementation of this functionality can affect the weight, material, size or components to be used in the product and, asd a consequence, has to be taken into account during the design phase of the physical product development. In this paper, we will focus on the components only, not on all design parameters.
Usually, there is no one to one match between a single feature or a set of features and the component implementing it. A feature might require various technical functionalities implemented by different components; components might also depend on each other. For the two case studies, we started from the common set of features and analysed how these features were technically implemented in the cases. The basis for the analysis was the case material (see Sections 4 and 5), which in Case B had to be complemented with information gathered in an interview with the QP designer. We found components in both cases with similar or even identical functionality, but completely different implementation. An example is the communication unit allowing for transmitting data from product instances to the cloud. In case study A there is a WIFI module connecting to the base station and in case study B there is a LoRaWAN module for connecting the ACT facility with the cloud. As the term “component” usually is associated with a concrete implementation, we use the term “building block” instead. Building blocks are providing a defined functionality, possibly in different variants, contributing to implement features.
Fig. 4
Feature model excerpt.
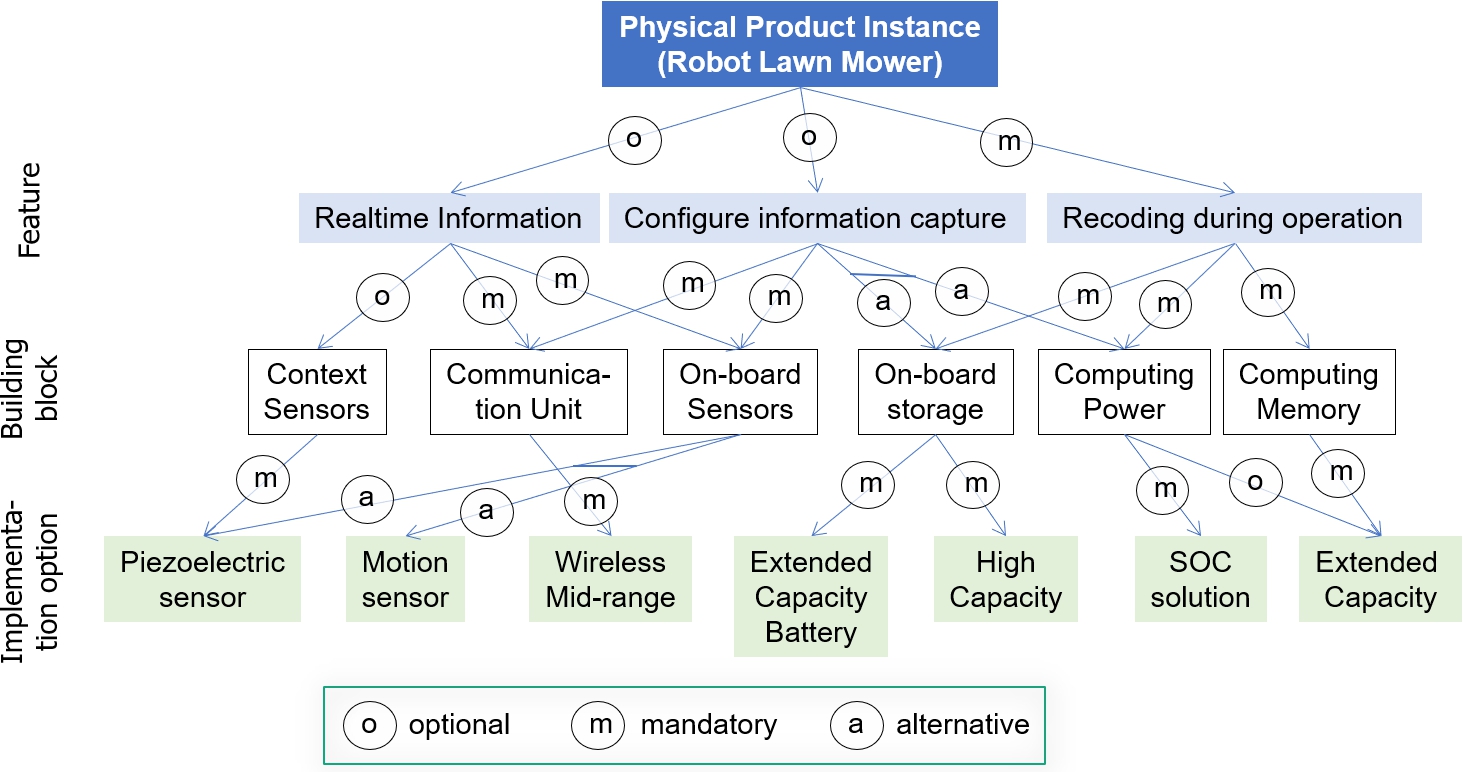
Our analysis resulted in a feature model identifying the relationship between features (blue boxes) and building blocks (white boxes) and the dependencies between building blocks (see Fig. 4). And it also resulted in a list of building blocks common for both cases with their required implementation options (see Table 7). The terminology used in the feature model and the list of building blocks is summarised in Table 8 and extends the definition in Table 2.
Table 7
Building blocks for implementing QP features.
| No. | Building bock | Implementation options |
| 1 | On-board sensors | Fixed set; fixed + configurable set; dynamic set |
| 2 | Context sensors | Depending on required functionality. Example: temperature, position, other connected devices |
| 3 | Communication unit | Cable-based interface; wireless, low range; wireless, high range |
| 4 | On-board sensor integration approach | Wireless; internal bus; direct (system on chip) |
| 5 | On-board sensor information computing | Adaptive; fixed; none |
| 6 | Battery constraints | High capacity; extended capacity; regular capacity |
| 7 | Reliability of sensors | High (double sensors); normal |
| 8 | On-board computing memory | (defined in storage size) |
| 9 | On-board storage capacity | (defined in storage size) |
| 10 | Heartbeat required | Yes/no |
| 11 | Firmware update | Yes/no |
| 12 | On-board computing power | (defined in performance metrics’, e.g. MIPS) |
Table 8
Definition of terms in the context of feature implementation.
| Term | Definition |
| Building block | A set B of building blocks is used to implement the features of a quantified product. Building blocks are reusable across product variants and capture feature data. |
| Feature – building block relations | For each feature |
| Implementation option | A set I of implementation options is available to configure building blocks for specific requirements of features or the QP. Implementation options often are related to technical components, such as sensors, memory units, computing devices or actuators. |
| Implementation option – building block relations | For each building block |
| Building block variant | The implementation options of a building block lead to building block variants. Building block variants differ from each other by the set of implementation options they use. There are no two variants with the same set of implementation options. Every variant of a building block |
7Case Study C: Pumps as a Service
The objective of the third case study is to investigate to what extent the feature model and the identified building blocks also are valid beyond Case A and Case B. For this purpose, we will first introduce the case study company and its QP (Section 7.1) and then discuss the validity of the feature model (Section 7.2).
7.1Case Study Description
The third case study concerns a medium-sized manufacturer of pumping devices and technologies for use in industrial environments (e.g. pumps for ships or sewage pumps for factories) and in the public sector (pumps in flood protection or public swimming pools). The largest share of the company’s turnover comes from selling actual pumps, facilities with several integrated pumps and control systems, and the installation and maintenance of these pumps and facilities, which in some geographic regions is done in cooperation with business partners. The company decided to explore the use of IoT technologies in combination with the established product portfolio to explore new service opportunities and business models.
In the company’s product management department, the development of a “black-box datalink” component was started that allowed for the integration of sensors into pumping devices and the transmission of information from the device to the back-office. Together with an extension of the control device in the pump, this is meant to turn the device into a smart connected pump that can be monitored and controlled from a remote desktop. The black-box datalink transfers the captured data and stores them in a time-series database in the company’s cloud. Examples of relevant information captured are the energy consumption of the device, alerts about malfunctions, the volume of fluid pumped, and the speed of pumping, which helps to detect the status of the built-in filters. One of the business models facilitated by this smart product extension is “pumping as a service”. Pumping as a service aims at selling the functionality of the pump instead of the pump as a physical device which would lead to a service agreement where the company is paid for pumped cubic metres or hours of pumping. For this, the company needs full control over the operation of individual pumps that can be integrated into a dashboard displaying all “pumping as a service” devices for a specific customer. Many municipalities or industrial customers operate a number of pumps, i.e. there is the need for considering fleet-level or product-class level features similar to Cases A and B.
7.2Feature Model Evaluation
As a first step of evaluating the feature model and building block, we analysed if the QP features discovered in Case A and B were also valid in Case C. The feature identification followed the same steps as for Cases A and B (Sections 4.2 and 5.2). As a result, we were all able to confirm that all features on product instance, product class and service level identified in the previous cases also are visible in Case C. It has to be noted that information about the external context of the device (e.g. weather, temperature or terrain) does not have the same importance for Case C as for Cases A and B. Only for pumps for specific application fields, like pumps used in outdoor environments, for example, in flood protection, this context information is essential. However, this still makes the features for recording context information or access to this information relevant.
The second step was to investigate (1) the building blocks required for implementing the features and (2) the variants of the building blocks. All building blocks identified in Cases A and B are also required for Case C with the exception of the battery constraints. All devices and facilities for pumping in Case C have to be equipped with an external power supply which makes a battery superfluous. Case C also requires new variants of the building blocks, for example, sensors for volume measurement or an industry PC as a platform for computing power.
Fig. 5
Feature model excerpt for QP pump.
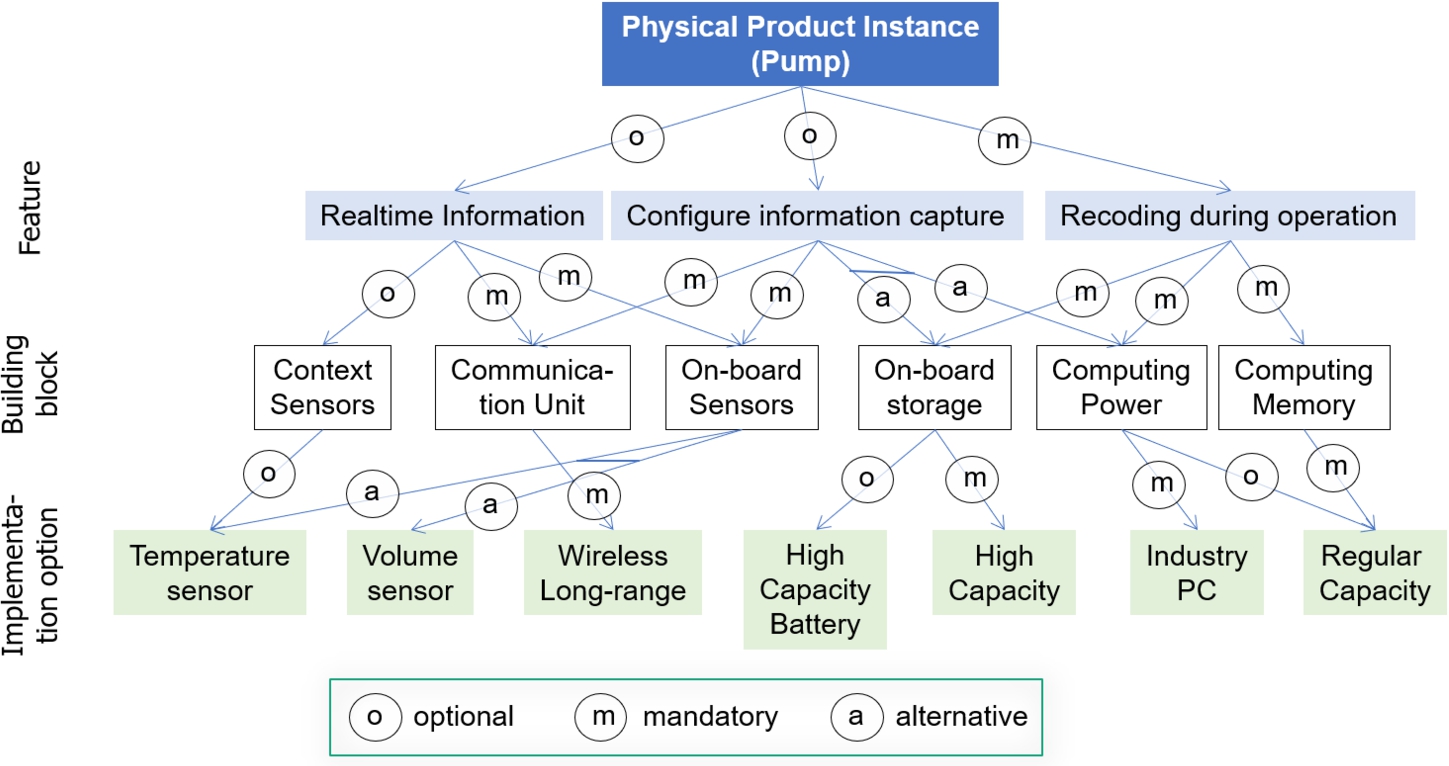
Figure 5 shows an excerpt of the feature model for the QP pump in Case C. In order to allow for a comparison of the feature model of Case A, we selected the same portion of the model for the figure. There are no changes on the feature layer in the model, as all features of the QP in Case A are also relevant for Case C. The same is true for the building blocks, i.e. the same building blocks can also be used to implement the features in Case C. Changes are visible on the variant level, as, for example, a different context sensor (temperature instead of motion), which no longer is mandatory for the device but optional.
8Summary
The paper aimed at contributing to the field of QP by analysing features of QP, the implications of these features for product design, and the dependencies between features and building blocks for their implementation. We identified such building blocks for the physical products and prepared future work in this direction addressing the product class level and the data-driven service level. The current research design mainly focuses on qualitative research by investigating the phenomenon of quantitative products in real-world cases.
The biggest limitation of our work is the empirical basis in only three case studies. Although the case studies were carefully selected to represent the construct under investigation, QP features and design, we cannot assume completeness or general applicability of our results. Future research will have to address this shortcoming by conducting more case studies and empirical research.
Future work will also extend the scope of our research to building blocks of services, features of ecosystems and integration of the QP building blocks with more traditional building blocks of physical products. In this paper, we identified features on service level but did not investigate the building blocks required to realize these features in service architecture. This topic has been excluded from this work, as the empirical basis will have to be the enterprise architecture and IT-service management of an enterprise. This aspect has only been covered in one of the case studies, i.e. we will need to extend the data collection in the other two cases. Furthermore, features of ecosystems have not been addressed in our work at all. Future work in this area will have to include an analysis of differences and commonalities of QP-oriented ecosystems with the general structures of digital ecosystems, for example, when it comes to ecosystem roles, value creation and business models.
Most physical products have some kind of architecture, component structure, or system/sub-system structure. The identification of building blocks in this paper focused on the QP-specific building blocks. For products without any connectivity and digital control units, these building block are explicit “add-ons” in the architecture, but for smart connected products they can be implemented as extension in the functionality of existing building blocks. A more systematic investigation of the impact of QP on traditional product architectures is required in future work.
Acknowledgements
Two of the case studies presented in this research paper were conducted in cooperation with other researchers with the intention to share the resulting material. The author would like to thank them for their excellent cooperation, in particular Ulf Seigerroth from Jönköping University (Sweden) and Achim Reiz and Benjamin Nast from Rostock University (Germany).
References
1 | Alaluss, M., Drechsler, C., Kurth, R., Mauersberger, A., Ihlenfeldt, S., Marré, M., Labs, R. ((2022) ). Usage-based leasing of complex manufacturing systems: a method to transform current ownership-based into pay-per-use business models. Procedia CIRP, 107: , 1238–1244. |
2 | Baisch, E., Bleile, T., Belschner, R. ((1995) ). A neural fuzzy system to evaluate software development productivity. In: 1995 IEEE International Conference on Systems, Man and Cybernetics. Intelligent Systems for the 21st Century, Vol. 5: , pp. 4603–46085. https://doi.org/10.1109/ICSMC.1995.538521. |
3 | Campbell, R.M. (1998). Analysis-When and When Not. SAE Technical Papers 982011. https://doi.org/10.4271/982011. https://www.scopus.com/inward/record.uri?eid=2-s2.0-85072452142&doi=10.4271%2f982011&partnerID=40&md5=54bb7eb76ed9cb46d0f27e3c60a4681b. |
4 | Czarnecki, K., Østerbye, K., Völter, M. ((2002) ). Generative programming. In: Object-Oriented Technology, ECOOP 2002 Workshops and Posters, pp. 15–29. |
5 | Dadvandipour, S., Oliaei, S.N.B. ((2018) ). On the digital manufacturing development applying engineering informatics as a discipline of field study. In: 2018 19th International Carpathian Control Conference (ICCC), pp. 492–497. https://doi.org/10.1109/CarpathianCC.2018.8399680. https://www.scopus.com/inward/record.uri?eid=2-s2.0-85050220712&doi=10.1109%2fCarpathianCC.2018.8399680&partnerID=40&md5=00550b260c8311cc568f6c7186aefec1. |
6 | Davenport, T., Harris, J. ((2017) ). Competing on Analytics: The New Science of Winning. Harvard Business Press, Massachusetts. |
7 | Ebert, C., Riegg, A. ((1991) ). A framework for selecting system design metrics. In: Proceedings. 1991 International Symposium on Software Reliability Engineering, pp. 12–19. https://doi.org/10.1109/ISSRE.1991.145347. |
8 | Farahani, P., Meier, C., Wilke, J. ((2017) ). Digital supply chain management agenda for the automotive supplier industry. In: Shaping the Digital Enterprise. Springer, Cham, pp. 157–172. https://doi.org/10.1007/978-3-319-40967-2_8. |
9 | Fortino, G., Guerrieri, A., Russo, W., Savaglio, C. ((2015) ). Towards a development methodology for smart object-oriented IoT systems: a metamodel approach. In: 2015 IEEE International Conference on Systems, Man, and Cybernetics, pp. 1297–1302. https://doi.org/10.1109/SMC.2015.231. |
10 | Gartner Group (2017). Seize the Digital Ecosystem Opportunity. Insights From the 2017 CIO Agenda Report. https://www.gartner.com/imagesrv/cio/pdf/Gartner_CIO_Agenda_2017.pdf. |
11 | Hansen, E.B., Bøgh, S. ((2021) ). Artificial intelligence and internet of things in small and medium-sized enterprises: a survey. Journal of Manufacturing Systems, 58: , 362–372. |
12 | Hartmann, P.M., Zaki, M., Feldmann, N., Neely, A. ((2016) ). Capturing value from big data–a taxonomy of data-driven business models used by start-up firms. International Journal of Operations & Production Management, 36: 10, 1382–1406. |
13 | Hevner, A.R., March, S.T., Park, J., Ram, S. ((2004) ). Design science in information systems research. MIS Quarterly, 28: 1, 75–105. |
14 | Horvath, I., Gerritsen, B.H. ((2012) ). Cyber-physical systems: concepts, technologies and implementation principles. In: Proceedings of TMCE 2012, Vol. 1: , pp. 19–36. |
15 | John, I., Knodel, J., Lehner, T., Muthig, D. ((2006) ). A practical guide to product line scoping. In: 10th International Software Product Line Conference (SPLC’06), pp. 3–12. https://doi.org/10.1109/SPLINE.2006.1691572. |
16 | Kaiser, C. (2022). Quantified Vehicles: Data, Services, Ecosystems. Dissertation. |
17 | Kaiser, C., Stocker, A., Viscusi, G., Fellmann, M., Richter, A. ((2021) ). Conceptualising value creation in data-driven services: the case of vehicle data. International Journal of Information Management, 59: , 102335. |
18 | Kang, K.C., Cohen, S.G., Hess, J.A., Novak, W.E., Peterson, A.S. (1990). Feature-Oriented Domain Analysis (FODA) Feasibility Study. Technical Report, CMU/SEI-90-TR-21, ESD-90-TR-222. |
19 | Keim, D.A., Mansmann, F., Schneidewind, J., Thomas, J., Ziegler, H. ((2008) ). Visual analytics: scope and challenges. In: Simoff, S.J., Böhlen, M.H., Mazeika, A. (Eds.), Lecture Notes in Computer Science, Vol. 4404: , Visual Data Mining. Springer, Berlin, Heidelberg. https://doi.org/10.1007/978-3-540-71080-6_6. |
20 | Kong, X., Song, X., Xia, F., Guo, H., Wang, J., Tolba, A. ((2018) ). LoTAD: long-term traffic anomaly detection based on crowdsourced bus trajectory data. World Wide Web, 21: (3), 825–847. |
21 | Lennartsson, D., Raudberget, D., Sandkuhl, K., Seigerroth, U. ((2022) ). Modularisation metrics – contrasting industrial practice and state-of-research. Proceedings of the Design Society, 2: , 2483–2492. https://doi.org/10.1017/pds.2022.251. https://www.scopus.com/inward/record.uri?eid=2-s2.0-85131380037&doi=10.1017%2fpds.2022.251&partnerID=40&md5=d47d56aaa7874fad11fcf96d92bcde76. |
22 | Li, L., Zheng, Y., Yang, M., Leng, J., Cheng, Z., Xie, Y., Jiang, P., Ma, Y. ((2020) ). A survey of feature modeling methods: historical evolution and new development. Robotics and Computer-Integrated Manufacturing, 61: , 101851. |
23 | Manyika, J., Chui, M., Brown, B., Bughin, J., Dobbs, R., Roxburgh, C., Hung Byers, A. ((2011) ). Big Data: The Next Frontier for Innovation, Competition, and Productivity. McKinsey Global Institute. |
24 | Mayer-Schönberger, V., Cukier, K. ((2013) ). Big Data: A Revolution that will Transform how We Live, Work, and Think. Houghton Mifflin Harcourt. |
25 | Noy, N.F., McGuinness, D.L. (2001). Ontology Development 101: A Guide to Creating your First Ontology. Stanford Knowledge Systems Laboratory Technical Report KSL-01-05. |
26 | Persad, U., Langdon, P., Clarkson, P.J. ((2011) ). Investigating the relationships between user capabilities and product demands for older and disabled users. In: Stephanidis, C. (Ed.), Universal Access in Human-Computer Interaction. Design for All and eInclusion. UAHCI 2011, Lecture Notes in Computer Science, Vol. 6765: . Springer, Berlin, Heidelberg. https://doi.org/10.1007/978-3-642-21672-5_13. https://www.scopus.com/inward/record.uri?eid=2-s2.0-79960303462&doi=10.1007%2f978-3-642-21672-5_13&partnerID=40&md5=e6bd58d581dca1cbdf0ee606815efaaa. |
27 | Porter, M.E., Heppelmann, J.E. ((2014) ). How smart, connected products are transforming competition. Harvard Business Review, 92: (11), 64–88. |
28 | Russell, S.J. ((2010) ). Artificial Intelligence a Modern Approach. Pearson Education, Inc.. |
29 | Sandkuhl, K. ((2022) ). Features of quantified products and their design implications. In: International Baltic Conference on Digital Business and Intelligent Systems, pp. 152–163. |
30 | Sandkuhl, K., Shilov, N., Seigerroth, U., Smirnov, A. ((2022) ). Towards the quantified product-product lifecycle support by multi-aspect ontologies. IFAC-PapersOnLine, 55: (2), 187–192. |
31 | Spiekermann, M. ((2019) ). Data marketplaces: trends and monetisation of data goods. Intereconomics, 54: (4), 208–216. |
32 | Swan, M. ((2013) ). The quantified self: fundamental disruption in big data science and biological discovery. Big Data, 1: (2), 85–99. |
33 | Thörn, C., Sandkuhl, K. ((2009) ). Feature modeling: managing variability in complex systems. In: Complex Systems in Knowledge-based Environments: Theory, Models and Applications. Springer, Berlin, Heidelberg, pp. 129–162. |
34 | Yin, R.K. ((1998) ). The abridged version of case study research. In: Handbook of Applied Social Research Methods, pp. 229–259. |


