
Providing a Framework for Evaluating the Quality of Health Care Services Using the HealthQual Model and Multi-Attribute Decision-Making Under Imperfect Knowledge of Data
Abstract
Due to the increasing importance of evaluating the quality of health care services using the patient-centred approach, this study aimed to propose a novel framework by combining the SERVQUAL model and multi-attribute decision-making (MADM) methods using interval-valued triangular fuzzy numbers (IVTFN). In this study, after an initial overview of related work and expert opinions, a list of the most important dimensions and indicators for measuring the quality of health care services was extracted and localized. Then, to determine the importance of each of the identified factors, one of MADM’s acceptable methods called step-wise weight assessment ratio analysis (SWARA) was used. Then, in order to use the developed framework for comparing different health centres and ranking them, after collecting evaluation data in the form of linguistic variables, another practical method in the field of MADM has been used, namely, Additive Ratio Assessment (ARAS) method. The dimensions and sub-dimensions identified are, on the one hand, appropriate to the conditions of the case study and, on the other hand, the findings from the implementation show that among the dimensions of health service quality, responsiveness and then reliability has the highest rank in this case. Also, the use of IVTFN, on the one hand, eliminates the problems related to the use of Likert scale in other quality assessment methods and, on the other hand, reduces the possibility of facing imperfect knowledge of data which is a common problem in the field of qualitative evaluations. Utilizing the results of this study can significantly help decision makers in their choice of strategies to improve service quality. Furthermore, improving the quality of services can play an important role in promoting the competitiveness and performance of health care providers by increasing patient satisfaction with the services received. Also, as a side effect, the developed framework can be used to compare the performance of different hospitals and health centres, as well as their ranking.
1Introduction
Today, the health care industry, as one of world’s largest and fastest-growing service industries, (Behdioğlu et al., 2019) is facing fundamental changes (Chen and Yeh, 2015). Financial and economic crises, on the one hand (Ferreira and Marques, 2016), the converging pressures of patients’ quickly changing expectations and preferences, regarding the health care services, as well as increasing competition among health care providers (Meesala and Paul, 2018) have led to alterations in the health care system in recent years, and without a doubt these alterations will continue on a larger scale in the future (Ginter et al., 2018). Novel diagnostic and therapeutic technologies and techniques, information technology and the emergence of a new generation of consumers of health care services have led to the development of a patient-centred culture that provide opportunities for customers to participate in cocreation activities to respond to demand for personalized high quality health care services (Sharma and Conduit, 2016).
Accordingly, the patient-centred approach has become a key component in promoting health services (Rahim et al., 2021). Today, the adoption a patient-centred approach in health care services is more often (Buawangpong et al., 2020) due to the benefits it has to patients, managers of service organizations, third-parties and administrative departments (Liao et al., 2020). The quality of health care services can lead to a sustainable competitive advantage and the continuity of business profitability, and at the same time it can increase patient satisfaction (Meesala and Paul, 2018; Altuntas and Kansu, 2019). Although in many previous studies, satisfaction and service quality have been used as two synonymous concepts, some new approaches have emphasized the differences between the two. According to Ferreira et al. (2018), patient’s satisfaction and overall quality of provided health care can be different for various reasons such as emotional evaluation of quality of health services by patients, the effects of non-health related items on patients’ satisfaction and the effects of individual characteristics of patients (such as personality, attitudes, interests and expectations) on their evaluations. But, the weakness of some of mentioned variables in the relationship with satisfaction may be the reason why most of the researches only focus on service quality attributes. However, a review of the results of some studies shows that in the current situation, many patients are not satisfied with the quality of services received (Chen and Yeh, 2015). This dissatisfaction may disrupt their treatment process due to unwillingness to follow medical advice after discharge (Carlucci et al., 2013). Due to various service features such as intangibility, inseparability, heterogeneity, and un restorable nature, it is difficult to measure service quality (Akdag et al., 2014). Also, in order to achieve the health of patients and to satisfy the beneficiaries, different aspects of services should be considered.
Lee (2017) considered the different measurement items used to evaluate health care service quality in different contexts based on the researcher viewpoints. Among the studies conducted, the SERVQUAL model proposed by Parasuraman et al. (1985, 1988) to measure service quality has been widely endorsed by other researchers (Aydin and Pakdil, 2008). Today, new and different applications of SERVQUAL model have been presented in various service areas (Beheshtinia and Omidi, 2017). In the health care industry, this model has been used in many research studies in the last decade as HealthQual, hospital service quality (HSQ) or similar names (Singh and Prasher, 2019; Singh et al., 2020; Yucesan and Gul, 2020; Li and He, 2020; Singh, 2019; Lee, 2017; Behdioğlu et al., 2017). Service quality based on HealthQual and HSQ refers to patient’s attitude towards the service offered by a health care service provider resulting from a comparison of patient’s expectations and patient’s perceptions. Donabedian (1988) triangular service quality model referred three dimensions to assess quality of health care services, namely, structure, process and result. Structure quality includes the physical, financial, and structural tools and resources of health care providers. The process-related quality of health care services depends on how the service provider and recipient interact. This is the dimension that Grönroos (1988) called functional quality. Result-related quality reflects the patients’ perception of the quality of services after the medical act. According to Boller et al. (2003), the “results” dimension is the output of service quality and not a part of it, so in measuring service quality the focus should be on the dimensions of “structure” and “process”. Also, due to the long time between the moment the service is provided and when the results are obtained, the majority of studies such as the present study, have been centralized on evaluation of patients’ satisfaction with the quality of services received from the first two dimensions, i.e. structure and process (Choi et al., 2005).
In addition to how to identify, select and use items that affect the quality of health care services, as an important part of the focus of researchers, the next challenge is how to measure the quality of health care services. The multifaceted and complex nature of health care service quality metrics (La Fata et al., 2019; Ampaw et al., 2020) has led to a variety of methodologies in addition to a variety of models and patterns of service quality. A review of past research works on health care quality shows that most of them have been based on statistical approaches. However, these approaches are usually inefficient in calculating the importance of criteria, as well as in the final aggregation of evaluation scores of different alternatives (hospitals and health care centres) and their final ranking (Afkham et al., 2012). For this reason, the multi-attribute decision-making (MADM) approach has recently received special attention (Li and He, 2020). The logic of this method is based on the fact that customers’ desires for service are calculated based on the evaluation of different aspects of services in terms of the importance assigned to them (Lupo, 2016).
Also, most researchers in recent years have tried to use the Likert scale to measure the quality of health care and to summarize the opinions of a large number of people in the form of a definite number. However, it is not appropriate to use the Likert scale and perform calculations based on it in order to measure the quality of health care (Ferreira et al., 2021). Accordingly, in the field of MADM methods, linguistic variables are generally used in the form of pairwise comparisons. Although linguistic variables have been criticized by researchers due to the influence of factors such as subjectivism, judgments, selection and priority of evaluators on the final results in the field of quality evaluation of health care services (Afkham et al., 2012; Lupo, 2016; Li and He, 2020).
Even though Likert scale linguistic variables are often described as an imprecise tool that has a high level of imperfect knowledge of data, Singh and Prasher (2019), Zadeh (1965) proposed the theory of fuzzy number sets in order to be used in decision making process based on vague and ambiguous information (Boltürk and Kahraman, 2022). Fuzzy numbers make it possible to include uncertainty and imperfect knowledge of data in the decision-making process of experts and can be well applied to perform calculations in cases where linguistic variables have been used (Akdag et al., 2014). This ability of fuzzy numbers caused (Büyüközkan et al., 2011) to use a fuzzy approach to measure the quality of services for the first time in 2011 (Li and He, 2020). However, compared to studies based on quality assessment models (such as SERVQUAL, HealthQual, etc.), limited research has indicated the use of MADM methods and fuzzy numbers to evaluate the quality of health care services (Yucesan and Gul, 2020). One of the weaknesses of fuzzy numbers is in determining the exact value of the upper and lower bound of the membership function. Gorzałczany (1987) has tried to solve it by using IVTFN numbers (Dahooie et al., 2020). Accordingly, the current study proposed a novel methodology for evaluating and prioritizing the dimensions of health care service quality and ranking of service providers based on the combined MADM methods with interval-valued triangular fuzzy numbers (IVTFN). For this purpose, Step-wise weight assessment ratio analysis (SWARA) and Additive ratio assessment (ARAS) have been used to increase the efficiency of the framework compared to similar approaches. In addition to the privileges that these two methods have in terms of mathematical logic, due to advantages such as user-friendliness, less complexity, and less implementation time, these two methods have attracted the attention of many researchers to use them in different areas of decision-making.
In the second part of the article, the theoretical background on the quality of services in the field of health care has been reviewed. The third section introduces the research case study. The fourth describes the research steps. The fifth section presents research data and findings based on the views of decision makers in this field. In the sixth section, the findings are discussed and compared with the results of previous researches, and finally in the seventh section, while summarizing, the research innovations are explained and practical recommendations and future research suggestions are presented.
2Theoretical Background
2.1Health Care Service Quality
The measurement of the quality of health care services can be important from the perspective of different stakeholders: the view of service providers with goals such as promoting profitability, the viewpoint of social health insurance aiming to minimize costs and the patient-oriented view with the main focus on health service recipients with goals such as satisfaction with the services received and improving health. But it seems that high quality services can cover the goals of all stakeholders at the same time. Providing appropriate and high-quality health care services prevents unnecessary patient referrals and consequently additional costs (Sharifi et al., 2021). Also, previous studies have confirmed the direct relationship between the quality of health care services with increasing profitability and market share of service providers in a competitive environment (Naidu, 2009; Meesala and Paul, 2018; Altuntas and Kansu, 2019).
An organization providing health care services (such as a hospital) needs accurate knowledge of patient satisfaction as an integral part of the quality of health care services (Pekkaya et al., 2019; Altuntas and Kansu, 2019). This is because increasing patients’ satisfaction with health care services by increasing the quality of services received, leads to several achievements such as improving their loyalty (Fatima et al., 2018; Meesala and Paul, 2018) and competitiveness of hospitals, etc. (Chen and Yeh, 2015).
Understanding what factors can affect patients’ perceptions of the quality of services they receive is of considerable importance not only to patients; but also, to service providers, governments, and other stakeholders (Li and He, 2020). As health care providers prepare themselves to face the challenges of the Industrial Revolution 4.0, patient oriented, value driven, health care quality management plans should include efforts to identify and satisfy patients’ needs and preferences (Rahim et al., 2021).
Due to this importance, one of the issues of previous research has been to identify and determine the factors affecting the quality of health care services in order to be able to consider the appropriate criteria for determining, controlling and improving the quality of services. However, there have been limited studies in the field of patients’ perceptions of service quality dimensions (Gill and White, 2009).
2.2Health Care Service Quality Dimensions
Given the importance of health care quality, to date we have seen numerous studies and researches that have sought to introduce dimensions and indicators affecting the quality of health care services (Li and He, 2020). In general, health care quality assessment items are used and studied differently according to the views of researchers because there are no standard measurement items (Lee, 2017). Vouri (1982) introduced efficiency, effectiveness, accuracy and quality improvement of scientific-technical competencies as important factors in the quality of health care services (Lee, 2017). Donabedian (1988) introduces the dimensions affecting the quality of healthcare services including structure, process and results. According to the model of Grönroos (1984), patients evaluate the quality of health care services based on two dimensions: technical quality (result of received services) and functional quality (manner and process of received services). Carman (1990) presented tangibles, reliability, safety, empathy, convenience, and cost as items to measure health care service quality. Scobie et al. (2006) also presented health care service quality in the following six dimensions: tangibles, accessibility, timeliness, efficient costs, values, policy, and implementation to improve quality, understanding the expected value of patients, and capabilities of the service provider. Otani et al. (2009) considered the dimensions affecting the quality of health care services as admission process, staff care, nursing care, physician care, food and room. Lee (2017), by focusing on health care processes and results, attempted to measure health care service quality through tangibles, empathy, efficiency, safety, and degree of improvements of health care service. Li and He (2020) categorized the health care service quality assessment into six main dimensions including tangibles, responsiveness, professional competence, professional capability, reliability, and administrative policy.
However, over the years, the most famous and practical model of health care service quality on which other models have been presented is the service quality gap model called SERVQUAL, proposed by Parasuraman et al. (1985, 1988), an instrument with 5 main dimensions for measuring the quality of services from the customer’s perspective. It should be noted that its dimensions have been various in different models and it has been used mostly in the form of four-dimensional, five-dimensional and six-dimensional categories (Li and He, 2020). This model has been extensively studied in recent years in various service areas such as the quality of health care services. This has led to the formation of a version of the SERVQUAL model called HealthQual. HealthQual is a multidimensional scale that measures the quality of health care services from the patient’s point of view (Sharifi et al., 2021; Asiamah et al., 2021; Nemati et al., 2020; Ampaw et al., 2020; Lee, 2017).
Based on the HealthQual model for health care service quality evaluation, patients measure their satisfaction with the quality of services received, based on 5 main dimensions. Empathy (refers to understanding patients’ problems by staff and trying to meet them, paying attention to each patients, assurance (is concerned with reassuring and polite behaviour of hospital staff towards patients, existence of staff with the necessary ability and qualification to answer patients’ questions, safe hospital equipment), responsiveness (entails willingness of hospital staff to help patients, respond to their requests, informing them of the methods of complaining about the services received and providing fast services), reliability (is concerned with provision of accurate and error-free services by hospitals to patients at the promised time), and tangibles (encompasses physical facilities, equipment and appearance of hospital staffs).
The results of the majority of previous studies confirm the validity of HealthQual model for evaluating the quality of health care services (Sharifi et al., 2021; Asiamah et al., 2021). In addition, a look at the quality standards of health care services in developed countries shows that in the service quality indicators of these countries, the dimensions of the HealthQual model have been significantly emphasized and this has increased the acceptance of this model. The dimensions of empathy, reliability and tangible factors are in accordance with the American JCI standard, reliability and tangible factors are in accordance with the Australian ACHSI standard and tangible factors are in accordance with the Canadian ACI standard (Lee, 2017).
Despite all the advantages and practicality of the SERVQUAL model in evaluating service quality in previous research, some researchers have criticized it both conceptually and paradigmatically (Coulthard, 2004). According to the three-dimensional model of Donabedian (1988), the quality of health care services should be evaluated taking into account three aspects: structure, process and result. In SERVQUAL model, the focus is more on the structure and process of providing service instead of service quality results. Other issues that have been expressed in the critique of this model are concerns about how customers evaluate the quality of service in terms of expectations and perceptions, as well as the dimensions and universality of the five dimensions of SERVQUAL (Buttle, 1996). Lucadamo et al. (2021) argued that assessing health care patients’ expectations is a challenging issue; SERVQUAL is not appropriate and should be modified.
2.3Measuring Health Care Service Quality
The provision of high-quality health care is an important issue, since its direct consequences are relief to suffering and improved health status in humans (Bowers and Kiefe, 2002). For the success of health care institutions and hospitals, accurate assessment of health care service quality is as important as understanding the constitution of the service delivery system (Büyüközkan et al., 2011).
Based on the literature, a number of methods have been developed to evaluate the quality of health care services. Fundamentally, they can be categorized into two basic groups: Stated Importance Methods (SIMs) and Derived Importance Methods (DIMs) (Grigoroudis and Spyridaki, 2003). In the first approach (SIM), customers are asked to complete detailed questionnaires (both expectations and perceptions on the key aspects of service quality) (Lupo, 2016). In SIMs, the perception and expectation of a customer is measured based on linguistic-numerical Likert type scales, which are simple to use, but need a significant enhance in the length of survey and can sometimes make an inadequate difference in ranks of the service dimensions (Tsai et al., 2011; Lupo, 2015; Pamucar et al., 2021). As a result, the customers’ self-expressed importance does not sufficiently measure the true relative importance of attributes (Deng and Pei, 2009).
In the DIM approach, relatively simple questionnaires are provided to customers and they only have to provide perceptions on service quality aspects along with the overall satisfaction degree of quality (Lupo, 2016). With this approach, the rating of expectations on service dimensions is statistically obtained by considering the relationships between performance in service aspects and overall customer satisfaction (Pandey, 2016). After conducting such surveys, there are several alternatives to examine satisfaction. These alternatives can be considered as structural equation modelling, factor analysis, multiple/logistic regressions, and the so-called Multicriteria Satisfaction Analysis (MUSA) (Deng and Pei, 2009; Ferreira et al., 2021). DIMs allow the recognition of underlying dimensions of quality and their relationship to overall distinguished quality or customer satisfaction, however they depend on a set of restrictions-normal data, linear relationships, multi-co-linearity, which diminishes the guarantee of generalization (Tsai et al., 2011). Hence, the implicit importance values of attributes determined through statistical approaches are biased and misleading (Deng and Pei, 2009).
Lately, multi-criteria decision making (MCDM) models are growingly considered in the literature to address these weaknesses (Tsai et al., 2011; Lupo, 2016; Pandey, 2016). MCDM methods are on the basis of some general principle that customers’ attitudes toward certain services depend on their evaluation of service aspects based on the importance given to them (Lupo, 2016). In this method, on the one hand, there is no need to use the Likert scale to calculate weights, and instead, pairwise comparison approaches or standard scales are used, and on the other hand, there is no necessity to use large volumes of data and observe common assumptions in statistical methods. Due to these advantages, these methods have been considered in the field of evaluating the quality of hospitals and health services by some researchers in recent years. Table 1 shows the most important studies conducted in this area.
Table 1
Some research conducted with multi-attribute decision making approach.
| Author(s) | Country | Dimension(s) | Weighting method | Ranking method |
| Wu et al. (2004) | Taiwan | Tangibles (physical facilities, equipment, and appearance of contact personnel), Reliability (ability to perform the promised service reliably and accurately), Responsiveness (willingness to help customers and provide prompt service), Assurance (knowledge and courtesy of employees and their ability to inspire trust) and Empathy (provision of caring, individualized attention to consumers) | Fuzzy AHP | |
| Büyüközkan et al. (2011) | Turkey | Tangibles (Building layout, Equipment, Hygiene), Reliability (Accuracy, Expertise, Image, Security/privacy), Responsiveness (Timeliness, Completeness, Willingness), Assurance (Cost, Courtesy, Compensation), Empathy (Caring, Manner, Communication), Professionalism (Skill, Experience, Innovation) | Fuzzy AHP | – |
| Afkham et al. (2012) | Iran | Tangibles (13 questions), Reliability (4 questions), Responsiveness (12 questions), Assurance (9 questions) and Empathy (11 questions). | Fuzzy AHP | TOPSIS |
| Altuntas et al. (2012) | Turkey | Tangibles (up-to-date equipment, visual appeal of facilities), Reliability (sympathetic and reassuring employees, services provided at the time promised to do so), Responsiveness (employees’ willingness, employees’ quickness), Assurance (feeling of safety by patients in interactions with hospital employees, knowledge of employees) and Empathy (careful and attentive acts of employees). | AHP and ANP | |
| Akdag et al. (2014) | Turkey | Tangibles (19 questions), Reliability (4 questions), Responsiveness (8 questions), Assurance (8 questions) and Empathy (7 questions). | Fuzzy AHP | Fuzzy TOPSIS and Yager’s min–max |
| Chen and Yeh (2015) | Taiwan | Q1: Hospital has modern medical equipment. Q2: Medical staff is passionate about helping patients to solve their problems, Q3: Medical staff is not too busy and does not neglect patients, Q4: Prompt management of emergency patients by the medical staff, Q5: Medical staff listens to patients’ needs, Q6: Doctors can offer detailed explanations of patient status, Q7: Doctors have good professional skills, Q8: Hospital will initiate a follow-up of patients’ recovery. | AHP | – |
| Lupo (2016) | Italy | Healthcare staff (Ability of doctors to understand patient needs, Capacity to work as a team, Staff reliability, Staff availability), Responsiveness (Swiftness of registration and admission procedures, Administrative quality, Waiting time for tests results, Waiting time for medical records), Relationships (Confidentiality between doctor and patient, Confidentiality between all healthcare staff, Cooperation and helpfulness of administrative staff, Humanization of relationships) and Support services (Quality of food & beverage for patients, Security within hospital, Cleanliness of facilities and premises) | Fuzzy AHP | |
| Singh and Prasher (2019) | India | Tangibles (Equipment, Infrastructure, Hygiene, Appearance, Space, Parking), Reliability (Consistency, Skills, Knowledge, Image, Confidentiality), Responsiveness (Quickness, Completeness, Promptness, Procedure, Waiting), Assurance (Cost, Confidence, Guarantee, Ignorance, Consideration), Empathy (Politeness, Grievances, Concern, Interaction, Understanding) and Trustworthiness (Honesty, Relevance, Non-manipulation, Non-overcharging). | Fuzzy AHP | – |
| Singh (2019) | Fuzzy AHP | ELECTRE-I | ||
| Yucesan and Gul (2020) | Turkey | Hospital equipment (4 criteria), Service attitude (8 criteria), Pharmacy and medical treatment (5 criteria), Professional competence (3 criteria), Administrative policies (6 criteria) and Cleaning of hospital facility (6 criteria) | Pythagorean fuzzy AHP | Fuzzy TOPSIS |
| Karasan et al. (2022) | Turkey | Tangibles (Infrastructure, Healthcare staff, Support services, Accessibility, Hospital environment, Service attitude), Reliability (Credibility, Security, Education and research, Targets), Responsiveness (Information quality, Professional capability, Administrative policy, Process of clinical care, Information to patient), Assurance (Courtesy, Competence, Performance monitoring, Communication), Empathy (Relationships, Social responsibility, Perceived waiting time, Perceived service costs, Patient satisfaction) | Equal weights | Pythagorean Fuzzy TOPSIS and FIS |
| Analytical hierarchy process (AHP) | Technique for Order of Preference by Similarity to Ideal Solution (TOPSIS) | |||
| Analytic network process (ANP) | ELimination and Choice Expressing REality (ELECTRE) | |||
| Fuzzy inference system (FIS) | ||||
Based on the information provided in this table, the following points can be summarized.
First, review of the literature indicates that several dimensions and criteria affect the quality of health care services, and this has made the issue of measuring their quality a complex and multi-criteria issue (La Fata et al., 2019).
The differences in the dimensions and criteria considered in different researches indicate the need to localize the health care service quality measurement model in accordance with the studied conditions and related features. However, the framework that is appropriate for Iran and, in particular, the case under study was not determined.
Second, in most researches, the weight/importance is calculated using common multi-criteria decision-making methods such as AHP and ANP and based on pairwise comparisons between service aspects from customers’ point of view. These pairwise comparisons, on the one hand, allow the calculation of actual relative importance of attributes, and on the other hand, due to the use of standard scales, eliminate the problems related to Likert scale and ordinal data. However, one of the main problems of these two methods is the need for a high number of pairwise comparisons; so that if there are n criteria, the number of pairwise comparisons should be
Third, a review of previous research trends shows that the use of definite numbers has gradually diminished in this area (Mardani et al., 2019). In most researches, evaluations related to assessment of service aspects have been done in the form of linguistic variables and then using theories such as fuzzy, these variables have been converted into interval-valued information that have their own special computational operators. The reason for this should be sought in the fact that most researchers have used the linguistic variables or Likert scale to measure the quality of health care services and summarize the opinions of a large number of people and then convert them into definite numbers. However, linguistic variables have been criticized by researchers due to the influence of factors such as subjectivism, judgments, selection and priority of evaluators on the final results in the field of quality evaluation of health care services (Afkham et al., 2012; Lupo, 2016; Li and He, 2020). In other words, the linguistic variables are imprecise and have imperfect knowledge of data and fuzziness (Singh and Prasher, 2019). Fuzzy number theory, on the other hand, makes it possible to take uncertainty and imperfect knowledge of data into account in the decision-making process of experts and can be well applied to perform calculations in cases where linguistic variables are used (Akdag et al., 2014).
Despite the mentioned features, literature review shows the low share of fuzzy MADM methods in the studies based on service quality evaluation models (Yucesan and Gul, 2020). Also, few decision-making methods have been used by researchers in this field (Mardani et al., 2019). However, new methods have been proposed in the field of MADM methods, each of which has its own advantages and features (Dahooie et al., 2019). Numerous studies in the field of fuzzy numbers also show that this set of numbers also has several shortcomings under real-world conditions. This has led to developments such as type-n fuzzy sets, hesitant fuzzy numbers, etc. (Dahooie et al., 2020). One of these most important shortcomings occurs in determining the exact value of the upper and lower bounds of the membership function in a set of traditional fuzzy numbers which led to the introduction of interval-valued fuzzy numbers by Gorzałczany (1987). This challenge is especially important in cases where the evaluation is done qualitatively and in the form of linguistic variables (Gorzałczany, 1987). Therefore, in view of what has been described before, special attention should be paid in the field of service quality evaluation.
3Research Case Study
This study has chosen Iran as a case study. Iran is a vast country with attractive demographic and economic characteristics. It has a population of about 80 million which is expected to reach 88 million by 2030. According to www.ilna.news, estimates show that the turnover of the Iranian health market is 25 to 28 billion dollars, and based on this, this industry can be a very important source of employment and income for the country. Iran also spends only 7.5% of its gross domestic product (GDP) on the health system. On the other hand, the share of health expenditures in government expenditures in Iran is 17%, which is about 50% for the United States (Burns, 2014).
During the last 4 decades, the Iranian health care system has designed several major health reforms to improve the quality of health (Ranjbar et al., 2021), most of which have limited achievements for various reasons, such as insufficient attention to its implementation (Mahdavi et al., 2018; Dehnavieh et al., 2018).
Since May 5, 2014, in order to achieve the vision of 2025, Iranian Ministry of Health and Medical Education has implemented a comprehensive transformation plan (which is still in progess), the so called health transformation plan (HTP), which strives to improve the operational management of health service delivery in Iran (Mahdavi et al., 2018; Ranjbar et al., 2021).
As a result of HTP, many changes have taken place in the Iranian health system. Government spending on health increased significantly, health insurance coverage was extended to a larger population, and medical tariffs were revised. Also, many hospitals and public health centres were renovated, the number of hospital beds increased, new hospitals and public health facilities were established in deprived areas, and more doctors and nurses were hired in remote areas (Ranjbar et al., 2021). The HTP has various goals, especially improving the quality of health care services to patients (Bahadori et al., 2015).
However, since the launch of HTP, a variety of research and studies have been conducted, both in terms of content and implementation issues (Mahdavi et al., 2018). A significant portion of the research examined the effects of HTP on various aspects of the health system such as out-of-pocket payments (Doshmangir et al., 2019), and hospital performance from various aspects such as patient health services utilization and medical resources efficiency (Ranjbar et al., 2021; Rezaei et al., 2016). A look at these studies shows that although various aspects of the quality of health care services have been considered, we still need to conduct more extensive research on the results of this program on the quality of services provided to patients.
Also, a comprehensive view on the issue of service quality requires the design and application of multifaceted methodology and models that can help to get a true picture of the effects of this transformation program on the quality of services provided to patients. This research has been done to meet this need.
4Research Methodology
The purpose of this paper is to provide an evaluation framework to measure the quality of health care services from the patient’s point of view using a combination of MADM methods with IVTFN. This combined approach helps to overcome the limitations mentioned before and provides the possibility of determining the importance of each criterion from the perspective of different stakeholders, calculating the scores of alternatives (hospitals, medical centres, etc.) and finally ranking them.
Fig. 1
Steps of the proposed framework.
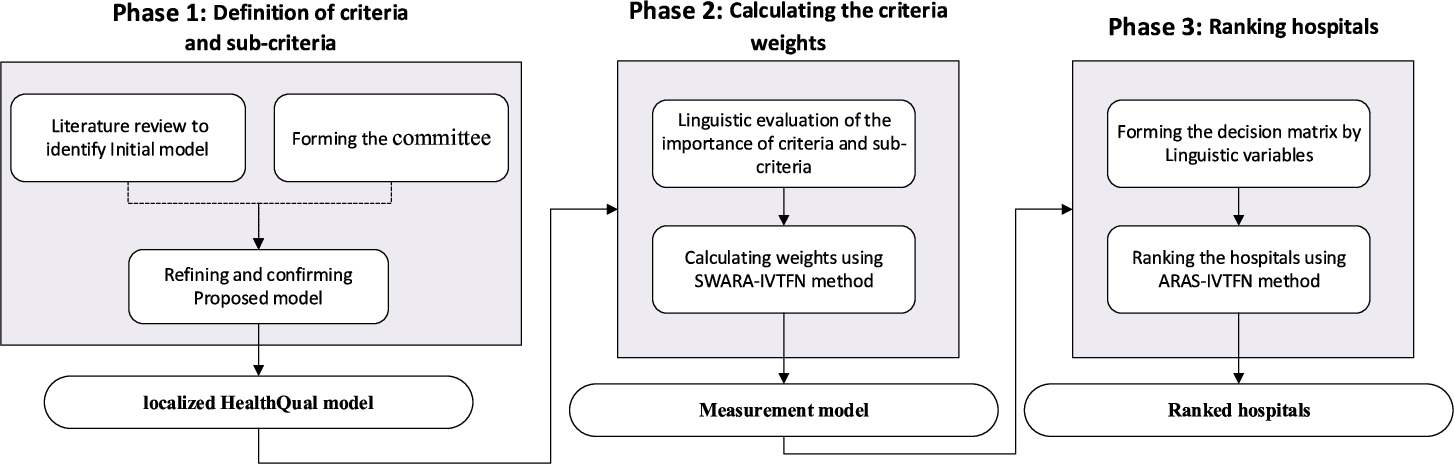
As Fig. 1 shows, in order to shape this framework, an initial model was first developed based on a review of the models developed to assess the quality of health care services. Since this study is designated to evaluate and rank hospitals and health care centres related to personnel working in the Iranian oil industry, a committee was formed to conduct this evaluation.
The members of this committee consist of the planning manager of the company’s headquarters (with more than 20 years of experience and academic education in the field of health services planning), 6 evaluators of this management (all of whom have more than 15 years of executive experience in the field of health services of subsidiaries, also responsible for evaluations for more than 5 years as a quality assessor of health services in the company’s headquarters). This committee is structurally a subset of the company’s planning management and is responsible for evaluating the quality of health care services in hospitals and health centres under the supervision of the National Iranian Oil Company.
In this research, as in similar cases, it is very important to create a consensus between experts regarding the final model (Liu et al., 2022). So, the initial model was provided to the members of this team in the form of Delphi method and after four rounds, the model agreed on by the committee members was created. Of course, at this stage, in order to achieve the final model of quality evaluation, in addition to the committee members, 2 university professors participated in the process. They are working in the field of health and medical services with extensive experience in related research projects. In order to conduct a comprehensive evaluation of all identified criteria, the selected evaluators were divided into three executive teams (each team includes two evaluators) and finally the results of the three teams were combined to prevent errors in the evaluations as much as possible. With the aim of designing the health service quality evaluation model, each team was first asked to determine the importance and weight of each criterion in the form of SWARA-IVTFN method steps. Finally, the opinions of these teams were combined and the relative importance of each criterion was determined. Then, the auditors evaluated each of the hospitals based on the identified criteria by different methods such as observation, interviewing patients and staff and studying existing documents. Finally, according to the importance calculated in the previous step and the results of the evaluation, ten hospitals and medical centres of the oil industry were prioritized using the ARAS-IVTFN method. Finally, the results of calculating the weight of the criteria as well as the ranking results were provided to the committee members and approved by them.
4.1Interval-Valued Triangular Fuzzy Number (IVTFN)
Fuzzy number set theory was first proposed by Zadeh (1965) to deal with vague and ambiguous information in the decision-making process (Liu et al., 2021). Type-1 fuzzy set developed by Zadeh (1965) considers a crisp number in the range of 0 to 1 for the membership value. The exact membership function of a fuzzy set is not easily obtained in some conditions. In these cases, type-1 fuzzy sets do not work efficiently for linguistic assessment (Ghorabaee et al., 2016). This led to several developments in this theory and the formation of type-n fuzzy sets, hesitant fuzzy numbers, etc. (Dahooie et al., 2020). The interval-valued fuzzy numbers introduced by Gorzałczany (1987) have eliminated the shortcomings of the traditional fuzzy approach in determining the exact value of the upper and lower bounds of the membership function (Vahdani et al., 2014). This is especially important in cases where assessment is conducted qualitatively and in terms of linguistic variables (Gorzałczany, 1987).
Like other types of generalized fuzzy numbers, interval-valued fuzzy numbers can be triangular or trapezoidal numbers. Interval-valued triangular fuzzy numbers (
(1)
Fig. 2
Representation of an interval-valued triangular fuzzy number (IVTFN).
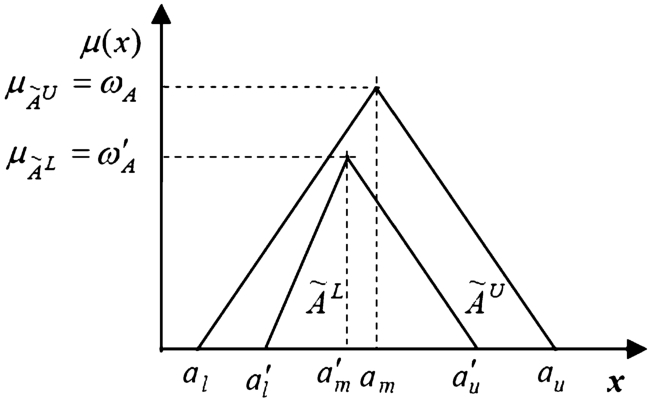
In the above relation,
(2)
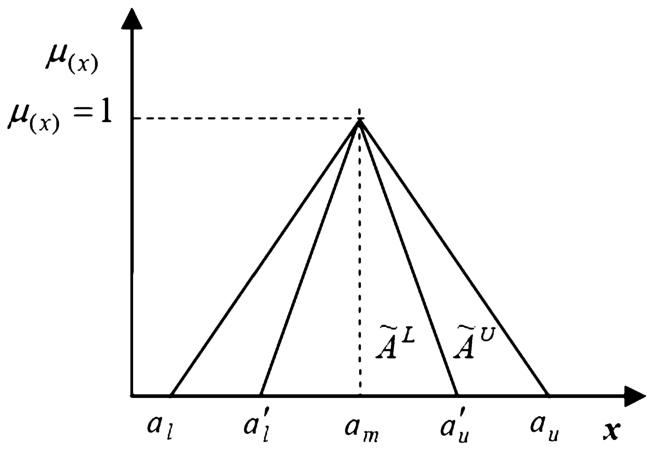
Fig. 3
Representation of a normalized interval-valued triangular fuzzy numbers.
Further details on these numbers and their related algebraic operations are provided in Dahooie et al. (2020), Mohammadian et al. (2021).
4.2SWARA-IVTFN
In the context of MADM approaches, various methods have been provided to determine the criteria weights (Liu and Li, 2021). However, many of them are not only complicated, they are also not accurate enough. Hence, Keršuliene et al. (2010), introduced the SWARA method, a relatively less complex approach (Karabasevic et al., 2016). This method is user-friendly, less complicated and less time consuming. It also gives decision makers the opportunity to choose and assess the criteria and set their weights, while enabling experts to use their knowledge and experience in the research area (Hashemkhani Zolfani et al., 2018; Kumar et al., 2022). The initial version of this method was not efficient in the face of situations where decision makers’ information is unreliable and incomplete. Stević et al. (2022) discussed the use of the fuzzy SWARA method and proposed an improved approach to address the criticisms of this method. Considering the points raised about IVTFN numbers (eliminating the shortcomings of the traditional fuzzy approach in determining the exact value of the upper and lower bounds of the membership function), the development of this method based on this IVTFN numbers has been considered in this research. Details on how to calculate are provided in Dahooie et al. (2020, 2022), so here is just a summary of the steps.
• Prioritizing the criteria based on importance (in descending order);
• Determining the relative importance of each criterion (
• Calculation of Relative Importance Function (coefficient
(3)
• Calculation of the initial weight of the criteria (
(4)
• Determining the normalized final weight (
(5)
• Defuzzification of the final weight based on equation (6):
(6)
The scale of linguistic variables used in this study to calculate the weight of the criteria is presented in Table 2.
Table 2
Linguistic variables used to calculate the weight of criteria (Stanujkic, 2015).
| Linguistic variables | Interval-valued triangular fuzzy number |
| Equally important | |
| Moderately less important | |
| Less important | |
| Very less important | |
| Much less important |
4.3ARAS-IVTFN
Among the MADM methods that have been developed with the aim of ranking and evaluating the alternatives, the ARAS (Additive Ratio Assessment) method (Zavadskas and Turskis, 2010) has had a growing trend since 2010 due to advantages such as ease of implementation and comprehensibility, the possibility of determining the utility degree of each alternative compared to the optimal alternative (Pareto optimal solution) and rank reversal resistant (Liu and Xu, 2021). Given the benefits of IVTFNs, an extended version of ARAS-IVTFN is considered in this study. A summary of the steps is provided below (read more in Dahooie et al., 2018, 2022).
• Formation of a decision matrix including the evaluation results of each alternative as well as the optimal alternative (Eq. (7)):
(7)
Suppose there are m alternatives and n criteria, then
(8)
• Calculation of the normalized decision matrix (
(9)
(10)
• Calculation of the interval-valued weighted normalized decision matrix (
(11)
(12)
• Calculation of the overall performance index for each alternative (
(13)
• Defuzzification of the overall performance index of each alternative (
λ is a coefficient between zero and one that by changing its value, the parameters(14)
(15)
• Ranking the alternatives based on
The scale of the linguistic variables used in this study for scoring alternatives and final ranking is presented in Table 3.
Table 3
Linguistic variables used to score alternatives and rank them (Stanujkic, 2015).
| Linguistic variables | Interval-valued triangular fuzzy number |
| Very High (VH) | |
| High (H) | |
| Medium (M) | |
| Low (L) | |
| Very Low (VL) |
5Research Findings
In order to verify the validity of the proposed framework, the steps of this framework were applied to evaluate and rank the hospitals and medical centres of the Iranian oil industry in terms of health care quality. The following are the main findings based on the steps described in the methodology section.
5.1Identification of Dimensions and Sub-dimension for HealthQual Model
As described in the previous sections, in this study, first, the standard SERVEQUAL model was considered as the basis of the work. Thus, the 5 main dimensions presented by Parasuraman et al. (1985, 1988) were selected which have been considered in most articles. Then, based on the standard definitions of these dimensions and considering the articles that used this model in the field of health services, an attempt was made to determine the initial list of sub-dimensions. At the end, the list was provided to committee members and two experienced professors in the form of Delphi process. Finally, after four rounds, this model was localized in the form of 5 main dimensions and 23 sub-dimension. The final dimensions and sub-criteria are shown in Table 4.
Table 4
Definition of dimensions and sub-criteria of localized HealthQual model.
| Dimensions | Sub-dimension | References |
| Empathy (EM) | EM1 = Perception of patients’ special needs by hospital staff | Lim and Tang (2000), Mostafa (2005), Yeşilada and Direktör (2010), Ranjbar et al. (2012), Kalepu (2014), Asiamah et al. (2021), Sharifi et al. (2021) |
| EM2 = Special attention of personnel to patients | ||
| EM3 = Dedication of all staff efforts to the needs of patients | ||
| Assurance (AS) | AS1 = Personnel with knowledge and experience | Babakus and Boller (1992), Youssef et al. (1996), Lim and Tang (2000), Scobie et al. (2006), Yeşilada and Direktör (2010), Asiamah et al. (2021), Sharifi et al. (2021) |
| AS2 = Kind and polite staff | ||
| AS3 = Full explanation of the patient’s medical condition by personnel | ||
| AS4 = Safe medical equipment | ||
| Responsiveness (RES) | RES1 = Providing 24-hour services | Babakus and Boller (1992), Youssef et al. (1996), Jun et al. (1998), Lim and Tang (2000), Ranjbar et al. (2012), Kalepu (2014), Asiamah et al. (2021), Sharifi et al. (2021) |
| RES2 = Internal willingness of staff to meet the needs of patients | ||
| RES3 = Appropriate response of hospital staff to patients’ questions | ||
| RES4 = Ability of hospital staff to quickly understand the needs of patients | ||
| RES5 = Ability of hospital staff to deal quickly and effectively with sudden events | ||
| RES6 = Easy and accessible ways for patients to complain about the services they receive | ||
| RES7 = Providing fast and immediate service to patients by hospital staff | ||
| Reliability (REL) | REL1 = Proper organization in providing services to patients | Babakus and Boller (1992), Youssef et al. (1996), Lim and Tang (2000), Ranjbar et al. (2012), Yeşilada and Direktör (2010), Kalepu (2014), Asiamah et al. (2021), Sharifi et al. (2021) |
| REL2 = High reliability in providing services to patients | ||
| REL3 = Providing promised services to patients | ||
| REL4 = Providing error-free services to patients | ||
| Tangibles (TA) | TA1 = Friendly and comfortable hospital environment | Babakus and Boller (1992), Youssef et al. (1996), Lim and Tang (2000), Ranjbar et al. (2012), Kalepu (2014), Asiamah et al. (2021), Sharifi et al. (2021) |
| TA2 = Cleaning inside and outside of the hospital | ||
| TA3 = Newness and completeness of hospital equipment and facilities | ||
| TA4 = Clean and comfortable rooms of the hospital | ||
| TA5 = Appropriate appearance and cleanliness of hospital staff |
5.2Calculating the Criteria Weights for HealthQual Model
As mentioned in the research steps section, in the first step, the importance and weight of each of the criteria and sub-criteria of the HealthQual model have been calculated using the SWARA-IVTFN method. For this purpose, first the weights of the main criteria and then the weights of the sub-criteria were calculated and then the weight of the criteria was multiplied by the weight of the sub-criteria to obtain the final weight of each of the sub-criteria. The results of the developed SWARA method based on interval-valued triangular fuzzy numbers for the first team are shown in Table 5. As shown in the third column of this table, the team representative is asked to sort the criteria in descending order of importance. In the following, calculations have been made based on the steps of the developed SWARA-IVTFN method. The results of the second, third (equation (3)), fourth (equation (4)) and fifth (equation (5)) step are given in the next columns of this table, respectively.
Table 5
Calculations of criteria weights by members of the first team.
| Criteria code | Comparative importance of average value | Coefficient | Recalculated weight | Weight ( | |
| Main | Responsiveness | ||||
| Reliability | |||||
| Assurance | |||||
| Empathy | |||||
| Tangibles | |||||
| Empathy | EM3 | ||||
| EM2 | |||||
| EM1 | |||||
| Assurance | AS2 | ||||
| AS1 | |||||
| AS3 | |||||
| AS4 | |||||
| Responsiveness | RES3 | ||||
| RES2 | |||||
| RES1 | |||||
| RES4 | |||||
| RES7 | |||||
| RES6 | |||||
| RES5 | |||||
| Reliability | REL3 | ||||
| REL4 | |||||
| REL2 | |||||
| REL1 | |||||
| Tangibles | TA3 | ||||
| TA2 | |||||
| TA1 | |||||
| TA4 | |||||
| TA5 | |||||
Then, in order to calculate the final weight of the criteria, the geometric means of the weights for all three teams were obtained and then normalized. The final results are shown in Table 6. In this table, the first column shows the final weights of the first team, which is presented in the last column of Table 5. Note, however, that the data in Table 5 are entered based on the priority of the criteria, and therefore some values have been substituted with each other to transfer to Table 6. The next two columns are the results of the weights for the other two teams (which are not presented in the text due to space constraints). The final column is the weights obtained from the geometric average weight of three different teams.
Table 6
Aggregation of the weights calculated by assessment teams.
| Criteria code | Team 1 | Team 2 | Team 3 | Aggregation | |
| Main | Responsiveness | ||||
| Reliability | |||||
| Assurance | |||||
| Empathy | |||||
| Tangibles | |||||
| Empathy | EM1 | ||||
| EM2 | |||||
| EM3 | |||||
| Assurance | AS1 | ||||
| AS2 | |||||
| AS3 | |||||
| AS4 | |||||
| Responsiveness | RES1 | ||||
| RES2 | |||||
| RES3 | |||||
| RES4 | |||||
| RES5 | |||||
| RES6 | |||||
| RES7 | |||||
| Reliability | REL1 | ||||
| REL2 | |||||
| REL3 | |||||
| REL4 | |||||
| Tangibles | TA1 | ||||
| TA2 | |||||
| TA3 | |||||
| TA4 | |||||
| TA5 | |||||
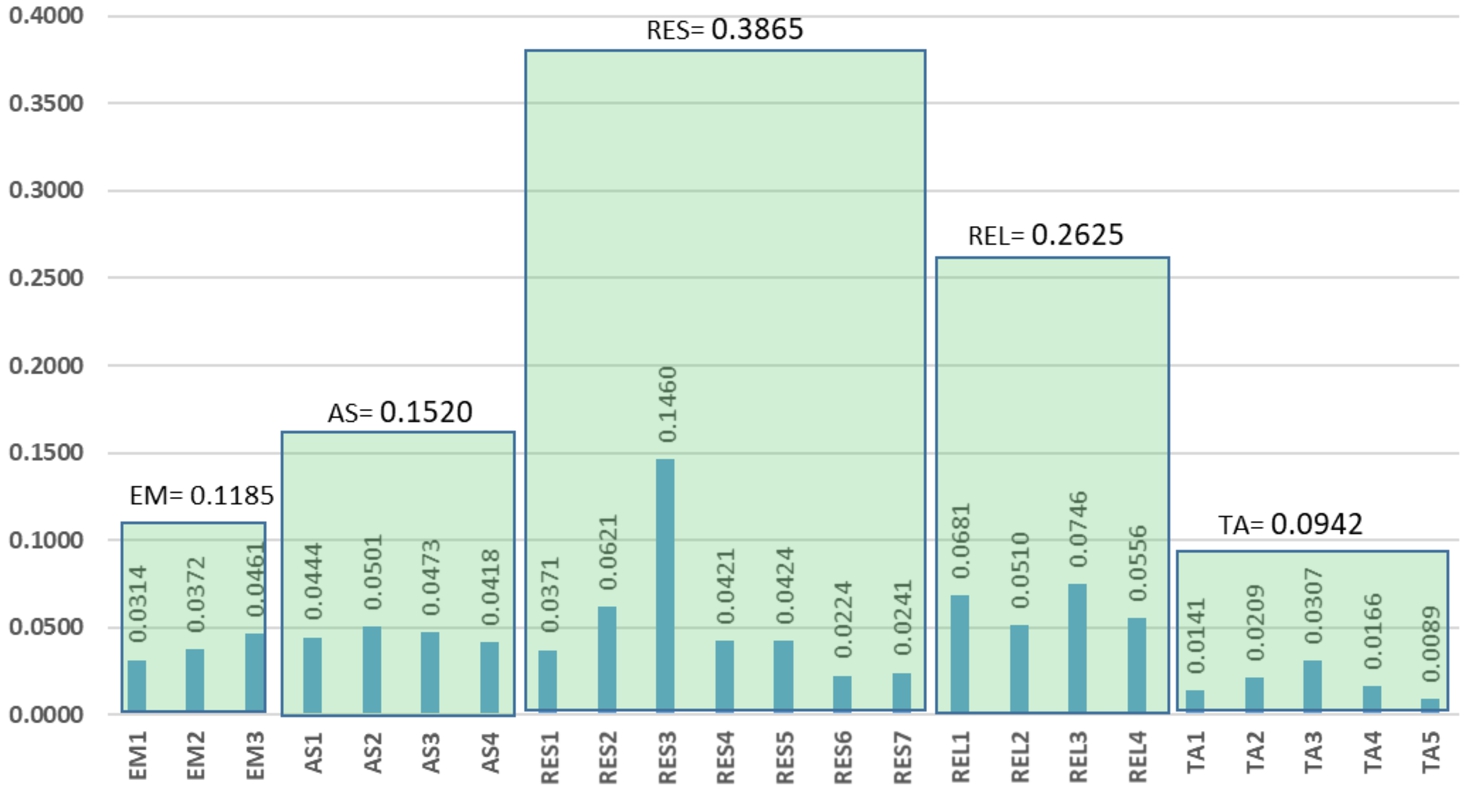
In order to create a suitable basis for display and analysis, the final values of the weights were calculated based on equation (6), the results of which are presented in Fig. 4.
Fig. 4
The final weight of the criteria based on the results of aggregating the opinions of evaluation teams.
Finally, the results of calculating the weight of the criteria were provided to the committee members and approved by them.
5.3Results of Additive Ratio Assessment Based on ARAS-IVTFN
As mentioned, although the main purpose of this article is to provide a framework for evaluating the quality of health services, it can also be used to rank hospitals and health centres. To show how it works in this area, an attempt was made to prioritize ten hospitals using the ARAS-IVTFN method.
According to the steps described in the research methodology, each of the selected teams presented their evaluation for each of the ten subordinate hospitals (H1–H10) based on the criteria of the final model in terms of linguistic variables presented in Table 3. Table 7 presents the evaluation of each hospital based on the identified criteria.
Table 7
Evaluation of each hospital based on the final criteria.
| Criteria | H1 | H2 | H3 | H4 | H5 | H6 | H7 | H8 | H9 | H10 | ||
| Team 1 | Empathy | EM1 | H | H | H | H | H | VH | VH | M | VH | H |
| EM2 | H | H | H | H | VH | H | H | H | H | H | ||
| EM3 | H | H | H | H | VH | H | VH | H | H | H | ||
| Assurance | AS1 | VH | VH | H | H | VH | H | H | H | H | H | |
| AS2 | VH | VH | H | H | VH | H | H | H | H | H | ||
| AS3 | VH | VH | H | H | VH | H | H | H | H | H | ||
| AS4 | H | H | H | H | VH | H | VH | VH | H | H | ||
| Responsiveness | RES1 | H | H | H | H | VH | H | VH | VH | VH | VH | |
| RES2 | VH | VH | H | H | VH | H | VH | VH | H | H | ||
| RES3 | VH | VH | H | H | VH | H | VH | VH | VH | VH | ||
| RES4 | H | VH | H | H | VH | H | VH | VH | VH | VH | ||
| RES5 | H | H | H | H | VH | H | VH | VH | H | H | ||
| RES6 | VH | VH | VH | H | H | H | H | H | H | H | ||
| RES7 | VH | VH | VH | H | H | H | H | H | H | H | ||
| Reliability | REL1 | VH | VH | VH | H | H | H | H | H | H | H | |
| REL2 | VH | VH | VH | H | H | H | H | H | H | H | ||
| REL3 | VH | VH | VH | H | H | H | H | H | H | H | ||
| REL4 | VH | VH | VH | H | H | H | H | H | H | H | ||
| Tangibles | TA1 | VH | VH | VH | H | H | H | H | H | H | H | |
| TA2 | VH | VH | VH | M | H | H | H | M | H | H | ||
| TA3 | VH | VH | VH | H | H | H | H | H | H | H | ||
| TA4 | VH | VH | VH | M | H | H | H | M | H | H | ||
| TA5 | VH | VH | VH | H | H | H | H | H | H | H | ||
| Team 2 | Empathy | EM1 | H | VH | H | H | H | H | VH | H | H | VH |
| EM2 | H | H | H | H | H | H | H | H | H | H | ||
| EM3 | H | H | H | H | H | H | H | H | H | H | ||
| Criteria | H1 | H2 | H3 | H4 | H5 | H6 | H7 | H8 | H9 | H10 | ||
| Assurance | AS1 | VH | VH | VH | H | H | H | VH | M | VH | VH | |
| AS2 | H | VH | VH | H | H | H | VH | H | VH | VH | ||
| AS3 | M | H | H | M | M | M | H | H | H | H | ||
| AS4 | VH | VH | VH | VH | VH | VH | VH | H | VH | VH | ||
| Responsiveness | RES1 | VH | VH | VH | VH | VH | VH | VH | H | VH | VH | |
| RES2 | M | H | H | H | H | M | H | H | H | H | ||
| RES3 | M | H | H | H | M | H | H | H | H | H | ||
| RES4 | M | H | M | H | M | M | M | M | H | H | ||
| RES5 | H | H | H | H | H | H | H | M | H | H | ||
| RES6 | VH | VH | VH | H | VH | H | VH | VH | VH | VH | ||
| RES7 | VH | VH | VH | H | H | VH | VH | VH | VH | VH | ||
| Reliability | REL1 | VH | VH | VH | H | H | VH | H | H | H | H | |
| REL2 | H | H | H | H | H | H | H | H | H | H | ||
| REL3 | VH | VH | VH | H | H | H | H | H | H | H | ||
| REL4 | H | H | VH | H | H | H | H | H | H | H | ||
| Tangibles | TA1 | VH | VH | VH | VH | H | H | H | M | VH | VH | |
| TA2 | VH | VH | VH | H | VH | H | VH | M | VH | VH | ||
| TA3 | VH | VH | VH | H | VH | VH | VH | H | VH | VH | ||
| TA4 | VH | VH | VH | H | VH | H | VH | M | VH | VH | ||
| TA5 | VH | VH | VH | VH | VH | VH | VH | M | H | VH | ||
| Team 3 | Empathy | EM1 | VH | VH | VH | H | H | VH | VH | VL | M | VH |
| EM2 | VH | VH | VH | H | H | VH | VH | M | M | VH | ||
| EM3 | VH | VH | VH | H | H | VH | VH | M | M | VH | ||
| Assurance | AS1 | VH | VH | VH | H | H | VH | VH | M | M | VH | |
| AS2 | VH | VH | VH | H | H | VH | VH | M | M | VH | ||
| AS3 | VH | VH | VH | H | H | VH | VH | M | M | VH | ||
| AS4 | VH | VH | VH | H | H | VH | VH | M | M | VH | ||
| Responsiveness | RES1 | VH | VH | VH | H | H | VH | VH | M | M | VH | |
| RES2 | H | H | H | M | M | H | L | L | H | H | ||
| RES3 | H | H | M | H | H | M | M | L | L | VH | ||
| RES4 | VH | VH | VH | H | H | VH | VH | M | M | VH | ||
| RES5 | VH | VH | VH | H | H | VH | VH | M | M | VH | ||
| RES6 | VH | VH | VH | H | H | VH | VH | M | M | VH | ||
| RES7 | VH | VH | VH | H | H | VH | VH | M | M | VH | ||
| Reliability | REL1 | VH | VH | VH | H | H | VH | VH | M | M | VH | |
| REL2 | VH | VH | VH | H | H | VH | VH | M | M | VH | ||
| REL3 | VH | VH | VH | H | H | VH | VH | M | M | VH | ||
| REL4 | VH | VH | VH | H | H | VH | VH | M | M | VH | ||
| Tangibles | TA1 | VH | VH | VH | H | H | VH | VH | M | M | VH | |
| TA2 | VH | VH | VH | H | H | VH | VH | M | M | VH | ||
| TA3 | VH | VH | VH | H | H | VH | VH | M | M | VH | ||
| TA4 | VH | VH | VH | H | H | VH | VH | M | M | VH | ||
| TA5 | VH | VH | VH | H | H | VH | VH | M | M | VH | ||
Then, the linguistic variables were replaced by their corresponding IVTFNs. Subsequently, in order to aggregate the opinions and compile the final evaluation table, the evaluation results of different teams were averaged. The results are presented in Appendix A.
After creating the aggregated decision matrix, it was normalized based on Eq. (10) and then the weighted normalized decision matrix was calculated based on Eq. (12) and using the weights obtained in the previous step. The results are shown in Appendix B.
Finally, the overall performance index for each alternative (
Table 8
Final ranking results for different values of λ.
| Ideal | ||||||||||
| BNP | Rank | BNP | Rank | BNP | Rank | |||||
| Alternative | 0.516 | 1.000 | 0 | 0.517 | 1.000 | 0 | 0.519 | 1.000 | 0 | |
| Hospital 1 | 0.488 | 0.947 | 3 | 0.488 | 0.943 | 3 | 0.487 | 0.938 | 3 | |
| Hospital 2 | 0.505 | 0.979 | 1 | 0.505 | 0.977 | 1 | 0.506 | 0.975 | 1 | |
| Hospital 3 | 0.488 | 0.946 | 4 | 0.487 | 0.941 | 4 | 0.486 | 0.935 | 4 | |
| Hospital 4 | 0.452 | 0.876 | 8 | 0.445 | 0.859 | 8 | 0.438 | 0.843 | 8 | |
| Hospital 5 | 0.459 | 0.891 | 7 | 0.455 | 0.879 | 7 | 0.450 | 0.867 | 7 | |
| Hospital 6 | 0.467 | 0.905 | 6 | 0.463 | 0.894 | 6 | 0.459 | 0.884 | 6 | |
| Hospital 7 | 0.476 | 0.924 | 5 | 0.475 | 0.918 | 5 | 0.474 | 0.912 | 5 | |
| Hospital 8 | 0.391 | 0.759 | 10 | 0.385 | 0.745 | 10 | 0.379 | 0.730 | 10 | |
| Hospital 9 | 0.415 | 0.806 | 9 | 0.410 | 0.792 | 9 | 0.404 | 0.778 | 9 | |
| Hospital 10 | 0.491 | 0.953 | 2 | 0.490 | 0.946 | 2 | 0.488 | 0.940 | 2 | |
6Comparison and Discussion
6.1Comparison of the Proposed Ranking Method with Previous Methods
In order to evaluate the stability of the results of the model, the results have been compared with the results of three methods: SAW-IVTFN, TOPSIS-IVTFN (Chai and Zhou, 2022) and VIKOR-IVTFN (Zhou and Xu, 2018). The final ranking based on these methods is presented in Table 9. The selection of these methods is due to their extensive use in previous studies.
Table 9
Comparison of rankings of methods with the proposed approach.
| Alternatives | ARAS-IVTFN | TOPSIS-IVTFN | SAW-IVTFN | VIKOR-IVTFN |
| Hospital 1 | 3 | 3 | 3 | 3 |
| Hospital 2 | 1 | 1 | 1 | 1 |
| Hospital 3 | 4 | 4 | 4 | 4 |
| Hospital 4 | 8 | 7 | 8 | 8 |
| Hospital 5 | 7 | 6 | 7 | 7 |
| Hospital 6 | 6 | 8 | 6 | 6 |
| Hospital 7 | 5 | 5 | 5 | 5 |
| Hospital 8 | 10 | 10 | 10 | 10 |
| Hospital 9 | 9 | 9 | 9 | 9 |
| Hospital 10 | 2 | 2 | 2 | 2 |
As this table shows, the ranks of most alternatives are the same in different methods. The insignificant differences show that the results of the applied model have an acceptable level of stability.
6.2Managerial Implications
Based on the current research findings, the most important dimension of quality of health care services is Responsiveness (0.3865) and among the different items of this dimension, the time allotted to answer patients’ questions and ambiguities, as well as demands and the internal willingness of the staff to respond to and meet the needs of patients have been given the highest priority.
Following this dimension, Reliability (0.2625) is the next priority. Among the various items of this dimension, the credibility of the hospital shows the highest importance. Assurance is the third important dimension among the dimensions that shape the quality of services studied in this research (0.1520) and accurate description of the patient’s medical condition by staff is the most important component of this dimension. Empathy is the fourth most important dimension in the evaluation of service quality by patients (0.1185) and special attention to patients by staff is the most important component of this dimension of service quality. A look at the obtained results reveals that the last priority in evaluating the quality of services was allocated to Tangibles (0.0942). In this dimension, based on the items, we can refer to modern and up-to-date equipment, which have the highest importance. A discussion of the priorities obtained for each of the dimensions shaping the quality of health care services is presented below.
Responsiveness is the highest priority among all aspects of health service quality. Responsiveness means willingness and readiness to help patients and provide services at the right time. A look at the constituent items of this dimension of the quality of health care services shows that answering patients’ questions is the most important item. The importance of this indicator in evaluating the quality of health care services by patients has been emphasized in many recent studies (Singh, 2019; Otay et al., 2017; AlOmari, 2020). Given the important role that health care services play in ensuring the health of patients, the ambiguity that patients usually have about the disease and the methods of treatment, is one of their most important concerns. Therefore, accurate response to these ambiguities can be one of the most important factors in increasing the quality of services provided to patients. The significance of inner desire of service personnel to respond and provide correct answers willingly and wholeheartedly as one of the important factors for the quality of health care services shown in this study is in line with previous research (AlOmari, 2020).
Reliability is another important dimension for the quality of health care services which according to the results of this study, has the next highest importance after responsiveness. Reliability means the ability of a health care provider to provide accurate and error-free services to patients. Given the importance of these services in the health and life of patients, without a doubt, providing accurate and error-free services with high organization and reliability in the promised time can play an important role in improving the quality of health care services provided to patients (Singh et al., 2020).
Assurance is the third priority among SERVQUAL dimensions. The knowledge, politeness and decency of service providers are some items of this dimension, which can ensure the quality of services received by patients. In addition, safe medical equipment plays an important role in improving the assurance of services provided to patients. The service nature of health care services leads to the fact that service providers have a special importance in shaping patients’ perceptions of the quality of health care services and play a significant role in satisfying patients. This finding is consistent with the findings of other previous studies that emphasize the role and importance of health care providers (Altuntas et al., 2012).
Empathy involves paying special attention to patients and understanding their specific needs and striving to meet those needs as much as possible. Based on the obtained results and considering the priorities of the items of this dimension, understanding the specific needs of patients alone is not enough and the main priority is to try to meet those needs as much as possible. The importance of this item is such that in some studies this parameter has been mentioned as the most important parameter for patients in evaluating the quality of health care services (Singh et al., 2020). The importance of empathy as a significant indicator in evaluating the quality of services of health organizations in Iran has been confirmed in previous studies (Afkham et al., 2012).
Among all dimensions of health care services quality, the lowest priority was given to tangibles. This finding is in line with the results of Singh and Prasher (2019) and Singh et al. (2020), which introduced this parameter as one of the low priority parameters in weighting the factors affecting the quality of health services. In interpreting this result, one should bear in mind that low priority does not in any way mean the low importance of this parameter, but indicates a lower priority compared to other factors. The friendly, clean and comfortable environment of the hospital along with the good appearance of the staff are some factors that can affect patients’ perception of tangibles in assessing the quality of services. Complete and new hospital equipment as another item of this dimension, is of the highest importance.
Findings related to the ranking of hospitals in terms of service quality performance also showed that Hospital 4 has the highest rank and the best hospital service quality among the ten hospitals, which is obviously due to the better performance of this hospital based on the service quality parameters with a higher weight. It is followed by Hospital 4, 2, 1 and 6.
7Conclusions
Improving the quality of health care services has always been one of the challenges for industry managers. This challenge has been created in response to the pressure of increasing the competitiveness of health care providers that seek to raise customer awareness about the services received. Reasons that have made the development and implementation of service quality improvement strategies in the health care industry a challenging issue are the complexities of this industry due to the risky nature of services provided to patients, the direct relationship of these services with patients’ health and life and the influence of various factors such as differences in patients’ conditions on the quality of perceived services. Also, the breadth of dimensions and items affecting the quality of services from the patient-centred approach is one of the key issues for health care providers in planning to improve the quality of services. Due to limited resources and lack of relevant research methods to identify and prioritize the most important aspects affecting the quality of health services, the results of this study can be of significant help to Iranian decision-makers.
Accordingly, this study tried to provide a new framework to help decision makers in identifying the most important dimensions and indicators for measuring the quality of health services from patients’ view point, a method for ranking hospitals and related medical centres that can address the challenges raised in this area. This article contributes to existing knowledge of health care service quality in several important ways.
The first innovation of this article is to propose a localized model for measuring the quality of health care services in a case study (hospitals operating in selected areas of Iran). In order to calculate the weight of the criteria and evaluate each hospital based on the selected criteria, instead of using the typical Likert scale with definite numbers, linguistic variables and IVTFNs were used which overcome the mentioned limitations of fuzzy numbers, such as the limitation on determining the exact value of the upper and lower bounds of the membership function. On the other hand, based on the knowledge of the authors, this is the first attempt to calculate the weight of health service quality criteria using the SWARA-IVTFN method. In order to show the efficiency of the developed framework in comparing the performance of different hospitals and health centres, the ARAS-IVTFN method was used to calculate the score of each hospital and the final ranking of alternatives.
From a management point of view, these findings can be a basis for helping health care managers to plan service quality improvement strategies; since recognizing different aspects of quality and being aware of deviations in each dimension compared to the situation of other competitors can lead to correction and, ultimately, improvement of the quality of services. Undoubtedly, paying attention to improving the quality of services by increasing patient satisfaction with the services received can play an important role in promoting competitiveness and performance of the organizations providing health services. In this regard, it is recommended that future researchers use frameworks such as importance performance analysis (IPA) in their studies. In addition, since the identified criteria are not independent of each other, methods such as DANP can be used to model the relationships between the criteria and calculate their weights. Another important point in evaluation is the use of periodic data instead of evaluation based on findings of only one period, which can be considered as dynamic multi-attribute decision-making (DMADM) frameworks.
Appendices
Appendix A. Aggregated Decision Table Based on Hospital Service Quality Evaluation Criteria
| Criteria | IDEAL | H1 | H2 | |
| Empathy | EM1 | |||
| EM2 | ||||
| EM3 | ||||
| Assurance | AS1 | |||
| AS2 | ||||
| AS3 | ||||
| AS4 | ||||
| Responsiveness | RES1 | |||
| RES2 | ||||
| RES3 | ||||
| RES4 | ||||
| RES5 | ||||
| RES6 | ||||
| RES7 | ||||
| Reliability | REL1 | |||
| REL2 | ||||
| REL3 | ||||
| REL4 | ||||
| Tangibles | TA1 | |||
| TA2 | ||||
| TA3 | ||||
| TA4 | ||||
| TA5 | ||||
| Criteria | H3 | H4 | H5 | |
| Empathy | EM1 | |||
| EM2 | ||||
| EM3 | ||||
| Assurance | AS1 | |||
| AS2 | ||||
| AS3 | ||||
| AS4 | ||||
| Responsiveness | RES1 | |||
| RES2 | ||||
| RES3 | ||||
| RES4 | ||||
| RES5 | ||||
| RES6 | ||||
| RES7 | ||||
| Reliability | REL1 | |||
| REL2 | ||||
| REL3 | ||||
| REL4 | ||||
| Criteria | H6 | H7 | H8 | |
| Empathy | EM1 | |||
| EM2 | ||||
| EM3 | ||||
| Assurance | AS1 | |||
| AS2 | ||||
| AS3 | ||||
| AS4 | ||||
| Responsiveness | RES1 | |||
| RES2 | ||||
| RES3 | ||||
| RES4 | ||||
| RES5 | ||||
| RES6 | ||||
| RES7 | ||||
| Reliability | REL1 | |||
| REL2 | ||||
| REL3 | ||||
| REL4 | ||||
| Tangibles | TA1 | |||
| TA2 | ||||
| TA3 | ||||
| TA4 | ||||
| TA5 | ||||
| Criteria | H9 | H10 | ||
| Empathy | EM1 | 8.291 | ||
| EM2 | 8.469 | |||
| EM3 | 8.486 | |||
| Assurance | AS1 | 8.535 | ||
| AS2 | 8.584 | |||
| AS3 | 8.206 | |||
| AS4 | 8.649 | |||
| Responsiveness | RES1 | 8.681 | ||
| RES2 | 7.957 | |||
| RES3 | 7.932 | |||
| RES4 | 8.109 | |||
| RES5 | 8.433 | |||
| RES6 | 8.633 | |||
| RES7 | 8.634 | |||
| Reliability | REL1 | 8.57 | ||
| REL2 | 8.503 | |||
| REL3 | 8.554 | |||
| REL4 | 8.52 | |||
| Tangibles | TA1 | 8.535 | ||
| TA2 | 8.418 | |||
| TA3 | 8.635 | |||
| TA4 | 8.418 | |||
| TA5 | 8.57 | |||
Appendix B. Weighted Normalized Decision Table
| Criteria | IDEAL | H1 | H2 | |
| Empathy | EM1 | |||
| EM2 | ||||
| EM3 | ||||
| Assurance | AS1 | |||
| AS2 | ||||
| AS3 | ||||
| AS4 | ||||
| Responsiveness | RES1 | |||
| RES2 | ||||
| RES3 | ||||
| RES4 | ||||
| RES5 | ||||
| RES6 | ||||
| RES7 | ||||
| Reliability | REL1 | |||
| REL2 | ||||
| REL3 | ||||
| REL4 | ||||
| Tangibles | TA1 | |||
| TA2 | ||||
| TA3 | ||||
| TA4 | ||||
| TA5 | ||||
| Criteria | H3 | H4 | H5 | |
| Empathy | EM1 | |||
| EM2 | ||||
| EM3 | ||||
| Assurance | AS1 | |||
| AS2 | ||||
| AS3 | ||||
| AS4 | ||||
| Responsiveness | RES1 | |||
| RES2 | ||||
| RES3 | ||||
| RES4 | ||||
| RES5 | ||||
| RES6 | ||||
| RES7 | ||||
| Reliability | REL1 | |||
| REL2 | ||||
| REL3 | ||||
| REL4 | ||||
| Tangibles | TA1 | |||
| TA2 | ||||
| TA3 | ||||
| TA4 | ||||
| TA5 | ||||
| Criteria | H6 | H7 | H8 | |
| Empathy | EM1 | |||
| EM2 | ||||
| EM3 | ||||
| Assurance | AS1 | |||
| AS2 | ||||
| AS3 | ||||
| AS4 | ||||
| Responsiveness | RES1 | |||
| RES2 | ||||
| RES3 | ||||
| RES4 | ||||
| RES5 | ||||
| RES6 | ||||
| RES7 | ||||
| Reliability | REL1 | |||
| REL2 | ||||
| REL3 | ||||
| REL4 | ||||
| Tangibles | TA1 | |||
| TA2 | ||||
| TA3 | ||||
| TA4 | ||||
| TA5 | ||||
| Criteria | H9 | H10 | |
| Empathy | EM1 | ||
| EM2 | |||
| EM3 | |||
| Assurance | AS1 | ||
| AS2 | |||
| AS3 | |||
| AS4 | |||
| Responsiveness | RES1 | ||
| RES2 | |||
| RES3 | |||
| RES4 | |||
| RES5 | |||
| RES6 | |||
| RES7 | |||
| Reliability | REL1 | ||
| REL2 | |||
| REL3 | |||
| REL4 | |||
| Tangibles | TA1 | ||
| TA2 | |||
| TA3 | |||
| TA4 | |||
| TA5 | |||
References
1 | Afkham, L., Abdi, F., Komijan, A. ((2012) ). Evaluation of service quality by using fuzzy MCDM: a case study in Iranian health-care centers. Management Science Letters, 2: , 291–300. |
2 | Akdag, H., Kalaycı, T., Karagöz, S., Zülfikar, H., Giz, D. ((2014) ). The evaluation of hospital service quality by fuzzy MCDM. Applied Soft Computing, 23: , 239–248. |
3 | AlOmari, F. ((2020) ). Measuring gaps in healthcare quality using SERVQUAL model: challenges and opportunities in developing countries. Measuring Business Excellence, 25: (4), 407–420. |
4 | Altuntas, S., Kansu, S. ((2019) ). An innovative and integrated approach based on SERVQUAL, QFD and FMEA for service quality improvement: a case study. Kybernetes, 49: (10), 2419–2453. |
5 | Altuntas, S., Dereli, T., Yilmaz, M.K. ((2012) ). Multi-criteria decision making methods based weighted SERVQUAL scales to measure perceived service quality in hospitals: a case study from Turkey. Total Quality Management & Business Excellence, 23: , 1379–1395. |
6 | Ampaw, E.M., Chai, J., Liang, B., Tsai, S.B., Frempong, J. ((2020) ). Assessment on health care service quality and patients’ satisfaction in Ghana. Kybernetes, 49: (12), 3047–3068. |
7 | Asiamah, N., Adu-Gyamfi, K., Frimpong, F.K.S., Avor, W.M.K. ((2021) ). Development of a scale measuring nurses’ physical activity counseling in a primary care facility: implications for healthcare quality. Hospital Topics, 99: (3), 119–129. |
8 | Aydin, O., Pakdil, F. ((2008) ). Fuzzy SERVQUAL analysis in airline services. Organizacija, 41: (3), 108–115. |
9 | Babakus, E., Boller, G.W. ((1992) ). An empirical assessment of the SERVQUAL scale. Journal of Business Research, 24: (3), 253–268. |
10 | Bahadori, M., Ravangard, R., Alimohammadzadeh, K., Hosseini, S.M. ((2015) ). Plan and road map for health reform in Iran. BMJ, 18: , 351. |
11 | Behdioğlu, S., Acar, E., Burhan, H.A. (2017). Evaluating service quality by fuzzy SERVQUAL: a case study in a physiotherapy and rehabilitation hospital. Total Quality Management & Business Excellence, 1–19. |
12 | Behdioğlu, S., Acar, E., Burhan, H.A. ((2019) ). Evaluating service quality by fuzzy SERVQUAL: a case study in a physiotherapy and rehabilitation hospital. Total Quality Management & Business Excellence, 30: (3–4), 301–319. |
13 | Beheshtinia, M.A., Omidi, S. ((2017) ). A hybrid MCDM approach for performance evaluation in the banking industry. Kybernetes, 46: (8), 1386–1407. |
14 | Boller, C., Wyss, K., Mtasiwa, D., Tanner, M. ((2003) ). Quality and comparison of antenatal care in public and private providers in the United Republic of Tanzania. Bulletin of the World Health Organization, 81: (2), 116–122. |
15 | Boltürk, E., Kahraman, C. ((2022) ). Interval-valued and circular intuitionistic fuzzy present worth analyses. Informatica, 33: (4), 693–711. |
16 | Bowers, M.R., Kiefe, C.I. ((2002) ). Measuring health care quality: comparing and contrasting the medical and the marketing approaches. American Journal of Medical Quality, 17: (4), 136–144. |
17 | Buawangpong, N., Pinyopornpanish, K., Jiraporncharoen, W., Dejkriengkraikul, N., Sagulkoo, P., Pateekhum, C., Angkurawaranon, C. ((2020) ). Incorporating the patient-centered approach into clinical practice helps improve quality of care in cases of hypertension: a retrospective cohort study. BMC Family Practice, 21: , 108. |
18 | Burns, L.R. (Ed.) ((2014) ). India’s Healthcare Industry: Innovation in Delivery, Financing, and Manufacturing. Cambridge University Press. |
19 | Buttle, F. ((1996) ). SERVQUAL: review, critique, research agenda. European Journal of Marketing, 30: (1), 8–32. |
20 | Büyüközkan, G., Çifçi, G., Güleryüz, S. ((2011) ). Strategic analysis of healthcare service quality using fuzzy AHP methodology. Expert Systems with Applications, 38: (8), 9407–9424. |
21 | Carlucci, D., Renna, P., Schiuma, G. ((2013) ). Evaluating service quality dimensions as antecedents to outpatient satisfaction using back propagation neural network. Health Care Management Science, 16: (1), 37–44. |
22 | Carman, J.M. ((1990) ). Consumer perceptions of service quality: an assessment of T. Journal of Retailing, 66: (1), 33. |
23 | Chai, N., Zhou, W. ((2022) ). A novel hybrid MCDM approach for selecting sustainable alternative aviation fuels in supply chain management. Fuel, 327: , 125180. |
24 | Chen, S.H., Yeh, T.M. ((2015) ). Integration PEM and AHP methods to determine service quality improvement strategy for the medical industry. Applied Mathematics & Information Sciences, 9: (6), 3073–3082. |
25 | Choi, K.S., Lee, H., Kim, C., Lee, S. ((2005) ). The service quality dimensions and patient satisfaction relationships in South Korea: comparisons across gender, age and types of service. Journal of Services Marketing, 19: (3), 140–149. |
26 | Coulthard, L.J.M. ((2004) ). A review and critique of research using SERVQUAL. International Journal of Market Research, 46: (4), 479–497. |
27 | Dahooie, J.H., Zavadskas, E.K., Abolhasani, M., Vanaki, A., Turskis, Z. ((2018) ). A novel approach for evaluation of projects using an interval-valued fuzzy additive ratio assessment (ARAS) method: a case study of oil and gas well drilling projects. Symmetry, 10: (2), 45. |
28 | Dahooie, J.H., Vanaki, A.S., Mohammadi, N. ((2019) ). Choosing the appropriate system for cloud computing implementation by using the interval-valued intuitionistic fuzzy CODAS multiattribute decision-making method (case study: faculty of new sciences and technologies of Tehran University). IEEE Transactions on Engineering Management, 67: (3), 855–868. |
29 | Dahooie, J.H., Meidute-Kavaliauskiene, I., Vanaki, A.S., Podviezko, A., Abadi, E.B.J. ((2020) ). Development of a firm export performance measurement model using a hybrid multi-attribute decision-making method. Management Decision, 58: (11), 2349–2385. |
30 | Dahooie, J.H., Estiri, M., Janmohammadi, M., Zavadskas, E.K., Turskis, Z. ((2022) ). A novel advertising media selection framework for online games in an intuitionistic fuzzy environment. Oeconomia Copernicana, 13: (1), 109–150. |
31 | Dehnavieh, R., Haghdoost, A.A., Majdzadeh, R., Noorihekmat, S., Ravaghi, H., Mehrolhasani, M.H., Barati, O., Salari, H., Masoud, A., Poursheikhali, A., Mirshekari, N., Ghasemi, S., Esfandiary, A. ((2018) ). Quality of health services of the islamic republic of Iran: status, barriers and improvement strategies. Iranian Journal of Epidemiology, 13(Special Issue): , 98–109. |
32 | Deng, W.J., Pei, W. ((2009) ). Fuzzy neural based importance-performance analysis for determining critical service attributes. Expert Systems with Applications, 36: (2), 3774–3784. |
33 | Donabedian, A. ((1988) ). The quality of care: how can it be assessed? Jama, 260: (12), 1743–1748. |
34 | Doshmangir, L., Bazyar, M., Najafi, B., Haghparast-Bidgoli, H. ((2019) ). Health financing consequences of implementing health transformation plan in Iran: achievements and challenges. International Journal of Health Policy and Management, 8: (6), 384. |
35 | Fatima, T., Malik, S.A., Shabbir, A. ((2018) ). Hospital healthcare service quality, patient satisfaction and loyalty. International Journal of Quality & Reliability Management, 35: (6), 1195–1214. |
36 | Ferreira, D.C., Marques, R.C. ((2016) ). Should inpatients be adjusted by their complexity and severity for efficiency assessment? Evidence from Portugal. Health Care Management Science, 19: (1), 43–57. |
37 | Ferreira, D.C., Marques, R.C., Nunes, A.M., Figueira, J.R. ((2018) ). Patients’ satisfaction: the medical appointments valence in Portuguese public hospitals. Omega, 80: , 58–76. |
38 | Ferreira, D.C., Soares, R., Pedro, M.I., Marques, R.C. ((2021) ). Customer satisfaction in the presence of imperfect knowledge of data. International Transactions in Operational Research, 30: (3), 1505–1536. |
39 | Ghorabaee, M.K., Zavadskas, E.K., Amiri, M., Esmaeili, A. ((2016) ). Multi-criteria evaluation of green suppliers using an extended WASPAS method with interval type-2 fuzzy sets. Journal of Cleaner Production, 137: , 213–229. |
40 | Gill, L., White, L. ((2009) ). A critical review of patient satisfaction. Leadership in Health Services, 22: (1), 8–19. |
41 | Ginter, P.M., Duncan, W.J., Swayne, L.E. ((2018) ). The Strategic Management of Health Care Organizations. John Wiley & Sons. |
42 | Gorzałczany, M.B. ((1987) ). A method of inference in approximate reasoning based on interval-valued fuzzy sets. Fuzzy Sets and Systems, 21: (1), 1–17. |
43 | Grigoroudis, E., Spyridaki, O. ((2003) ). Derived vs. stated importance in customer satisfaction surveys. Operational Research, 3: (3), 229–247. |
44 | Grönroos, C. ((1984) ). A service quality model and its marketing implications. European Journal of Marketing, 18: (4), 36–44. |
45 | Grönroos, C. ((1988) ). New competition in the service economy: the five rules of service. International Journal of Operations & Production Management, 8: (3), 9–19. |
46 | Hashemkhani Zolfani, S., Yazdani, M., Zavadskas, E.K. ((2018) ). An extended stepwise weight assessment ratio analysis (SWARA) method for improving criteria prioritization process. Soft Computing, 22: (22), 7399–7405. |
47 | Jun, M., Peterson, R.T., Zsidisin, G.A. ((1998) ). The identification and measurement of quality dimensions in health care: focus group interview results. Health Care Management Review, 23: (4), 81–96. |
48 | Kalepu, R.N.P. ((2014) ). Service quality in healthcare sector: an exploratory study on hospitals. IUP Journal of Marketing Management, 13: (1), 7–28. |
49 | Karabasevic, D., Zavadskas, E.K., Turskis, Z., Stanujkic, D. ((2016) ). The framework for the selection of personnel based on the SWARA and ARAS methods under uncertainties. Informatica, 27: (1), 49–65. |
50 | Karasan, A., Erdogan, M., Cinar, M. ((2022) ). Healthcare service quality evaluation: an integrated decision-making methodology and a case study. Socio-Economic Planning Sciences, 82: , 101234. |
51 | Keršuliene, V., Zavadskas, E.K., Turskis, Z. ((2010) ). Selection of rational dispute resolution method by applying new step-wise weight assessment ratio analysis (SWARA). Journal of Business Economics and Management, 11: (2), 243–258. |
52 | Kumar, V., Kalita, K., Chatterjee, P., Zavadskas, E.K., Chakraborty, S. ((2022) ). A SWARA-CoCoSo-based approach for spray painting robot selection. Informatica, 33: (1), 35–54. |
53 | La Fata, C.M., Lupo, T., Piazza, T. ((2019) ). Service quality benchmarking via a novel approach based on fuzzy ELECTRE III and IPA: an empirical case involving the Italian public healthcare context. Health Care Management Science, 22: (1), 106–120. |
54 | Lee, D. ((2017) ). HEALTHQUAL: a multi-item scale for assessing healthcare service quality. Service Business, 11: (3), 491–516. |
55 | Li, X., He, Z. ((2020) ). An integrated approach for evaluating hospital service quality with linguistic preferences. International Journal of Production Research, 59: (6), 1776–1790. |
56 | Liao, H., Wu, X., Mi, X., Herrera, F. ((2020) ). An integrated method for cognitive complex multiple experts multiple criteria decisions making based on ELECTRE III with weighted Borda rule. Omega, 93: , 102052. |
57 | Lim, P.C., Tang, N.K. ((2000) ). A study of patients’ expectations and satisfaction in Singapore hospitals. International Journal of Health Care Quality Assurance, 13: (7), 290–299. |
58 | Liu, N., Xu, Z. ((2021) ). An overview of ARAS method: theory development, application extension, and future challenge. International Journal of Intelligent Systems, 36: (7), 3524–3565. |
59 | Liu, P., Li, Y. ((2021) ). An improved failure mode and effect analysis method for multi-criteria group decision-making in green logistics risk assessment. Reliability Engineering & System Safety, 215: , 107826. |
60 | Liu, P., Zhu, B., Seiti, H., Yang, L. ((2021) ). Risk-based decision framework based on R-numbers and best-worst method and its application to research and development project selection. Information Sciences, 571: , 303–322. |
61 | Liu, P., Li, Y., Zhang, X., Pedrycz, W. ((2022) ). A multiattribute group decision-making method with probabilistic linguistic information based on an adaptive consensus reaching model and evidential reasoning. IEEE Transactions on Cybernetics, 53: (3), 1905–1919. |
62 | Lucadamo, A., Camminatiello, I., D’Ambra, A. ((2021) ). A statistical model for evaluating the patient satisfaction. Socio-Economic Planning Sciences, 73: , 100797. |
63 | Lupo, T. ((2015) ). Fuzzy ServPerf model combined with ELECTRE III to comparatively evaluate service quality of international airports in Sicily. Journal of Air Transport Management, 42: , 249–259. |
64 | Lupo, T. ((2016) ). A fuzzy framework to evaluate service quality in the healthcare industry: an empirical case of public hospital service evaluation in Sicily. Applied Soft Computing, 40: , 468–478. |
65 | Mahdavi, M., Parsaeian, M., Jaafaripooyan, E., Ghaffari, S. ((2018) ). Recent Iranian health system reform: an operational perspective to improve health services quality. International Journal of Health Policy and Management, 7: (1), 70–74. |
66 | Mardani, A., Hooker, R.E., Ozkul, S., Yifan, S., Nilashi, M., Sabzi, H.Z., Fei, G.C. ((2019) ). Application of decision making and fuzzy sets theory to evaluate the healthcare and medical problems: a review of three decades of research with recent developments. Expert Systems with Applications, 137: , 202–231. |
67 | Meesala, A., Paul, J. ((2018) ). Service quality, consumer satisfaction and loyalty in hospitals: thinking for the future. Journal of Retailing and Consumer Services, 40: , 261–269. |
68 | Mohammadian, A., Heidary Dahooie, J., Qorbani, A.R., Zavadskas, E.K., Turskis, Z. ((2021) ). A new multi-attribute decision-making framework for policy-makers by using interval-valued triangular fuzzy numbers. Informatica, 32: (3), 583–618. |
69 | Mostafa, M.M. ((2005) ). An empirical study of patients’ expectations and satisfactions in Egyptian hospitals. International Journal of Health Care Quality Assurance, 18: (7), 516–532. |
70 | Naidu, A. ((2009) ). Factors affecting patient satisfaction and healthcare quality. International Journal of Health Care Quality Assurance, 22: (4), 366–381. |
71 | Nemati, R., Bahreini, M., Pouladi, S., Mirzaei, K., Mehboodi, F. ((2020) ). Hospital service quality based on HEALTHQUAL model and trusting nurses at Iranian university and non-university hospitals: a comparative study. BMC Nursing, 19: , 118. |
72 | Otani, K., Waterman, B., Faulkner, K.M., Boslaugh, S., Burroughs, T.E., Dunagan, W.C. ((2009) ). Patient satisfaction: focusing on “excellent”. Journal of Healthcare Management, 54: (2), 93–102. |
73 | Otay, İ., Oztaysi, B., Onar, S.C., Kahraman, C. ((2017) ). Multi-expert performance evaluation of healthcare institutions using an integrated intuitionistic fuzzy AHP&DEA methodology. Knowledge-Based Systems, 133: , 90–106. |
74 | Pamucar, D., Yazdani, M., Montero-Simo, M.J., Araque-Padilla, R.A., Mohammed, A. ((2021) ). Multi-criteria decision analysis towards robust service quality measurement. Expert Systems with Applications, 170: , 114508. |
75 | Pandey, M.M. ((2016) ). Evaluating the service quality of airports in Thailand using fuzzy multi-criteria decision making method. Journal of Air Transport Management, 57: , 241–249. |
76 | Parasuraman, A., Zeithaml, V.A., Berry, L.L. ((1985) ). A conceptual model of service quality and its implications for future research. Journal of Marketing, 49: (4), 41–50. |
77 | Parasuraman, A., Zeithaml, V.A., Berry, L. ((1988) ). SERVQUAL: a multiple-item scale for measuring consumer perceptions of service quality. Journal of Retailing, 64: (1), 12–40. |
78 | Pekkaya, M., İmamoğlu Ö, P., Koca, H. ((2019) ). Evaluation of healthcare service quality via Servqual scale: an application on a hospital. International Journal of Healthcare Management, 12: (4), 340–347. |
79 | Rahim, A.I., Ibrahim, M.I., Musa, K.I., Chua, S.L., Yaacob, N.M. ((2021) ). Assessing patient-perceived hospital service quality and sentiment in Malaysian public hospitals using machine learning and Facebook reviews. International Journal of Environmental Research and Public Health, 18: (18), 9912. |
80 | Ranjbar, E.M., Bahrami, M., Zare, A.H., Arab, M., Nasiri, S., Hataminasab, H. ((2012) ). Analysis of SERVQUAL in Shahid Sadoghi hospital, Yazd, Iran. Hormozgan Medical Journal, 16: (4), 333–340. |
81 | Ranjbar, M., Bazyar, M., Jafari, H., Pakdaman, M., Pirasteh, V. ((2021) ). Investigating the effect of health transformation plan on the public hospitals performance indicators; a case study from Iran. BMC Health Services Research, 21: (1), 1133. |
82 | Rezaei, J. ((2015) ). Best-worst multi-criteria decision-making method. Omega, 53: , 49–57. |
83 | Rezaei, S., Rahimi, F.A., Arab, M., Jaafaripooyan, E. ((2016) ). Effects of the new health reform plan on the performance indicators of Hamedan university hospitals. Journal of School of Public Health and Institute of Public Health Research, 14: (2), 51–60 (in Persian). |
84 | Scobie, S., Thomson, R., McNeil, J.J., Phillips, P.A. ((2006) ). Measurement of the safety and quality of health care. Medical Journal of Australia, 184: (S10), S51–S55. |
85 | Sharifi, T., Hosseini, S.E., Mohammadpour, S., Javan-Noughabi, J., Ebrahimipour, H., Hooshmand, E. ((2021) ). Quality assessment of services provided by health centers in Mashhad, Iran: SERVQUAL versus HEALTHQUAL scales. BMC Health Services Research, 21: , 397. |
86 | Sharma, S., Conduit, J. ((2016) ). Cocreation culture in health care organizations. Journal of Service Research, 19: (4), 438–457. |
87 | Singh, A. ((2019) ). An integrated approach towards ranking hospitals using Fuzzy AHP and ELECTRE-I technique. International Journal of Healthcare Management, 14: (2), 499–508. |
88 | Singh, A., Prasher, A. ((2019) ). Measuring healthcare service quality from patients’ perspective: using fuzzy AHP application. Total Quality Management & Business Excellence, 30: (3–4), 284–300. |
89 | Singh, A., Prasher, A., Kaur, N. ((2020) ). Assessment of hospital service quality parameters from patient, doctor and employees’ perspectives. Total Quality Management & Business Excellence, 31: (13–14), 1467–1486. |
90 | Stanujkic, D. ((2015) ). Extension of the ARAS method for decision-making problems with interval-valued triangular fuzzy numbers. Informatica, 26: (2), 335–355. https://doi.org/10.15388/Informatica.2015.51. |
91 | Stević, Ž., Das, D.K., Tešić, R., Vidas, M., Vojinović, D. ((2022) ). Objective criticism and negative conclusions on using the fuzzy SWARA method in multi-criteria decision making. Mathematics, 10: (4), 635. |
92 | Tsai, W.H., Hsu, W., Chou, W.C. ((2011) ). A gap analysis model for improving airport service quality. Total Quality Management & Business Excellence, 22: (10), 1025–1040. |
93 | Vahdani, B., Mousavi, S.M., Tavakkoli-Moghaddam, R., Ghodratnama, A., Mohammadi, M. ((2014) ). Robot selection by a multiple criteria complex proportional assessment method under an interval-valued fuzzy environment. The International Journal of Advanced Manufacturing Technology, 73: (5–8), 687–697. |
94 | Vouri, H. (1982). Quality assurance of health services: principles and concepts. Public Health in Europe, 16. WHO, Copenhagen. |
95 | Wu, W.Y., Hsiao, S.W., Kuo, H.P. ((2004) ). Fuzzy set theory based decision model for determining market position and developing strategy for hospital service quality. Total Quality Management & Business Excellence, 15: (4), 439–456. |
96 | Yeşilada, F., Direktör, E. ((2010) ). Health care service quality: a comparison of public and private hospitals. African Journal of Business Management, 4: (6), 962–971. |
97 | Youssef, F.N., Nel, D., Bovaird, T. ((1996) ). Health care quality in NHS hospitals. International Journal of Health Care Quality Assurance, 9: (1), 15–28. |
98 | Yucesan, M., Gul, M. ((2020) ). Hospital service quality evaluation: an integrated model based on Pythagorean fuzzy AHP and fuzzy TOPSIS. Soft Computing, 24: (5), 3237–3255. |
99 | Zadeh, L.A. ((1965) ). Information and control. Fuzzy Sets, 8: (3), 338–353. |
100 | Zavadskas, E.K., Turskis, Z. ((2010) ). A new additive ratio assessment (ARAS) method in multicriteria decision-making. Technological and Economic Development of Economy, 16: (2), 159–172. |
101 | Zhou, X., Xu, Z. ((2018) ). An integrated sustainable supplier selection approach based on hybrid information aggregation. Sustainability, 10: (7), 2543. |


