
A Hybrid IF-FUCOM-GRA Approach and its Application to Determine Optimal Bacterial Concentrations on Mortar at Optimal Curing Day
Abstract
In this study, Intuitionistic Fuzzy Consistency Method (IF-FUCOM) and Grey Relation Analysis (GRA) were combined to assess the effects of Bacillus subtilis bacteria on concrete properties, as well as to determine the optimal bacteria concentration and curing day. Three different concentrations of bacteria were added to the mortar mixes, like 103, 105, and 107 cells/ml of water. Mortar samples were left to cure for 7 days, 14 days, and 28 days to evaluate compressive strength, water absorption, crack healing. According to the proposed algorithm, 105 bacteria are the optimal concentration, while 28 days is the ideal curing time.
1Introduction
Structures must become stronger, faster, and more versatile, as well as more durable, with a huge increase in the amount of cement used in the process. Most construction projects today use Portland cement concrete, which is the predominant type of concrete. Because of the low cost of construction materials and the ease of maintenance, concrete structures can be built and maintained.
Recent research found that a biomaterial can be used to treat concrete cracks (Van Tittelboom et al., 2010; Ramachandran et al., 2001). Scientists have discovered that inorganic substances that are deposited by microorganisms inside cement-sand mortar or the pores of concrete can be used for filling cracks (Ghosh et al., 2005; Ramakrishnan et al., 1999). A concrete structure’s inherent weakness is its vulnerability to cracks that allow water to penetrate, causing corrosion and reducing its durability (Chahal et al., 2012).
Ramachandran et al. (2001) pioneered microbial concrete, and since then there has been a considerable volume of research on the topic. As ureolytic bacteria are alkali-resistant and nutrition is not necessary for survival for hundreds of years, the researchers examined Bacillus sphaericus, Sporosarcina pasteurii, and Bacillus megaterium (Arunachalam et al., 2010; Dhami et al., 2013; Achal et al., 2011). In some studies, researchers examined the effects of adding bacteria to concrete on its compressive strength and crack healing. The findings reflect that most of them considered bacterial concentrations between 103 to 107 cells/ml when considering strength enhancement. Contrary to crack healing, researchers use higher concentrations of bacterial cells (107–109 cells/ml) (Majumdar et al., 2012; Mondal and Ghosh, 2018; De Muynck et al., 2008).
The versatility of concrete makes it a popular choice for building materials. Locally available, strong and durable, it is versatile. Despite its capability to resist compression loads to a limit, if the load applied on the concrete exceeds their limit of load resistance, it results in cracks in the concrete, which lowers its strength. Concrete’s serviceability limit is affected by cracks. Concrete may become weaker and less durable as moisture and other chemicals get into it. In addition to that, water absorption is another major issue that reduces the life of concrete. Researchers are currently using bacteria to treat concrete mortar to overcome the problems. The selection of an optimal bacteria concentration and curing day can also pose a problem. Grey Relational Analysis (GRA) can be used in this field to find an optimal solution, since various researchers use it in different fields as an optimization technique (Dagdevir and Ozceyhan, 2021; Güler et al., 2021; Roy et al., 2016; Si et al., 2021). A major drawback of GRA is that it assigns a similar weight to all output characteristics, even though in practice not all output characteristics are equally important (Fangfang, 2021). To overcome the problem, some researchers are using Analytical Hierarchy Process (AHP) along with GRA (Erdoğan and Sayin, 2018; Erdoğan et al., 2020). An advantage, as well as a reason for using the AHP method, is that results can be validated by determining the consistency of the model with actual data. A study suggests that comparing pairwise across nine criteria by the AHP method is extremely difficult since it requires a great deal of comparisons
The BWM has been shown to be able to resolve certain of the previously listed constraints associated with AHP models (Rezaei, 2015). Compared to AHP’s many pairwise comparisons, BWM does only a small number, such as
FUCOM uses pairwise comparisons of criteria to determine criteria priority, and it validates results across a wide range of deviations from maximum consistency in order to determine criteria priority (Pamučar et al., 2018b). As compared to BWM and AHP tools, FUCOM eliminates some of their weaknesses. When using FUCOM, criteria can be compared in pairs (
The drawback of fuzzy sets is that, in some circumstances, it can be quite challenging to determine a precise membership mapping for a fuzzy set (Chiao, 2016). An intuitionistic fuzzy set (IFS), which Krassimir and Parvathi proposed in 1986, is a generalized fuzzy set that considers membership and non-membership degrees, as well as hesitation degrees. IFS can handle ambiguous information in a flexible manner (Gong et al., 2014). As a result, specialists have been paying more and more attention to the IFS, which is now being used in many other domains, including decision-making (Gong et al., 2014). This study addresses a vacuum in the literature, since, as far as the authors are aware, the FUCOM has not yet been used to intuitionistic contexts. In fact, extending FUCOM’s research to the intuitionistic fuzzy environment is motivated in part by this.
In this study, Section 2 discusses IF-FUCOM-GRA, while Section 3 discusses step-by-step methodology with experimental details and results. Results of each method listed in Section 3 are presented in Section 4 in a step-by-step manner. Sections 5 and 6 represent the discussion and conclusion sections, respectively.
1.1 Motivation of the work:
I. However, despite the fact that many researchers have studied the effects of Bacillus subtilis bacteria on concrete properties, no studies have evaluated the optimal concentration of bacteria as per the above discussed literature. Therefore, the purpose of this study is to determine the optimal bacteria concentration as well as the effect of bacteria on concrete mortar.
II. Intuitionistic Fuzzy FUCOM Grey Relations Analysis has never been used to determine the optimal value in such an environment.
1.2 Novelty of the work:
I. In this paper, IF-FUCOM is developed that can be used to better define the weight coefficients of criteria.
II. A detailed algorithm is used in this study to calculate the weights of criteria in the intuitionistic fuzzy environment.
III. A new model for dealing with uncertainty bridges the gap between criteria weight coefficients and intuitionistic fuzzy numbers.
IV. In order to improve the methodology, a hybrid IF-FUCOM-GRA method has been proposed. It combines novel IF-FUCOM and existing GRA techniques.
V. In this study, the optimal bacteria concentration and curing day for concrete is determined based on its compressive strength, crack healing, and water absorption. The novel IF-FUCOM-GRA method is used to select the perfect bacteria and cure day.
2Intuitionistic Fuzzy Full Consistency Method Grey Relational Analysis (IF-FUCOM-GRA)
IF-FUCOM-AHP has two phases, IF-FUCOM and IF-AHP, which are discussed respectively in Phases I and II. Phase I and Phase II discussed how to analyse criteria and alternatives to determine the priority value of criteria and alternatives. Figure 1 depicts the proposed method’s computational procedure. Figure 1 illustrates how the method is computed.
Phase-1: Intuitionistic Fuzzy Full Consistency Method (IF-FUCOM):
Fig. 1
Total scenario of proposed method.
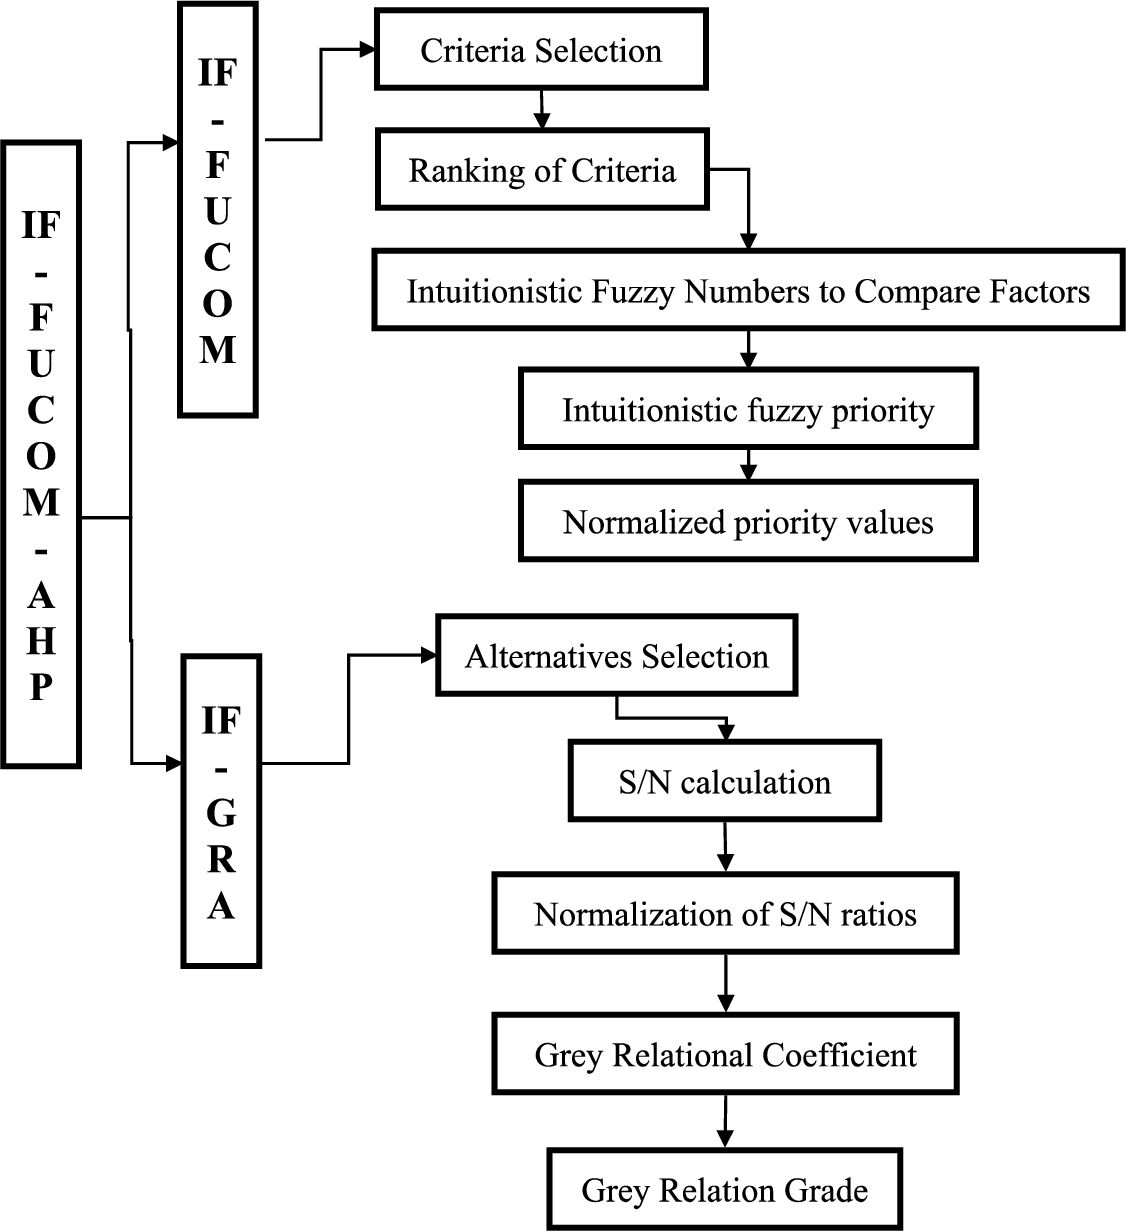
In order to determine the priority value of criteria, FUCOM is used. It is proposed that a modified fuzzy FUCOM approach is used in the current study called Intuitionistic Fuzzy Full Consistency Method (IF-FUCOM) to find the priority values of each criterion. Five steps make up IF-FUCOM. Following are the steps:
Step-I: Identify the assessment criteria: This consists of n
Step-II: Determine the ranking of factors: The DMs determine the order of importance of factors based on their opinions. A factor is ranked in ascending order by the weight coefficient that will be assigned to it first, and so on, down to the least significant factor in the equation. The factor whose weight coefficient is expected to be the lowest is ranked last. In the resulting ranking system,
Step-III: Use intuitionistic fuzzy numbers to compare factors: Table 1 is used to compare factors. The factors are compared according to the first ranking factor. The Intuitionistic fuzzy criterion meaning (
(1)
(2)
Step-IV: Calculate intuitionistic fuzzy priority: here, the Intuitionistic fuzzy priority value coefficients are calculated for factor
Table 1
Nine-point triangular intuitionistic fuzzy scale (Otay et al., 2017).
| Definition | Intensity of importance | Reverse of intensity importance | S.I. |
| EI | 1 | ||
| AI | 9 | ||
| MI | |||
| STI | |||
| VSI | |||
| Intermediate scale |
Condition 1: The weight coefficient ratio between the observed factors (
(3)
Condition 2: Besides satisfying the condition in expression (3), the coefficients of weights should also qualify as transitive, i.e.
(4)
The final nonlinear model for computing the ideal Intuitionistic fuzzy values of the relative weights of each factor can then be set to
(5)
The highest consistency can only be obtained by following the condition that
(6)
Convert optimal Intuitionistic fuzzy priority value
(7)
Step-V: Normalized priority values: equation (8) is used to calculate the normalized priority values of criteria.
(8)
Phase-2: Grey Relational Analysis:
Fig. 2
Graph of a straightforward grey relational analysis.
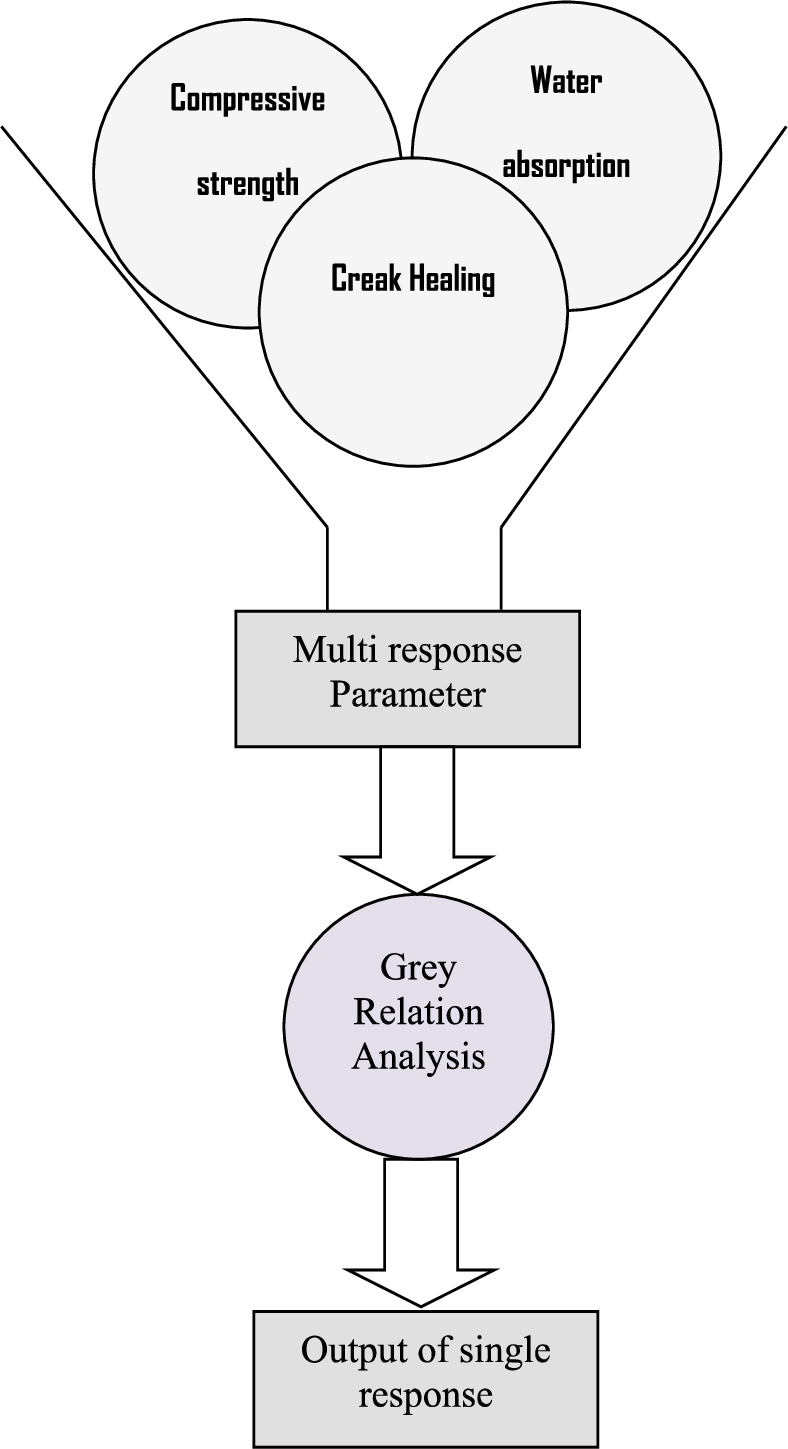
The grey theory is an immense concept used to explore uncertainty, multi-input, and discrete data. Decision analysis is used to estimate the degree of relation according to the grey relational grade. A multi-objective optimization makes it more complex to analyse the effects and relationships between design factors in experiments at their various levels that result uncertain and insignificant information. In this paper, GRA is proposed for investigating and optimizing the complexity of multi-variable problems by exploiting the concept of information. As shown in Fig. 2, GRA reduces a multi-objective question to a single objective answer (referred to as single relational grade).
The present study is conducted based upon Taguchi’s orthogonal array, which corresponds to nine trails, where every trail is known as a comparison sequence. The GRA places these trails into nine subsystems. The effect of these factors on the outcome variable is assessed through regression analysis. Using GRA, the multi-objective problem is transformed into a single-objective problem by using the parameters corresponding to the greatest weighted grey relational grade.
Step-I:
Greater, nominal, and lower signal-to-noise ratio analyses are the three possible approaches. For water absorption in this study, smaller-is-better, however, higher-is-better for compressive strength and creak healing. The
(9)
(10)
Step-II:
To lessen unpredictability, the
(11)
(12)
Step-III: Grey Relational Coefficient:
The GRC, a series of information, is used by GRA to assess the relevance of two systems. Equation (13) can be used to calculate GRC
(13)
Step-IV: Grey Relation Grade:
In real engineering systems, different parts have different weights based on the circumstances. Then, equation (14) grades the grey relational coefficient (GRC) (Saaty, 1980).
(14)
3Methodology
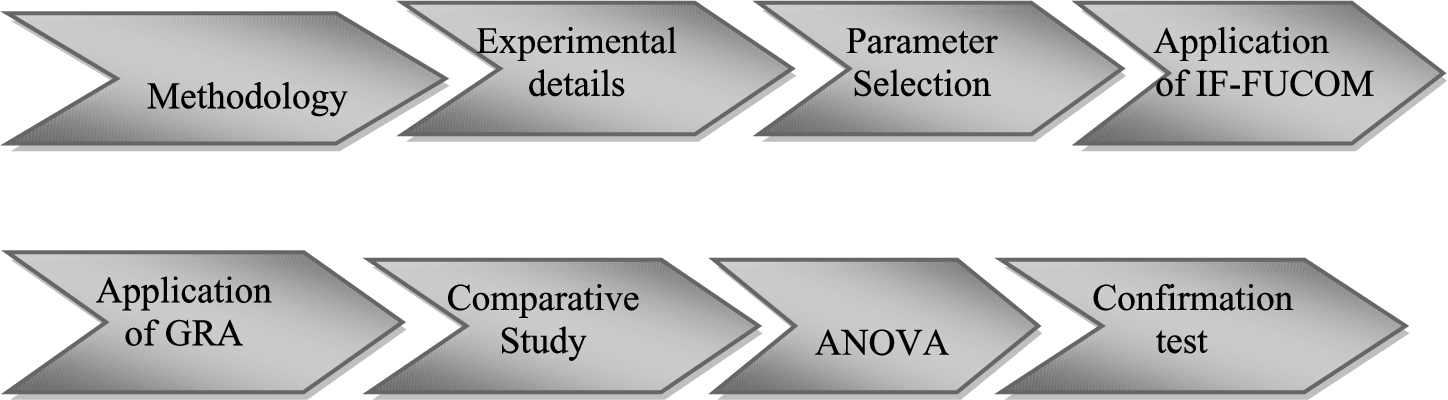
The objective of this study is to find the optimal bacterial concentrations and curing days for concrete simultaneously while considering compressive strength (CS), crack healing (CH) and water absorption (WA) as outputs using a novel MCDM technique. During the present investigation, there are six phases. A schematic representation of the detailed methodology is shown in Fig. 3.
Phase-I: The Experimental details include details on the materials, bacteria culture, mixing procedure, compression strength (
Phase-II: The criteria and alternatives were discussed in this phase.
Fig. 3
A diagrammatic representation of the methodology.
Phase-III: Determine the weights of all consideration criteria using the proposed MCDM method.
Phase-IV: Evaluate alternative weights using another existing MCDM technique.
Phase-V: Comparison of the results determined by the proposed MCDM with the existing model.
Phase-VI: An analysis is made of the degree to which each of the chosen parameter values contributes to the output responses.
Phase-VII: Validation tests are run to confirm forecasts and results.
Phase-VIII: Sensitivity analysis investigates how the indicators, which were calculated using the MCDM method, affect the anticipated result.
Phase-I. Experimental details:
This section explains the material choice, the bacteria mixing process, and several tests like compressive strength and water absorption.
Step-I. Materials:
Ordinary Portland Cement (OPC) 43 Grade conforms to IS 8112 : 2013, locally available Fine Aggregate, Bacillus Subtilis and potable water is used in this study. Here cement to sand ratio and water to cement ratio were 1 : 3 and 0.4 (by weight) respectively. For preparing mortar water, distilled water is used. Mortar cubes of dimension 70.6 mm3 are prepared for both control and bacterial mortar specimens. In fresh water, curing can be conducted at room temperature 27 °C. According to information provided by the manufacturer, OPC cement’s chemical composition and physical properties are presented in Table 2.
Step-II. Bacteria culture:
Table 2
Composition and physical properties of cement.
| Physical properties | |
| Colour | Grey |
| Specific gravity | 3 |
| Chemical constituents (%) | |
| Al2O3 | 3.78 |
| SiO2 | 21.5 |
| MgO | 1.79 |
| Fe2O3 | 3.78 |
| CaO | 63.69 |
| SO3 | 3 |
| Na2O | – |
| K2O | – |
For this experimental work, selected bacterial sample Bacillus Subtilisis is used in this study. For bacterial culture nutrient broth was made (1.0 gm/lBeef Extract, 5.0 gm/lPeptone, 2.0 gm/lYeast Extract, 5.0 gm/NaCl). Growth conditions of Bacteria are maintained at 37 °C temperature. After 6–7 days, about 10 μl of the nutrient broth is obtained and haemocytometer counting is done. Here, the bacterial concentrations in solution used are
Step-III. The mixing procedure:
Cement and sand is well mixed in 1:3 proportions and a mixture of water and the needed cell concentration is then prepared. After casting and compacting in a vibration machine, specimens are removed and compression tests are performed after 3, 7, 14 and 28 days in air at room temperature (30 °C).
Step-IV. Compressive strength and water absorption test:
Compressive strength and water absorption of control and bacterial mortar cubes are measured in 3, 7 and 28 days after curing. The compressive strength test was done under compression testing machine.
Step-V. Crack healing on mortar surfaces:
A 28-day crack healing test is performed on microbial concrete to determine its self-healing ability at different bacteria concentrations. The crack-measuring instrument measured the crack widths. In this study, crack widths range from 0.11 mm to 1.5 mm; water is used to immerse the cracked specimens and their crack dimensions are recorded after 3, 7 and 28 days.
Phase-II. Parameter Selection:
Table 3
Levels and values of the input parameters.
| Parameters | Level-1 | Level-2 | Level-3 |
| Concentration | 0 | 5 | 7 |
| Days | 3 | 7 | 28 |
The PV of each criterion and alternative will be calculated in the section that follows. In the present study, compressive strength (
For the present study, the design factors chosen are bacteria concentration and curing day so as to determine their influence on the outcome parameters of compressive strength, crack healing, and water absorption. Table 3 represents the levels of input parameters (bacteria concentration and curing day) that are considered as control factors for the experiment. In Table 4, based on the number of tests, a Taguchi L9 (32) orthogonal array comprising 9 rows has been calculated.
Phase-III. Application of IF-FUCOM:
Table 4
Results of an experiment using
| Trial No. | Concentration | Days | CS (Map) | CH (%) | WA (%) |
| 1 | 3 | 30.1206 | 30.3167 | 5.5 | |
| 2 | 7 | 37.6342 | 50.2262 | 4.66667 | |
| 3 | 28 | 48.1967 | 60.6335 | 4.25 | |
| 4 | 3 | 32.7521 | 70.1357 | 5.08333 | |
| 5 | 7 | 41.2611 | 84.6154 | 4.375 | |
| 6 | 28 | 52.462 | 90.0452 | 3.79167 | |
| 7 | 3 | 31.4065 | 94.5701 | 4.91667 | |
| 8 | 7 | 39.9128 | 98.5 | 4.04167 | |
| 9 | 28 | 49.4737 | 99.6 | 3.58333 |
Collect all factors based on the literature review, and then send them to three experts, and expert responds. Following the determination of the first-level criteria, the ranking is determined on a second level. Dimensions are ranked in this order:
Table 5
A linguistic assessments of the main dimensions.
| Dimensions | |||
| Linguistic variables | EI | MI | STI |
The fuzzy linguistic scale was used to transform linguistic variables into Intuitionistic fuzzy numbers (IFNs), as shown in Table 6.
Table 6
Evaluations transformed by IFNs.
| Dimensions | |||
| IFNs |
According to expression (1), the relative importance of the criteria is as follows:
(15)
Phase-IV. Application of GRA:
To calculate the score, gray relation grading is used after determining the relative weights of each criterion. GRCs are used to calculate gray reasoning grades using equation (14). GRCs are weighted from 0 to 1. IF-FUCOM decides the weight of each characteristic. A gray relational grade of the higher value indicates greater desirability.
Phase-V. Study of Comparisons:
A comparative research can identify and quantify the relationships between at least two factors by studying different groups that have been exposed to diverse treatments either by choice or circumstance. A relative study is made possible by contrasting two sets of individuals, entities, or circumstances. In the current work, the proposed technique has been contrasted with three sophisticated models.
Model-I: The local weight must be calculated using AHP (Saaty, 1980), and the global weight must be calculated using GRA (Julong, 1989).
Model-II: Identify the local weights of the BWM (Rezaei, 2015) and the GRA (Julong, 1989) alternative, as well as identifying the global weights of the BWM-GRA alternative.
Model-III: Determine the local weight of an alternative GRA (Julong, 1989), the local weight of the FUCOM (Pamučar et al., 2018b), then calculate the global weight using a hybrid strategy known as FUCOM GRA.
Here are three mathematical formulations of the models discussed below.
Model-I. AHP result:
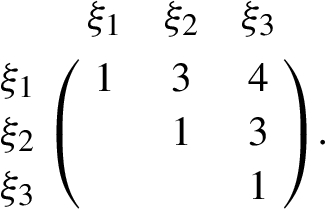
The weights of the different criteria are determined by experts within related fields who collaborate in a pairwise comparison between each criterion. This comparison matrix is shown below:
Model-II. BWM result:
For the purpose of weighing the criteria in BWM, relevant experts are asked to identify the most and least significant factors in the case study, along with the best-to-others and other-to-worst vectors. According to expert consensus,
Table 7
Best to others criteria.
| Best to others | |||
| 1 | 3 | 7 |
Table 8
Others to worst criteria.
| Others to worst | |
| 7 | |
| 5 | |
| 1 |
The weight of each criterion can be calculated, as well as the consistency rate, using the non-linear mathematical model.
(16)
Model-III. FUCOM result:
The criteria are ranked in order of importance. The ranking is determined by consensus among experts. According to experts, the relation (17) criteria are ranked. Comparisons are based on a scale of Van Tittelboom et al. (2010), Achal et al. (2011), which is shown in Table 9.
(17)
Table 9
Comparative significance levels for the evaluation criteria.
| 1 | 1.08 | 1.25 |
The relative importance of each criterion can be gauged by calculating the comparison importance values based on the obtained importance values
The final weight coefficients can be determined by applying expression (18)
(18)
Phase-V. ANOVA:
Statistically, the difference among available scores can be evaluated through Analysis of Variance (ANOVA). In ANOVA, the level of contribution of each of the chosen parameter values over the output responses is analysed (Pattnaik et al., 2013). ANOVA results can be used to determine which variables are responsible for the performance of a selected process and to control these variables to obtain a better result. ANOVA cannot provide data analysis, but this statistical method can assess variance of the data.
Phase-VI. Confirmation test:
A confirmation test is done to verify the forecast and the outcome after the
(19)
4Result
The six parts of the proposed model are described in the results section.
Part-I: Calculate the gray relation coefficient.
Phase-II: In this phase, IF-FUCOM is used to determine weights for the criteria. The weights and rankings of alternatives are determined using IF-FUCOM and GRC.
Phase-III: A comparison of the results offered by novel IF-FUCOM-AHP and some existing methods.
Phase-IV: Next, the ANOVA result is used to determine the influential input parameter.
Phase-V: The percentage significance of input factors can be analysed with ANOVA.
In the following, all phases are discussed in detail.
Phase-I: Result of GRC:
To assess the impact of each parameter, the SN ratio of every trail is computed based on equation (9) for compressive strength and equation (10) for crack healing and water absorption. Equations (11) and (12) are used to normalize the acquired value of the SN ratio while taking the higher-the-better and smaller-the-better qualities into consideration, respectively. Equation (13) is used to calculate the GRC after determining the normalized SN ratios for each investigation. Table 10 displays the SN ratios of the output parameters together with the corresponding GRCs.
Phase-II. Result from IF-FUCOM-GRG:
Table 10
SN ratioand GRC associated with output parameter.
| SN RATIO | GRC | ||||
| CS (Mpa) | CH (%) | WA (%) | CS (Mpa) | CH (%) | WA (%) |
| 29.57727237 | 29.63363852 | −14.8072538 | 0.333333333 | 0.333333333 | 1 |
| 31.51165377 | 34.01860643 | −13.3801418 | 0.455106149 | 0.464867652 | 0.565946459 |
| 33.66034607 | 35.65425276 | −12.5677786 | 0.765904066 | 0.545102165 | 0.453817715 |
| 30.30478303 | 36.91878272 | −14.1229661 | 0.37063052 | 0.629038242 | 0.731129591 |
| 32.31081604 | 38.54898824 | −12.8195611 | 0.536003016 | 0.784836765 | 0.483508457 |
| 34.39689686 | 39.08921134 | −11.5766106 | 1 | 0.855012953 | 0.365470817 |
| 29.94039081 | 39.51507697 | −13.8334212 | 0.350961336 | 0.919850586 | 0.656446929 |
| 32.02224392 | 39.86872461 | −12.131217 | 0.503674319 | 0.98166898 | 0.410148263 |
| 33.88748783 | 39.96518677 | −11.0857361 | 0.825498313 | 1 | 0.333333333 |
The IF-FUCOM-GRG result is divided into two parts, namely the result of IF-FUCOM and the result of GRG. All the parts are discussed below.
Step-I. Result from IF-FUCOM:
The best values of the criteria can be found by solving the fuzzy linear model in equation (11), which is shown.
The weight coefficients for the criteria compressive strength
Next, use equations (7) to calculate the crisp weights for the criteria compressive strength (
Use equation (8) to calculate normalized weights for these three criteria, which are 0.499, 0.245, and 0.256.
The weights of the compressive strength (
Step-II: Result of IF-FUCOM-GRA:
In GRA, the relative weights of the criteria are obtained by IF-FUCOM. After determining the relative weights of the criteria, the score is calculated using grey relation grading. Using equation (16), GRCs are used to calculate the different grey reasoning grades. GRCs are weighted from 0 to 1, with
Phase-III. Result of Comparative study:
Table 11
Gray relational grade determined by IF-FUCOM.
| Trail No. | IF-FUCOM-GRG | Rank |
| 1 | 0.435 | 9 |
| 2 | 0.47365 | 8 |
| 3 | 0.671241 | 3 |
| 4 | 0.479423 | 7 |
| 5 | 0.579442 | 5 |
| 6 | 0.871615 | 1 |
| 7 | 0.516248 | 6 |
| 8 | 0.588762 | 4 |
| 9 | 0.785842 | 2 |
This study validates the result of the proposed model by comparing it to three existing MCDM techniques. There are four steps in this phase. Determine the PV for each criterion using AHP, BWM, and FUCOM methods in the first three steps. As a last step, determine the weights of the alternatives using GRA.
Step-I: Result from AHP:
Calculate the priority value of each criterion using the AHP algorithm as described in Section. The priority value of criteria are
Step-II: Result from BWM:
Based on the solution to the above BWM-model (16), the following criteria weights are optimal:
Step-III: Result from FUCOM:
Based on the solution to the above model (18), the following criteria weights are optimal:
Step-IV: Different Gray relation grade:
In GRA, the relative weights of the criteria are obtained by AHP, BWM, and FUCOM. After determining the relative weights of the criteria, the score is calculated using grey relation grading. Using equation (16), GRCs are used to calculate the different grey reasoning grades. GRCs are weighted from 0 to 1, with
Phase-IV. ANOVA result:
Table 12
Gray relational grade determined by different MCDM techniques.
| Trail No. | GRG | Rank | AHP-GRG | Rank | BWM-GRG | Rank | FUCOM-GRG | Rank |
| 1 | 0.5555556 | 8 | 0.411 | 9 | 0.3846153 | 9 | 0.528986 | 8 |
| 2 | 0.4953068 | 9 | 0.470235 | 8 | 0.4661853 | 7 | 0.490951 | 9 |
| 3 | 0.5882746 | 6 | 0.669449 | 3 | 0.6841493 | 3 | 0.599313 | 6 |
| 4 | 0.5769328 | 7 | 0.481692 | 7 | 0.4659447 | 8 | 0.564204 | 7 |
| 5 | 0.6014494 | 5 | 0.596013 | 5 | 0.5970446 | 5 | 0.605119 | 5 |
| 6 | 0.7401613 | 1 | 0.885904 | 1 | 0.9132704 | 1 | 0.764531 | 1 |
| 7 | 0.6424196 | 3 | 0.538815 | 6 | 0.5232466 | 6 | 0.633852 | 4 |
| 8 | 0.6318305 | 4 | 0.620331 | 4 | 0.621494 | 4 | 0.638589 | 3 |
| 9 | 0.7196105 | 2 | 0.813856 | 2 | 0.8332784 | 2 | 0.740332 | 2 |
The
Table 13
IF-FUCOM-GRG response table.
| Parameters | Level-1 | Level-2 | Level-3 |
| Concentration | 0.4932 | 0.6458 | 0.6391 |
| Days | 0.4632 | 0.5516 | 0.7633 |
Fig. 4
Response of the IF-FUCOM-GRG SN ratio.
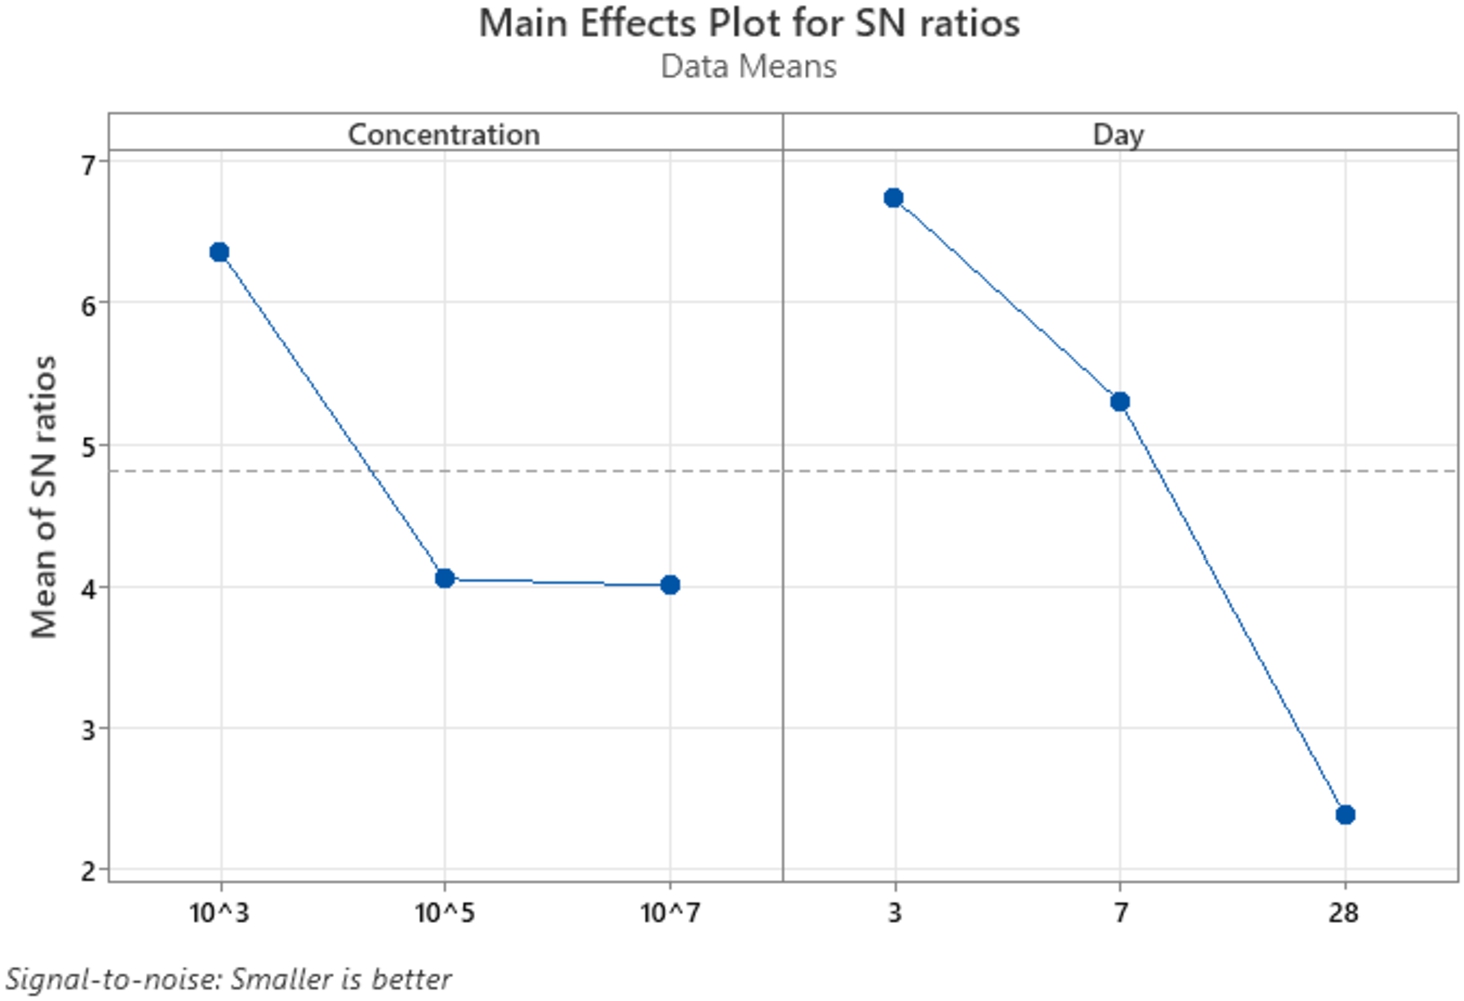
ANOVA is employed to determine whether design elements have a substantial impact on response (Haq et al., 2008). ANOVA may examine the percentage importance of input factors. When
Phase-V. Confirmation test result:
Table 14
Results of the ANOVA for the IF-FUCOM-GRG.
| Source | DF | Adj SS | Adj MS | F-Value | P-Value |
| Concentration | 2 | 0.044646 | 0.022323 | 11.88 | 0.021 |
| Days | 2 | 0.142686 | 0.071343 | 37.96 | 0.003 |
| Error | 4 | 0.007519 | 0.001880 | ||
| Total | 8 | 0.194851 |
In Table 15, the optimal output parameter is tested for actual and predicted IF-FUCOM-GRA values. Equation (19) predicts the IF-FUCOM-GRA values provided at the optimal output. IF-FUCOM-GRA, as predicted and experimentally determined as an optimum level, are 0.818256 and 0.88929, respectively.
Table 15
Confirmation test table.
| Optimal input parameter | ||
| Predicted | Experimental | |
| Level | ||
| IF-FUCOM-GRA grade | 0.816385 | 0.88929 |
| 1.64405 | 1.71291 | |
5Discussion
In this study, three criteria, crack healing, water absorption, and compressive strength, are used to determine the optimal bacteria concentration and curing day. The values that corresponded to all three criteria are obtained through experimentation. Using the experimental data, equation (16) calculates the gray relation coefficient. A variety of MCDM techniques are used for weighting criteria, including BWM, AHP, FUCOM, and intuitive fuzzy FUCOM. After that, a comparative study has been conducted among AHP-GRG, FUCOM-GRG, BWM-GRG, and IF-FUCOM-GRG. The comparison shows that IF-FUCOM-GRG produces similar rankings to other methods in most cases. Based on the proposed method, the optimal bacteria concentration is 105, and the optimal curing time is 28 days. The confirmation test result shown in Table 15 predicts IF-FUCOM-GRA grade pretty well, and is almost in agreement with the experimental results.
6Conclusion
MCDM problems are solved by considering different levels of importance of the criteria. A number of weighting methods have been used in the literature to determine the importance levels of expert opinions, including SAW, AHP/ANP, SWARA, BWM, and FUCOM. The fuzzy set theory can be used to solve ambiguous and vague problems. It is possible to improve the reliability of these weighting methods by incorporating fuzzy set theory, which reflects the way humans think and reason. The intuitionistic fuzzy set solves this problem by defining the non-membership degree and the two membership levels for each element. In this study, intuitionistic fuzzy sets are combined with FUCOM to come up with the Intuitionistic Fuzzy FUCOM (IF-FUCOM). Moreover, linguistic variables are used instead of crisp values in pairwise comparisons for criteria in the decision-making process.
In comparison to the IF-BWM and IF-AHP models, the IF-FUCOM model has the advantage of offering similar results by using only
In the present study, Intuitionistic Fuzzy FUCOM Grey Relations Analysis is used to select optimal bacteria concentrations and optimal curing time in days. The proposed algorithm obtains a grey reasoning grade according to the grey relational coefficients of each test run in order to convert multi-response optimization to single objective optimization. The intuitionist fuzzy-FUCOM-grey reasoning grades (IF-FUCOM-GRG) are compared with different grades like AHP-grey reasoning grade (AHP-GRG), BWM-grey reasoning grade (BWM-GRG), FUCOM-grey reasoning grade (FUCOM-GRG). All the algorithms have been employed to obtain the optimal input factor corresponding to the estimated values of output response. IF-FUCOM-GRG produces similar rankings with other methods in most cases, but in some cases it produces better results. According to the proposed method, the optimal bacteria concentration is 105, and the optimal curing time is 28 days. Using a confirmation experiment, the computed factor combination based on the highest ranking of IF-FUCOM-GRG is validated.
Limitations of the study:
i. There are three criteria used in this study to select the best bacteria concentration and curing time. However, the results may vary if other criteria are added.
ii. The ranking order may change as the number of alternatives increases, which is the shortcoming of this model.
Future scope:
i. In the future, the proposed method can be applied to all fields of science, engineering, and social sciences. Additionally, this method can be used in conjunction with other ranking methods (COPRAS, CODAS, ARAS, TOPSIS, EDAS, MAIRCA, etc.) to select the most appropriate alternative to solve MCDM problems.
ii. This study found optimal bacteria concentrations in concrete mortar, but optimal bacteria concentrations can also be found when cement is partially replaced by other additives like rice husk, fly ash, etc.
References
1 | Achal, V., Mukherjee, A., Sudhakara Reddy, M. ((2011) ). Microbial concrete way to enhance the durability of building structures. Journal of Materials in Civil Engineering, 23: (6), 730–734. |
2 | Arunachalam, K.D., Sathyanarayanan, K.S., Darshan, B.S., Raja, R.B. ((2010) ). Studies on the characterisation of Biosealant properties of Bacillus sphaericus. International Journal of Engineering Science and Technology, 2: (3), 270–277. |
3 | Baig, M.M.U., Ali, Y., Rehman, O.U. ((2022) ). Enhancing resilience of oil supply chains in context of developing countries. Operational Research in Engineering Sciences: Theory and Applications, 5: (1), 69–89. |
4 | Böyükaslan, A., Ecer, F. ((2021) ). Determination of drivers for investing in cryptocurrencies through a fuzzy full consistency method-Bonferroni (FUCOM-F’B) framework. Technology in Society, 67: , 101745. |
5 | Božanić, D., Tešić, D., Kočić, J. ((2019) ). Multi-criteria FUCOM–Fuzzy MABAC model for the selection of location for construction of single-span bailey bridge. Decision Making: Applications in Management and Engineering, 2: (1), 132–146. |
6 | Bozanic, D., Tešić, D., Milić, A. ((2020) ). Multicriteria decision making model with Z-numbers based on FUCOM and MABAC model. Decision Making: Applications in Management and Engineering, 3: (2), 19–36. |
7 | Božanić, D., Milić, A., Tešić, D., Salabun, W., Pamučar, D. ((2021) ). D numbers–FUCOM–fuzzy RAFSI model for selecting the group of construction machines for enabling mobility. Facta Universitatis. Series: Mechanical Engineering, 19: (3), 447–471. |
8 | Chahal, N., Siddique, R., Rajor, A. ((2012) ). Influence of bacteria on the compressive strength, water absorption and rapid chloride permeability of fly ash concrete. Construction and Building Materials, 28: (1), 351–356. |
9 | Chiao, K.P. ((2016) ). The multi-criteria group decision making methodology using type 2 fuzzy linguistic judgments. Applied Soft Computing, 49: , 189–211. |
10 | Dagdevir, T., Ozceyhan, V. ((2021) ). Optimization of process parameters in terms of stabilization and thermal conductivity on water based TiO2 nanofluid preparation by using Taguchi method and Grey relation analysis. International Communications in Heat and Mass Transfer, 120: , 105047. |
11 | De Muynck, W., Debrouwer, D., De Belie, N., Verstraete, W. ((2008) ). Bacterial carbonate precipitation improves the durability of cementitious materials. Cement and Concrete Research, 38: (7), 1005–1014. |
12 | Demir, G., Damjanović, M., Matović, B., Vujadinović, R. ((2022) ). Toward sustainable urban mobility by using fuzzy-FUCOM and fuzzy-CoCoSo methods: the case of the SUMP podgorica. Sustainability, 14: (9), 4972. |
13 | Dhami, N.K., Reddy, M.S., Mukherjee, A. ((2013) ). Bacillus megaterium mediated mineralization of calcium carbonate as biogenic surface treatment of green building materials. World Journal of Microbiology and Biotechnology, 29: (12), 2397–2406. |
14 | Durmić, E., Stević, Ž., Chatterjee, P., Vasiljević, M., Tomašević, M. ((2020) ). Sustainable supplier selection using combined FUCOM–rough SAW model. Reports in Mechanical Engineering, 1: (1), 34–43. |
15 | Erdoğan, S., Sayin, C. ((2018) ). Selection of the most suitable alternative fuel depending on the fuel characteristics and price by the hybrid MCDM method. Sustainability, 10: (5), 1583. |
16 | Erdoğan, S., Aydın, S., Balki, M.K., Sayin, C. ((2020) ). Operational evaluation of thermal barrier coated diesel engine fueled with biodiesel/diesel blend by using MCDM method base on engine performance, emission and combustion characteristics. Renewable Energy, 151: , 698–706. |
17 | Fangfang, W.A.N.G. ((2021) ). Research on the model and application progress based on grey relational analysis theory. Advances in Educational Technology and Psychology, 5: (2), 30–35. |
18 | Fazlollahtabar, H., Smailbašić, A., Stević, Ž. ((2019) ). FUCOM method in group decision-making: selection of forklift in a warehouse. Decision Making: Applications in Management and Engineering, 2: (1), 49–65. |
19 | Ghosh, P., Mandal, S., Chattopadhyay, B.D., Pal, S. ((2005) ). Use of microorganism to improve the strength of cement mortar. Cement and Concrete Research, 35: (10), 1980–1983. |
20 | Gong, Y., Feng, L., Liu, G. ((2014) ). Fuzzy multi-attribute group decision making method with incomplete weight information under interval type-2 fuzzy environment. Journal of Intelligent & Fuzzy Systems, 27: (1), 307–316. |
21 | Grzenda, M., Bustillo, A., Zawistowski, P. ((2012) ). A soft computing system using intelligent imputation strategies for roughness prediction in deep drilling. Journal of Intelligent Manufacturing, 23: (5), 1733–1743. |
22 | Güler, O., Gajević, S., Miladinović, S., Çuvalcı, H., Stojanović, B. (2021). Optimization of zinc-based hybrid nanocomposites using Taguchi grey relation analysis. In: International Congress Motor Vehicles & Motors 2020, Kragujevac, Serbia, October 8th–9th, 2020. |
23 | Haq, A.N., Marimuthu, P., Jeyapaul, R. ((2008) ). Multi response optimization of machining parameters of drilling Al/SiC metal matrix composite using grey relational analysis in the Taguchi method. The International Journal of Advanced Manufacturing Technology, 37: (3), 250–255. |
24 | Julong, D. ((1989) ). Introduction to grey system theory. The Journal of Grey System, 1: (1), 1–24. |
25 | Kao, M.J., Ting, C.C., Lin, B.F., Tsung, T.T. ((2008) ). Aqueous aluminum nanofluid combustion in diesel fuel. Journal of Testing and Evaluation, 36: (2), 503. |
26 | Krassimir, T.A., Parvathi, R. ((1986) ). Intuitionistic fuzzy sets. Fuzzy Sets and Systems, 20: (1), 87–96. |
27 | Majumdar, S., Sarkar, M., Chowdhury, T., Chattopadhyay, B., Mandal, S. ((2012) ). Use of bacterial protein powder in commercial fly ash pozzolana cements for high performance construction materials. Open Journal of Civil Engineering, 2: (4), 218–228. |
28 | Milićević, A., Pavličić, D., Kostić, A. ((2007) ). The dynamics of change in decision making under risk. Psihologija, 40: (1), 147–164. |
29 | Mondal, S., Ghosh, A.D. ((2018) ). Investigation into the optimal bacterial concentration for compressive strength enhancement of microbial concrete. Construction and Building Materials, 183: , 202–214. |
30 | Nunić, Z. ((2018) ). Evaluation and selection of manufacturer PVC carpentry using FUCOM-MABAC model. Operational Research in Engineering Sciences: Theory and Applications, 1: (1), 13–28. |
31 | Otay, İ., Oztaysi, B., Onar, S.C., Kahraman, C. ((2017) ). Multi-expert performance evaluation of healthcare institutions using an integrated intuitionistic fuzzy AHP&DEA methodology. Knowledge-Based Systems, 133: , 90–106. |
32 | Pamucar, D., Ecer, F. ((2020) ). Prioritizing the weights of the evaluation criteria under fuzziness: the fuzzy full consistency method–FUCOM-F. Facta Universitatis, Series: Mechanical Engineering, 18: (3), 419–437. |
33 | Pamucar, D., Ecer, F., Deveci, M. ((2021) ). Assessment of alternative fuel vehicles for sustainable road transportation of United States using integrated fuzzy FUCOM and neutrosophic fuzzy MARCOS methodology. Science of The Total Environment, 788: , 147763. |
34 | Pamučar, D., Lukovac, V., Božanić, D., Komazec, N. ((2018) a). Multi-criteria FUCOM-MAIRCA model for the evaluation of level crossings: case study in the Republic of Serbia. Operational Research in Engineering Sciences: Theory and Applications, 1: (1), 108–129. |
35 | Pamučar, D., Stević, Ž., Sremac, S. ((2018) b). A new model for determining weight coefficients of criteria in MCDM models: full consistency method (FUCOM). Symmetry, 10: (9), 393. |
36 | Pattnaik, S., Karunakar, D.B., Jha, P.K. ((2013) ). Multi-characteristic optimization of wax patterns in the investment casting process using grey–fuzzy logic. The International Journal of Advanced Manufacturing Technology, 67: (5–8), 1577–1587. |
37 | Ramachandran, S.K., Ramakrishnan, V., Bang, S.S. ((2001) ). Remediation of concrete using micro-organisms. ACI Materials Journal-American Concrete Institute, 98: (1), 3–9. |
38 | Ramakrishnan, V., Deo, K.S., Duke, E.F., Bang, S.S. ((1999) ). SEM investigation of microbial calcite precipitation in cement. In: Proceedings of the International Conference on Cement Microscopy, Vol. 21: , International Cement Microscopy Association, pp. 406–414. |
39 | Rezaei, J. ((2015) ). Best-worst multi-criteria decision-making method. Omega, 53: , 49–57. |
40 | Roy, S., Das, A.K., Banerjee, R. ((2016) ). Grey-fuzzy Taguchi approach for multi-objective optimization of performance and emission parameters of a single cylinder crdi engine coupled with EGR. International Journal of Automotive Technology, 17: (1), 1–12. |
41 | Saaty, T.L. (1980). The Analytical Hierarchy Process, Planning, Priority. Resource Allocation. RWS Publications, USA. |
42 | Si, A., Das, S., Kar, S. (2021). Picture fuzzy set-based decision-making approach using Dempster–Shafer theory of evidence and grey relation analysis and its application in COVID-19 medicine selection. Soft Computing, 1–15. |
43 | Tang, C., Xu, D., Chen, N. ((2021) ). Sustainability prioritization of sewage sludge to energy scenarios with hybrid-data consideration: a fuzzy decision-making framework based on full consistency method and fusion ranking model. Environmental Science and Pollution Research, 28: (5), 5548–5565. |
44 | Van Tittelboom, K., De Belie, N., De Muynck, W., Verstraete, W. ((2010) ). Use of bacteria to repair cracks in concrete. Cement and Concrete Research, 40: (1), 157–166. |
45 | Yang, W.H.P., Tarng, Y.S. ((1998) ). Design optimization of cutting parameters for turning operations based on the Taguchi method. Journal of Materials Processing Technology, 84: (1–3), 122–129. |
46 | Zadeh, L.A. ((1975) ). The concept of a linguistic variable and its application to approximate reasoning—I. Information Sciences, 8: (3), 199–249. |


