
Novel Comprehensive MEREC Weighting-Based Score Aggregation Model for Measuring Innovation Performance: The Case of G7 Countries
Abstract
Innovation can be the greatest hope of overcoming economic challenges. This paper aims to evaluate countries concerning their innovation performances. We introduce an innovation performance evaluation methodology by considering objective factors and applying seven reliable MCDM methods: MEREC, CODAS, MABAC, MARCOS, CoCoSo, WASPAS, and MAIRCA. MEREC calculates the relative weights of indicators considered, while the other techniques decide the ranking order of G7 countries. The Borda rule is then employed to gain an aggregated ranking order. “Business sophistication” is the most critical indicator, whereas the US has the best position regarding the overall ranking. Sensitivity control is as well conducted.
1Introduction
Innovation is a strategy that can help countries keep their competitive advantage. Moreover, it is among the major components of a country’s economic and sustainable development (Huang et al., 2021). Dutta et al. (2020) claimed that it assists countries in overcoming their chronic problems. A huge body of literature such as Brenner and Broekel (2011), Ivanov and Avasilcăi (2014), Smith (2005), Banu (2018), Walker et al. (2002), Kim et al. (2020), Cirera and Muzi (2020), Ligardo-Herrera et al. (2019), Blažek and Kadlec (2019), Furková (2022), and Yu et al. (2021), among others, emphasizes the importance of this issue. Further, the existing literature reviews demonstrate the growing interest of researchers in this subject (see Wolfe, 1994; Cooper, 1999; Becheikh et al., 2006; Bloch and Bugge, 2013; Dziallas and Blind, 2019; Haefner et al., 2021; Vrontis and Christofi, 2021).
Policymakers, scholars and authorities widely accept the significance of measuring innovation to highlight general trends, settle performance objectives and form policy scenarios (Garcia-Bernabeu et al., 2020). So far, there has been an ongoing divergence of opinion on the measurement of innovation performance. For such a measurement, Garcia-Bernabeu et al. (2020) argued that there are three views in the current literature: using single indicators, composite innovation indices, and multiple indicators. In terms of policymaking, in deciding innovation performance, the last may offer a more inclusive approach (Capello and Lenzi, 2013; Navarro et al., 2009).
According to Grupp and Schubert (2010), innovation indicators are statistical values that describe different parts of innovation and they fail to describe innovation as a whole if they are used alone. As pillars of innovation, therefore, this work considers institutions, human capital and research, infrastructure, market sophistication, business sophistication, knowledge and technology outputs, and creative outputs. It is well shown in the literature that these indicators affect the innovation level of countries (see Özkaya et al., 2021; do Carmo Silva et al., 2019; Garcia-Bernabeu et al., 2020). Notwithstanding, up to now, an agreed method or methodology could not be developed to measure innovation (Grupp and Schubert, 2010). Consequently, this paper proposes an alternative framework capable of making such a measurement.
Since innovation is widely accepted as one of the critical aspects of sustainable economic growth, measuring innovation at the national level is significant (Grupp and Schubert, 2010). Measuring innovation can guide policymakers and decision-makers to specify the finest innovative countries and clarify the most important innovation indicators for innovation evaluations. Considering the reality that the concept of innovation covers varied affecting factors that could be conflicting, the MCDM terminology can ensure effective vehicles to assess the innovation level of countries. It is obvious that each MCDM technique, no matter how famous it is, has its weaknesses. Thus, unlike results might be obtained even for the same problem since each method has its own specific mathematical structures, normalization methods, and aggregation functions. To cope with this problem encountered frequently, a set of MCDM techniques with some ranking combination methods like the Borda rule may be applied for obtaining an overall ranking. This useful approach has earlier been handled in various studies like smart cities (Mokarrari and Torabi, 2021), battery electric vehicles (Ecer, 2021), innovation systems (Paredes-Frigolett et al., 2021), cryptocurrencies (Ecer et al., 2022), and research and technology organizations (Varmazyar et al., 2016).
As of 2020, the G7 countries account for a little over 50 percent of global net wealth ($418 trillion), 32 to 46 percent of global GDP, and about 770 million people or 10 percent of the world’s population (World Bank, 2020). In today’s globalizing competitive environment, it is seen that new policies have been developed to increase the innovation performance of these major advanced economies. In this context, G7 countries should give more importance to infrastructure, R&D, and technology necessary for innovation activities. Innovation indexes can be described as a simple quantitative indicator of the innovation capacity of countries in selected fields of research. It measures, monitors, and promotes progress in innovation performance. Further, an innovation index provides significant insights into a country’s potential to sustain productivity growth and competitiveness. The performance of countries measured with various criteria could provide guidelines for policymakers to allocate resources that lead to improvements. To the authors’ knowledge, no earlier work has collaboratively applied many reliable MCDM techniques to address a comprehensive innovation performance of G7 countries. In order to fill this remarkable gap in the relevant literature, the vital indicators of innovative countries are investigated and the proper assessment methods are reviewed in this study. The most vital motivation to choose G7 countries for this study relies on the importance of determining their innovation performance and availability of real-life data such as innovation indexes for computational purposes. Moreover, unlike in other papers, a comprehensive evaluation methodology is developed to measure the importance level of indicators determined and the innovation level of countries through a collection of MCDM techniques i.e. MEREC, CODAS, MABAC, MARCOS, CoCoSo, WASPAS, and MAIRCA. Last but not least, an overall ranking of countries employing their innovativeness is determined by the Borda rule, which is a reliable compromise strategy. The proposed framework takes advantage of various robust MCDM methods simultaneously. Thus, it is aimed to gain more accurate and reliable results for the decision-making process. The other advantages of the introduced approach are ease of understanding and problem-solving, and there is no requirement for specific software.
Finally, the answers to the following research questions are sought: How can the level of G7 countries be measured? Is it possible to use MEREC, CODAS, MABAC, MARCOS, CoCoSo, WASPAS, and MAIRCA together in the process of innovation measurement? The combined usage of these techniques seems to be promising because MEREC ensures a practical and trustworthy path to evaluate criteria weight values, whereas CODAS, MABAC, MARCOS, CoCoSo, WASPAS, and MAIRCA are convenient vehicles to employ such criteria weight values taking into consideration how the dissimilar criteria can be consolidated. As a result, below highlights the original contributions of this paper.
• To perform a comprehensive innovation measurement of countries through a set of MCDM techniques.
• To utilize a set of innovation indicators for the ranking aim, which fits the context of any country.
• To conduct a new objective MCDM method named MEREC to extract the weight values of indicators.
• To apply a real case study and measure the innovation levels of G7 countries.
Overall, this paper is organized as follows: Section 2 reviews the studies and MCDM usage in the innovation field. Section 3 provides the research methodology for this study. Section 4 serves the application as well as highlights the validity of the results. Section 5 discusses the outcomes gathered briefly and summarizes some political implications. Finally, the last section draws some brief conclusions.
2Literature Survey
Once the history of the concept of innovation is examined, it is seen that Schumpeter first defined this concept as everything that brings profit to the entrepreneur and emerges as a result of technological developments (Schumpeter, 1965). Thompson, on the other hand, defined innovation as “the development, acceptance, and implementation of new ideas, products, services and processes” (Thompson, 1965). Feeny and Rogers defined innovation as an implementation process that includes transformation of the new ideas to products and processes of businesses (Feeny and Rogers, 2003). In addition to these definitions, the innovation definition in the Oslo Manual published by OECD and Eurostat has begun to be taken as a basis in the international arena.
Innovation in the Oslo Manual has been categorized according to the four main patterns (OECD, 2005):
• Process innovation results in producing the same amount of goods and services while consuming fewer inputs.
• Product innovations are expected to improve existing products and services or even initiate new ones.
• Organizational innovation entails the creation of new management philosophies such as 5S and total quality management.
• Market innovation, on the other hand, is important for the promotion and pricing of products and services and other market-oriented strategies.
It is vital to measure the innovative performance of countries or businesses periodically to determine the effectiveness of their activities on innovation. To make these measurements, various models at macro and micro levels have been developed that measure the innovation performance of countries and businesses, taking different innovation indicators into account.
The first of these models is the European Innovation Scoreboard (EIS). EIS, which is created by European Union (EU), INSEAD, and the World Bank, measures the innovation performance of European countries and regions. The European innovation scoreboard analyses the innovation performances of 27 EU member countries and 11 non-EU countries comparatively. Innovation activities, investments, framework conditions, and impacts are determined in as four main indicators for measuring innovation performances (European Innovation Scoreboard, 2021).
The second of these models is the Regional Innovation Scoreboard (RIS), a widening version of the EIS. The RIS ensures a benchmarking of the performance of innovation systems across 240 regions of 22 EU countries (Regional Innovation Scoreboard, 2021). The third model is the Global Innovation Index (GII), which was put forward by INSEAD in France in 2007 to measure countries’ innovation performance. The GII aims to ensure perceptive data on innovation, help countries in assessing their innovativeness performance and making scientific innovation policy considerations (Global Innovation Index, 2020). The analyses performed to rank the countries based on these indices help policymakers and governments worldwide, especially in industrialized countries, identify future development paths and design innovation policies.
2.1Innovation Studies
Innovation is considerably acknowledged as a key factor of economic growth and a country’s development. The recent dramatic increase in studies on innovation performance indicates the importance of this issue. For instance, Hagedoorn and Cloodt (2003) statistically analysed 1200 international enterprises’ innovation performance in four different high-tech sectors and compared these sectors. Among the performance indicators, R&D expenditures, number of patents, patent references, and new products were considered the main variables. In another study, applying a panel data approach, Jungmittag (2004) examined the impacts of innovations, technological specialization, and technology expansion on the economic growth and convergence of EU countries. Tokumasu and Watanabe (2008) analysed some members of EU countries based on their innovation capabilities using innovation capacity, innovation production, and institutional structure indicators. Zhuparova (2012) has suggested seven major variables for measuring the innovation, such as: quality of innovation strategy, level of innovation capacity, amount of investment, guidelines of innovative changes, the competitive situation of firms, speed of the development, and validity of the level of implementing an innovation strategy. Konings and Louw (2014) measured the innovation performances of the transportation sector in Europe with the Structural Equality Model. They analysed the data of 251 regions in Europe and determined that the regions’ innovation performances in Germany and Sweden were better. Similarly, Roszko-Wójtowicz and Białek (2016) evaluated the innovation performance of EU member countries with cluster analysis, using the EIS data. Framework conditions, innovation activities, investments, and impacts are considered within the scope of the EIS. Recently, Paredes-Frigolett et al. (2021) suggested a multi-criteria framework to determine the strategy of innovation systems. They aimed to address shortcomings of mainstream empirical methodologies.
2.2MCDM in Innovation Field
Measuring the innovation performance is a challenging MCDM problem, and the literature survey demonstrates that a scarce number of papers focused on the MCDM methods to the measurement of the innovation performance.
For instance, in their study, Lu et al. (2013) suggested strategies to improve the green innovation performance by considering a total of 15 criteria under 5 main dimensions using fuzzy DANP and fuzzy VIKOR methodologies. According to the findings of this study, the most important main criterion was entrepreneurial orientation, while the most important sub-criteria were described as innovation level, competitor analysis, and proactivity. The most important environmental strategy, on the other hand, has been identified as new product development performance. In another study, İnel and Türker (2016) examined the innovation performance of countries using the AHP&TOPSIS methodology. In the study, three basic criteria were examined: gross domestic product, R&D expenditures in the GDP, and the number of patents per capita. Eventually, the findings show that the most important criterion was the R&D expenditure in GDP. In their paper, do Carmo Silva et al. (2017) aimed to obtain the innovation ranking of Caribbean & Latin American countries using the TOPSIS method and the criteria in the GII. They proposed a methodology that supports the inclusion of global competitiveness models in decision-making. In another work, Kumar et al. (2019) evaluated companies using indicators of product, process, market, behaviuoral, and strategic innovation. They applied a heuristic fuzzy-based TOPSIS procedure to rank firms’ performance according to pre-defined criteria. Recently, Hájek et al. (2018) proposed a BSC and fuzzy integrated TOPSIS methodologies for evaluating the innovation performance of companies operating in Europe. Ayçin and Çakın (2019) evaluated the innovation performance of EU member countries with Entropy and MABAC methods, using the EIS data. According to the results, the most prominent criteria are intellectual assets, innovators, finance, and support variables. Switzerland, Sweden, and Denmark have the highest rankings in terms of innovation performance, respectively.
3Research Methodology
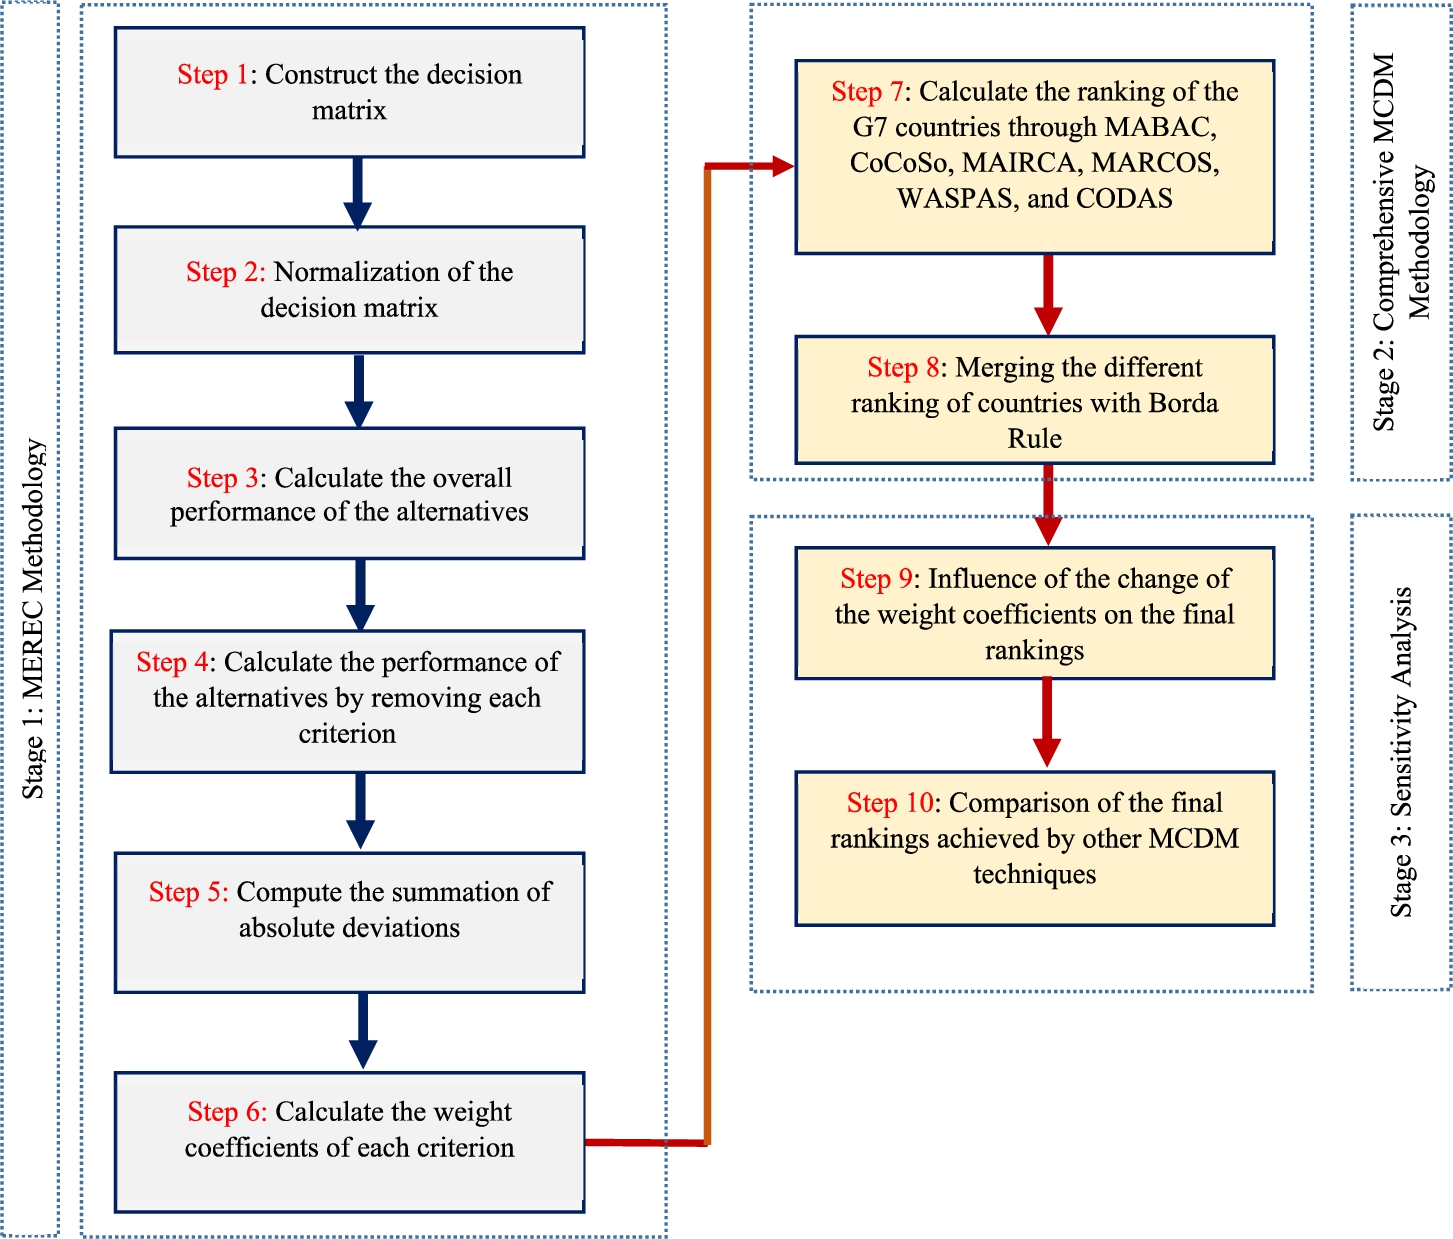
GII is an important indicator that includes evaluating countries according to their capability and achievement in innovation and innovative issues (Dutta et al., 2020). Whilst weighing of indicators, the MEREC method is suggested to avoid subjective evaluations in this work. Following the weight calculations, the countries are analysed with various MCDM techniques (CODAS, MABAC, MARCOS, MAIRCA, WASPAS, and CoCoSo) in terms of the innovation indicators. Finally, the Borda rule is handled to consolidate different ranking results of the MCDM techniques used. The subsections give information about the mentioned methods. Figure 1 exhibits the workflow of the introduced framework to measure the innovation level of countries.
Fig. 1
The flowchart of the proposed framework.
3.1The MEREC Method
MEREC focuses on the change in the total criteria weight by disabling that criterion when determining the weight of a criterion (Ecer and Pamucar, 2022). More clearly, the change in criteria weight gives the weight of a criterion (Kayapınar Kaya et al., 2022). This feature distinguishes MEREC from other objective weighting methods (Shannon’s entropy, CRITIC, CILOS, etc.). Some major advantages of MEREC over other objective weighting methods include ease of understanding, ease of computation, and a robust mathematical background (Ecer and Hashemkhani Zolfani, 2022). To date, as far as the authors’ knowledge, there are solely a few research papers performed with MEREC. In this sense, this study also differs from other studies. MEREC has six steps which are highlighted as Appendix A.1 (Keshavarz-Ghorabaee et al., 2021).
3.2CODAS (The Combinative Distance-Based Assessment)
The CODAS technique was proposed by Keshavarz Ghorabaee et al. (2016) as a reliable approach to obtain the ranking of the alternatives in relation to the distances to the negative ideal solution. The distances of the alternatives to the negative ideal solution in the CODAS method are computed via two measures known as the Euclidean distance and the Taxicab distance. If two alternatives are incomparable (having equal or very close values) in terms of Euclidean distance, the Taxicab distance is used as a secondary measure. After the calculations, the alternative with a greater distance is determined as the most preferred choice (Keshavarz Ghorabaee et al., 2016; Ecer et al., 2021). CODAS has eight steps which are highlighted as Appendix A.2 (Keshavarz Ghorabaee et al., 2016; Mathew and Sahu, 2018; Badi et al., 2018; Gül and Aydoğdu, 2021).
3.3MABAC (Multi-Attributive Border Approximation Area Comparison)
The MABAC technique was introduced by Pamučar and Ćirović (2015) as an efficient ranking method based on the distance of the criterion function of each option from the border approximation area (BAA). The values of the criteria functions are determined for each option and the distances of these functions from the BAA are decided. The options are ranked according to the sum of the distances of options from the BAA. The alternative having the highest score is determined as the best choice. The superiorities of the MABAC method are not only the simple calculation and robustness in solution, but also potential values of benefits and losses, which are to be taken such a way into account that the outcome can be comprehensive (Dorfeshan and Mousavi, 2020). As mentioned in Appendix A.3, MABAC solves challenging problems through some steps (Pamučar and Ćirović, 2015; Gigović et al., 2017; Wang et al., 2019).
3.4MARCOS (Measurement of Alternatives and Ranking according to Compromise Solution)
The MARCOS technique was first presented by Stević et al. (2020) for determining the rankings of the alternatives which are based on defining the relationship between options and reference points. The utility functions of alternatives are determined based on the defined relations, whereas compromise ranking is calculated in terms of ideal and anti-ideal solutions. Further, utility functions display the ranking place of an option. The place of the best alternative is closest to the ideal, whilst farthest from the non-ideal point (Stević et al., 2020). MARCOS is a flexible method that allows numerous attributes to be evaluated with a compromise solution. It is suitable for the solution of complicated real-life problems in spite of having an easy solution algorithm. In addition, MARCOS is a robust and confidential ranking method for the optimization of multiple objectives. These features can be sorted as its primary benefits compared with the other ranking methods (Pamucar et al., 2021; Ecer and Pamucar, 2021). In Appendix A.4, detailed explanations of MARCOS’s steps are depicted.
3.5MAIRCA (Multi Attributive Ideal-Real Comparative Analysis)
The MAIRCA method introduced by Gigović et al. (2016) is an alternative ranking method based on the gap between ideal and real assessments. The total gaps for alternatives are obtained by summing the gap values for each criterion. At the end of the calculation process, the alternative with the lowest overall value gap is the most promising alternative (Gigović et al., 2016; Pamučar et al., 2017).
MAIRCA has a well-structured and simple decision tool for ranking alternatives and it is an available method for solving decision problems with plenty alternatives. It provides an objective ranking of alternatives depending on the predefined dominance threshold (Zolfani et al., 2020; Ecer, 2022). Appendix A.5 presents the steps of MAIRCA (Pamučar et al., 2017).
3.6CoCoSo (Combined Compromise Solution)
The CoCoSo technique introduced by Yazdani et al. (2019) is an alternative ranking method based on the integration of simple additive weighting (SAW) and exponentially weighted product (EWP) models. CoCoSo has some advantages compared to the other multi attribute decision making methods. The optimal solution obtained by the CoCoSo method is not affected with ease by the changes of weight coefficient of the criterion or the deletion/addition of alternatives. It is a flexible method and decision makers can obtain a multi directional compromise solution whose results are consistent with the solutions obtained by other MCDM methods. These situation shows that the CoCoSo method is a robust method, which has advantages in reliability of the obtaining results (Peng et al., 2019; Lai et al., 2020; Torkayesh et al., 2021). As explained in Appendix A.6, CoCoSo solves multi-criteria problems reliable and easily (Yazdani et al., 2019; Ecer et al., 2019; Kumar et al., 2022).
3.7WASPAS (Weighted Aggregated Sum Product Assessment)
Zavadskas et al. (2012) developed the WASPAS multi-criteria technique to rank alternatives. WASPAS is an effective MCDM method developed by combining weighted sum model (WSM) and weighted product model (WPM) approaches. Zavadskas et al. (2012) proved that the ranking accuracy obtained by the WASPAS method is much better than the results of the WPM or WSW approaches. The calculation steps of the method are short and easy. The method can focus on the benefit and cost-based criteria in the problem. The other primary superiority of the method can be stated that it allows the researcher to determine the parameter settings of WSM and WPM (Chakraborty et al., 2015). Appendix A.8 depicts the steps of WASPAS (Zavadskas et al., 2012; Chakraborty and Zavadskas, 2014).
3.8The Borda Rule
The Borda rule was developed by De Borda (1781) to consolidate the ranking outcomes of different techniques. In a decision problem with n alternatives, each alternative is given
4Application and Sensitivity Analysis
This section of the study is dedicated to application and sensitivity checks. First, the application is explained in detail. Then, the effectiveness of the proposed method is tested. Seven main criteria based on GII reports are handled in this study as explained below (Global Innovation Index, 2020).
Institutions: Not only effective governance but also providing the necessary incentives and taking an institutional approach are crucial to innovation. This indicates the institutional framework of an economy.
Human Capital & Research: The level and quality of education and research services in an economy are among the main pillars of that country’s innovation capability. This attempts to measure the human capital of economies.
Infrastructure: Efficient and environmentally friendly communication and transport and energy infrastructures facilitate the production and exchange of ideas, services and goods. It also feeds the innovation system via gained productivity and efficiency, optimal transaction costs, better reaching to markets, and sustainable development.
Market Sophistication: An environment that supports the availability of credit and investment, international market access, competition, and market scale, is crucial for the development of companies and the realization of innovation.
Business Sophistication: The fifth criterion, business sophistication, seeks to define the grade of business complexity to identify how well firms assist their innovative activities. It will be possible for businesses to increase their productivity, competitiveness, and innovation potential by employing highly qualified professionals and technicians.
Knowledge & Technology Outputs: It refers to the benefits of inventions and/or innovations to society, the environment, and social life.
Creative Outputs: The creativity’s role in innovation is underestimated in innovation evaluation and policy issues. Since the beginning of the GII, measuring creativity as a driver of the innovation outcomes has been taken into consideration.
Table 1 presents necessary data for countries according to the indicators considered. These data are used to calculate the criteria weights objectively and determine country performances with different MCDM methods considered in this work.
Table 1
Innovation indicators used for this paper.
| Country | Indicator | ||||||
| Institutions | Human capital and research | Infrastructure | Market sophistication | Business sophistication | Knowledge and technology outputs | Creative outputs | |
| Canada | 90.2 | 51.8 | 53.3 | 78.5 | 50.5 | 39.1 | 40.2 |
| France | 83.7 | 56.2 | 57.7 | 59.4 | 50.2 | 45.1 | 46.7 |
| Germany | 84.6 | 61.1 | 58 | 56.1 | 53.7 | 51.7 | 49.1 |
| Italy | 74.6 | 43.7 | 56.6 | 50.5 | 36.7 | 42.3 | 35.9 |
| Japan | 89.3 | 47.3 | 60 | 64.3 | 57.1 | 46.4 | 37.2 |
| The UK | 86.1 | 58 | 60.3 | 74.4 | 51 | 54.4 | 52.7 |
| The US | 88.9 | 56.3 | 54.7 | 81.4 | 62.8 | 56.8 | 47.7 |
Source: Global Global Innovation Index (2020).
4.1Obtaining the Weight Values
To extract the relative importance of criteria, as mentioned above, we tackle the MEREC method, which is an objective weighting method introduced very recently.
After obtaining the normalized decision matrix via Eq. (A.1), we find the overall performances of alternatives in Step 3 through Eq. (A.2). For example,
Overall performances of the rest of the alternatives are 0.1736, 0.2086, 0.0196, 0.1665, 0.2491, and 0.2653, respectively. Using Eq. (A.3), we compute the overall performances of alternatives by removing each criterion.
All calculations are conducted in a similar way. Utilizing Eq. (A.4), we determine the removal effect of each criterion on the alternatives’ overall performance.
The removal effect of each criterion on the rest of the alternatives’ overall performance is calculated as 0.1610, 0.0590, 0.2145, 0.2760, 0.1615, and 0.1625.
Applying Eq. (A.5), we find the weights of the criteria. For instance, the weight of the first criterion is:
As a result, the relative importance of criteria (indicators) is demonstrated in Table 2 and illustrated in Fig. 2.
Table 2
The weight coefficients of innovation indicators.
| Criteria | |||||||
| Institutions | Human capital and research | Infrastructure | Market sophistication | Business sophistication | Knowledge and technology outputs | Creative outputs | |
| w | 0.0957 | 0.1407 | 0.0516 | 0.1875 | 0.2412 | 0.1412 | 0.1421 |
Fig. 2
The radar chart of the indicators’ weights.
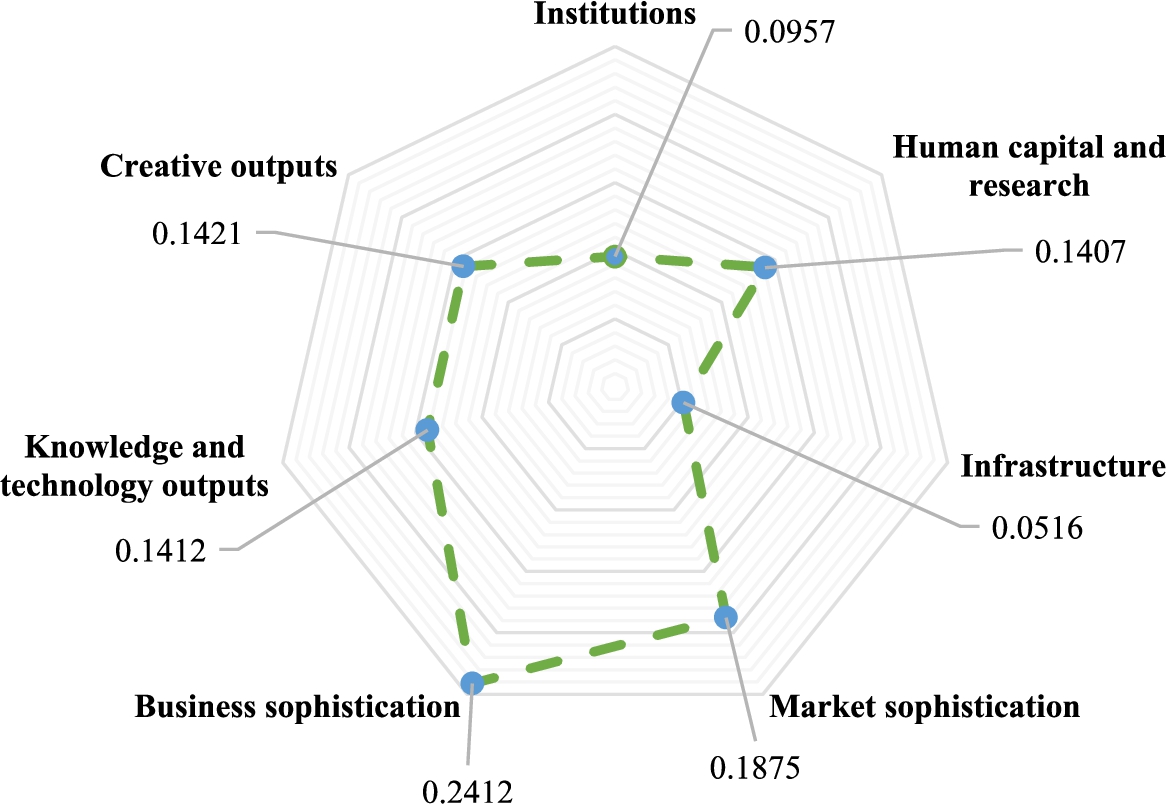
Concerning the MEREC method’s results, business sophistication is the most significant indicator for determining the innovative level of G7 countries, followed by market sophistication and creative outputs. These weights calculated are utilized in the calculations of the ranking methods in the next sub-section.
4.2Deciding the Ranking Order of Countries
Undoubtedly, deciding the appropriate MCDM method is a key matter to solve challenging real-world problems. Because each method has its own characteristics, the results extracted may differ. Such an undesirable situation reduces confidence in the results. Accordingly, numerous researchers recommend merging the ranking results from various MCDM methods (Dortaj et al., 2020; Varmazyar et al., 2016).
4.2.1Obtaining Ranking Outcomes from Several MCDM Methods
To derive the final alternative ranking, six powerful MCDM methods (MABAC, CoCoSo, MAIRCA, MARCOS, WASPAS, and CODAS) are first used in this section. By MS Excel, the methods are solved.
Thereby, the results of Table 3 are gathered. Clearly, the rankings obtained by the six methods are not the same, although the rankings for MABAC and MAIRCA, as well as MARCOS and WASPAS, are similar. Thus, these priority techniques produce dissimilar ranking results. Nevertheless, the results of all methods highlight that the top three innovative countries are the US, the UK, and Germany, respectively. Further, Italy is in the last place according to all methods. The ranking of the remaining countries varies as per the methods handled. Consequently, there is a need to achieve an agreeable ranking. Hence, the Borda rule is also applied in this sub-section.
Table 3
Ranking outcomes of MCDM methods.
| MABAC | MAIRCA | MARCOS | CoCoSo | WASPAS | CODAS | |||||||
| Rank | Rank | Rank | Rank | Rank | Rank | |||||||
| Canada | −0.0173 | 6 | 0.0721 | 6 | 0.6606 | 4 | 6.8112 | 6 | 0.8380 | 4 | −0.0050 | 5 |
| France | −0.0049 | 5 | 0.0704 | 5 | 0.6561 | 6 | 7.4074 | 4 | 0.8336 | 6 | −0.0233 | 6 |
| Germany | 0.1277 | 3 | 0.0514 | 3 | 0.6885 | 3 | 8.4864 | 3 | 0.8733 | 3 | −0.0002 | 3 |
| Italy | −0.4624 | 7 | 0.1357 | 7 | 0.5400 | 7 | 2.0740 | 7 | 0.6843 | 7 | −0.0586 | 7 |
| Japan | −0.0021 | 4 | 0.0700 | 4 | 0.6583 | 5 | 7.3873 | 5 | 0.8356 | 5 | −0.0043 | 4 |
| The UK | 0.2669 | 2 | 0.0316 | 2 | 0.7235 | 2 | 9.6263 | 2 | 0.9198 | 2 | 0.0166 | 2 |
| The US | 0.3574 | 1 | 0.0186 | 1 | 0.7614 | 1 | 10.3368 | 1 | 0.9689 | 1 | 0.0749 | 1 |
4.2.2Achieving Overall Ranking for Alternatives
Though robust and famous MCDM methods can be performed in a challenging problem, the ranking outcomes may not be the same. So, decision-makers are conflicted between unlike rankings when making the final decision. Fortunately, the Borda rule, as a useful and effective ranking strategy, offers aid in dealing with such situations. In other words, the Borda rule may be a beneficial vehicle to lead the decision problem to a single result by merging the different ranking results (Ecer, 2021). To make a more reliable decision, therefore, this work both determines the innovation levels of countries with the six MCDM methods and combines the ranking results obtained from these methods. Since each MCDM method has the potential to produce its own ranking result, the Borda rule offers a valuable response for innovation assessment. In a nutshell, it is performed to increase the reliability of both the evaluation process and the overall ranking. In this work, as a result, the rankings gathered by six methods of MABAC, CoCoSo, MAIRCA, MARCOS, WASPAS, and CODAS are merged with the Borda rule. Ultimately, the developed approach is prone to help authorities make reliable decisions in assessing the innovativeness of countries or cities.
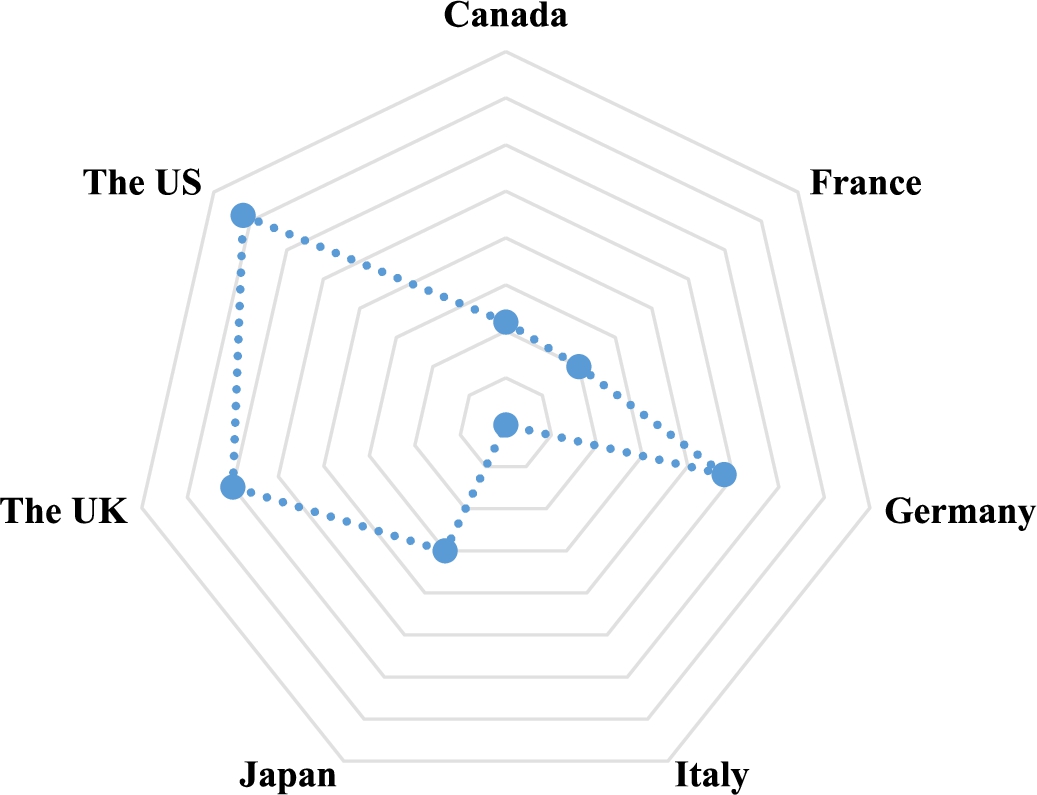
Eventually, Table 4 presents the outcomes of the Borda rule. Taking both the ranking outcomes of Table 3 and the Borda rule into consideration, the overall ranking of countries may be obtained. As per the final results displayed in Fig. 3, G7 countries are ranked from the most innovative to the least innovative as the US, the UK, Germany, Japan, Canada, France, and Italy. The reason behind being the most innovative country of the US among the G7 countries could be that it is the country with the best position in three of seven indicators (business sophistication, market sophistication, and knowledge and technology outputs). More interestingly, these three indicators are the first, second, and fourth indicators of the most importance.
Table 4
Results of the Borda rule.
| Total | Final rank | |
| Canada | 11 | 5 |
| France | 10 | 6 |
| Germany | 24 | 3 |
| Italy | 0 | 7 |
| Japan | 15 | 4 |
| The UK | 30 | 2 |
| The US | 36 | 1 |
Fig. 3
Final ranking of G7 countries.
4.3Sensitivity Analysis
A sensitivity analysis can ensure experts to validate the outcomes by some changes in the essential model and clarify the robustness of the proposed methodology (Böyükaslan and Ecer, 2021). For this purpose, a two-stage sensitivity analysis is realized in this paper: (i) the effect of changing criteria weights on the overall ranking, (ii) comparing ranking results obtained by a combination of well-known MCDM methods.
4.3.1Changing the Initial Criteria Weights
This sub-section is performed to analyse the effect of the various criteria weight values on the rank of the alternatives. Consequently, several criteria weights are determined for eight different scenarios. Each scenario are highlighted by
Table 5
Combination of weights for different scenarios.
| Scenario | Weights | Ranking using the Borda rule |
Fig. 4
Ranking of the alternatives for each scenario.
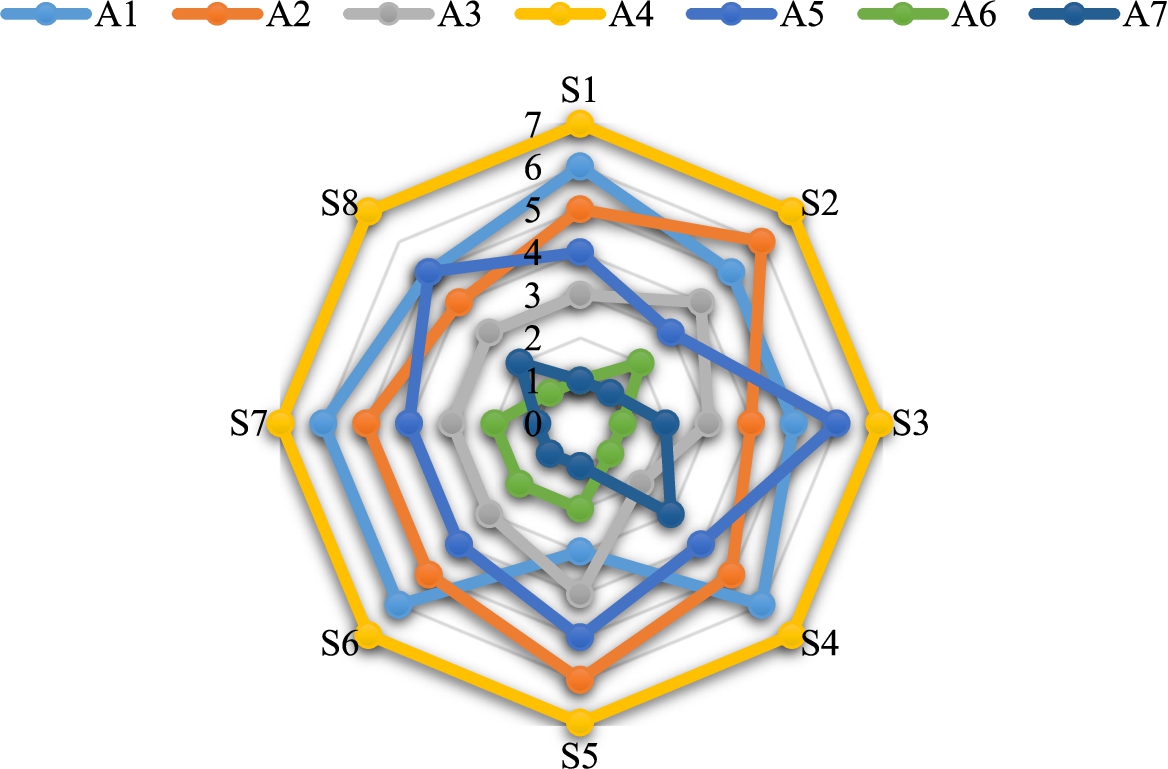
Results indicate that determining various weights to the evaluation criteria reveals dissimilar rankings, i.e. the proposed framework is sensitive to these weight values. When all the rankings in Table 5 are examined, the following can be decided: the alternative
4.3.2Comparison with Outcomes Achieved by Other MCDM Techniques
The other stage of sensitivity control is the comparison of the ranking obtained with the proposed methodology with the ranking provided from robust MCDM techniques including COPRAS, TOPSIS, ARAS, EDAS, and MOORA. The results of these techniques are shown in Table 6. Although the rankings obtained by the five techniques are not the same as the rankings of the introduced framework, the top three innovative countries are the US, the UK, and Germany, non-sequentially. Similarly, Italy is in the last place according to all the methods.
Table 6
Ranking outcomes of the other MCDM methods.
| COPRAS | TOPSIS | ARAS | EDAS | MOORA | ||||||
| Rank | Rank | Rank | ASi | Rank | Rank | |||||
| Canada | 86.55 | 4 | 0.1058 | 5 | 0.8397 | 4 | 0.5340 | 5 | 0.3699 | 4 |
| France | 85.80 | 6 | 0.7642 | 4 | 0.8327 | 6 | 0.4197 | 6 | 0.3668 | 6 |
| Germany | 90.03 | 3 | 0.9308 | 2 | 0.8738 | 3 | 0.5679 | 3 | 0.3849 | 3 |
| Italy | 70.44 | 7 | 0.0000 | 7 | 0.6839 | 7 | 0.000 | 7 | 0.3012 | 7 |
| Japan | 86.17 | 5 | 0.0070 | 6 | 0.8362 | 5 | 0.5431 | 4 | 0.3683 | 5 |
| The UK | 94.79 | 2 | 1.0000 | 1 | 0.9197 | 2 | 0.7072 | 2 | 0.4052 | 2 |
| The US | 100.00 | 1 | 0.8478 | 3 | 0.9699 | 1 | 0.9933 | 1 | 0.4273 | 1 |
To aggregate the ranking results of these methods used in sensitivity analysis, the Borda rule is also applied once again. Finally, Table 7 presents the outcomes of the Borda rule in terms of the methods used in sensitivity analysis.
Table 7
Final rankings as per the sensitivity analysis.
| Total | Final rank | |
| Canada | 13 | 4 |
| France | 7 | 6 |
| Germany | 21 | 3 |
| Italy | 0 | 7 |
| Japan | 10 | 5 |
| The UK | 26 | 2 |
| The US | 28 | 1 |
As per the final results of Borda rule, G7 countries are ranked from the most innovative to the least innovative as the US, the UK, Germany, Canada, Japan, France, and Italy. Finally, Spearman’s correlation coefficient (SCC) is handled to decide the statistical correlation between the ranks provided by the results of the Borda rule, as shown in Table 8. The findings of the benchmarking of the Borda ranks by considering SCC show that there is a high and significant correlation between the Borda rule rankings. Finally, it is possible to conclude that the provided ranking is approved and dependable.
Table 8
Results of the SCC.
| Borda rule (sensitivity analysis) | ||
| Borda rule (proposed model) | Spearman’s correlation coefficient | 0.927 |
| n | 7 | |
5Discussion, Political Implications, and Recommendations
Now that innovation evaluations are a concept that includes many activities and can be examined from several perspectives, it has a highly complex nature. In the information age we live in, it is not difficult to access such data. Nonetheless, this vast amount of information can merely be meaningful provided that it is brought together in a scientific framework like MCDM. Suggesting paths to apply MCDM terminology to countries’ innovation processes could be of considerable interest to policymakers, practitioners, and researchers. On the one hand, for economic development this has the potential to form better paths for countries to answer to their progressively competitive environment around the world. Thereby, assisting the innovation process with MCDM could produce valuable information for countries by increasing the reliability and validity of evaluation innovation activities. The viable potential of MCDM in the innovation field is further supported by the decision-making area where significant and rapid shifts are taking place. This notwithstanding, the number of innovation studies performed through MCDM is still quite low. Based on the above discussion, this work aims to fill the gap by offering a consolidated MCDM methodology to measure the innovation level of G7 countries.
Crises like the COVID-19 outbreak are frequently a source of innovation and sometimes industrial regeneration. For example, the French government has committed to a 25% increase in its R&D budget. German authorities have announced a massive 50 billion Euro stimulus package for promising technologies. Likewise, the US government plans to spend huge additional amounts of stimulus money to boost innovation (Dutta et al., 2020). For years, as in this paper’s findings, the US and Germany have had potent and stable innovation systems. The US is particularly prominent in terms of “market sophistication” and “business sophistication” pillars. Such strengths pave the way for it to take the first place. Despite being positioned first in the ranking list, this country is not at the desired level regarding “infrastructure.” Improvements to be made in the field of environmental sustainability can contribute to the strengthening of this aspect. “Human capital & research” is the most influential component in Germany’s innovation performance. The undeniable support of enterprise resources to education in Germany plays a significant role in strengthening this aspect. It can be recommended that Germany, which is fragile in terms of “market sophistication,” should increase technological investments and facilitate access to credit. In recent years, the UK has been developing the “infrastructure,” “market sophistication,” and “creative outputs” aspects. In this way, it has achieved to become the second most innovative country in the overall ranking. Nonetheless, “institutions” draw attention as the weak point of the country. This pillar can be strengthened if the business, regulatory, and political environment improves. As it is well-known, universities play a vital role in innovation systems. Canada’s world-renowned universities are one of the key factors that boost the innovation level of this country. It would not be wrong to make a similar conclusion for the UK. Like the US, Canada is as well unsuccessful in terms of “infrastructure.” In addition to environmental sustainability, arrangements in information and communication technologies can strengthen this aspect. Although it is successful in terms of R&D, Japan is not successful in terms of “human capital & research” compared to other innovative countries. Further, Japan could be a more innovative country if it also improves its “creative outputs” aspect. France gives incentives for companies to close the innovation finance gap. Moreover, it provided significant increases in its R&D budget. Yet, France’s “business sophistication” aspect is the weakest among other innovation aspects. To overcome this, various strategies such as increasing university/industry collaborations, boosting knowledge-intensive employment, etc., can be suggested. Italy, which is relatively better in terms of “knowledge & technology outputs,” is especially weak in “market sophistication.” In this context, both the ease of obtaining loans and the protection of minority investors can be ensured.
6Conclusion
In this paper, a collection of quantitative indicators from GII is handled to provide rankings of innovation levels for G7 countries. The proposed model is performed on a real case study and the innovation capability of these countries is assessed. In other words, this paper evaluates and ranks the countries from an innovation perspective via a novel MCDM-based assessment methodology. The introduced methodology covers seven innovation indicators. Further, the importance weights of these factors are gained by the MEREC method. Since different MCDM methods may produce varying results due to their characteristics, we examined the applicability of six MCDM techniques (CODAS, MABAC, MARCOS, CoCoSo, WASPAS, and MAIRCA), including various categories of MCDM techniques. Accordingly, the ranking values obtained from these techniques are then aggregated by the Borda rule to make a credible final ranking. To verify this methodology, G7 countries are evaluated utilizing available data gathered from GII. Afterward, a sensitivity check is achieved to prove the stability and reliability of this proposed framework. Findings demonstrated that business sophistication is vital in determining the innovation level of countries. Further, the US is the most innovative country among G7 countries, as changing the MCDM methods considered does not affect the position of this country in the ranking. By the way, Italy showed a bad performance as per all techniques and the Borda rule.
The introduced methodology is an effort to ensure a reliable decision support system to evaluate the innovation capability of countries. The outcomes of such evaluation can give policymakers and authorities an idea of how to improve innovation level considering their weaknesses. To put it differently, innovation capacities can be increased by focusing on the weaknesses of the country.
Naturally, this work has some limitations. The number of evaluation criteria may be insufficient to determine the actual ranking of countries. Analyses can be made with the addition of new criteria in the future. In addition, this study used only the MEREC method in determining the criterion weights. Therefore, other objective methods can support the analysis to reach more reliable results. Lastly, the fact that only G7 countries are considered as case studies in this study can be seen as a limitation. Future studies may focus on different country associations such as OPEC, European Union, and MENA.
Funding No funding.
Availability of data and material Not applicable.
Code availability Not applicable.
Declarations conflict of interest The authors declare no conflicts of interest.
Appendices
A
AThe preliminaries
A.1MEREC
Step 1: Developing the decision matrix (X) with n alternatives and m criteria.
Step 2: Developing the normalized decision matrix by using Eq. (A.1):
(A.1)
(A.2)
(A.3)
(A.4)
(A.5)
A.2CODAS
Step 1: Constructing the decision matrix
(A.6)
(A.7)
(A.8)
(A.9)
Step 4: Determining the negative-ideal solution (NIS) point by using Eq. (A.10):
(A.10)
The Euclidean and Taxicab distances of alternatives from the NIS are calculated by using Eqs. (A.11)–(A.12), respectively.
(A.11)
(A.12)
(A.13)
(A.14)
(A.15)
Step 7: Calculating the assessment scores by using Eq. (A.16):
(A.16)
A.3MABAC
Step 1: Constructing the decision matrix
(A.18)
(A.19)
Step 3: Calculating the weighted decision matrix by using Eq. (A.20):
(A.20)
Step 4: Calculating the elements of the border approximation area matrix
(A.21)
(A.22)
(A.23)
(A.24)
(A.25)
Step 7: The final values of the criteria functions (
(A.26)
A.4MARCOS
Step 1: Constructing the decision matrix
Step 2: Creating the extended initial decision matrix by defining ideal (AI) and anti-ideal (AAI) solutions as shown in Eq. (A.27):
(A.27)
(A.28)
(A.29)
(A.30)
(A.31)
(A.32)
(A.33)
(A.34)
(A.35)
(A.36)
(A.37)
(A.38)
A.5MAIRCA
Step 1: Constructing the decision matrix
(A.40)
(A.41)
(A.42)
(A.43)
(A.44)
(A.45)
(A.46)
(A.47)
(A.48)
A.6CoCoSo
Step 1: Constructing the decision matrix
(A.49)
(A.50)
(A.51)
(A.52)
(A.53)
(A.54)
(A.55)
(A.56)
Step 5: Ranking the alternatives based on the final values of the alternatives by using Eq. (A.57):
(A.57)
A.7Borda Rule
Step 1: Grade the alternatives.
First, the ranking strategy gives
Step 2: Get the Borda score.
By summing up the scores obtained in Step 1, the Borda scores of alternatives are computed.
Step 3: Rank the alternatives.
To highlight the best alternative, the alternatives are ranked in descending order of their scores.
A.8WASPAS
Step 1: Forming the decision matrix
(A.58)
(A.59)
(A.60)
(A.61)
(A.62)
(A.63)
(A.64)
References
1 | Ayçin, E., Çakin, E. ((2019) ). Ülkelerin inovasyon performanslarının ölçümünde Entropi ve MABAC çok kriterli karar verme yöntemlerinin bütünleşik olarak kullanılması. Akdeniz İİ BF Dergisi, 19: (2), 326–351 (in Turkish). |
2 | Badi, I., Ballem, M., Shetwan, A. ((2018) ). Site selection of desalination plant in Libya by using combinative distance-based assessment (CODAS) method. International Journal for Quality Research, 12: (3), 609–624. |
3 | Banu, G.S. ((2018) ). Measuring innovation using key performance indicators. Procedia Manufacturing, 22: , 906–911. |
4 | Becheikh, N., Landry, R., Amara, N. ((2006) ). Lessons from innovation empirical studies in the manufacturing sector: a systematic review of the literature from 1993–2003. Technovation, 26: (5–6), 644–664. |
5 | Blažek, J., Kadlec, V. ((2019) ). Knowledge bases, R&D structure and socio-economic and innovation performance of European regions. Innovation: The European Journal of Social Science Research, 32: (1), 26–47. |
6 | Bloch, C., Bugge, M.M. ((2013) ). Public sector innovation—from theory to measurement. Structural Change and Economic Dynamics, 27: , 133–145. |
7 | Böyükaslan, A., Ecer, F. ((2021) ). Determination of drivers for investing in cryptocurrencies through a fuzzy full consistency method-Bonferroni (FUCOM-F’B) framework. Technology in Society, 67: , 101745. |
8 | Brenner, T., Broekel, T. ((2011) ). Methodological issues in measuring innovation performance of spatial units. Industry and Innovation, 18: (1), 7–37. |
9 | Capello, R., Lenzi, C. ((2013) ). Territorial patterns of innovation: a taxonomy of innovative regions in Europe. The Annals of Regional Science, 51: (1), 119–154. |
10 | Chakraborty, S., Zavadskas, E.K. ((2014) ). Applications of WASPAS method in manufacturing decision making. Informatica, 25: (1), 1–20. |
11 | Chakraborty, S., Zavadskas, E.K., Antucheviciene, J. ((2015) ). Applications of WASPAS method as a multi-criteria decision-making tool. Economic Computation and Economic Cybernetics Studies and Research, 49: (1), 5–22. |
12 | Cirera, X., Muzi, S. ((2020) ). Measuring innovation using firm-level surveys: evidence from developing countries. Research Policy, 49: (3), 103912. |
13 | Cooper, R.G. ((1999) ). From experience: the invisible success factors in product innovation. Journal of Product Innovation Management, 16: (2), 115–133. |
14 | De Borda ((1781) ). Mémoire sur les élections au scrutin. Histoire de L’Académie Royale des Sciences, 102: , 657–665. |
15 | do Carmo Silva, M., Gavião, L.O., Gomes, C.F.S., Lima, G.B.A. ((2017) ). A proposal for the application of multicriteria analysis to rank countries according to innovation using the indicators provided by the World Intellectual Property Organization. RAI Revista de Administração e Inovação, 14: (3), 188–198. |
16 | do Carmo Silva, M., Lima, G.B.A., Gomes, C.F.S., Rangel, L.A.D., Caiado, R.G.G. ((2019) ). A SMARTS-Choquet’s approach for multicriteria decision aid applied to the innovation indexes in sustainability dimensions. Soft Computing, 23: (16), 7117–7133. |
17 | Dorfeshan, Y., Mousavi, S.M. ((2020) ). A novel interval type-2 fuzzy decision model based on two new versions of relative preference relation-based MABAC and WASPAS methods with an application in aircraft maintenance planning. Neural Computing and Applications, 32: (8), 3367–3385. |
18 | Dortaj, A., Maghsoudy, S., Ardejani, F.D., Eskandari, Z. ((2020) ). A hybrid multi-criteria decision making method for site selection of subsurface dams in semi-arid region of Iran. Groundwater for Sustainable Development, 10: , 100284. |
19 | Dutta, S., Lanvin, B., Wunsch-Vincent, S. (Eds.) ((2020) ). Global Innovation Index 2020: Who Will Finance Innovation? Cornell University. |
20 | Dziallas, M., Blind, K. ((2019) ). Innovation indicators throughout the innovation process: an extensive literature analysis. Technovation, 80: , 3–29. |
21 | Ecer, F. ((2021) ). A consolidated MCDM framework for performance assessment of battery electric vehicles based on ranking strategies. Renewable and Sustainable Energy Reviews, 143: , 110916. |
22 | Ecer, F. ((2022) ). An extended MAIRCA method using intuitionistic fuzzy sets for coronavirus vaccine selection in the age of COVID-19. Neural Computing and Applications, 34: (7), 5603–5623. |
23 | Ecer, F., Hashemkhani Zolfani, S. ((2022) ). Evaluating economic freedom via multi-criteria MEREC-DNMA model: case of OPEC countries. Technological and Economic Development of Economy, 28: (4), 1158–1181. |
24 | Ecer, F., Pamucar, D. ((2021) ). MARCOS technique under intuitionistic fuzzy environment for determining the COVID-19 pandemic performance of insurance companies in terms of healthcare services. Applied Soft Computing, 104: , 107199. |
25 | Ecer, F., Pamucar, D. ((2022) ). A novel LOPCOW-DOBI multi-criteria sustainability performance assessment methodology: an application in developing country banking sector. Omega, 112: , 102690. |
26 | Ecer, F., Pamucar, D., Zolfani, S.H., Eshkalag, M.K. ((2019) ). Sustainability assessment of OPEC countries: application of a multiple attribute decision making tool. Journal of Cleaner Production, 241: , 118324. |
27 | Ecer, F., Pamucar, D., Mardani, A., Alrasheedi, M. ((2021) ). Assessment of renewable energy resources using new interval rough number extension of the level based weight assessment and combinative distance-based assessment. Renewable Energy, 170: , 1156–1177. |
28 | Ecer, F., Böyükaslan, A., Hashemkhani Zolfani, S. ((2022) ). Evaluation of cryptocurrencies for investment decisions in the era of Industry 4.0: a borda count-based intuitionistic fuzzy set extensions EDAS-MAIRCA-MARCOS multi-criteria methodology. Axioms, 11: (8), 404. |
29 | European Innovation Scoreboard (2021). https://ec.europa.eu/growth/industry/policy/innovation/scoreboards_en. |
30 | Feeny, S., Rogers, M. ((2003) ). Innovation and performance: benchmarking Australian firms. Australian Economic Review, 36: (3), 253–264. |
31 | Furková, A. ((2022) ). Implementation of MGWR-SAR models for investigating a local particularity of European regional innovation processes. Central European Journal of Operations Research, 30: , 733–755. |
32 | Garcia-Bernabeu, A., Cabello, J.M., Ruiz, F. ((2020) ). A multi-criteria reference point based approach for assessing regional innovation performance in Spain. Mathematics, 8: (5), 797. |
33 | Gigović, L., Pamučar, D., Bajić, Z., Milićević, M. ((2016) ). The combination of expert judgment and GIS-MAIRCA analysis for the selection of sites for ammunition depot. Sustainability, 8: (4), 1–30. |
34 | Gigović, L., Pamučar, D., Božanić, D., Ljubojević, S. ((2017) ). Application of the GIS-DANP-MABAC multi-criteria model for selecting the location of wind farms: a case study of Vojvodina, Serbia. Renewable Energy, 103: , 501–521. |
35 | Global Innovation Index (2020). https://www.globalinnovationindex.org/home. |
36 | Grupp, H., Schubert, T. ((2010) ). Review and new evidence on composite innovation indicators for evaluating national performance. Research Policy, 39: (1), 67–78. |
37 | Gül, S., Aydoğdu, A. ((2021) ). Novel entropy measure definitions and their uses in a modified combinative distance-based assessment (CODAS) method under picture fuzzy environment. Informatica, 32: (4), 759–794. |
38 | Haefner, N., Wincent, J., Parida, V., Gassmann, O. ((2021) ). Artificial intelligence and innovation management: a review, framework, and research agenda. Technological Forecasting and Social Change, 162: , 120392. |
39 | Hagedoorn, J., Cloodt, M. ((2003) ). Measuring innovative performance: is there an advantage in using multiple indicators. Research Policy, 32: , 1365–1379. |
40 | Hájek, P., Stříteská, M., Prokop, V. ((2018) ). Integrating balanced scorecard and fuzzy TOPSIS for innovation performance evaluation. In: Twenty-Second Pacific Asia Conference on Information Systems, Japan 2018. https://www.worldbank.org/en/home. (Accessed at 31.01.2022). |
41 | Huang, H., Wang, F., Song, M., Balezentis, T., Streimikiene, D. ((2021) ). Green innovations for sustainable development of China: analysis based on the nested spatial panel models. Technology in Society, 65: , 101593. |
42 | Ivanov, C.I., Avasilcăi, S. ((2014) ). Performance measurement models: an analysis for measuring innovation processes performance. Procedia-Social and Behavioral Sciences, 124: , 397–404. |
43 | İnel, M.N., Türker, M.V. ((2016) ). Ulusal inovasyon performansının ölçümü için çok nitelikli karar verme teknikleri ile bir model denemesi. Marmara Üniversitesi İktisadi ve İdari Bilimler Dergisi, 38: (2), 147–166. |
44 | Jungmittag, A. ((2004) ). Innovations, technological specialisation and economic growth in the EU. International, Economics and Economic Policy, 1: , 247–273. |
45 | Kayapınar Kaya, S., Ayçin, E., Pamucar, D. (2022). Evaluation of social factors within the circular economy concept for European countries. Central European Journal of Operations Research, 1–36. |
46 | Keshavarz Ghorabaee, M., Zavadskas, E.K., Turskis, Z., Antucheviciene, J. ((2016) ). A new combinative distance-based assessment (CODAS) method for multi-criteria decision-making. Economic Computation & Economic Cybernetics Studies & Research, 50: (3), 25–44. |
47 | Keshavarz-Ghorabaee, M., Amiri, M., Zavadskas, E.K., Turskis, Z., Antucheviciene, J. ((2021) ). Determination of objective weights using a new method based on the removal effects of criteria (MEREC). Symmetry, 13: (4), 525. |
48 | Kim, M.J., Lee, C.K., Preis, M.W. ((2020) ). The impact of innovation and gratification on authentic experience, subjective well-being, and behavioral intention in tourism virtual reality: the moderating role of technology readiness. Telematics and Informatics, 49: , 101349. |
49 | Konings, R., Louw, E. ((2014) ). Innovation performance of the transport sector at regional level. In: International Conference on Traffic and Transport Engineering, 27–28 November, Belgrade. |
50 | Kumar, S., Haleem, A., Sushil ((2019) ). Assessing innovativeness of manufacturing firms using an intuitionistic fuzzy based MCDM framework. Benchmarking: An International Journal, 26: (6), 1823–1844. |
51 | Kumar, V., Kalita, K., Chatterjee, P., Zavadskas, E.K., Chakraborty, S. ((2022) ). A SWARA-CoCoSo-based approach for spray painting robot selection. Informatica, 33: (1), 35–54. |
52 | Lai, H., Liao, H.C., Wen, Z., Zavadskas, E.K., Al-Barakati, A. ((2020) ). An improved CoCoSo method with a maximum variance optimization model for cloud service provider selection. Inzinerine Ekonomika-Engineering Economics, 31: (4), 411–424. |
53 | Ligardo-Herrera, I., Gómez-Navarro, T., Gonzalez-Urango, H. ((2019) ). Application of the ANP to the prioritization of project stakeholders in the context of responsible research and innovation. Central European Journal of Operations Research, 27: (3), 679–701. |
54 | Lu, M.T., Tzeng, G.H., Tang, L.L. ((2013) ). Environmental strategic orientations for improving green innovation performance in fuzzy environment – using new fuzzy hybrid MCDM model. International Journal of Fuzzy Systems, 15: (3), 297–316. |
55 | Mathew, M., Sahu, S. ((2018) ). Comparison of new multi-criteria decision making methods for material handling equipment selection. Management Science Letters, 8: (3), 139–150. |
56 | Mokarrari, K.R., Torabi, S.A. ((2021) ). Ranking cities based on their smartness level using MADM methods. Sustainable Cities and Society, 72: , 103030. |
57 | Navarro, M., Gibaja, J.J., Bilbao-Osorio, B., Aguado, R. ((2009) ). Patterns of innovation in EU-25 regions: a typology and policy recommendations. Environment and Planning C: Government and Policy, 27: (5), 815–840. |
58 | OECD (2005). Oslo Manual: Guidelines for Collecting and Interpreting Innovation Data (No. 4). |
59 | Özkaya, G., Timor, M., Erdin, C. ((2021) ). Science, technology and innovation policy indicators and comparisons of countries through a hybrid model of data mining and MCDM methods. Sustainability, 13: (2), 694. |
60 | Pamučar, D., Ćirović, G. ((2015) ). The selection of transport and handling resources in logistics centers using Multi-Attributive Border Approximation area Comparison (MABAC). Expert Systems with Applications, 42: (6), 3016–3028. |
61 | Pamučar, D., Mihajlović, M., Obradović, R., Atanasković, P. ((2017) ). Novel approach to group multi-criteria decision making based on interval rough numbers: hybrid DEMATEL-ANP-MAIRCA model. Expert Systems with Applications, 88: , 58–80. |
62 | Pamucar, D., Ecer, F., Deveci, M. ((2021) ). Assessment of alternative fuel vehicles for sustainable road transportation of United States using integrated fuzzy FUCOM and neutrosophic fuzzy MARCOS methodology. Science of The Total Environment, 788: , 147763. |
63 | Paredes-Frigolett, H., Pyka, A., Leoneti, A.B. ((2021) ). On the performance and strategy of innovation systems: a multicriteria group decision analysis approach. Technology in Society, 67: , 101632. |
64 | Peng, X., Zhang, X., Luo, Z. ((2019) ). Pythagorean fuzzy MCDM method based on CoCoSo and CRITIC with score function for 5G industry evaluation. Artificial Intelligence Review, 53: , 3813–3847. |
65 | Regional Innovation Scoreboard (2021). https://ec.europa.eu/growth/industry/policy/innovation/regional_en. |
66 | Roszko-Wójtowicz, E., Białek, J. ((2016) ). A multivariate approach in measuring innovation performance. Journal of Economics and Business, 34: (2), 443–479. |
67 | Schumpeter, J. ((1965) ). Les dynamiques du capitalisme, Geneva, Droz. |
68 | Smith, K. ((2005) ). Measuring innovation. In: Fagerberg, J., Mowery, D.C., Nelson, R.R. (Eds.), The Oxford Handbook of Innovation. Oxford University Press, Oxford, pp. 148–177. |
69 | Stević, Ž., Pamučar, D., Puška, A., Chatterjee, P. ((2020) ). Sustainable supplier selection in healthcare industries using a new MCDM method: measurement of alternatives and ranking according to COmpromise solution (MARCOS). Computers & Industrial Engineering, 140: , 106231. |
70 | Thompson, V.A. ((1965) ). Bureaucracy and innovation. Administrative Science Quarterly, 10: (1), 1–20. |
71 | Tokumasu, S., Watanabe, C. ((2008) ). Institutional structure leading to the similarity and disparity in innovation inducement in EU 15 countries-finnish conspicuous achievement triggered by Nokia’s IT driven global business. Journal of Services Research, 8: , 1–38. |
72 | Torkayesh, A.E., Ecer, F., Pamucar, D., Karamaşa, Ç. ((2021) ). Comparative assessment of social sustainability performance: integrated data-driven weighting system and CoCoSo model. Sustainable Cities and Society, 71: , 102975. |
73 | Varmazyar, M., Dehghanbaghi, M., Afkhami, M. ((2016) ). A novel hybrid MCDM model for performance evaluation of research and technology organizations based on BSC approach. Evaluation and Program Planning, 58: , 125–140. |
74 | Vrontis, D., Christofi, M. ((2021) ). R&D internationalization and innovation: a systematic review, integrative framework and future research directions. Journal of Business Research, 128: , 812–823. |
75 | Walker, R.M., Jeanes, E., Rowlands, R. ((2002) ). Measuring innovation–applying the literature-based innovation output indicator to public services. Public Administration, 80: (1), 201–214. |
76 | Wang, P., Wang, J., Wei, G., Wei, C., Wei, Y. ((2019) ). The multi-attributive border approximation area comparison (MABAC) for multiple attribute group decision making under 2-tuple linguistic neutrosophic environment. Informatica, 30: (4), 799–818. |
77 | Wolfe, R.A. ((1994) ). Organizational innovation: review, critique and suggested research directions. Journal of Management Studies, 31: (3), 405–431. |
78 | Yazdani, M., Zarate, P., Zavadskas, E.K., Turskis, Z. ((2019) ). A Combined Compromise Solution (CoCoSo) method for multi-criteria decision-making problems. Management Decision, 57: (9), 2501–2519. |
79 | Yu, A., Shi, Y., You, J., Zhu, J. ((2021) ). Innovation performance evaluation for high-tech companies using a dynamic network data envelopment analysis approach. European Journal of Operational Research, 292: (1), 199–212. |
80 | Zavadskas, E.K., Turskis, Z., Antucheviciene, J., Zakarevicius, A. ((2012) ). Optimization of weighted aggregated sum product assessment. Elektronika ir elektrotechnika, 122: (6), 3–6. |
81 | Zhuparova, A.S. ((2012) ). Problems of measuring effectiveness of innovation performance. International Journal of Social, Behavioral, Educational, Economic, Business and Industrial Engineering, 6: (6), 1601–1608. |
82 | Zolfani, S.H., Ecer, F., Pamučar, D., Raslanas, S. ((2020) ). Neighborhood selection for a newcomer via a novel BWM-based revised MAIRCA integrated model: a case from the Coquimbo-La Serena conurbation, Chile. International Journal of Strategic Property Management, 24: (2), 102–118. |


